Persistent inflammation during anti-tuberculosis treatment with diabetes comorbidity
- National Institutes of Health, National Institute for Research in Tuberculosis, International Center for Excellence in Research, India
- Multinational Organization Network Sponsoring Translational and Epidemiological Research (MONSTER), Fundação José Silveira, Brazil
- Instituto Gonçalo Moniz, Fundação Oswaldo Cruz, Brazil
- Faculdade de Tecnologia e Ciências, Brazil
- Prof. M. Viswanathan Diabetes Research Center, India
- Universidade Salvador, Laureate Universities, Brazil
- University of Massachusetts Medical School, United States
- National Institute for Research in Tuberculosis, India
Figures
Figure 1

Mycobacterial burden in sputum smear stratified by glycemic status.
Sputum AFB smear grade in participants with DM comorbidity (TBDM, Orange) or euglycemia (TB, Green). (A) Frequency of India cohort participants (left panel) and Brazil cohort participants (right panel) with different AFB smear grades ranging from 0 to ≥3 + . (B) Frequency of TB and TBDM participants from the combined Indian and Brazil cohorts with different AFB smear grades. Data were analyzed using Pearson’s chi-squared test.
Figure 2
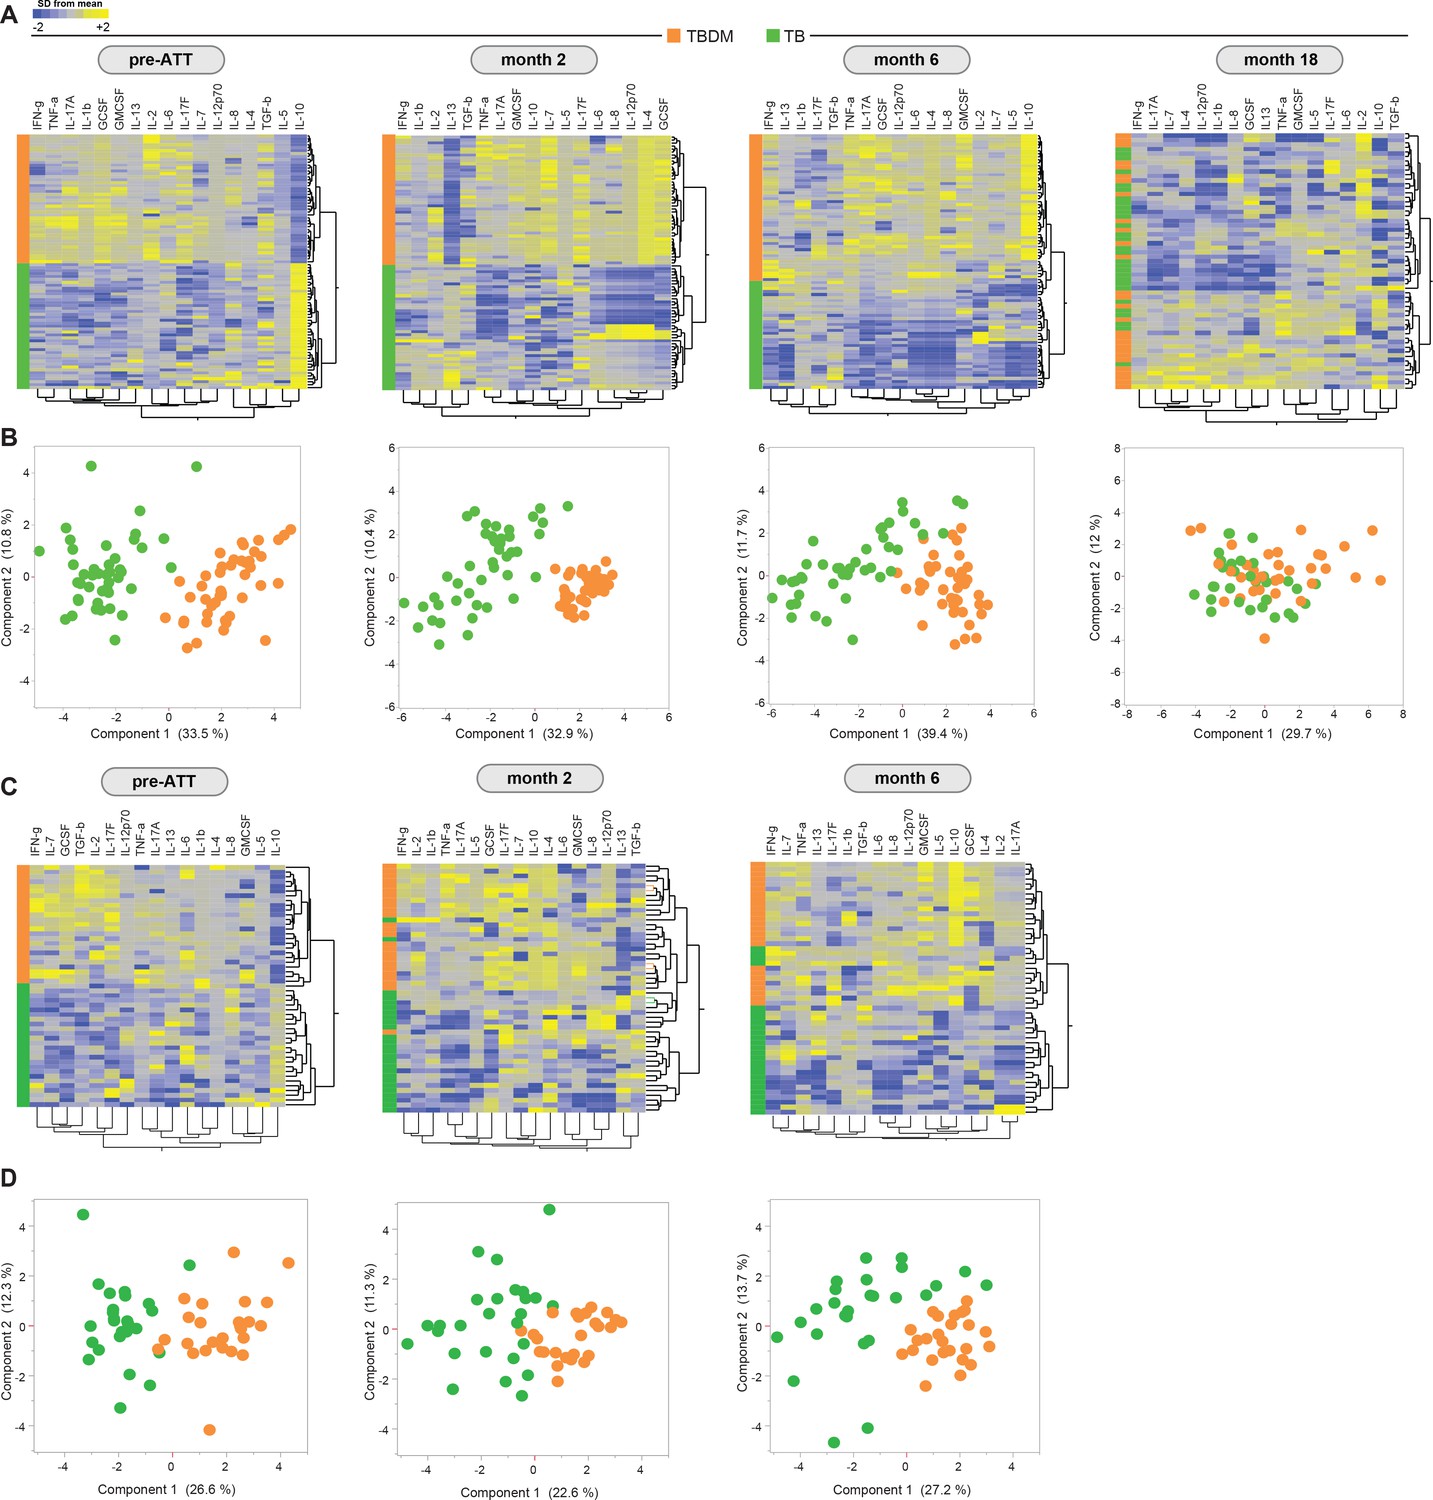
Prospective assessment of plasma biomarkers in pulmonary TB patients with or without concurrent diabetes undergoing anti-TB treatment.
Hierarchical cluster analysis (Ward’s method with 100x bootstrap) of z-score normalized, log-transformed values for each plasma analyte from the Indian and Brazil cohorts (A and C, respectively) at the indicated timepoints of antimicrobial treatment for drug-sensitive pulmonary TB. In the heatmaps, yellow color represents the highest values whereas blue color indicates the lowest values measured for each analyte. Principal component analysis was performed to show the distribution of data from the India cohort and Brazil cohorts (B and D, respectively) on simultaneous assessment of variables shown in the heatmaps.
Figure 3 with 1 supplement
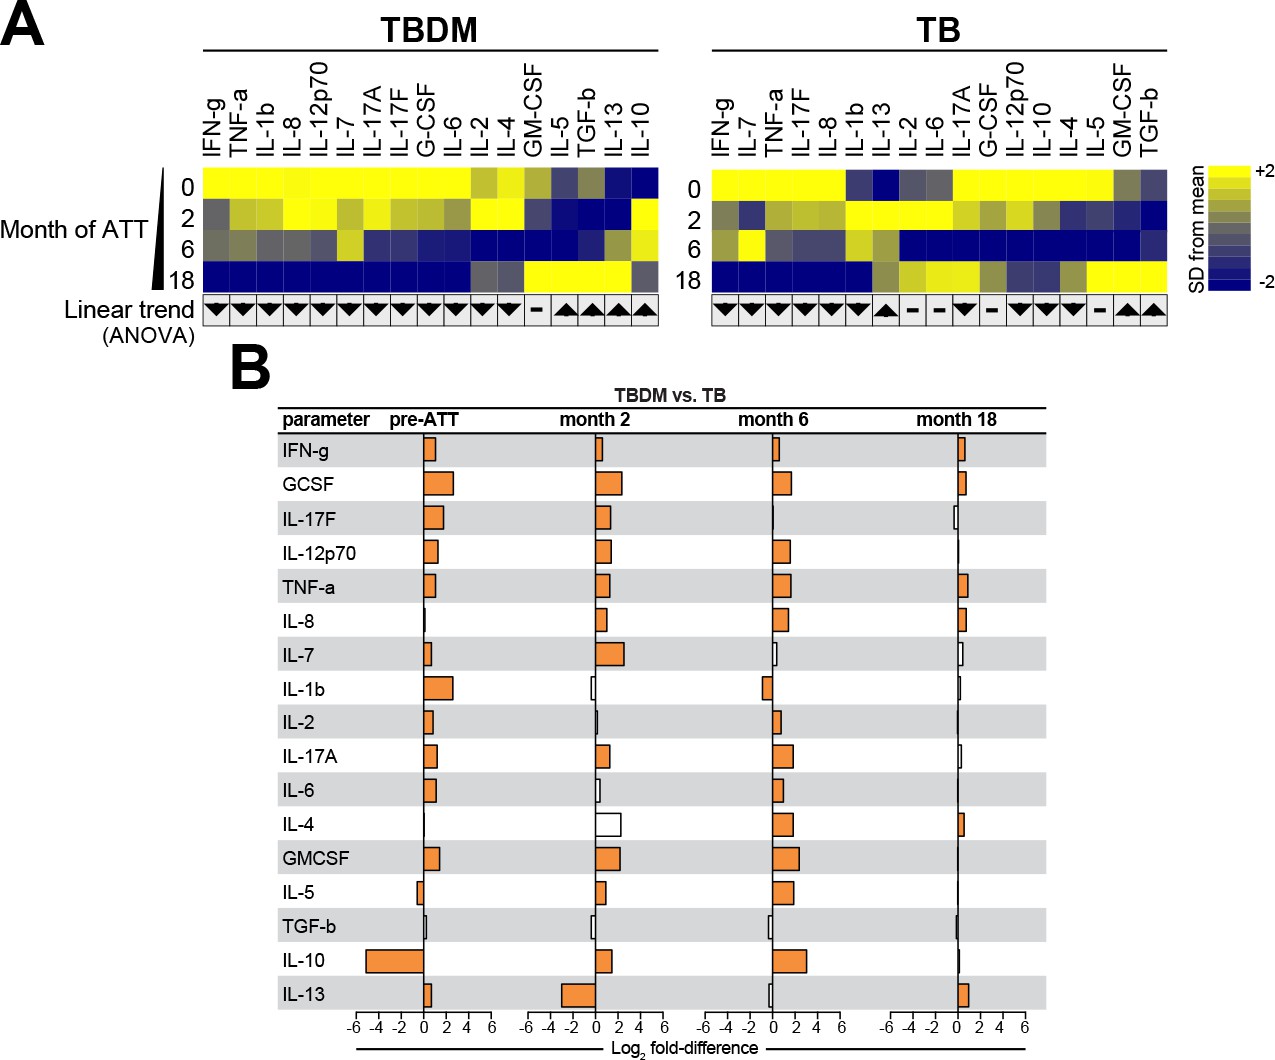
Biomarker profiles during anti-TB treatment in TBDM comorbidity from the India cohort.
(A) Mean log-transformed values for the indicated analytes were calculated and z-score normalized. Heatmaps with values from the India cohort grouped using hierarchical clustering (Ward’s method with 100x bootstrap) was used to illustrate the overall variation in plasma concentrations over time. In addition, one-way ANOVA with linear trans ad hoc test was used to test the direction of variation in each analyte’s concentration between study timepoints. Direction of the arrows highlight statistically significant trends, while “- “denotes differences with P values ≥ 0.05. (B) Mean fold-difference of analyte levels between the TBDM and TB groups in the India cohort. Orange bars indicated statistically significant differences (p<0.05).
Figure 3—figure supplement 1
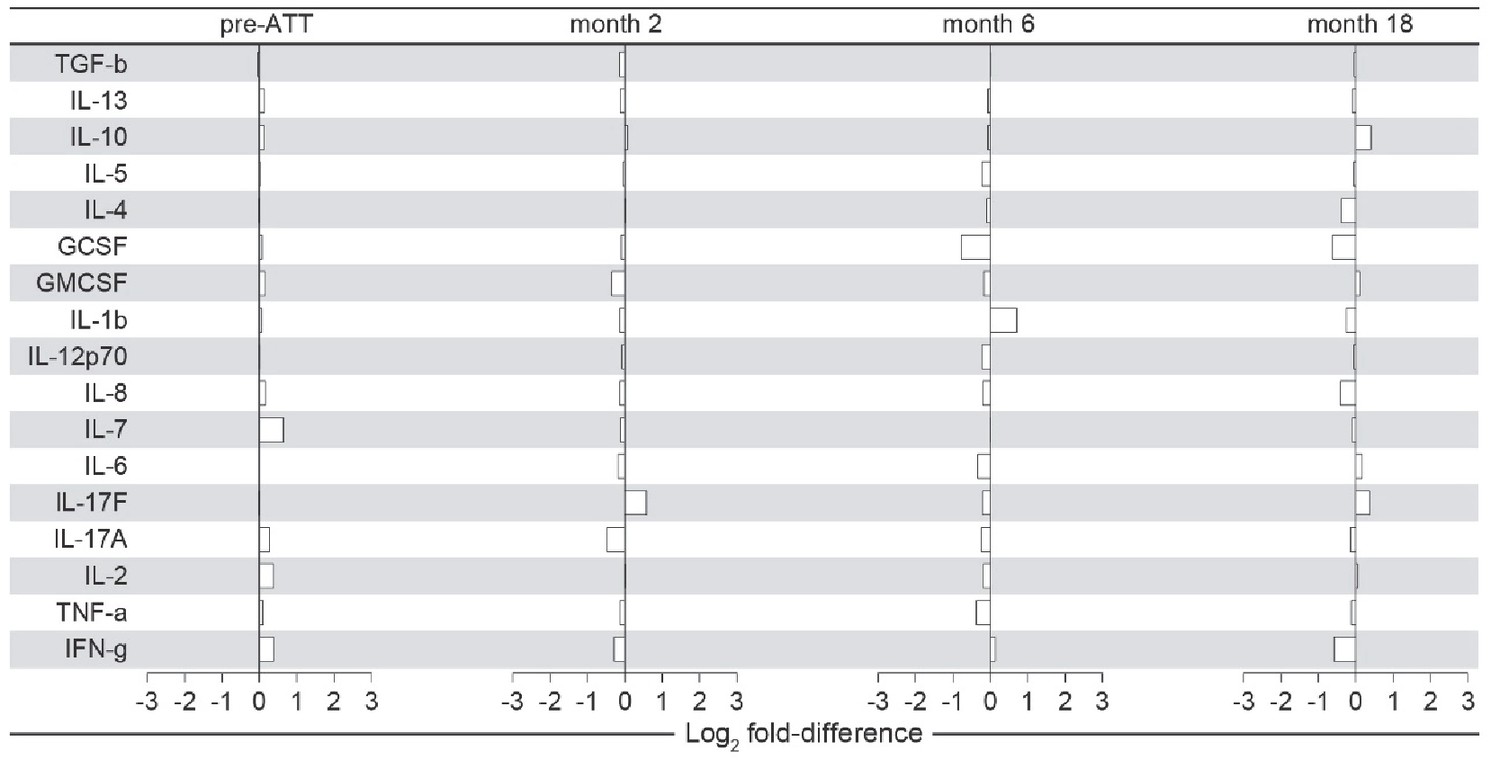
Biomarker profiles in India cohort TBDM participants with KDM vs NDM at enrollment.
Mean fold-differences at each timepoint are compare participants with known DM diagnosis prior to enrollment (KDM) vs those newly diagnosed with DM at enrollment (NDM). Comparisons were analyzed using the Mann-Whitney U test and adjusted for multiple comparisons. There were no statistically significant differences between the two groups.
Figure 4
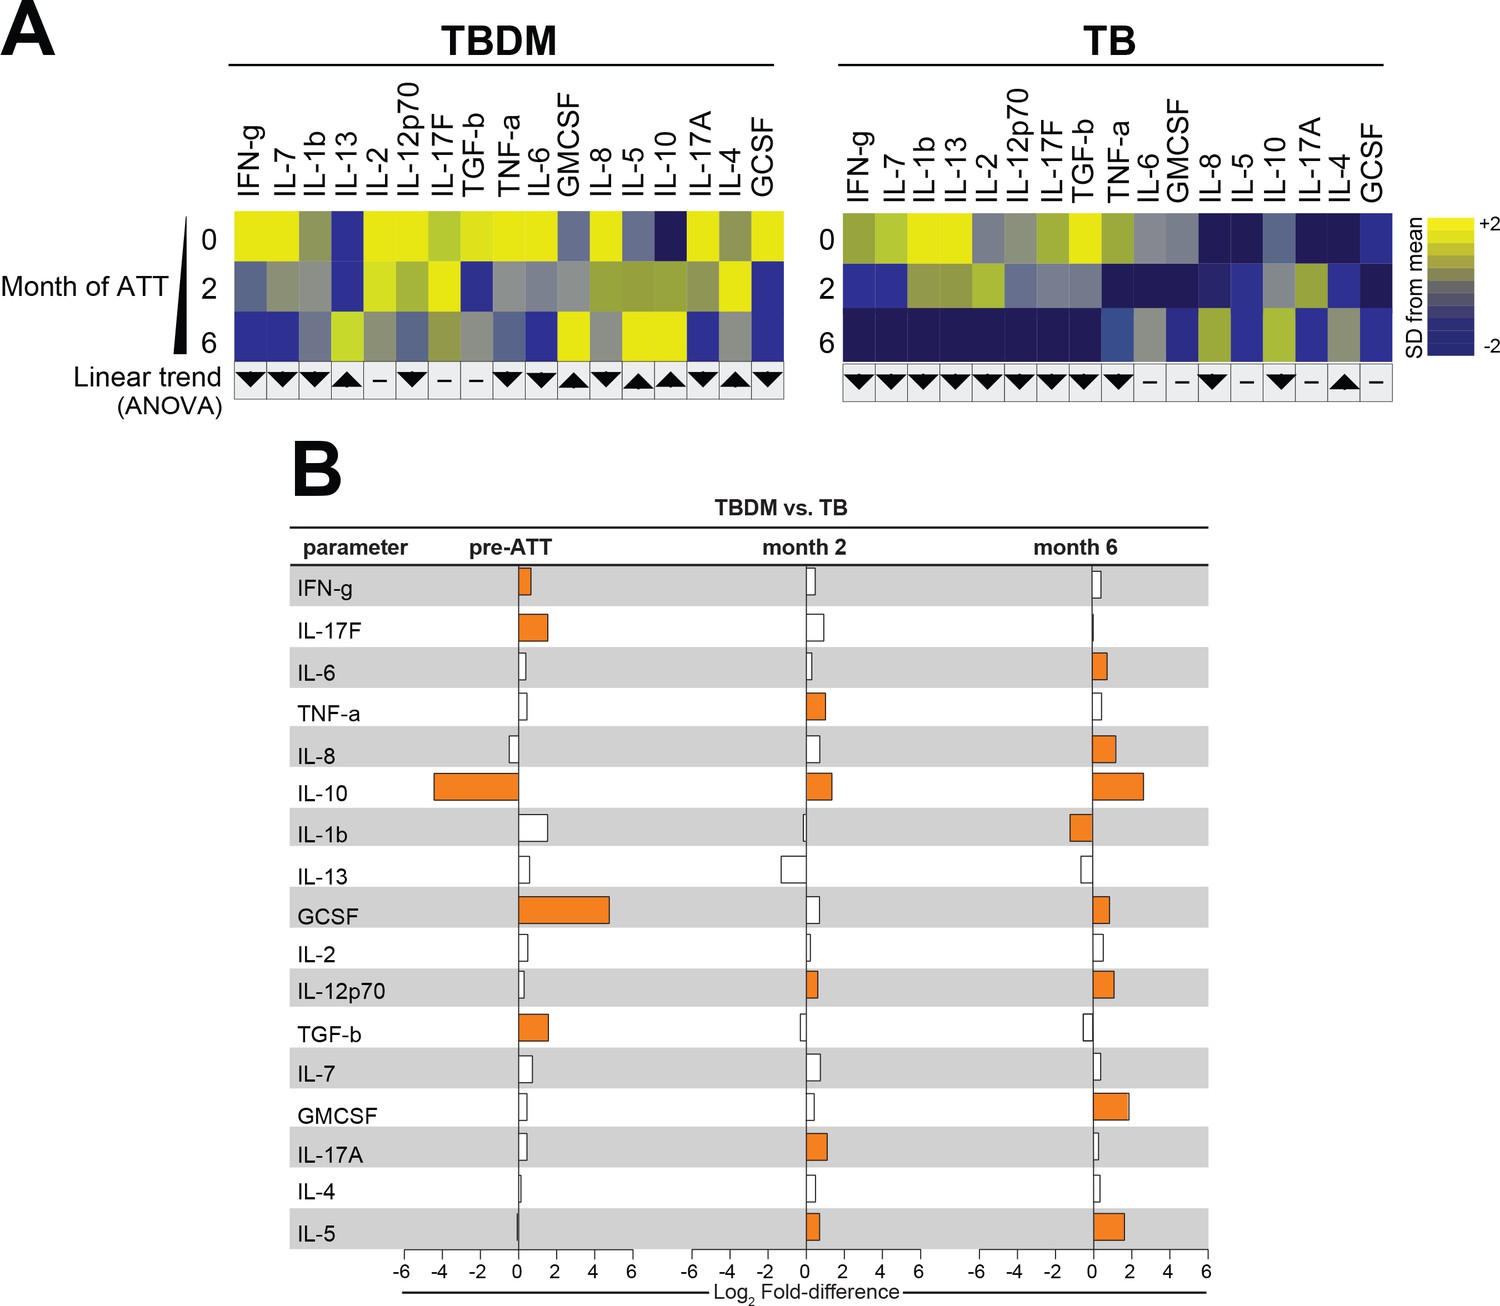
Biomarker profiles during anti-TB treatment in TBDM comorbidity from the Brazil cohort.
(A) Mean log-transformed values for the indicated analytes were calculated and z-score normalized. Heatmaps with values from the Brazil cohort grouped using hierarchical clustering (Ward’s method with 100x bootstrap) was used to illustrate the overall variation in plasma concentrations over time. In addition, one-way ANOVA with linear trans ad hoc test was used to test the direction of variation in each analyte’s concentration between study timepoints. Direction of the arrows highlight statistically significant trends, while “- “denotes differences with P values ≥ 0.05. (B) Mean fold-difference of analyte levels between the TBDM and TB groups in the Brazil cohort. Orange bars indicated statistically significant differences (p<0.05).
Figure 5
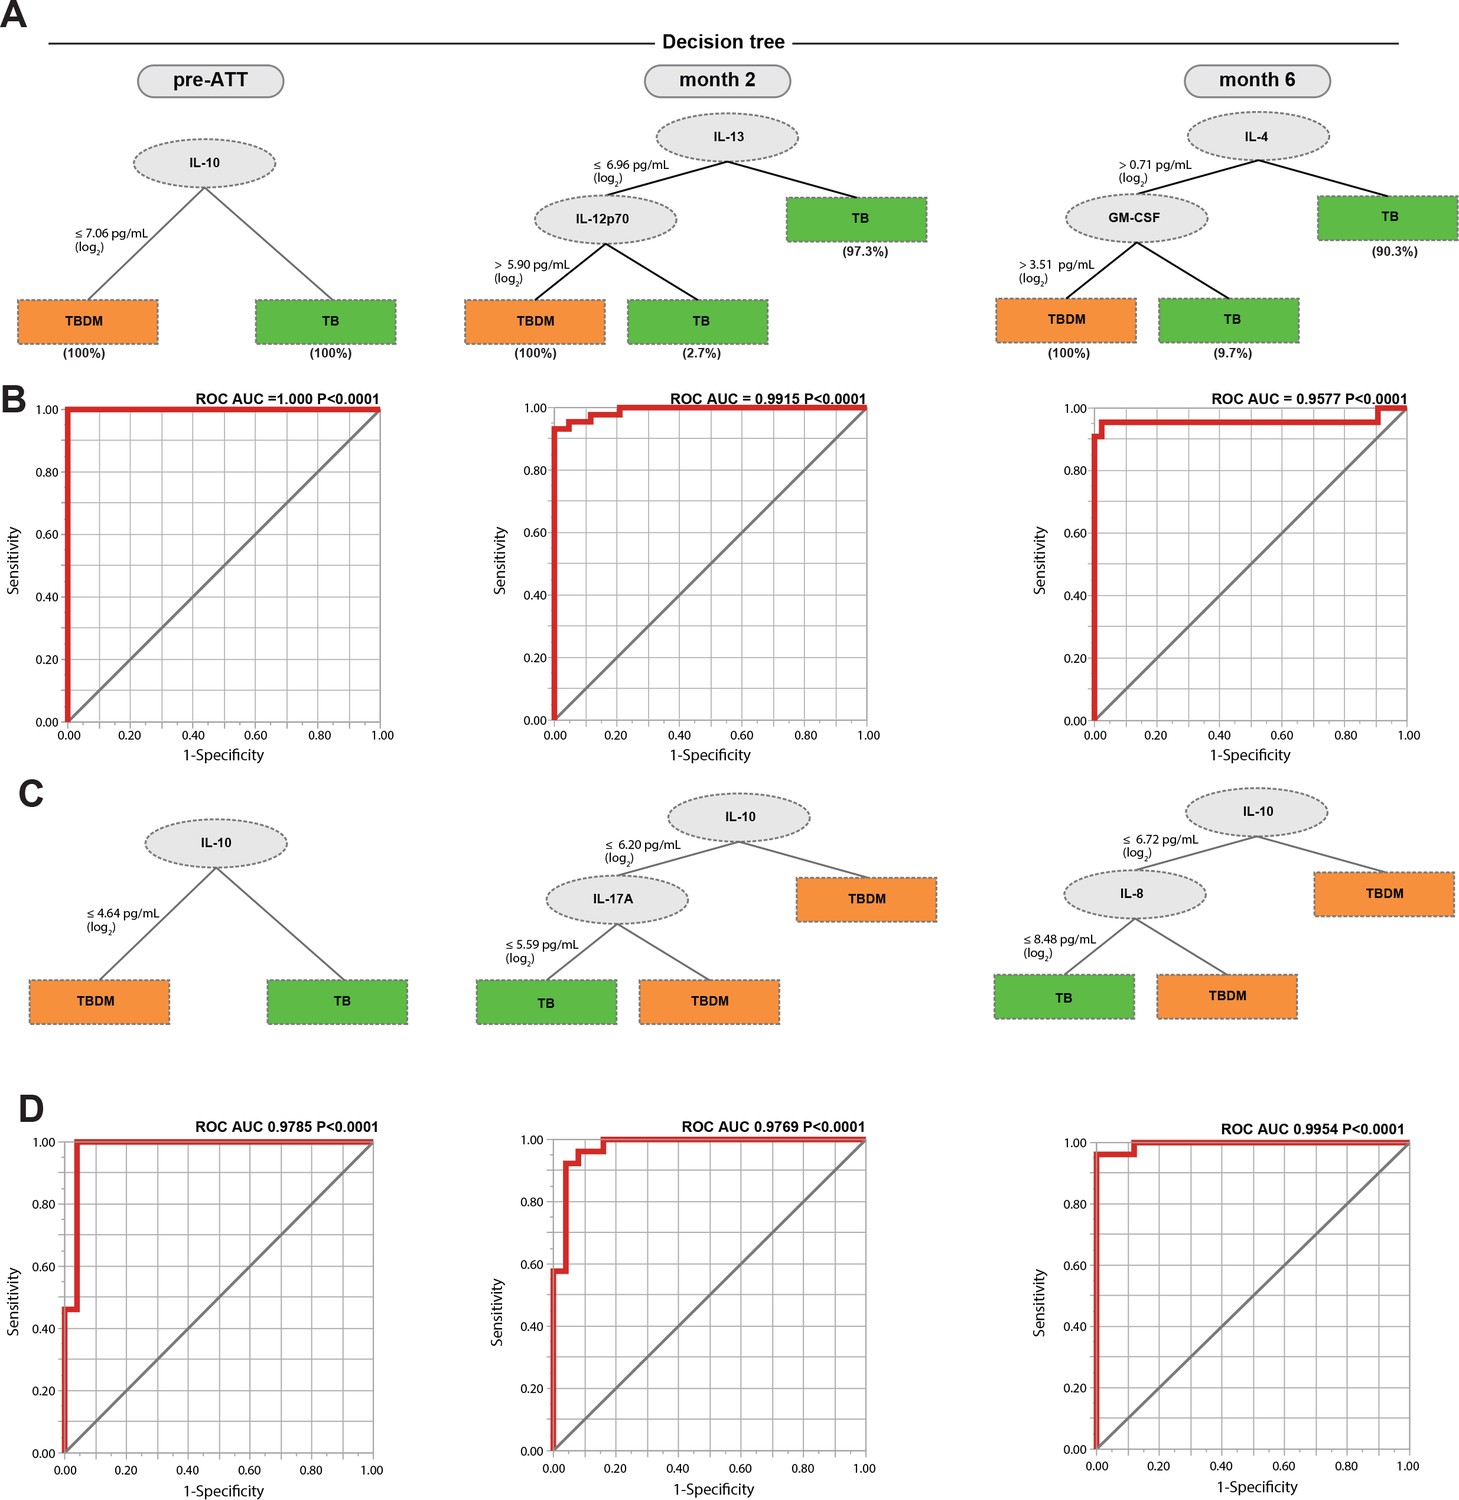
Identification of biomarkers showing the strongest associations with TBDM comorbidity.
Decision tree analysis shows the analytes (or combination) that exhibited the highest accuracy in discriminating TBDM from TB in the India and Brazil cohorts (A and C, respectively). Receiver operator characteristics curves were employed to quantify the accuracy of single or combined biomarkers int the India and Brazil cohorts (B and D, respectively).
Figure 6

Associations between radiographic scores, HbA1c, and systemic inflammatory profiles in the India cohort.
(A) Change in radiographic score values before and at the indicated timepoints after the initiation of antimicrobial treatment for pulmonary TB. Dots represent individual participant values and horizontal lines indicate median values. Values were compared between TBDM and normoglycemic TB groups using the Mann-Whitney U test. (B–D). Spearman correlation matrices were built to examine associations between absolute radiographic score values or difference in score values between the indicated timepoints (fold-variation) and the indicated plasma analyte value at each study timepoint. The Spearman rank values are shown in a heatmap scale. Statistically significant correlations (p<0.05) are highlighted in bold squares. Gray squares indicate significant correlations after adjusting for false discovery rate (FDR 1%). Red dots represent positive correlations while blue dots represent negative correlations.
Tables
Table 1
Clinical and demographic characteristics of participants in the India cohort.
https://doi.org/10.7554/eLife.46477.003| Characteristic | TBDM | TB | P value |
|---|---|---|---|
| n = 43 | n = 44 | ||
| Age, median years (IQR) | 46 (38–52) | 39.5 (30–47) | 0.0146 |
| Male sex, no. (%) | 32 (74.4) | 37 (84) | 0.0408 |
| Smoking status, no. (%) | 0.0584 | ||
| Current smoker | 5 (11.6) | 12 (27.3) | |
| Former smoker | 9 (21) | 13 (29.5) | |
| Never smoked | 29 (67.4) | 19 (43.2) | |
| Alcohol use, no. (%) | 0.7410 | ||
| Current use | 11 (25.6) | 21 (47.7) | |
| Former user | 16 (37.2) | 10 (22.7) | |
| Never used | 16 (37.2) | 13 (29.6) | |
| BMI kg/m2, median (IQR) | 20.3 (163–23) | 16·4 (15.2–18.3) | <0.0001 |
| HbA1c %, median (IQR) | 10.0 (7.3–11.8) | 5.6 (5.4–5.8) | <0.0001 |
| Vitamin D ng/dL, median (IQR) | 15 (9.3–24) | 17 (13–27) | 0.1502 |
Table 2
Characteristics of India cohort participants with KDM vs NDM at enrollment.
https://doi.org/10.7554/eLife.46477.004| Characteristic | KDM | NDM | P value | |
|---|---|---|---|---|
| Male, n (%) | 20 (71.4) | 12 (42.9) | 0.7190 | |
| Age, Median (IQR) | 45.5 (38.0–52.0) | 48.0 (38.0–48.0) | 0.5072 | |
| BMI, Median (IQR) | 21.7 (18.9–23.6) | 18.9 (16.1–20.8) | 0.0079 | |
| Smoking history, n (%) | 0.7354 | |||
| Yes | 10 (35.7) | 4 (14.3) | ||
| No | 18 (64.3) | 11 (39.3) | ||
| Current drinker, n (%) | 0.9999 | |||
| Yes | 7 (25.0) | 4 (14.3) | ||
| No | 21 (75.0) | 11 (39.3) | ||
| Cavitation, n (%) | 0.133 | |||
| Yes | 5 (17.9) | 6 (21.4) | ||
| No | 24 (85.7) | 8 (28.6) | ||
| Bilateral lung lesion, n (%) | 0.3319 | |||
| Yes | 16 (57.1) | 5 (17.9) | ||
| No | 13 (46.4) | 9 (32.1) | ||
-
KDM, known DM prior to enrollment; NDM, newly diagnosed DM at enrollment screening.
Data were compared using the chi-squared test except for age, which was compared using the Mann-Whitney U test.
Table 3
Clinical and demographic characteristics of participants in the Brazil cohort.
https://doi.org/10.7554/eLife.46477.005| Characteristic | TBDM | TB | P value |
|---|---|---|---|
| n = 25 | n = 26 | ||
| Age, median years (IQR) | 45 (30.5–49.5) | 46 (37–56) | 0.131 |
| Male sex, no. (%) | 13 (52) | 13 (50) | >0.999 |
| Smoking status, no. (%) | 0.162 | ||
| Current smoker | 10 (40) | 8 (30.7) | |
| Former smoker | 3 (12) | 9 (34.6) | |
| Never smoked | 12 (48) | 9 (34.6) | |
| Alcoholism, no. (%) | 10 (40) | 13 (50) | 0.473 |
| BMI kg/m2, median (IQR) | 19.5 (18.3–49.5) | 20.2 (18.7–22.6) | 0.114 |
| HbA1c %, median (IQR) | 8.8 (7.3–10.2) | 5.2 (4.7–5.5) | <0.0001 |
-
Alcoholism defined by CAGE questionnaire.
Table 4
Comparison of Brazil and India cohort characteristics.
https://doi.org/10.7554/eLife.46477.008| Brazil | India | P value | |
|---|---|---|---|
| Age, Median (IQR) | 46.0 (34.0–50.0) | 43.0 (32.0–54.0) | 0.5400 |
| Male, n (%) | 26 (51.0) | 69 (79.3) | 0.0011 |
| BMI, Median (IQR) | 17.8 (15.7–21.0) | 19.8 (18.6–22.2) | 0.0001 |
| Smoking history, n (%) | 0.2871 | ||
| Yes | 18 (35.3) | 17 (26.2) | |
| No | 33 (64.7) | 48 (73.9) | |
| Alcohol, n (%) | 0.1409 | ||
| Yes | 23 (45.1) | 32 (36.8) | |
| No | 23 (45.1) | 55 (63.2) | |
| Lung lesions, n (%) | 0.6336 | ||
| Unilateral | 26 (51.0) | 48 (55.2) | |
| Bilateral | 25 (49.0) | 39 (44.8) | |
| Cavitation, n (%) | 0.2718 | ||
| Yes | 33 (64.7) | 64 (73.6) | |
| No | 18 (35.3) | 23 (26.4) | |
| AFB smear grade, n (%) | <0.0001 | ||
| 0 | 9 (17.6) | 0 (0) | |
| 1+ | 13 (25.4) | 43 (52.4) | |
| 2+ | 14 (27.4) | 35 (42.7) | |
| ≥3 + | 15 (29.4) | 4 (4.9) | |
-
Data were compared using the chi-squared test except for age and BMI, which were compared using the Mann-Whitney U test.
Table 5
Characteristics of normoglycemic TB participants and TBDM participants in the India and Brazil cohorts.
https://doi.org/10.7554/eLife.46477.009| Characteristics | TB | TBDM | ||||
|---|---|---|---|---|---|---|
| India | Brazil | P value | India | Brazil | P value | |
| Age, Median (IQR) | 39.5 (30.0–47.2) | 45.0 (30.5–49.5) | 0.6390 | 47.0 (38.0–51.0) | 46.0 (37.0–56.0) | 0.5565 |
| Male, n(%) | 32 (72.7%) | 13 (50%) | 0.3001 | 37 (84,09%) | 13 (52%) | 0.0058 |
| BMI, Median (IQR) | 16.4 (15.3–18.3) | 19.5 (18.3–20.6) | 0.2579 | 20.32 (16.6–23.0) | 20.20 (18.7–22.6) | <0.0001 |
| Smoking, n (%) | 0.6148 | 0.1309 | ||||
| Yes | 25 (56.8%) | 17 (65.4%) | 14 (32.6%) | 13 (52%) | ||
| No | 19 (43.2%) | 9 (346%) | 29 (67.4%) | 12 (48%) | ||
| Alcohol, n (%) | >0.9999 | 0.2786 | ||||
| Yes | 21 (47.7%) | 13 (50%) | 11 (25.6%) | 10 (40%) | ||
| No | 23 (52.3%) | 13 (50%) | 32 (74.4%) | 15 (60%) | ||
| Lung lesion, n (%) | >0.9999 | 0.4535 | ||||
| Unilateral | 26 (591%) | 16 (61.5%) | 22 (51,16%) | 10 (40%) | ||
| Bilateral | 18 (40.9%) | 10 (38.5%) | 21 (48,84%) | 15 (60%) | ||
| Cavitation, n (%) | 0.0212 | 0.0003 | ||||
| Yes | 12 (27.3%) | 15 (57.7%) | 11 (25.6%) | 18 (72%) | ||
| No | 32 (72.7%) | 11 (42.3%) | 32 (74.4%) | 7 (28%) | ||
| AFB smear, n (%) | 0.0024 | <0.0001 | ||||
| 0 | 0 (0%) | 6 (23.1%) | 0 (0%) | 3 (12%) | ||
| 1+ | 26 (61.9%) | 9 (34.6%) | 17 (42,5%) | 4 (16%) | ||
| 2+ | 13 (30.9%) | 6 (23.1%) | 22 (55%) | 8 (32%) | ||
| ≥3 + | 3 (7.1%) | 5 (19.2%) | 1 (2,5%) | 10 (40%) | ||
-
Data were compared using the chi-square test except foe age as BMI, which were compared using the Mann-Whitney U test.
Key resources table
| Reagent type (species) or resource | Designation | Source or reference | Identifiers | Additional information |
|---|---|---|---|---|
| Commercial assay or kit | Multiplex ELISA, Bio-Plex Pro Human Cytokine 17-plex Assay | Bio-Rad | #m5000031yv |
Additional files
-
Source data 1
India Cohort.
- https://doi.org/10.7554/eLife.46477.007
-
Source data 2
Brazil Cohort.
- https://doi.org/10.7554/eLife.46477.011
-
Transparent reporting form
- https://doi.org/10.7554/eLife.46477.017
Download links
A two-part list of links to download the article, or parts of the article, in various formats.
Downloads (link to download the article as PDF)
Open citations (links to open the citations from this article in various online reference manager services)
Cite this article (links to download the citations from this article in formats compatible with various reference manager tools)
Persistent inflammation during anti-tuberculosis treatment with diabetes comorbidity
eLife 8:e46477.
https://doi.org/10.7554/eLife.46477


