Tactile sensory channels over-ruled by frequency decoding system that utilizes spike pattern regardless of receptor type
- Faculty of Medicine, UNSW Sydney, Australia
- Neuroscience Research Australia, Australia
- Western Sydney University, Australia
- Linköping University, Sweden
- School of Medicine, Western Sydney University, Australia
- The Baker Heart and Diabetes Institute, Australia
Figures
Figure 1
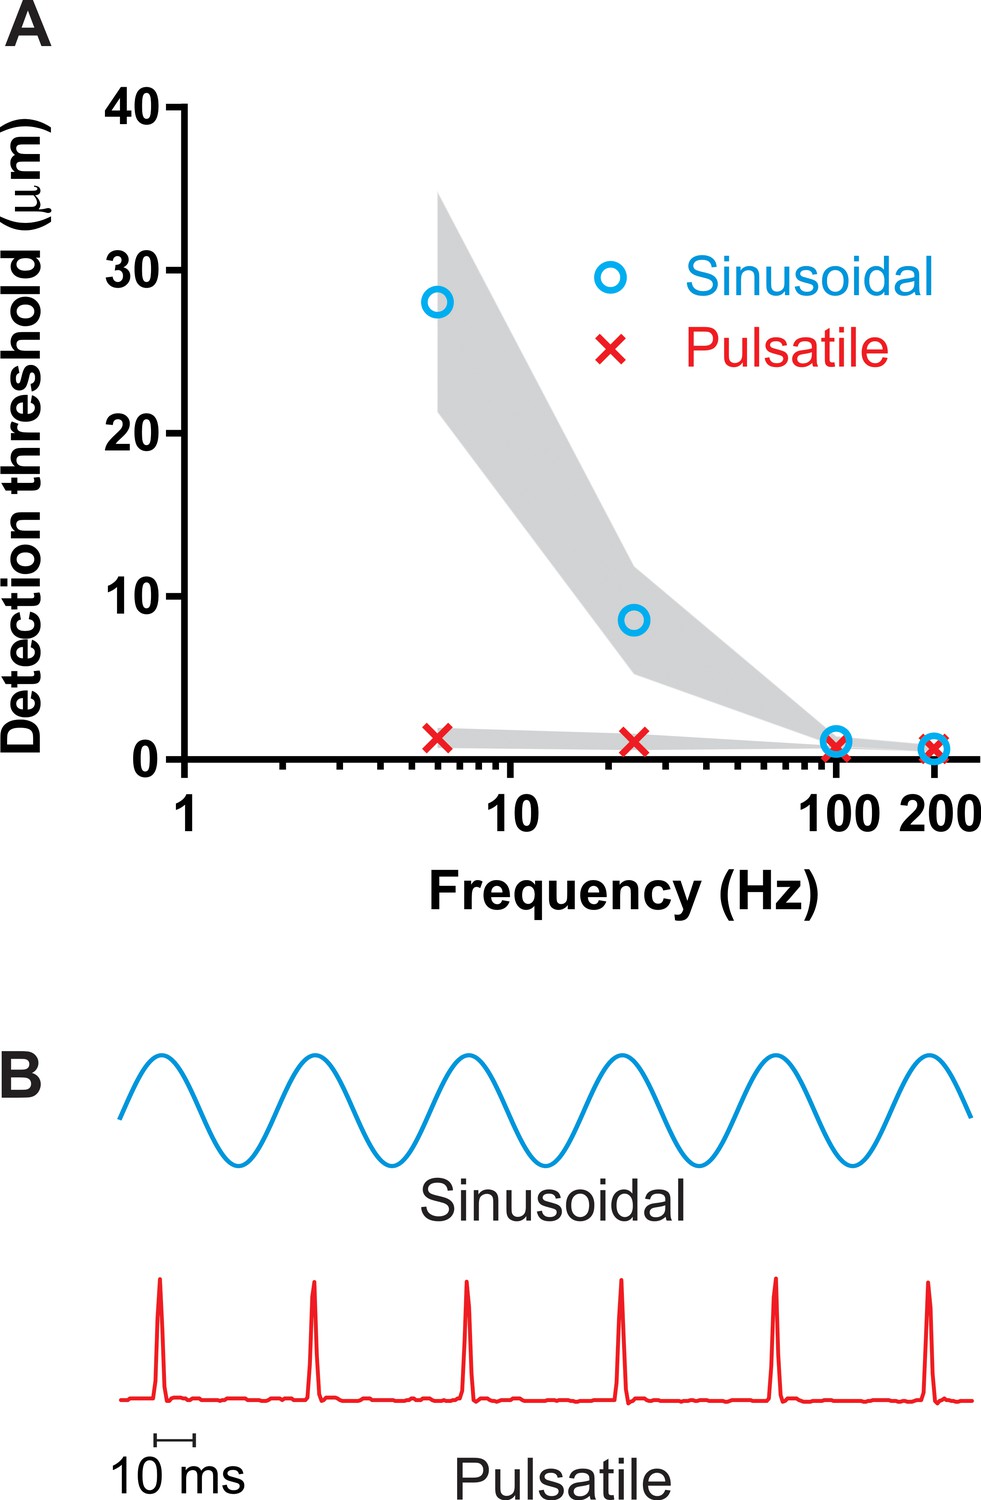
Detection thresholds.
(A) Vibrotactile detection thresholds on the finger across frequency ranges for sinusoidal and pulsatile stimuli (n = 12). Shaded area represent ± 95% confidence intervals. (B) An example of the sinusoidal and pulsatile waveforms.
-
Figure 1—source data 1
Detection thresholds.
- https://doi.org/10.7554/eLife.46510.003
Figure 2 with 1 supplement
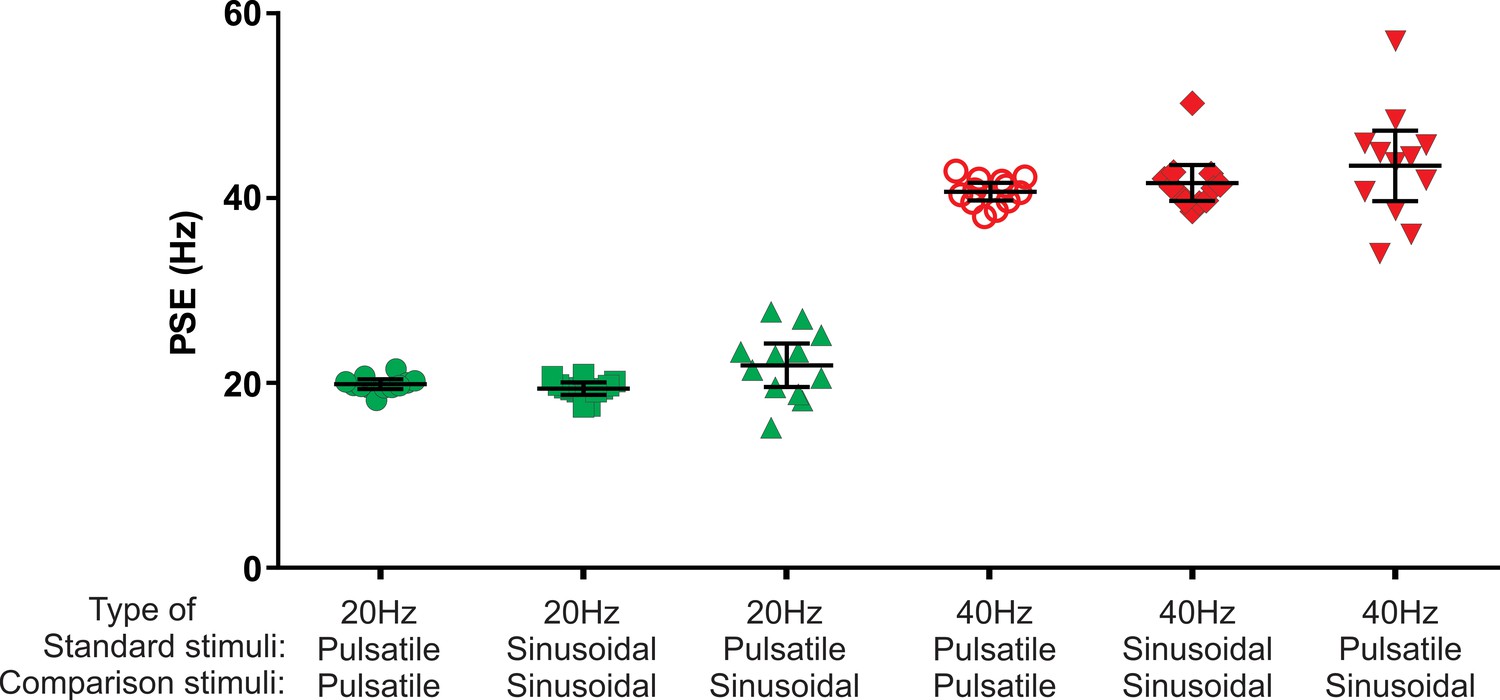
Point of subjective equality (PSE) obtained using two interval forced choice paradigm.
The test stimulus was either sinusoidal or pulsatile presented at 20 Hz and 40 Hz. The test stimulus was compared with a range of comparison frequencies: 10, 14, 18, 22, 26, 30 Hz with 20 Hz test stimulus; and 25, 31, 37, 43, 49, 55 Hz with 40 Hz test stimulus. Black horizontal lines represent mean ± 95% confidence intervals (n = 12).
-
Figure 2—source data 1
PSE values for individual subjects.
- https://doi.org/10.7554/eLife.46510.006
Figure 2—figure supplement 1
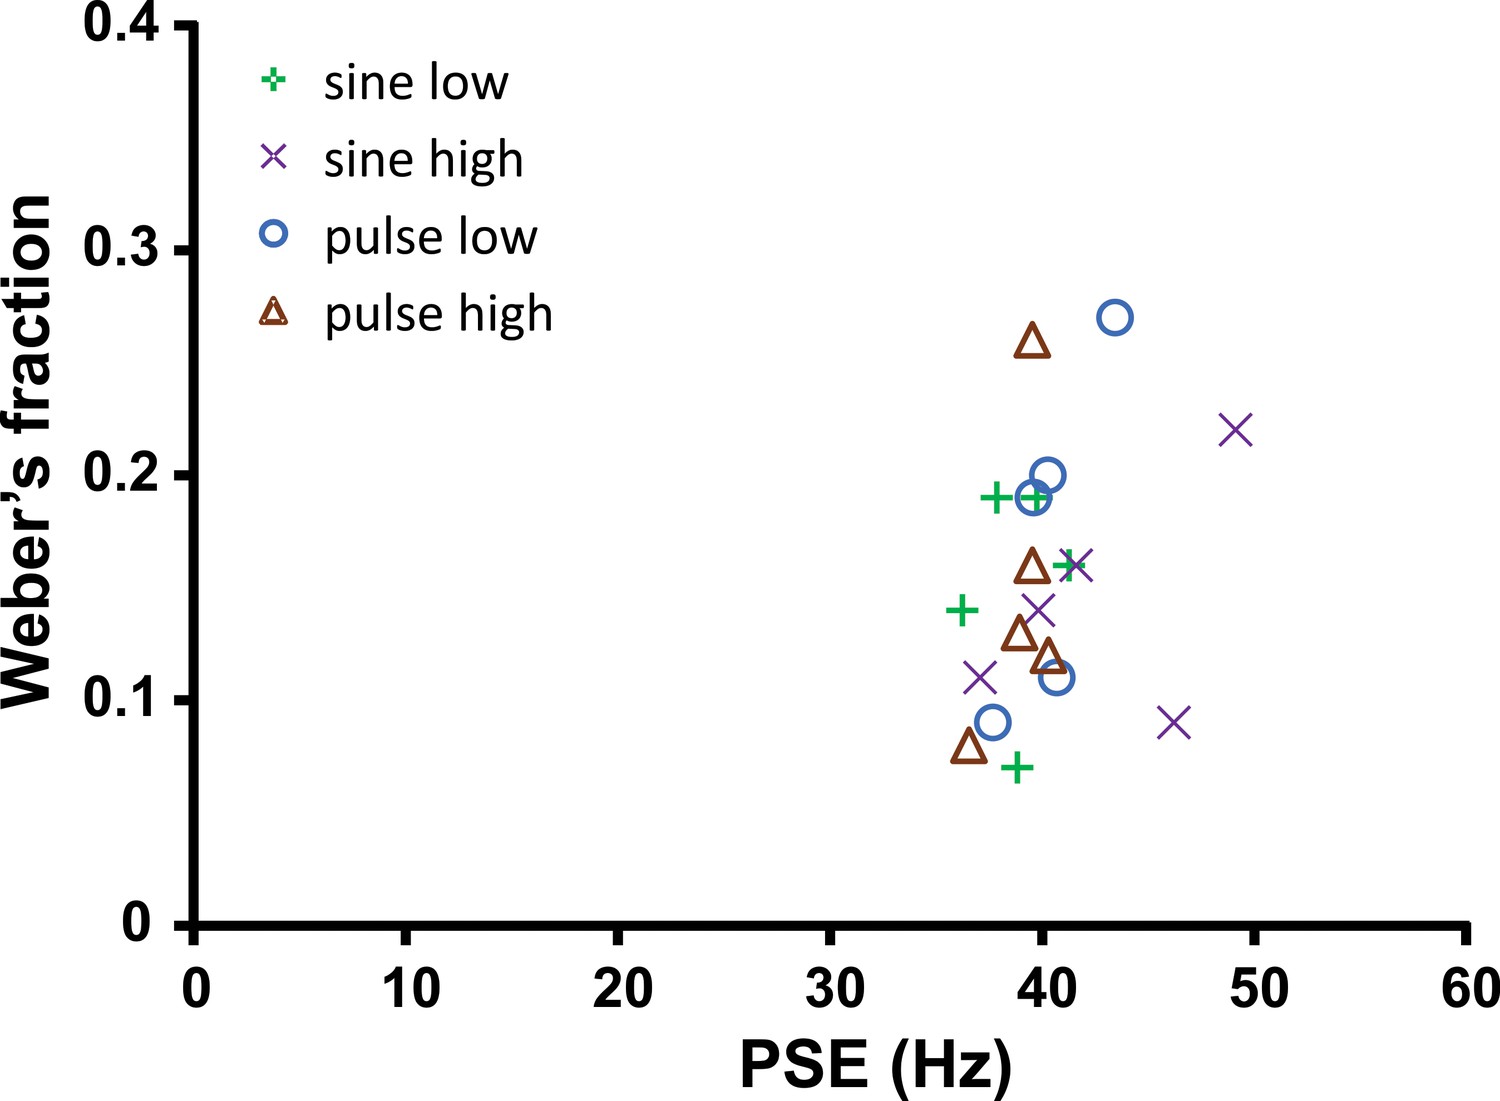
Insensitivity of frequency rating to changes in stimulus amplitude.
Results are shown for five subjects (n = 5), who conducted the same experimental protocol illustrated in Figures 2 and 3 at 40 Hz, but with two different amplitudes (randomly interleaved) for the comparison frequencies. For the sinusoidal comparisons, the standard was 60 µm, and the comparisons were 40 µm (sine low) and 90 µm (sine high). For the pulsatile comparisons, the standard was 6 µm, and the comparisons were 3 µm (pulse low) and 10 µm (pulse high). Mean values for PSE and Weber fraction for each condition with 95% CI were:
| 40 Hz comparisons | PSE | Weber Fraction |
| sine low | 38.8 (37.1 - 40.5) Hz | 0.15 (0.11 - 0.19) |
| sine high | 42.8 (38.5 – 47.0) Hz | 0.14 (0.10 - 0.19) |
| pulse low | 40.3 (38.5 - 42.2) Hz | 0.17 (0.11 - 0.24) |
| pulse high | 39.0 (37.7 - 40.3) Hz | 0.15 (0.09 - 0.21) |
Figure 3
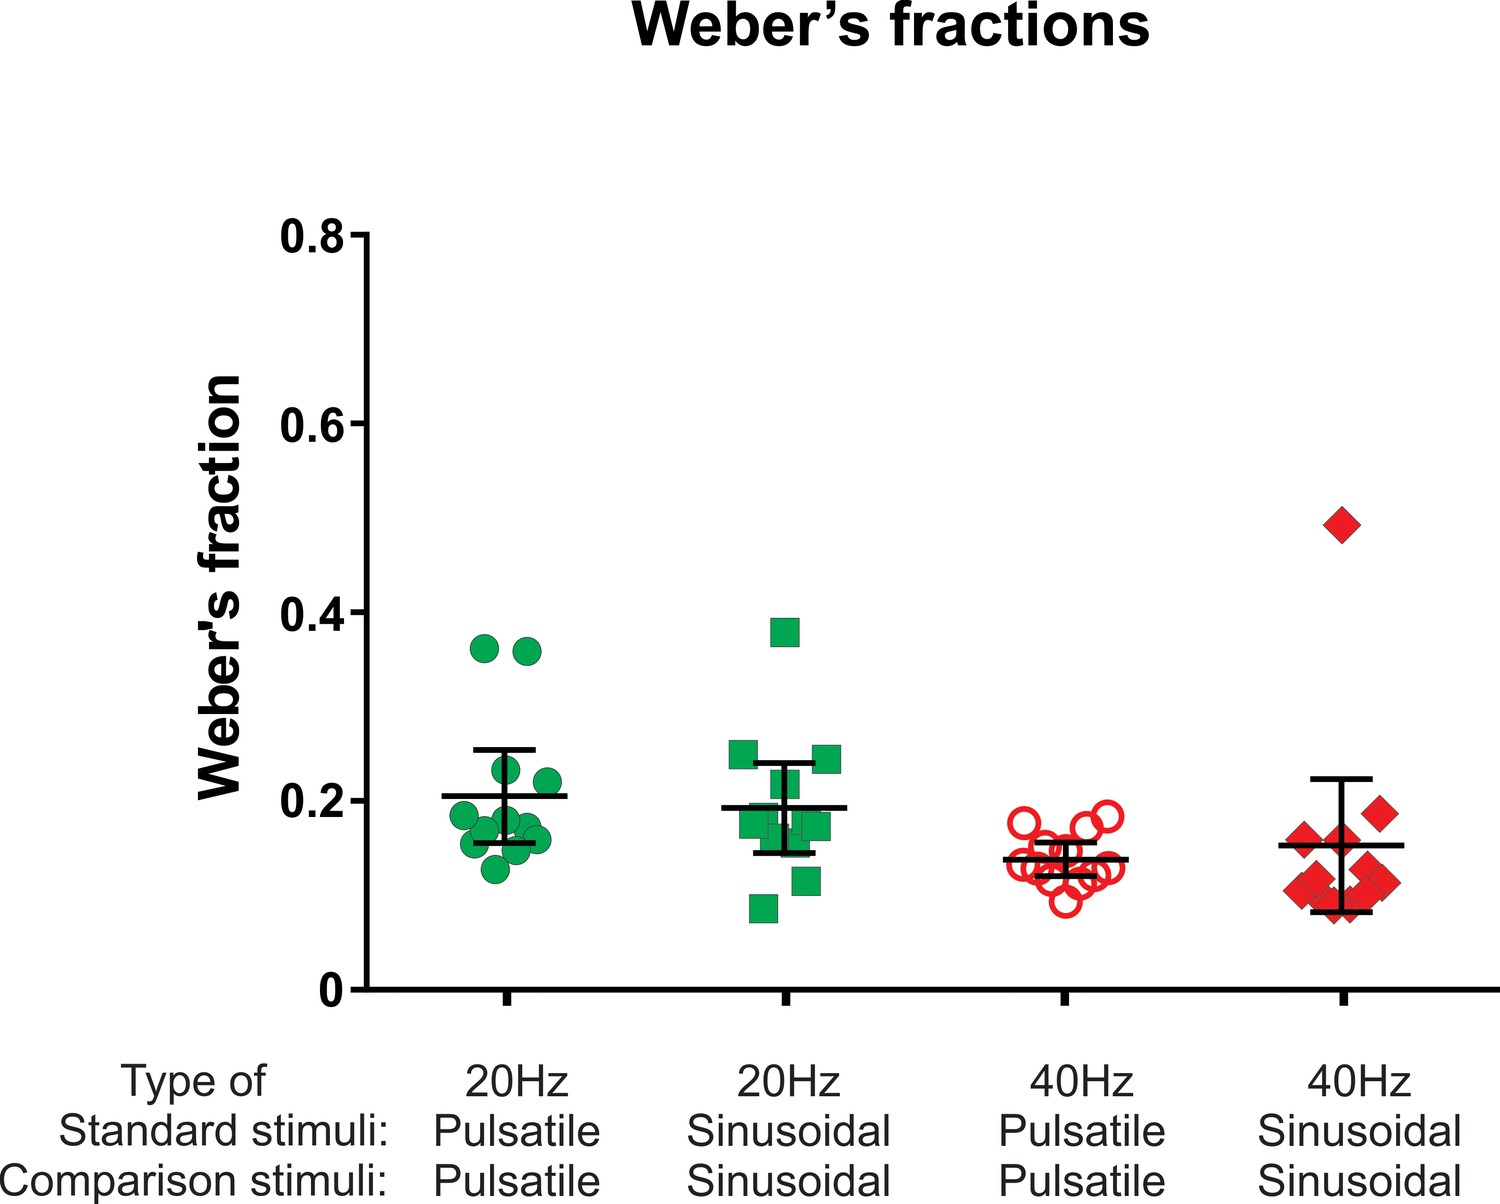
The Weber's fraction of just noticeable difference in frequency.
For details refer to legend of Figure 2.
-
Figure 3—source data 1
Weber's fractions.
- https://doi.org/10.7554/eLife.46510.009
Figure 4
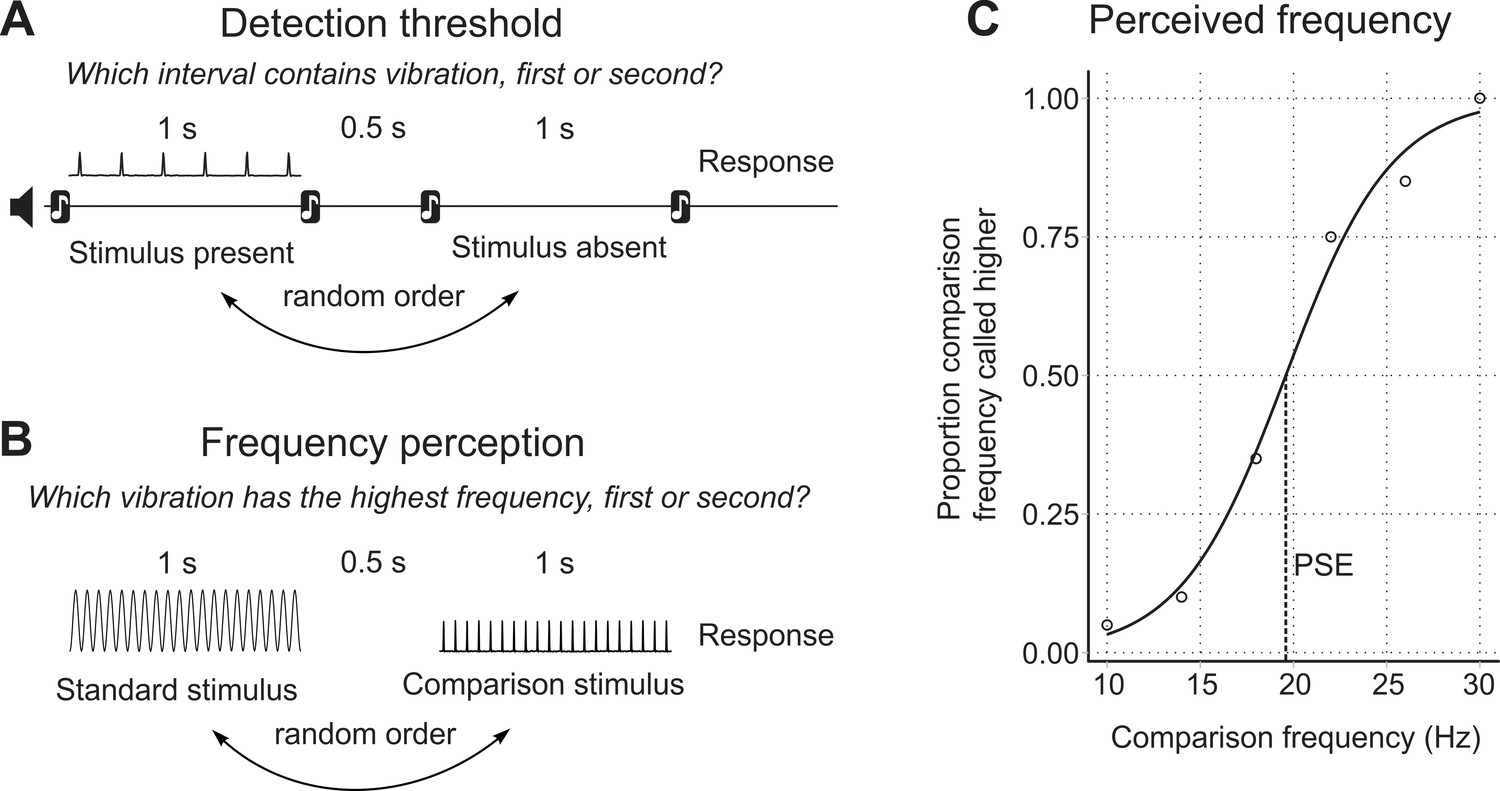
Experimental protocols.
(A) Structure of the detection threshold task. (B) Structure of the frequency perception task. (C) Point of subjective equality (PSE) determined on the psychometric curve.
Figure 5

Afferent responses with 20 Hz stimuli.
(A) FAII afferent response to pulsatile stimuli 3 µm in amplitude. (B) FAI afferent response to sinusoidal stimuli 150 µm in amplitude. (C–D) The same FAI afferent as in B, response to pulsatile stimuli at various amplitudes: no response with 25 µm (subthreshold) stimulus; sporadic firing at 30 µm; and entrainment at 35 µm. Note that firing pattern in A, B and E is identical regardless of stimulus or afferent type.
Tables
Table 1
Amplitudes and frequencies used in each experimental condition.
https://doi.org/10.7554/eLife.46510.007| Condition | Test stimulus | Comparison stimulus | Comparison frequencies |
|---|---|---|---|
| PP | 20 Hz, Pulsatile, 3 µm 40 Hz, Pulsatile, 3 µm | Pulsatile, 3 µm Pulsatile, 3 µm | 10, 14, 18, 22, 26, 30 Hz 25, 31, 37, 43, 49, 55 Hz |
| SS | 20 Hz, Sinusoidal, 150 µm 40 Hz, Sinusoidal, 40 µm | Sinusoidal, 150 µm Sinusoidal, 40 µm | 10, 14, 18, 22, 26, 30 Hz 25, 31, 37, 43, 49, 55 Hz |
| SP | 20 Hz, Sinusoidal, 150 µm 40 Hz, Sinusoidal, 40 µm | Pulsatile, 3 µm Pulsatile, 3 µm | 10, 14, 18, 22, 26, 30 Hz 25, 31, 37, 43, 49, 55 Hz |
Additional files
-
Transparent reporting form
- https://doi.org/10.7554/eLife.46510.012
Download links
A two-part list of links to download the article, or parts of the article, in various formats.
Downloads (link to download the article as PDF)
Open citations (links to open the citations from this article in various online reference manager services)
Cite this article (links to download the citations from this article in formats compatible with various reference manager tools)
Tactile sensory channels over-ruled by frequency decoding system that utilizes spike pattern regardless of receptor type
eLife 8:e46510.
https://doi.org/10.7554/eLife.46510


