Myosin II isoforms play distinct roles in adherens junction biogenesis
- Université de Paris and CNRS UMR 7592, France
- Swansea University, United Kingdom
- Eindhoven University of Technology, Netherlands
- Sorbonne Université and CNRS UMR 7636, France
Figures
Figure 1 with 1 supplement
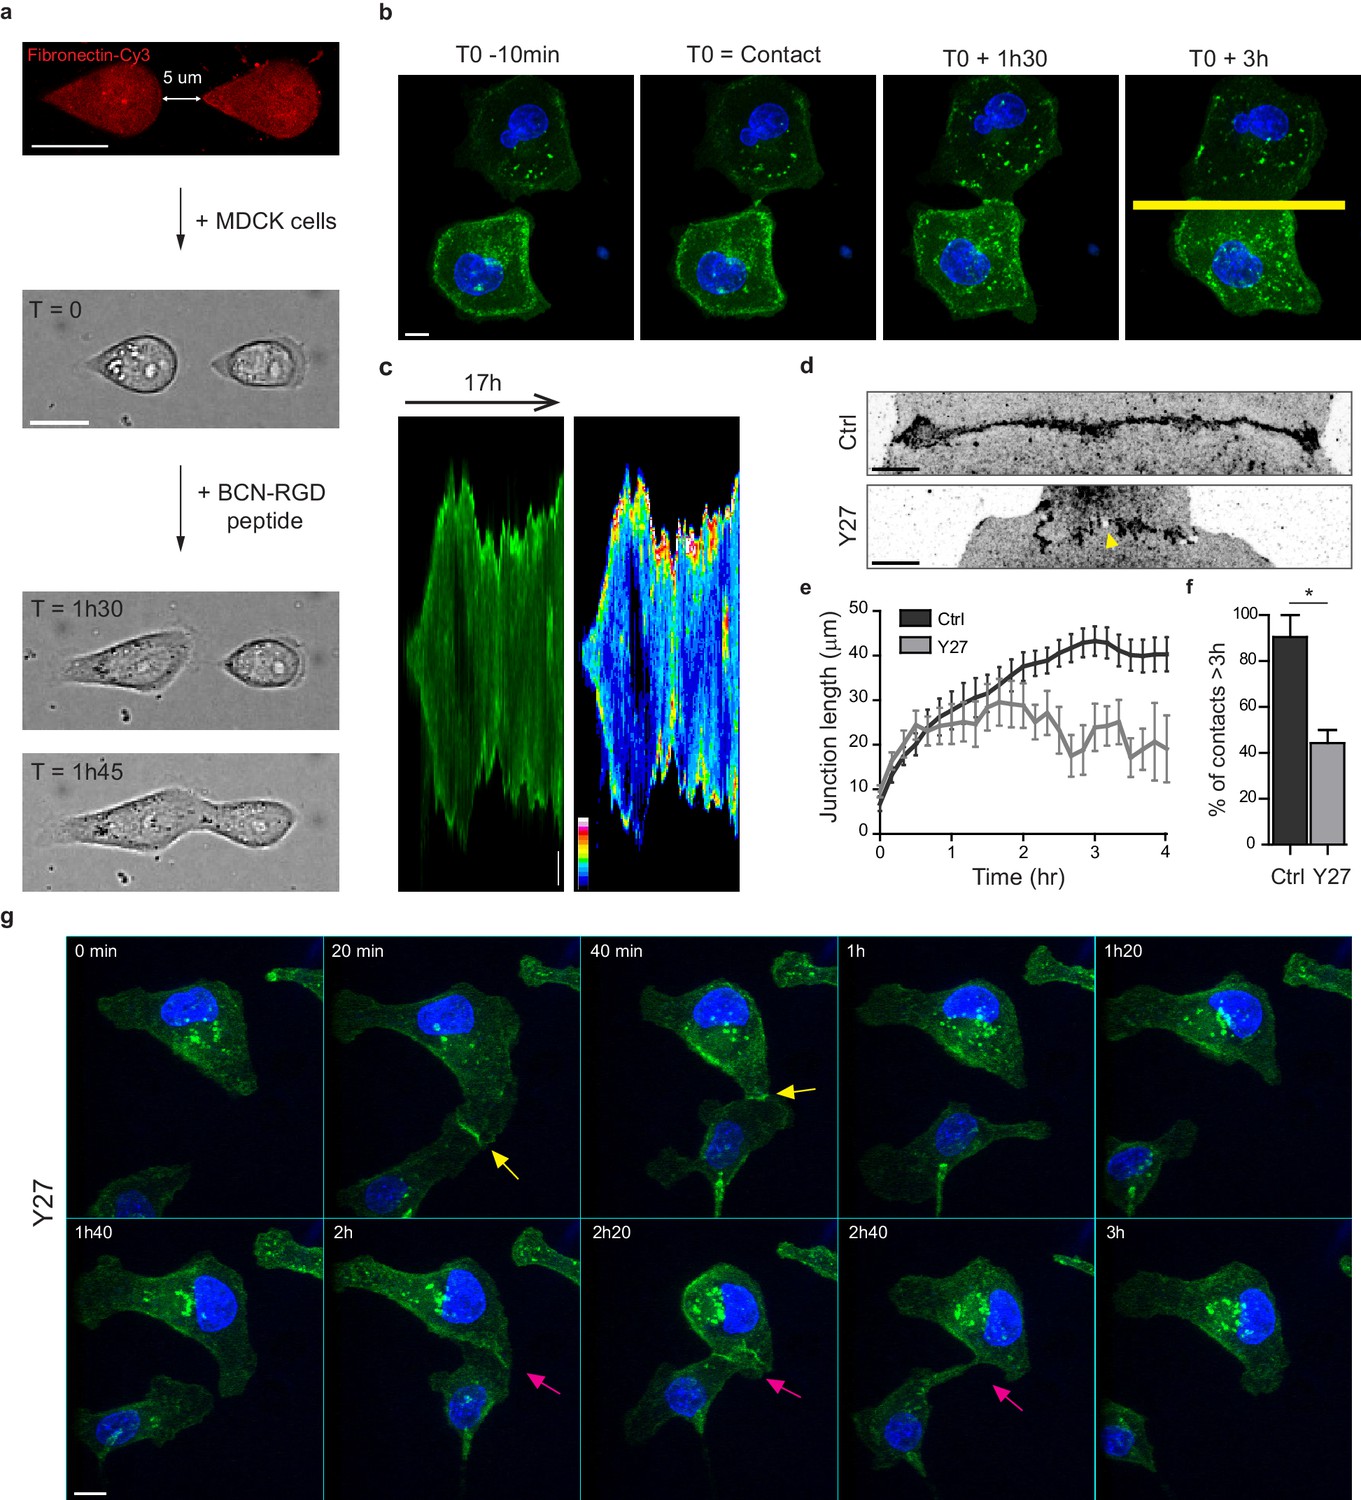
Development of an in vitro system for the study of junction biogenesis.
(a) Sequential steps for controlled initiation and visualization of junction biogenesis. The two cells are initially confined on a pair of fibronectin-coated 5 µm-away patterns (T0). When desired, the cell confinement is released by addition of BCN-RGD peptide, inducing cell spreading and kissing within a few hours. Scale Bar: 10 µm. (b) Spinning disk image sequence showing contact extension between two MDCK cells expressing GFP-E-cadherin and stained with Hoechst. Scale bar: 10 µm. (c) Kymographs of the junction forming in panel b, generated from the yellow line, shown in green and in pseudocolor to highlight GFP-E-cadherin accumulation at junction tips. The junction axis was realigned horizontally for some time points in order to generate the kymograph on a long time scale. Scale bar: 5 µm. (d) Representative confocal images of β-catenin-stained junctions from MDCK cell doublets. The arrow points at small holes frequently observed within Y27-treated junctions. The cells were fixed 20 hr after addition of BCN-RGD alone or BCN-RGD + Y27 (50 µM). Scale bar: 10 µm. (e) Graphs showing the evolution of junction length in function of time after contact initiation in Ctrl and Y27-treated MDCK cell doublets. Y27 (50 µM) was added with BCN-RGD. Data are represented as mean + /- SEM. n = 13 and 12 cell doublets from two and three independent experiments, respectively. (f) Bar graph of the percentage of cell doublets that stay in contact for more than 3 hr in Ctrl and Y27-treated MDCK cells, respectively. Data are represented as mean + /- SEM. n = 13 and 12 cell doublets from two and three independent experiments, respectively. Bonferroni statistical tests were applied for p value. (g) Spinning disk image sequence of GFP-E-cadherin-expressing MDCK cells pre-stained with Hoechst in the presence of Y27 (50 µM). The sequence starts 3 hr after addition of BCN-RGD + Y27. The arrows highlight transient contacts forming under these conditions. Scale bar: 10 μm.
-
Figure 1—source data 1
Development of anin vitrosystem for the study of junction biogenesis.
- https://doi.org/10.7554/eLife.46599.005
Figure 1—figure supplement 1
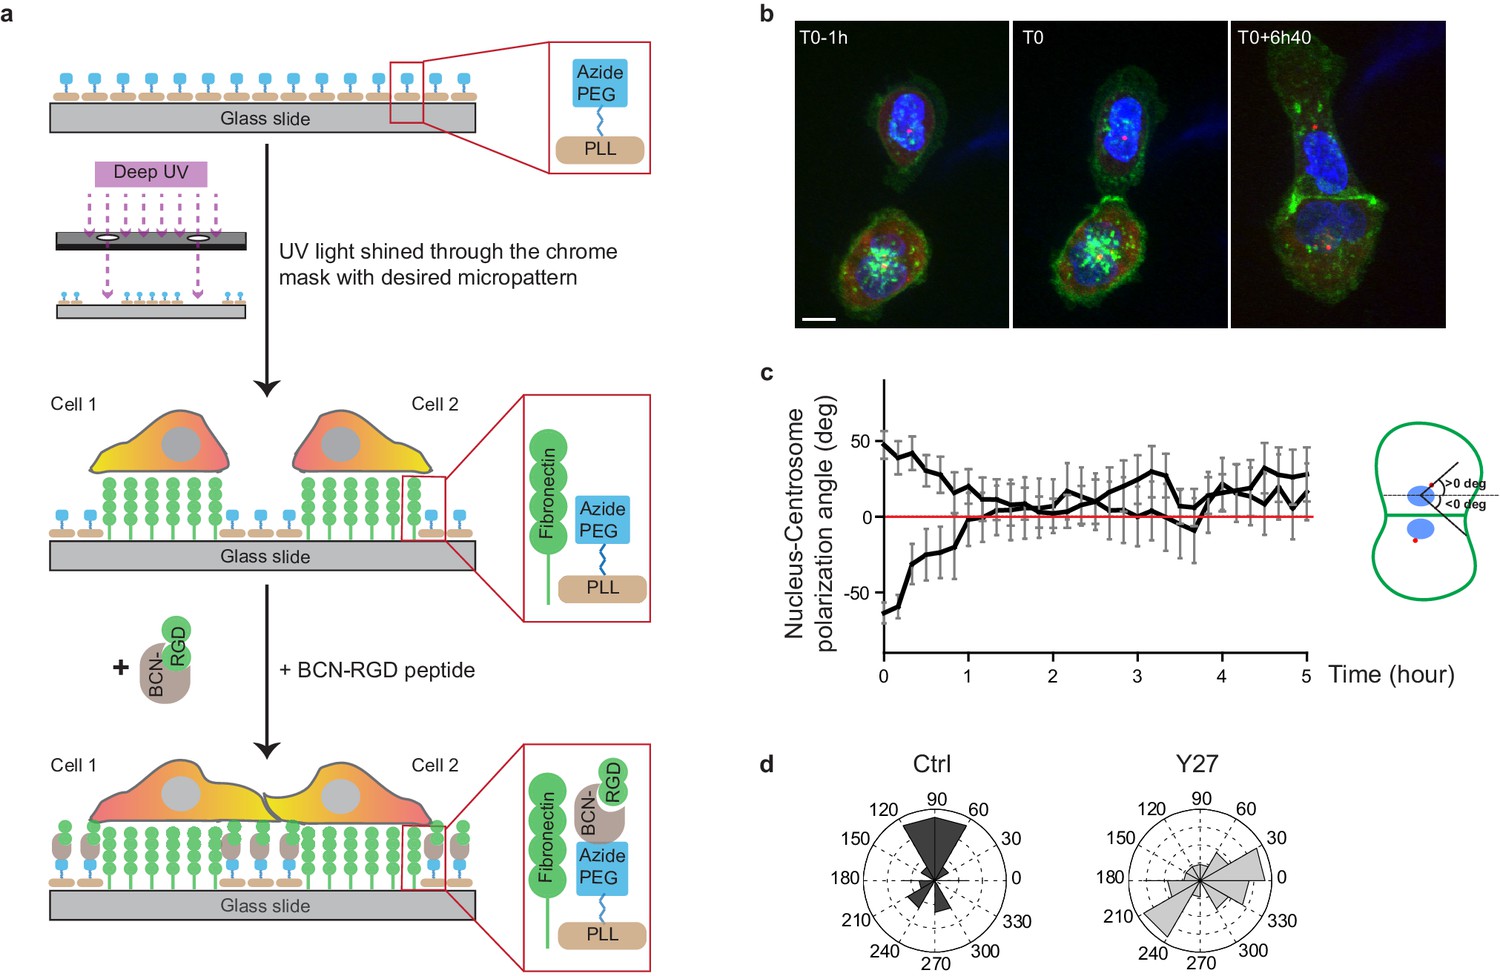
Reversal of nucleus-centrosome polarity axis after cell-cell contact.
(a) Scheme depicting the switchable micro-patterning strategy used for confinement release (click chemistry). (b) Spinning disk image sequence of GFP-E-cadherin and RFP-Pericentrin of doubled transfected MDCK cells pre-stained with Hoechst. Scale bar: 10 µm. (c) Plots of nucleus-centrosome axis polarization angle relative to junction axis after cell-cell contact. Data are represented as mean + /- SEM. n = 19 doublets from three independent experiments. (d) Distribution of nucleus-centrosome axis polarization angles relative to junction axis after cell-cell contact in Ctrl or Y27-treated MDCK cells at the time when junctions reach their maximal length. n = 15 and 21 cells from three and two independent experiments respectively.
-
Figure 1—figure supplement 1—source data 1
Reversal of nucleus-centrosome polarity axis after cell-cell contact.
- https://doi.org/10.7554/eLife.46599.004
Figure 2 with 1 supplement
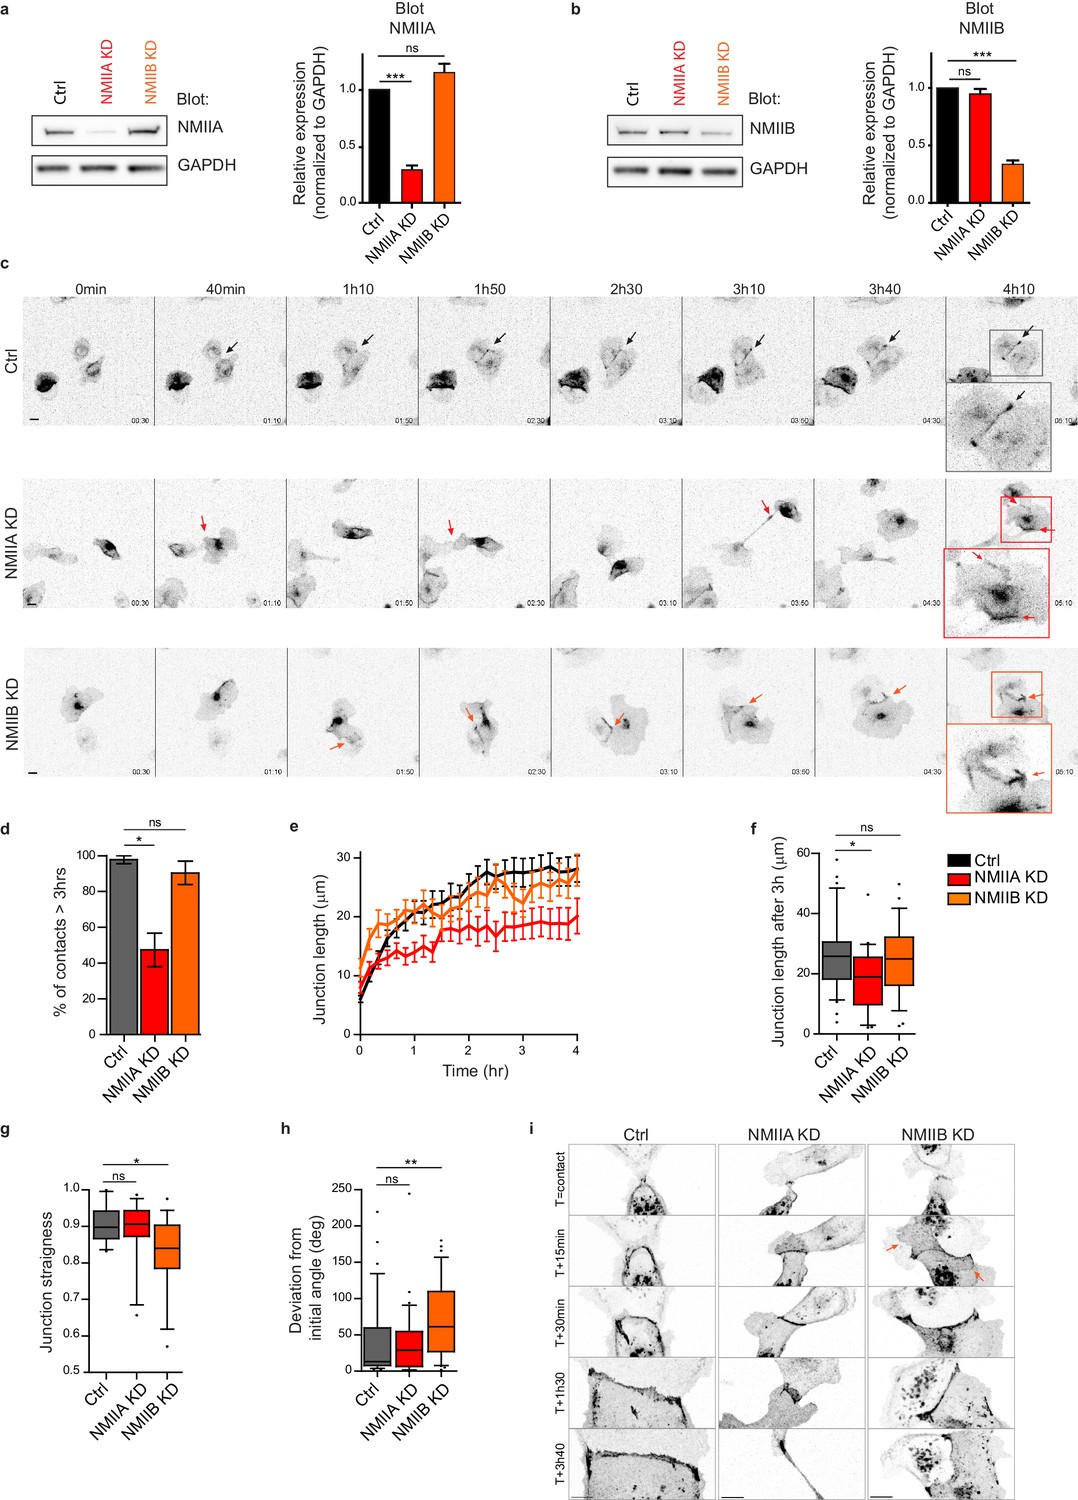
NMIIA and NMIIB are both required for proper junction biogenesis.
(a, b) Left panels: Representative immunoblots showing the isoform specific knockdown of NMIIA (a) and NMIIB (b) in NMIIA KD and NMIIB KD MDCK cells. GAPDH expression levels were used as loading controls. Right panels: Bar graphs showing the relative expression level of NMIIA and NMIIB proteins in Ctrl, NMIIA KD and NMIIB KD cells normalized to GAPDH expression levels. Data are represented as mean + /- SEM from three independent experiments. Kruskall-Wallis statistical tests were applied for p value. (c) Representative epifluorescence image sequences of GFP-E-cadherin over a time course of 5 hr showing the dynamics of junction formation at low magnification in Ctrl, NMIIA KD and NMIIB KD MDCK cells. The arrows indicate the position and the orientation of the junctions. Scale bar: 10 µm. (d) Bar graph of the percentage of cell doublets that stay in contact for more than 3 hr. Data are represented as mean + /- SEM. Tukey’s multiple comparison statistical tests were applied for p value. n = 36, 37 and 31 cell doublets for Ctrl, NMIIA KD and NMIIB KD cells respectively, from three independent experiments. (e) Plots showing the evolution of junction length in function of time for Ctrl, NMIIA KD and NMIIB KD cell doublets. Data are represented as mean + /- SEM. n = 40, 43 and 35 cell doublets for Ctrl, NMIIA KD and NMIIB KD cells respectively, from four independent experiments. (f) Box and whiskers graphs representing the junction length after 3 hr after contact, for Ctrl, NMIIA KD and NMIIB KD cell doublets. n = 34, 21 and 28 cell doublets for Ctrl, NMIIA KD and NMIIB KD cells respectively, from four independent experiments. (g) Box and whiskers graphs showing the junction straightness (calculated as the euclidean/accumulated length ratio) in Ctrl, NMIIA KD and NMIIB KD cell doublets 2 hr after contact. n = 12, 15 and 17 cell doublets for Ctrl, NMIIA KD and NMIIB KD cells respectively, from three independent experiments. (h) Box and whiskers graph showing the angular deviation of junctions during the three first hours of contact in Ctrl, NMIIA KD and NMIIB KD cell doublets. n = 35, 30 and 32 cell doublets for Ctrl, NMIIA KD and NMIIB KD cells respectively, from four independent experiments. (f–h) Mann-Whitney statistical tests were applied for p value. (i) Representative spinning disk GFP-E-cadherin image sequences over a time course of 4 hr showing the dynamics of junction formation at high magnification in Ctrl, NMIIA KD and NMIIB KD MDCK cells. The red arrows point at junctional extensions typically observed in NMIIB KD doublets. Scale bar: 10 µm.
-
Figure 2—source data 1
NMIIA and NMIIB are both required for proper junction biogenesis.
- https://doi.org/10.7554/eLife.46599.010
Figure 2—figure supplement 1

Isoform-specific NMII Knock-down in MDCK cells.
(a, b) Original uncropped Immunoblots presented in Figure 2a (a) and 2b (b).
Figure 3 with 2 supplements

NMIIB, but not NMIIA, localizes to early AJs.
(a, b) Representative confocal images and zoom boxes of GFP-E-cadherin-expressing MDCK cell doublets fixed 20 hr after BCN-RGD addition and immuno-stained for NMIIA (a) or NMIIB (b) Scale bar: 10 µm. (c, d) Relative intensity profiles (raw and smoothed data) of GFP-E-cadherin and NMIIA (c) or NMIIB (d) signals along the lines represented in (a) and (b) respectively. (e) Box and whiskers graphs showing the Pearson’s coefficient values that reflects the co-localization of NMIIA, NMIIB with E-cadherin quantitatively. n = 9 to 24 junctions. Mann-Whitney statistical tests were applied for p value. (f, g) Representative confocal images of WT MDCK cells plated on fibronectin-coated glass for 1 or 3 days and stained for F-actin, NMIIA (f) and NMIIB (g). Scale bar: 10 µm.
-
Figure 3—source data 1
NMIIB, but not NMIIA, localizes to early AJs.
- https://doi.org/10.7554/eLife.46599.017
Figure 3—figure supplement 1
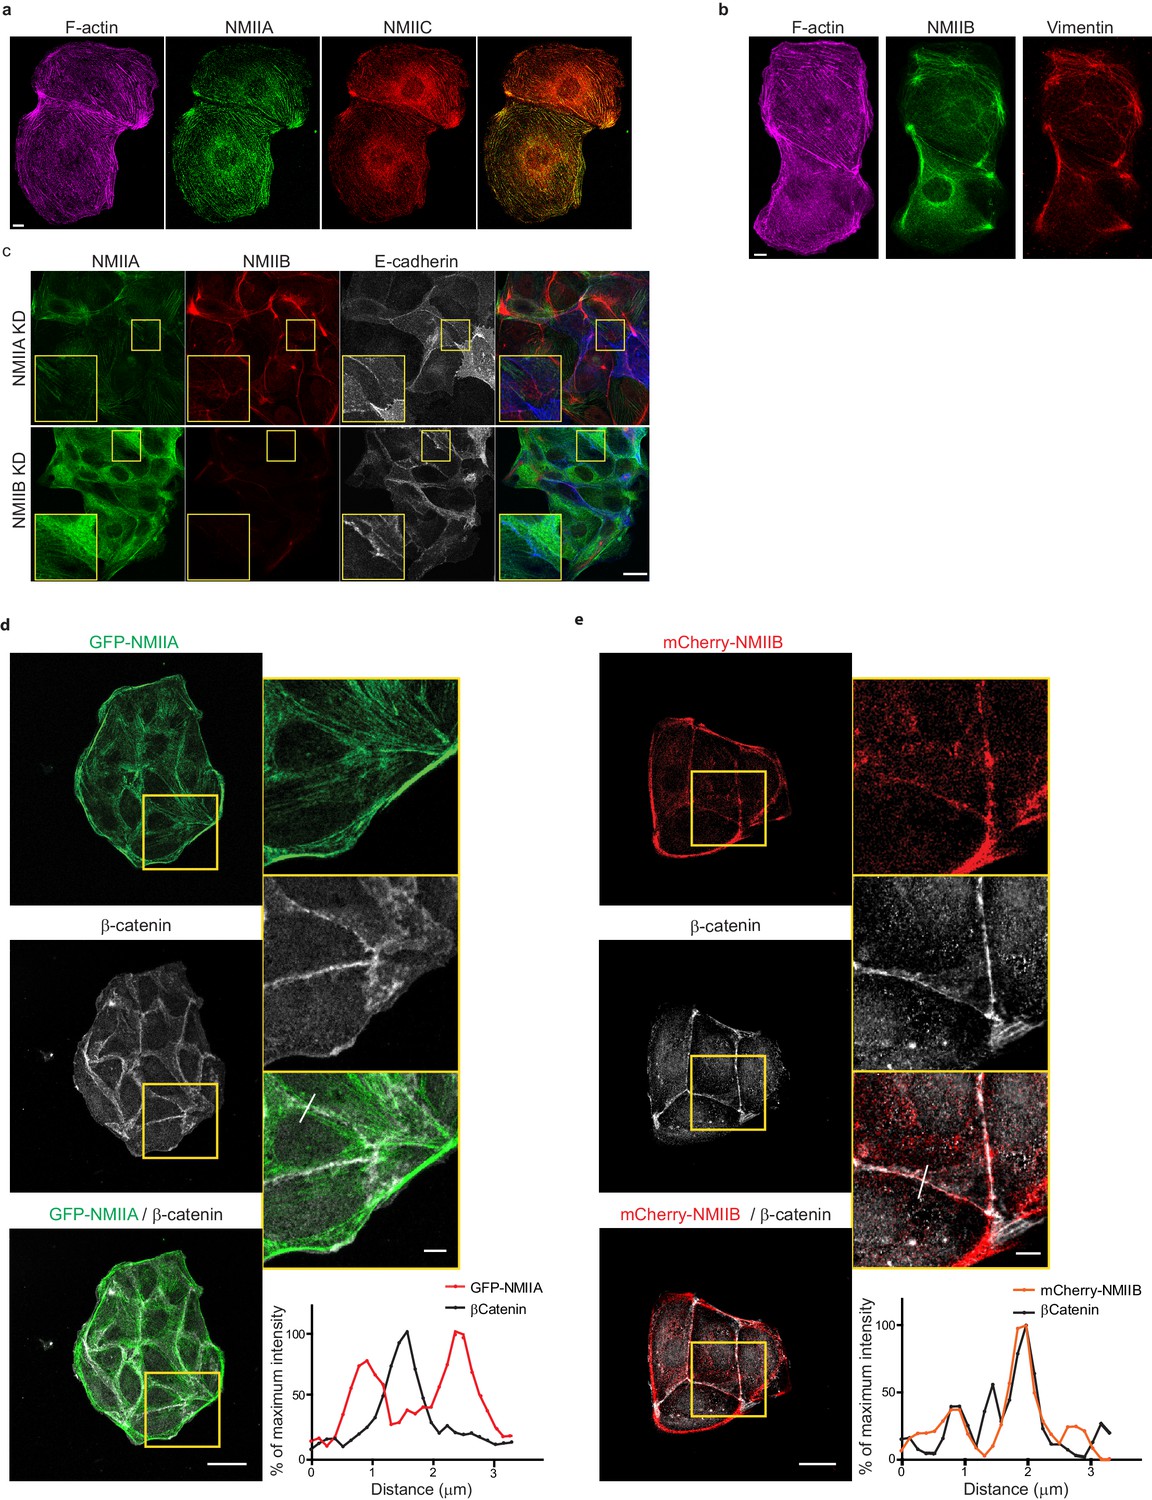
NMIIA and NMIIB exhibit differential localizations in early AJs.
(a, b) Representative confocal images of MDCK cell doublets fixed 20 hr after BCN-RGD addition and stained for F-actin, NMIIA and NMIIC (a) or F-actin, NMIIB and Vimentin (b) as indicated. Scale bar: 10 µm. (c) Representative confocal images of NMIIA KD and NMIIB KD MDCK cells plated at low density on fibronectin, fixed after 12 hr and immuno-stained for NMIIA, NMIIB and E-cadherin. Scale bar: 20 µm. (d, e) Representative confocal images with zoom boxes of WT MDCK cells transfected with GFP-NMIIA (d) or mCherry-NMIIB, plated on fibronectin-coated glass for 1 day and immuno-stained for β-catenin, relative intensity profiles of β-catenin and NMIIA or NMIIB signals along the lines represented in (d) and (e) respectively. Scale bar: 20 µm in original and 5 µm in zoomed images.
-
Figure 3—figure supplement 1—source data 1
NMIIA and NMIIB exhibit differential localizations in early AJs.
- https://doi.org/10.7554/eLife.46599.014
Figure 3—figure supplement 2

NMIIB, but not NMIIA, localizes to early epithelial AJs.
(a) Representative confocal images of WT MDCK cells plated on fibronectin-coated glass for 1 or 3 days and stained for F-actin, NMIIA and NMIIB. Scale bar: 10 µm. (b) Representative confocal images of CaCo2 cells plated on fibronectin-coated glass and stained for F-actin, NMIIA and NMIIB. Scale bar: 10 µm. (c) Representative confocal images and zoom boxes of WT (upper panel) or α-catenin KD (lower panel) MDCK cells fixed 20 hr after BCN-RGD addition and immuno-stained for NMIIA and NMIIB. White arrow heads indicate the cell-cell contact which is depicted as a dotted line in α-catenin KD MDCK cells. Scale bar: 10 µm. (d) Relative intensity profiles of NMIIA and NMIIB signals within WT or α-catenin KD cell-cell contacts along the lines represented in (c). (e) Representative epifluorescence images and zoom boxes of WT MDCK cells fixed 20 hr after BCN-RGD addition and immuno-stained for Arp3, NMIIB and F-actin. Scale bar: 10 µm. (f) Relative intensity profiles of Arp3, NMIIB and F-actin signals along the line represented in (e).
-
Figure 3—figure supplement 2—source data 1
NMIIB, but not NMIIA, localizes to early epithelial AJs.
- https://doi.org/10.7554/eLife.46599.016
Figure 4
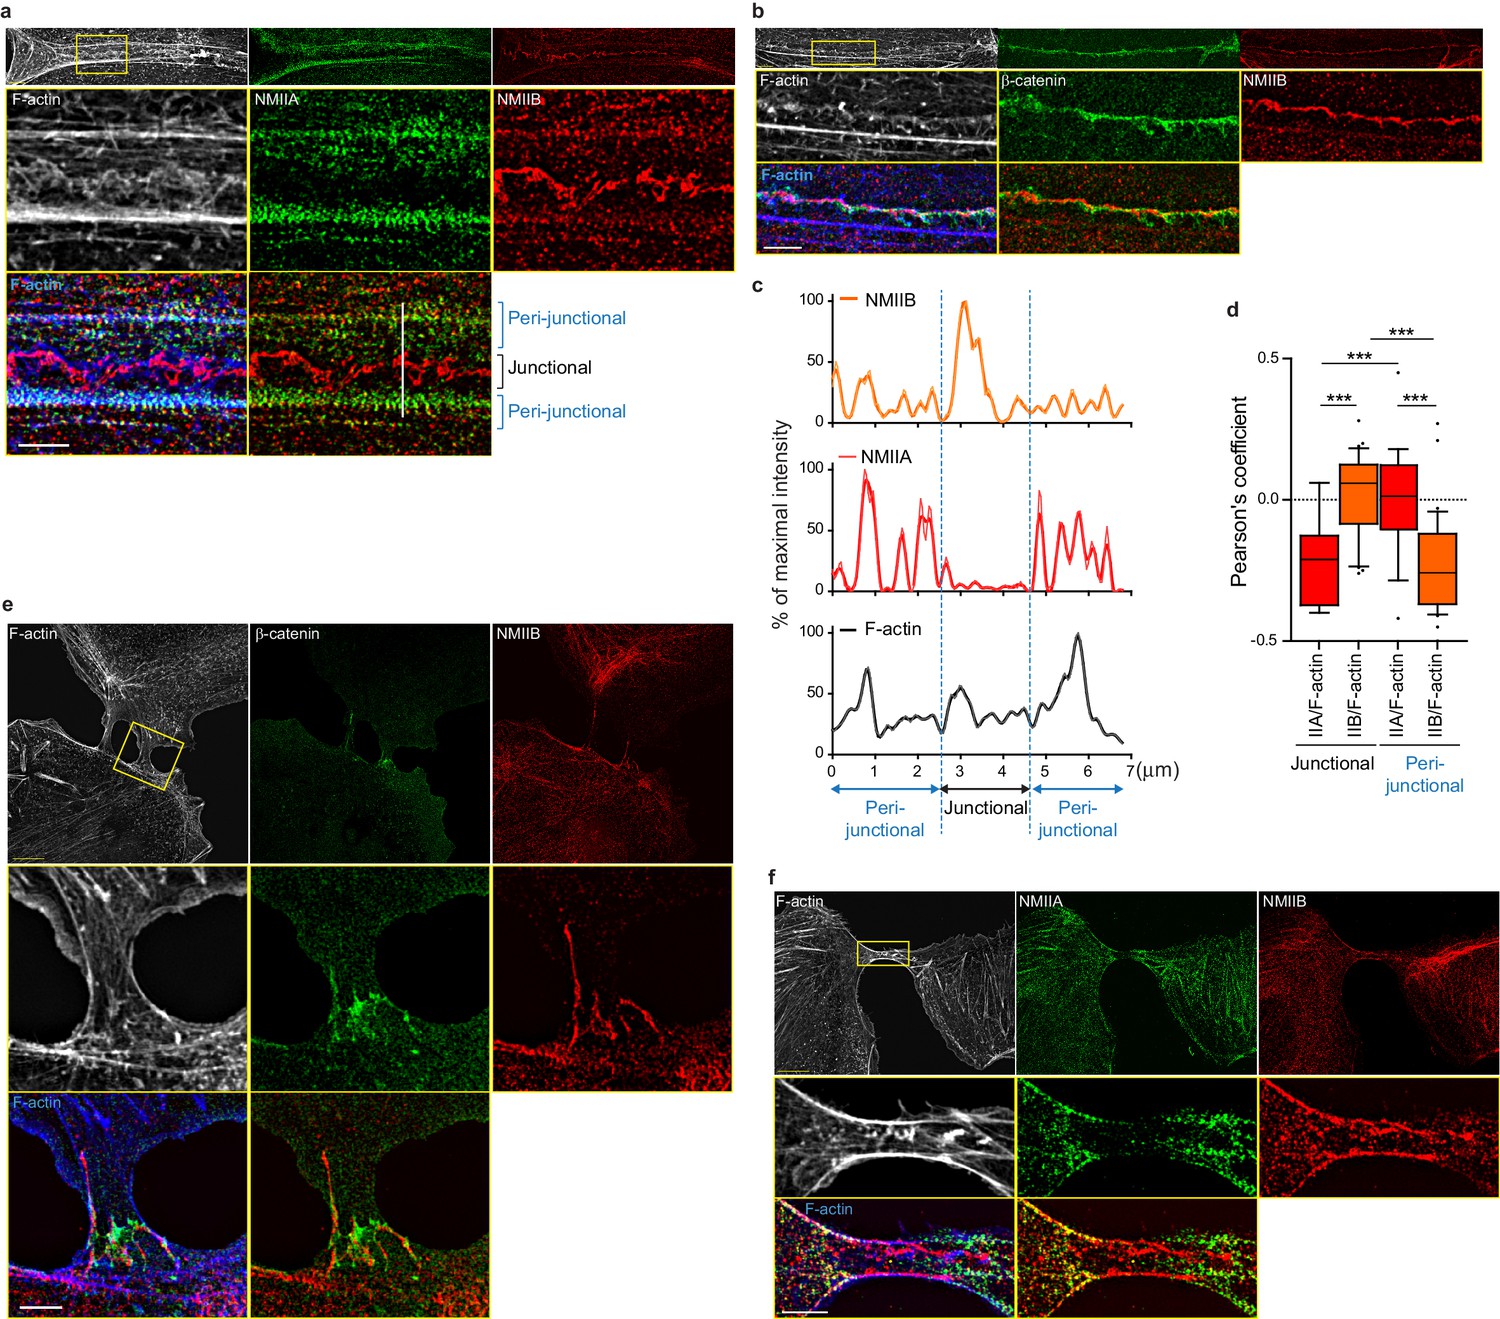
NMIIB localizes to a junctional actin network distinct from NMIIA-associated actin.
(a–b) SIM (Structured Illumination Microscopy) images of WT MDCK cells fixed 20 hr after addition of BCN-RGD and stained as indicated. Scale bar: 3 µm. (c) Relative intensity profiles (raw and smoothed data) of NMIIB, NMIIA and F-actin signals along the line represented in (a). (d) Box and whiskers graphs showing the Pearson’s coefficient values that reflects the co-localization of F-actin and NMIIA or NMIIB in junctional and peri-junctional areas. n = 18 to 33 junctions. For p values, pairwise t tests were applied to compare junctional vs perijunctional data for the same isoform and Mann-Whitney statistical tests to compare the two isoforms. (e, f). SIM images of nascent contacts formed between WT MDCK cells. Scale bar: 3 µm.
-
Figure 4—source data 1
NMIIB localizes to a junctional actin network distinct from NMIIA-associated actin.
- https://doi.org/10.7554/eLife.46599.019
Figure 5 with 1 supplement
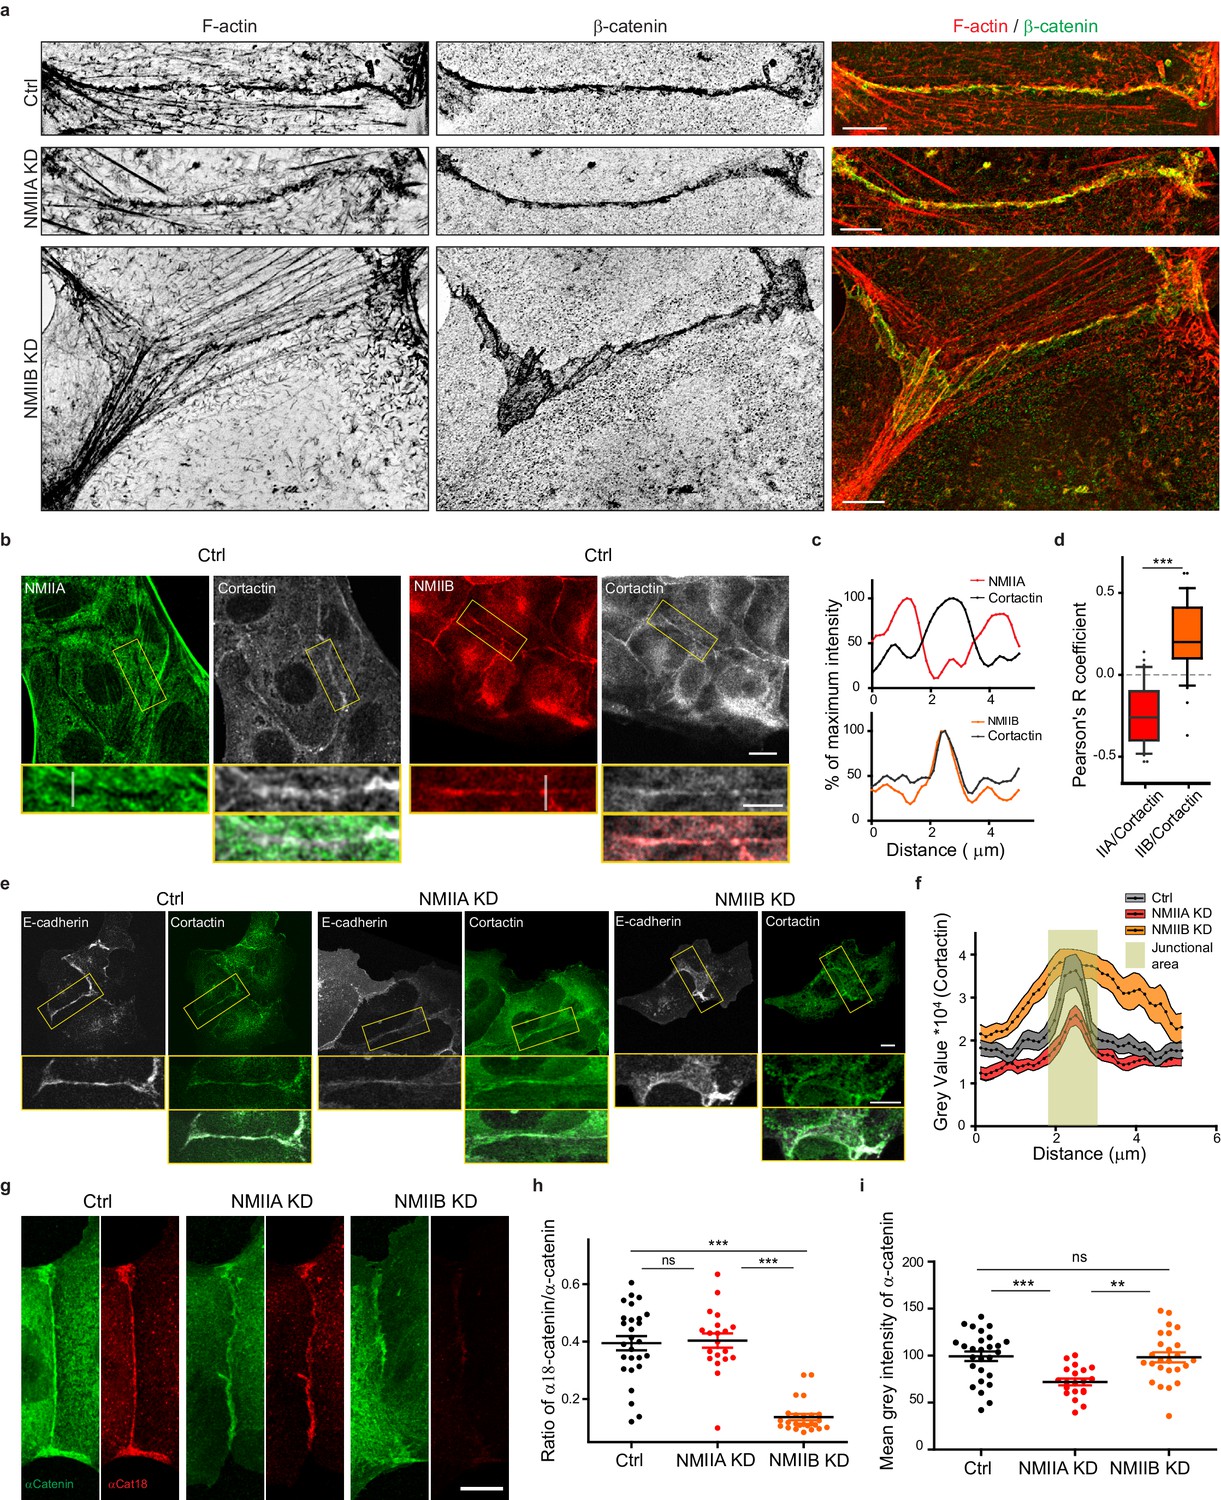
NMIIB supports juxtamembrane actin organization and regulates α-catenin unfolding.
(a) SIM (Structured Illumination Microscopy) images of junctional areas from Ctrl, NMIIA KD and NMIIB KD cells fixed 20 hr after addition of BCN-RGD and stained for F-actin and β-catenin. Scale bar: 5 µm. (b) Representative confocal images with zoom boxes of Ctrl MDCK cells. (c) Relative intensity profiles of cortactin and NMIIA or NMIIB signals along the lines represented in (b, d). Box and whiskers graphs showing the Pearson’s coefficient values for co-localization of cortactin with NMIIA or NMIIB at cell-cell junctions n = 31 and 36 junctions respectively, Mann-Whitney statistical tests were applied for p value. (e) Ctrl, NMIIA KD and NMIIB KD cells stained for NMIIA, NMIIB and cortactin as indicated. Scale bars: 10 µm in original and 5 µm in zoomed images. (f) Relative intensity distribution profiles of cortactin signal along lines drawn perpendicular to junction in Ctrl, NMIIA KD and NMIIB KD cells, n = 15 cell-cell junctions respectively. (g) Representative confocal images of junctional area from Ctrl, NMIIA KD and NMIIB KD cells stained for α-catenin and α-cat18. Scale bar: 10 µm. (h, i) Scatter plots with mean + /- SEM showing the ratio of junctional α-cat18/α-catenin signals (h) and the mean intensity levels of α-catenin signal at the junction (i) n = 27, 20, 25 cell doublets for Ctrl, NMIIAKD and NMIIBKD, respectively from two independent experiments. Kruskal-Wallis statistical tests were applied for p value.
-
Figure 5—source data 1
NMIIB supports juxtamembrane actin organization and regulates α-catenin unfolding.
- https://doi.org/10.7554/eLife.46599.022
Figure 5—figure supplement 1
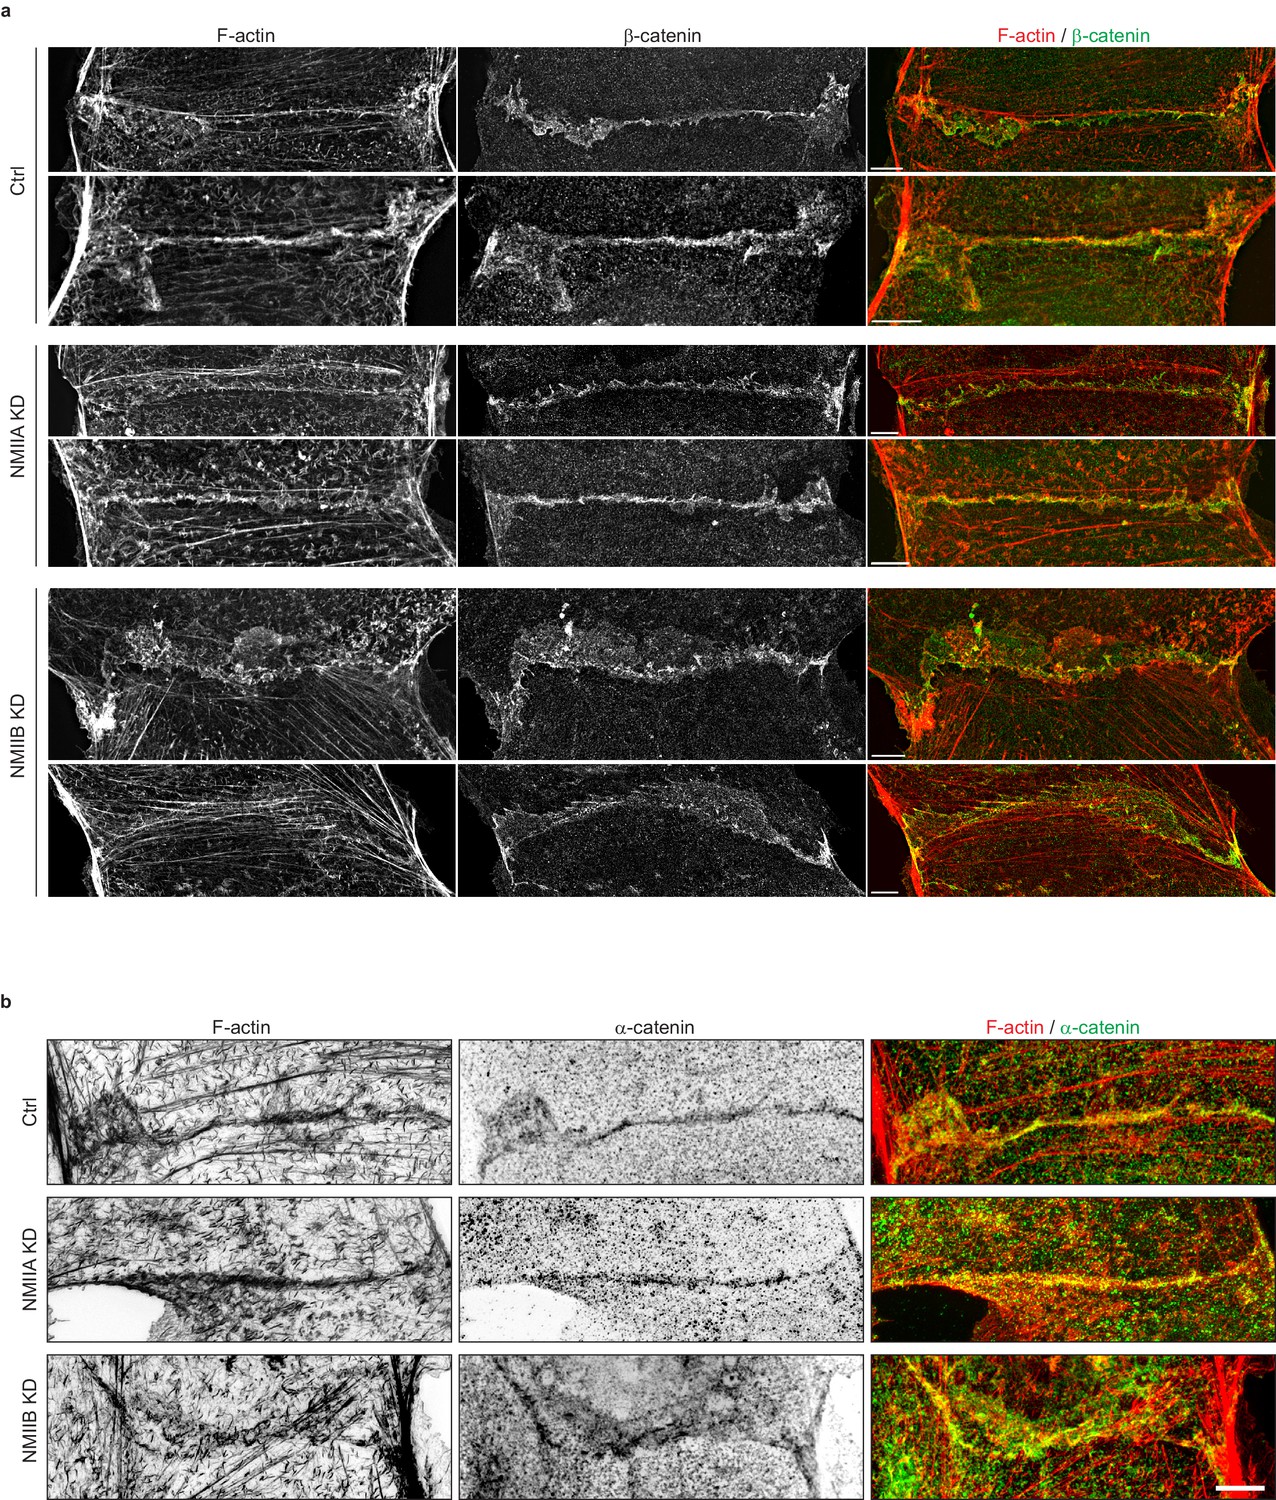
NMIIB supports junctional actin organization.
Related to Figure 5a: other examples of junctional actin organization in Ctrl, NMIIA KD and NMIIB KD cells. (a, b) SIM (Structured Illumination Microscopy) images of junctional area from Ctrl, NMIIA KD and NMIIB KD cells fixed 20 hr after addition of BCN-RGD and stained for F-actin and β-catenin (a) or α-catenin (b) Scale bar: 5 µm.
Figure 6 with 3 supplements
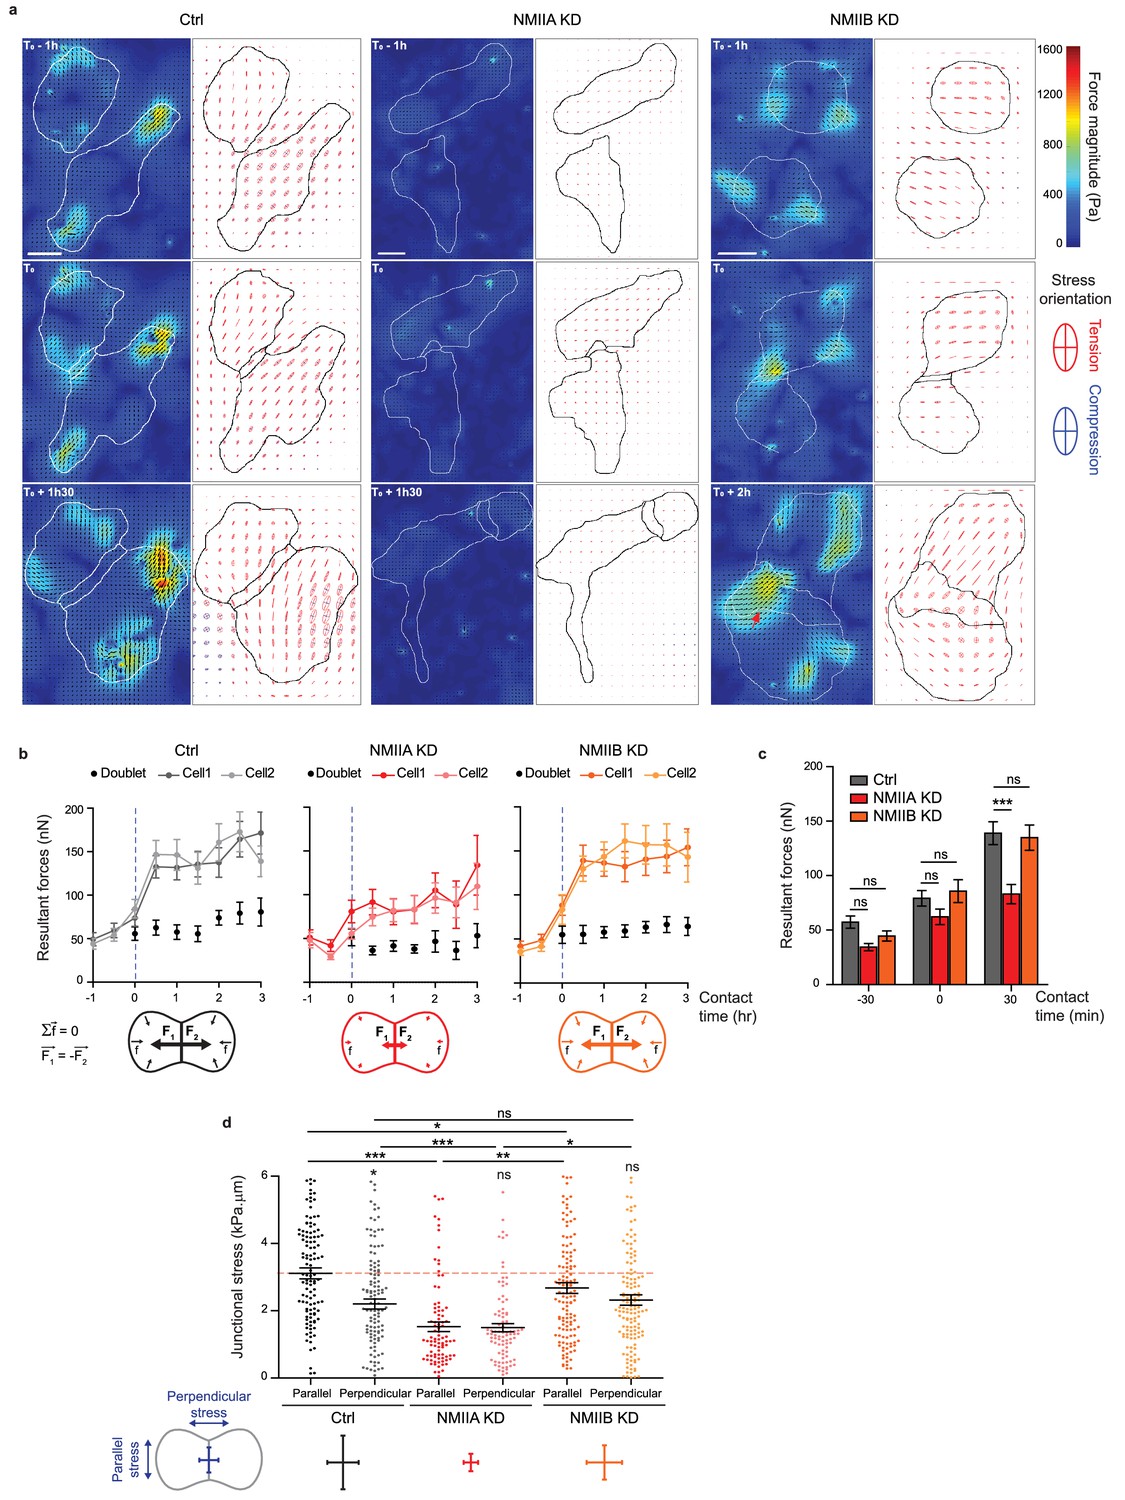
NMIIA and NMIIB are both required for establishment of proper inter-cellular stress.
(a) Heat map with vectorial field of traction forces (left panels) and ellipse representation of intra-cellular stress (right panel, the two axes represent the direction and magnitude of the principal components of the stress tensor, positive values in red, negative values in blue) of inter-cellular stress (right panels) in Ctrl, NMIIA KD and NMIIB KD cell pairs before, during and after contact on fibronectin-coated PDMS deformable substrate (30 KPa). Cell contours are drawn in black. The red arrows indicate a hotspot of traction forces observed frequently in NMIIB KD cell doublets. Scale bar: 10 µm. (b) Linear graphs representing the resultant forces of cell doublets and individual cells before, during and after contact in Ctrl, NMIIA KD and NMIIB KD. Data are represented as mean + /- SEM. (c) The same data as in (b) were represented as bar graph with mean + /- SEM for statistical comparisons between Ctrl, NMIIA KD and NMIIB KD cells 30 min before, during and 30 min after contact. Bonferroni statistical tests were applied for p value. (d) Scatter plots with mean + /- SEM representing inter-cellular stress in the junctional area in Ctrl, NMIIA KD and NMIIB KD cells within the first 3 hr of contact. For each junction, six values corresponding to 30 min time points are plotted. The stress orientation was divided in the parallel and perpendicular components relative to the main axis of the junction. Pairwise statistical t tests (for intra-group comparisons) and Mann-Whitney statistical t tests were applied for p value. (b–d) n = 25, 26 and 28 cell doublets for Ctrl, NMIIA KD and NMIIB KD, respectively, from three independent experiments.
-
Figure 6—source data 1
NMIIA and NMIIB are both required for establishment of proper inter-cellular stress.
- https://doi.org/10.7554/eLife.46599.030
Figure 6—figure supplement 1
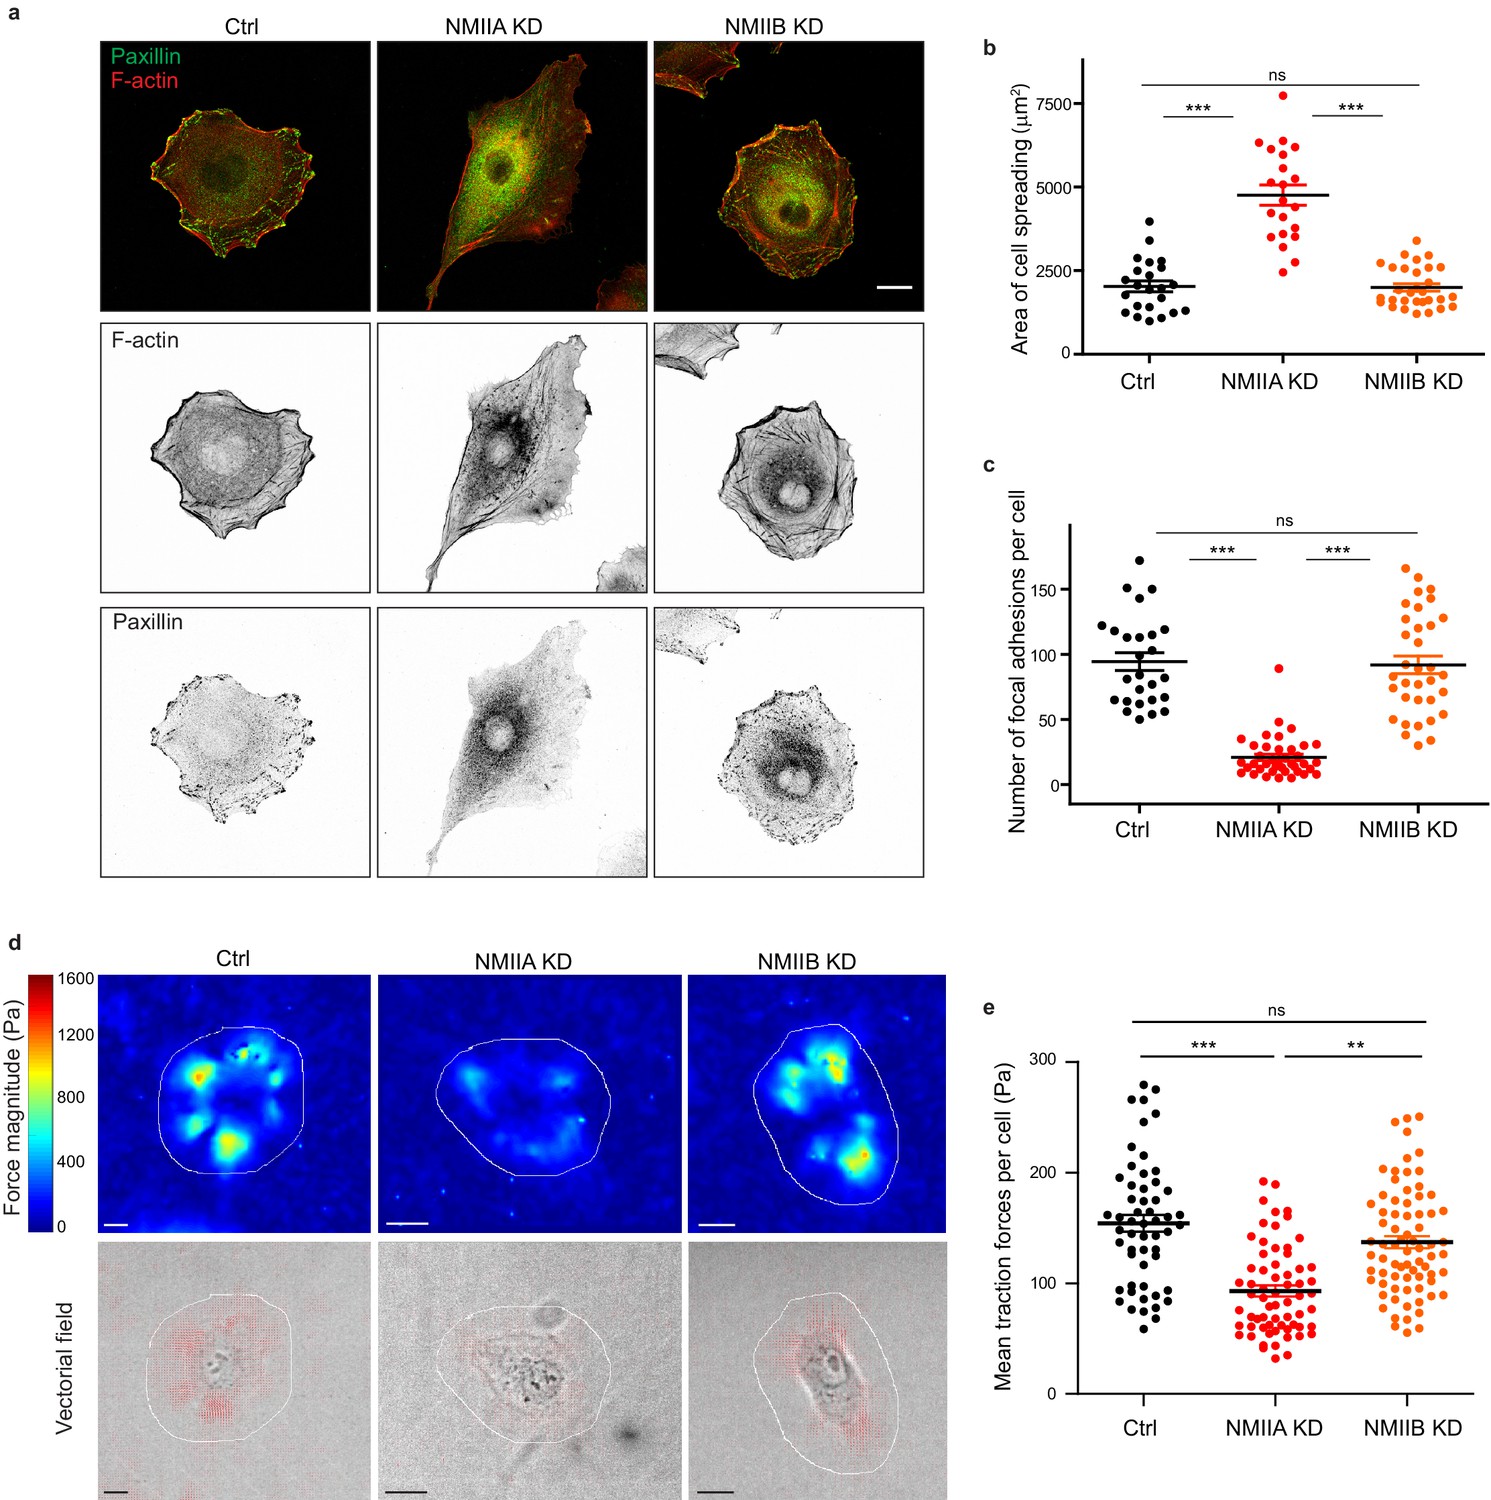
NMIIA regulates cell adhesion and traction forces on fibronectin.
(a) Representative confocal images of paxillin and F-actin staining of Ctrl, NMIIA KD and NMIIB KD single cells plated on fibronectin-coated glass coverslip for 16 hr. Scale bar: 10 µm. (b, c) Scatter plots with mean + /- SEM showing the spreading area (b) and number of focal adhesions (c) of Ctrl, NMIIA KD and NMIIB KD single cells plated on fibronectin for 16 hr. n = 23, 21 and 30 cells for (b) and 26, 39 and 34 cells for (c) from two independent experiments. Kruskal-Wallis statistical tests were applied for p value. (d) Heat map (upper panel) and vectorial field (lower panel) representing respectively the magnitude and the orientation of traction forces exerted by the single Ctrl, NMIIA KD and NMIIB KD cells, on fibronectin-coated PDMS deformable substrate (30 KPa). Cell masks used for quantification are drawn in white. Scale bar: 10 µm. (e) Scatter plots with mean + /- SEM showing the mean traction forces exerted by single Ctrl, NMIIA KD and NMIIB KD cells. n = 55, 65 and 74 cells, respectively, from three independent experiments. Kruskall-Wallis statistical tests were applied for p value.
-
Figure 6—figure supplement 1—source data 1
NMIIA regulates cell adhesion and traction forces on fibronectin.
- https://doi.org/10.7554/eLife.46599.025
Figure 6—figure supplement 2
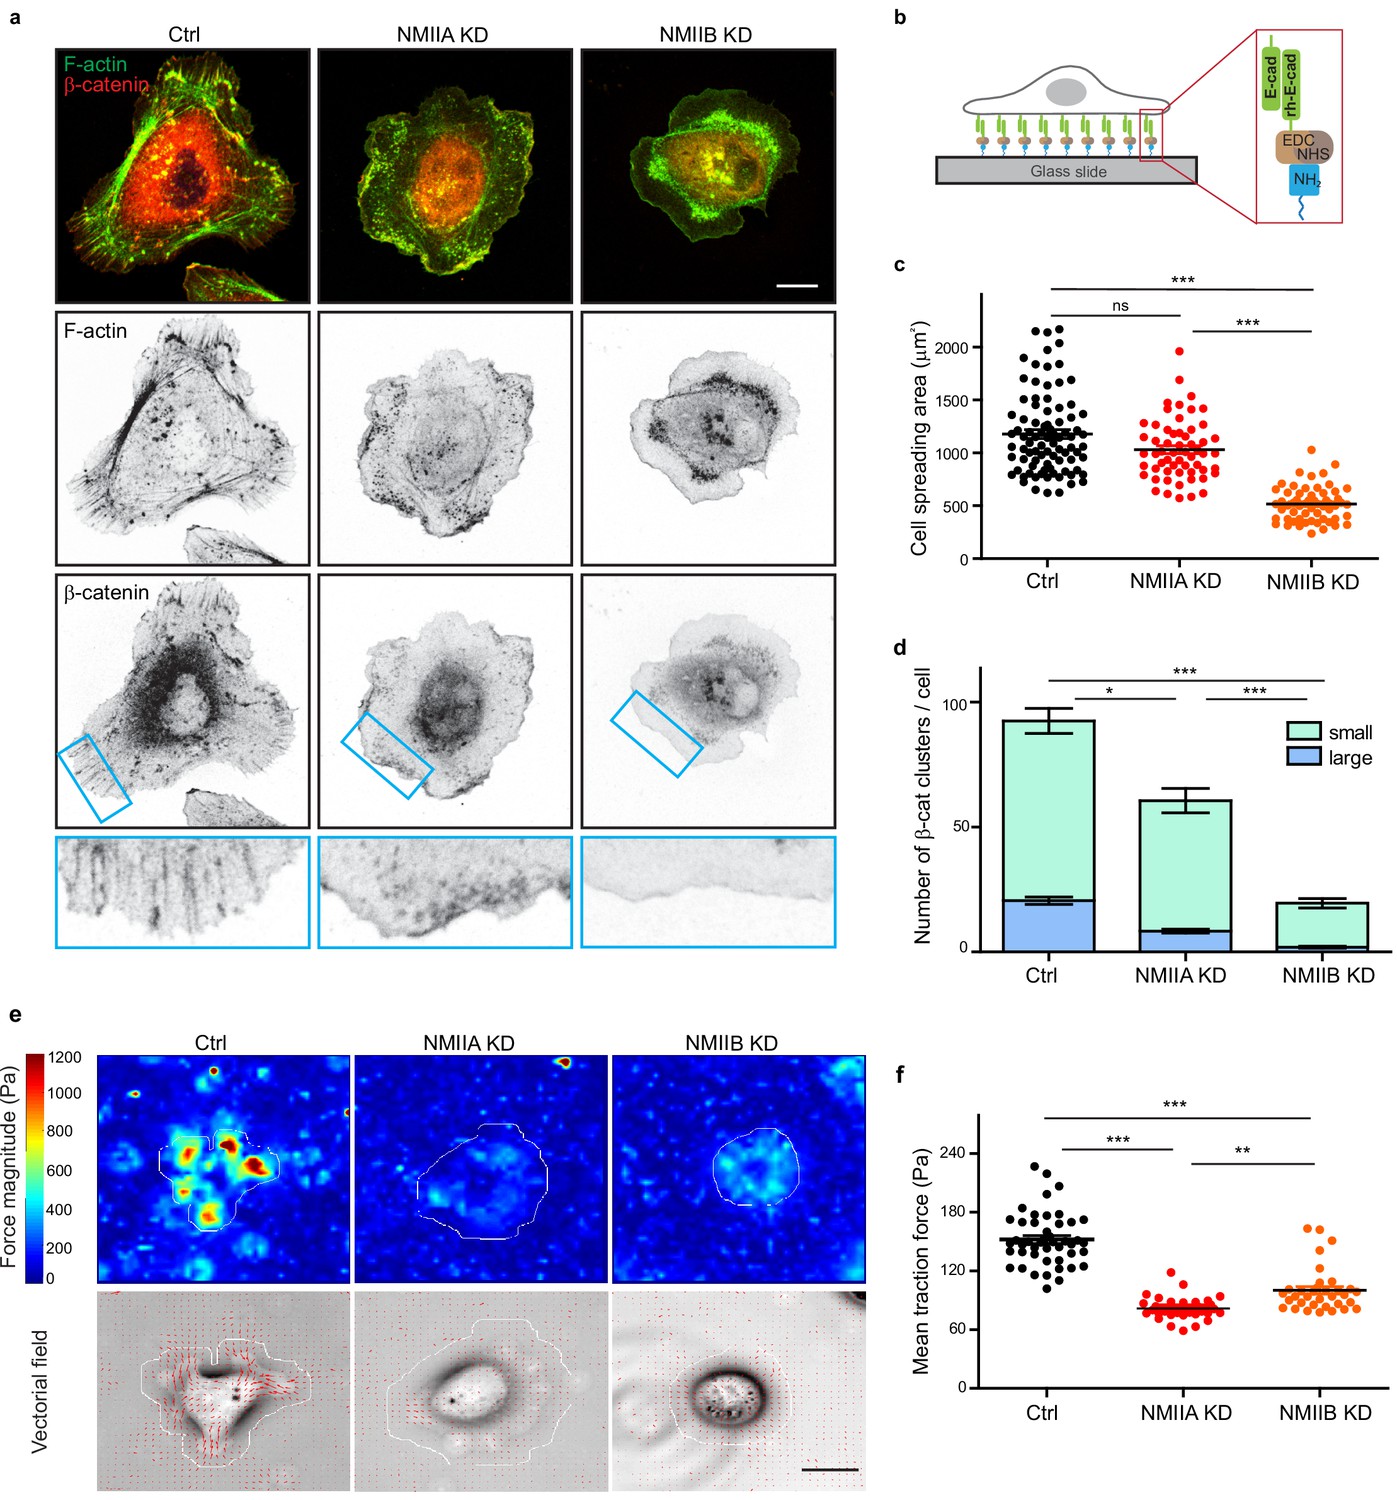
NMIIB favors E-cadherin clustering on E-cadherin-coated substrate.
(a) Confocal images with zoom boxes of Ctrl, NMIIA KD and NMIIB KD cells plated on E-cadherin-coated glass for 6 hr and immuno-stained for β-catenin and F-actin. Scale bar: 10 µm. (b) Scheme depicting the experimental set-up. (c) Scatter plots with mean + /- SEM showing the cell spreading area of Ctrl, NMIIA KD and NMIIB KD cells plated on E-cadherin coated glass after 6 hr. n = 87, 58 and 58 cells respectively from two independent experiments. Kruskal-Wallis statistical tests were applied for p value. (d) Bar graph showing the number of β-catenin clusters per cell in Ctrl, NMIIA KD and NMIIB KD cells plated on E-cadherin coated glass. The clusters were classified in two categories: large clusters with area larger than 1 µm², and small clusters with area ranging from 0.2 µm² to 1 µm². Data are represented as mean + /- SEM, n = 26, 27 and 26 cells respectively from two independent experiments. Kruskal-Wallis statistical test were applied for p value (e) Heat map (top panel) and vectorial field (bottom panel) representing respectively the magnitude and the orientation of traction forces exerted by the single Ctrl, NMIIA KD and NMIIB KD cells on E-cadherin coated PDMS deformable gels (15 KPa). Cell masks used for quantification are drawn in white. Scale bar: 20 µm. (f) Scatter plots with mean + /- SEM showing the mean traction forces exerted by Ctrl, NMIIA KD and NMIIB KD cells on E-cadherin coated PDMS deformable gels (15 KPa). n = 46, 34 and 34 cells respectively from two independent experiments. Kruskal-Wallis statistical tests were applied for p value.
-
Figure 6—figure supplement 2—source data 1
NMIIB favors E-cadherin clustering on E-cadherin-coated substrate.
- https://doi.org/10.7554/eLife.46599.027
Figure 6—figure supplement 3

NMIIA and NMIIB are both required for establishment of proper inter-cellular stress.
(a) Scheme depicting the junction subdomains and the orientation of traction forces relative to the junction axis quantified in (b) and (c). (b, c) Scatter plots with mean + /- SEM representing the orientation of mean traction forces (b) and the ratio of parallel/perpendicular traction forces (c) in subdomains of the junction in Ctrl and NMIIB KD cells within the first 3 hr of contact. For each junction, six values corresponding to 30 min time points are plotted. Pairwise statistical t tests (for intra-group comparisons) and Mann-Whitney statistical t tests were applied for p value. n = 25 and 28 cell doublets respectively from three independent experiments. (d) Scheme depicting the orientation of inter-cellular stress relative to the junction axis quantified in (e). (e) Linear graph of parallel (left panel) and perpendicular (right panel) inter-cellular stress at the junction within the first 3 hr after contact in Ctrl, NMIIA KD and NMIIB KD cells. Data are represented as mean + /- SEM. n = 25, 26 and 28 cell doublets for Ctrl, NMIIA KD and NMIIB KD respectively from three independent experiments.
-
Figure 6—figure supplement 3—source data 1
NMIIA and NMIIB are both required for establishment of proper inter-cellular stress.
- https://doi.org/10.7554/eLife.46599.029
Figure 7
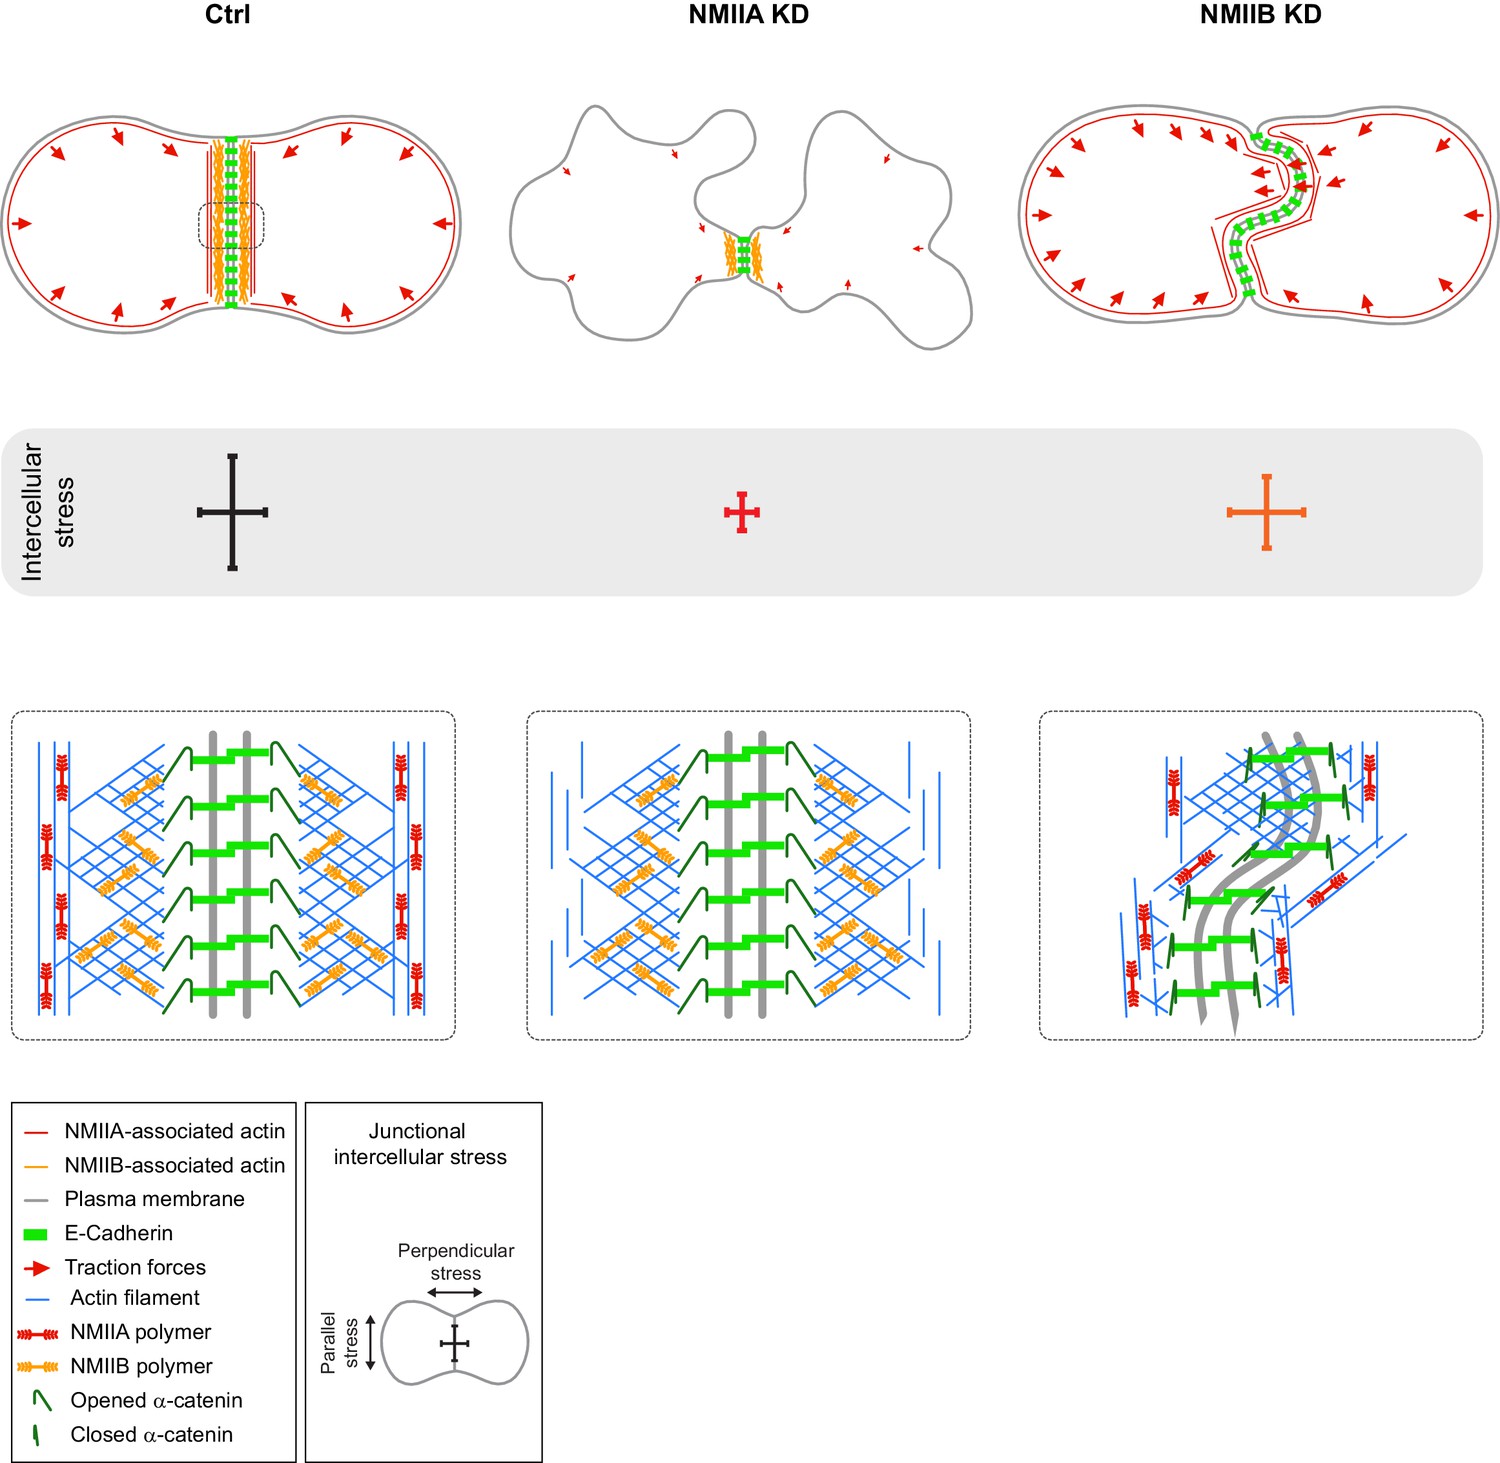
Proposed model for the role of NMIIA and NMIIB during junction biogenesis.
Upper panels: organization of early cell-cell contacts of Ctrl, NMIIA KD and NMIIB KD cells. Lower panels: proposed molecular organization of early junctions. Middle panels: distribution of intercellular stress. Ctrl cells establish stable and straight junctions maintained under an anisotropic intercellular stress preeminent parallel to the junction. NMIIB associates to- and organizes the junctional branched actin meshwork. NMIIA, which provides mechanical tugging force, sits on distant perijunctional actin bundles parallel to the junction. NMIIA KD cells fail to maintain stable cell-cell contacts exhibit shorter junctions, weak traction forces and weak intercellular stress. Perijunctional actin bundles are smaller and disorganized. NMIIB KD cells establish persistent but wavy junctions from which lamellipodial extensions and traction force hotspots arise. The junctional branched actin meshwork is disorganized which probably prevents α-catenin opening and induces the formation of lamellipodial extensions. The anchoring of perijunctional actin bundles to the junction is perturbed, despite the presence of NMIIA. There is, in these cells, no preferential orientation of intercellular stress.
Author response image 1
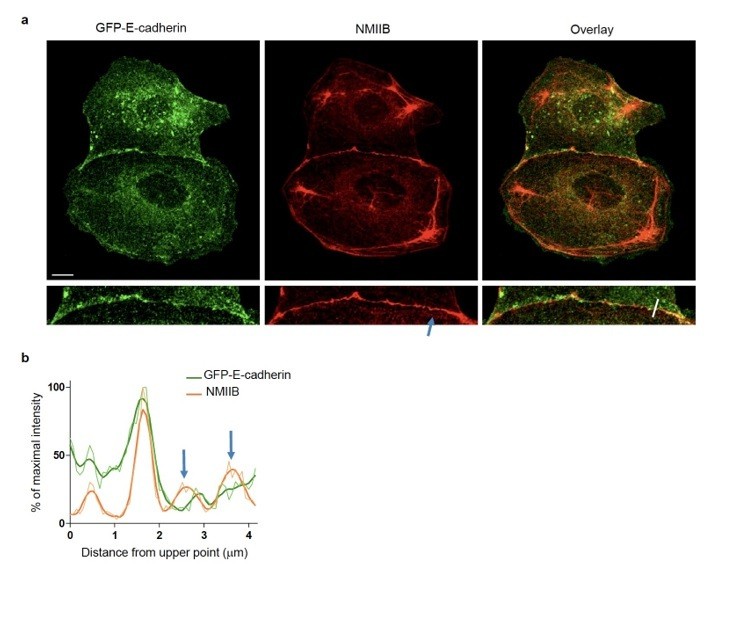
NMIIB localizes to early AJs.
(a) Representative confocal images and zoom boxes of GFP-E-cadherin-expressing MDCK cell doublets fixed 20h after BCN-RGD addition and immuno-stained for NMIIB. Scale bar: 10 μm. (b) Relative intensity profiles (raw and smoothed data) of GFP-E-cadherin and NMIIB signals along the line represented in (a). Blue arrows point at NMIIB that sits on parallel perijunctional F-actin cables.
Videos
Video 1
Dynamic of junction formation on reversible micropatterns.
Spinning disk movie showing contact formation between two MDCK cells expressing GFP-E-cadherin and stained with Hoechst. Scale bar: 10 µm.
Video 2
Dynamic of junction formation in Y27-treated cells.
Spinning disk movie of MDCK cells expressing GFP-E-cadherin, stained with Hoechst and treated with 50 µM Y27. Scale bar: 10 µm.
Video 3
Dynamic of junction formation in Ctrl, NMIIA KD and NMIIB KD cells.
Epi-fluorescence movies of Ctrl, NMIIA KD and NMIIB KD MDCK cells expressing GFP-E-cadherin. Scale bar: 10 µm.
Tables
Key resources table
| Reagent type (species) or resource | Designation | Source or reference | Identifiers | Additional information |
|---|---|---|---|---|
| Cell line (Canis familiaris, dog) | MDCK | ATCC | ATCC CCL-34 | |
| Cell line (H. sapiens) | Caco-2 | ATCC | ATCC HTB-37 | Kindly provided by S.Robine (Institut Cuire/CNRS, Paris) |
| Antibody | anti-NMIIA rabbit polyclonal | Biolegend | 909801 | 1/100 for IF and 1/1000 for WB |
| Antibody | anti-NMIIA mouse monoclonal | Abcam | ab55456 | 1/100 for IF and 1/1000 for WB |
| Antibody | rabbit anti-NMIIB polyclonal | Biolegend | 909901 | 1/100 for IF and 1/1000 for WB |
| Antibody | anti-β-catenin rabbit polyclonal | Sigma-Aldrich | C2206 | 1/100 for IF |
| Antibody | anti-β-catenin mouse monoclonal | BD Biosciences | 610156 | 1/100 for IF |
| Antibody | recombinant anti-paxillin rabbit monoclonal antibody | Abcam | Ab32084 | 1/100 for IF |
| Antibody | mouse anti-GAPDH | ProteinTech | 60004–1-Ig | 1/100 for IF |
| Antibody | mouse anti-Arp3 | Sigma-Aldrich | A5979 | 1/100 for IF |
| Antibody | mouse anti-E-cadherin | BD Biosciences | 610181 | 1/100 for IF |
| Antibody | rabbit anti-α-catenin polyclonal | Sigma-Aldrich | C-2081 | 1/100 for IF |
| Antibody | rat anti-α18-catenin monoclonal | generously provided by A. Nagafuchi, (Kumamoto University, Japan) | 1/100 for IF | |
| Antibody | Alexa488- | Life Technologies | A11039, A11055, A11013 | 1/250 for IF |
| Antibody | Alexa568- | Life Technologies | A11004, A11011, A11077 | 1/250 for IF |
| Antibody | Alexa647- | Life Technologies | A31571, A31573 | 1/250 for IF |
| Chemical compound, drug | Alexa (488) -coupled phalloidins | Invitrogen | A12379 | 1/250 for IF |
| Chemical compound, drug | Alexa (555 or 647) -coupled phalloidins | Life Technologies | A34055, A22287 | 1/250 for IF |
| Other | Hoechst 34580 | ThermoFisher | H3570 | 1/10000 for IF |
| Antibody | Horseradish peroxidase-coupled anti-mouse IgGs | Sigma-Aldrich | A9044 | 1/10000 for WB |
| Antibody | Horseradish peroxidase-coupled anti-rabbit IgGs | Pierce | 1/10000 for WB | |
| Chemical compound, drug | Mitomycin C | Sigma-Aldrich | M2487 | 10 μg/ml for 1 hr |
| Chemical compound, drug | Y-27632 dihydrochloride | Sigma-Aldrich | Y0503 | 50 μM |
| Other | APP (Azido-Poly-lysine Poly (ethylene glycol)) | Inspired protocol from M. van Dongen, Matthieu Piel | https://doi.org/10.1002/adma.201204474 | Inspired protocol from M. van Dongen, Matthieu Piel |
| Peptide, recombinant protein | BCN-RGD peptide (BCN: bicyclo[6.1.0]- nonyne, coupled to RGD: peptide sequence Arg-Gly-Asp) | Inspired protocol from M. van Dongen, Matthieu Piel | https://doi.org/10.1002/adma.201204474 | Inspired protocol from M. van Dongen, Matthieu Piel |
| Commercial assay or kit | DMEM (containing Glutamax, High Glucose and Pyruvate) | Life Technologies | 31966–021 | |
| Commercial assay or kit | Fluorobrite DMEM | Thermo Fisher | A18967-01 | |
| Commercial assay or kit | Penicillin/Streptomycin | Life Technologies | 15140–122 | |
| Commercial assay or kit | Foetal Bovine Serum | Life Technologies | S1810-500 | 10% FBS in DMEM |
| Commercial assay or kit | geneticin | Life Technologies | 10131–019 | |
| Chemical compound, drug | Trypsin | Life Technologies | 25300–054 | |
| Genetic reagent (Plasmid) | pLKO.1-puro | Sigma-Aldrich | SHC002 | |
| Genetic reagent (Plasmid) | MYH9 | Sigma-Aldrich | transcript ID: ENSCAFT00000002643.3 | TTGGAGCCATACAACAAATAC for NMIIA |
| Genetic reagent (Plasmid) | MYH10 | Sigma-Aldrich | transcript ID: ENSCAFT00000027478 | TCGGGCAGCTCTACAAAGAAT for NMIIB |
| Genetic reagent (Plasmid) | RFP-Pericentrin | kindly provided M. Coppey, Institut Jacques Monod, Paris | kindly provided M. Coppey, Institut Jacques Monod, Paris | |
| Genetic reagent (Plasmid) | m-Cherry cortactin | kindly provided by Alexis Gautreau, Biochemisty laboratory, Ecole polytechnique, France | https://portail.polytechnique.edu/bioc/en/gautreau | pcDNA5-FRT-GFP-mCherry-3pGW back bone (1740-pcDNAM FRTPC-mCherry Cortactine) |
| Genetic reagent (Plasmid) | mCherry Myosin IIB | Addgene | 55107 | |
| Genetic reagent (Plasmid) | CMV-GFP-NMHC II-A | Addgene | 11347 | |
| Chemical compound, drug | protease inhibitor cocktail | Roche | 27368400 | |
| Chemical compound, drug | phosphataseinhibitor (Phosphostop) | Roche | 4906837001 | |
| Commercial assay or kit | Bradford assay | BioRad | 500–0006 | |
| Commercial assay or kit | 4–12% Bis-Tris gel | Novex | NP0335 | |
| Commercial assay or kit | Supersignal west femto maximum sensitivity substrate | ThermoFisher | 34095 | |
| Commercial assay or kit | LookOut Mycoplasma PCR detection Kit | Sigma-Aldrich | MP0035 | |
| Chemical compound, drug | paraformaldehyde | Thermo Scientific | 22980 | |
| Chemical compound, drug | Fluoromount-G mounting media | Southern Biotech | ||
| Peptide, recombinant protein | fibronectin | Merck Millipore | FC010 | |
| Chemical compound, drug | APTES | Sigma-Aldrich | A3648 | |
| Chemical compound, drug | EDC-HCl | Thermo Scientific | 22980 | 2 mM freshly prepared in 0.1M MES pH4.7 |
| Chemical compound, drug | NHS | Sigma-Aldrich | 130672 | 5 mM |
| Peptide, recombinant protein | recombinant human E-cadherin | R and D systems | 8505-EC | 1 μg |
| Chemical compound, drug | Cy 52–276 A and Cy 52–276 B silicone elastomer | Dow corning | ||
| Chemical compound, drug | carboxylated red fluorescent beads | Invitrogen | F8801 | |
| Software, algorithm | FIJI-Image J | https://imagej.net/Fiji/Downloads | Image analysis were done using Fiji-Image J and plugins | |
| Software, algorithm | MATLAb | MATLAB | Traction force, PIV analysis were done using alogorithms developed in lab to analyse traction force | |
| Software, algorithm | Photoshop and Illustrator | Adobe | Images were mounted using these softwares | |
| Software, algorithm | GraphPad prism | GraphPad Prism | Graphs and statistical tests were done using GraphPad Prism |
Additional files
-
Transparent reporting form
- https://doi.org/10.7554/eLife.46599.032
Download links
A two-part list of links to download the article, or parts of the article, in various formats.
Downloads (link to download the article as PDF)
Open citations (links to open the citations from this article in various online reference manager services)
Cite this article (links to download the citations from this article in formats compatible with various reference manager tools)
Myosin II isoforms play distinct roles in adherens junction biogenesis
eLife 8:e46599.
https://doi.org/10.7554/eLife.46599


