Profiling the Escherichia coli membrane protein interactome captured in Peptidisc libraries
- University of British Columbia, Canada
- University of Regina, Canada
Figures
Figure 1
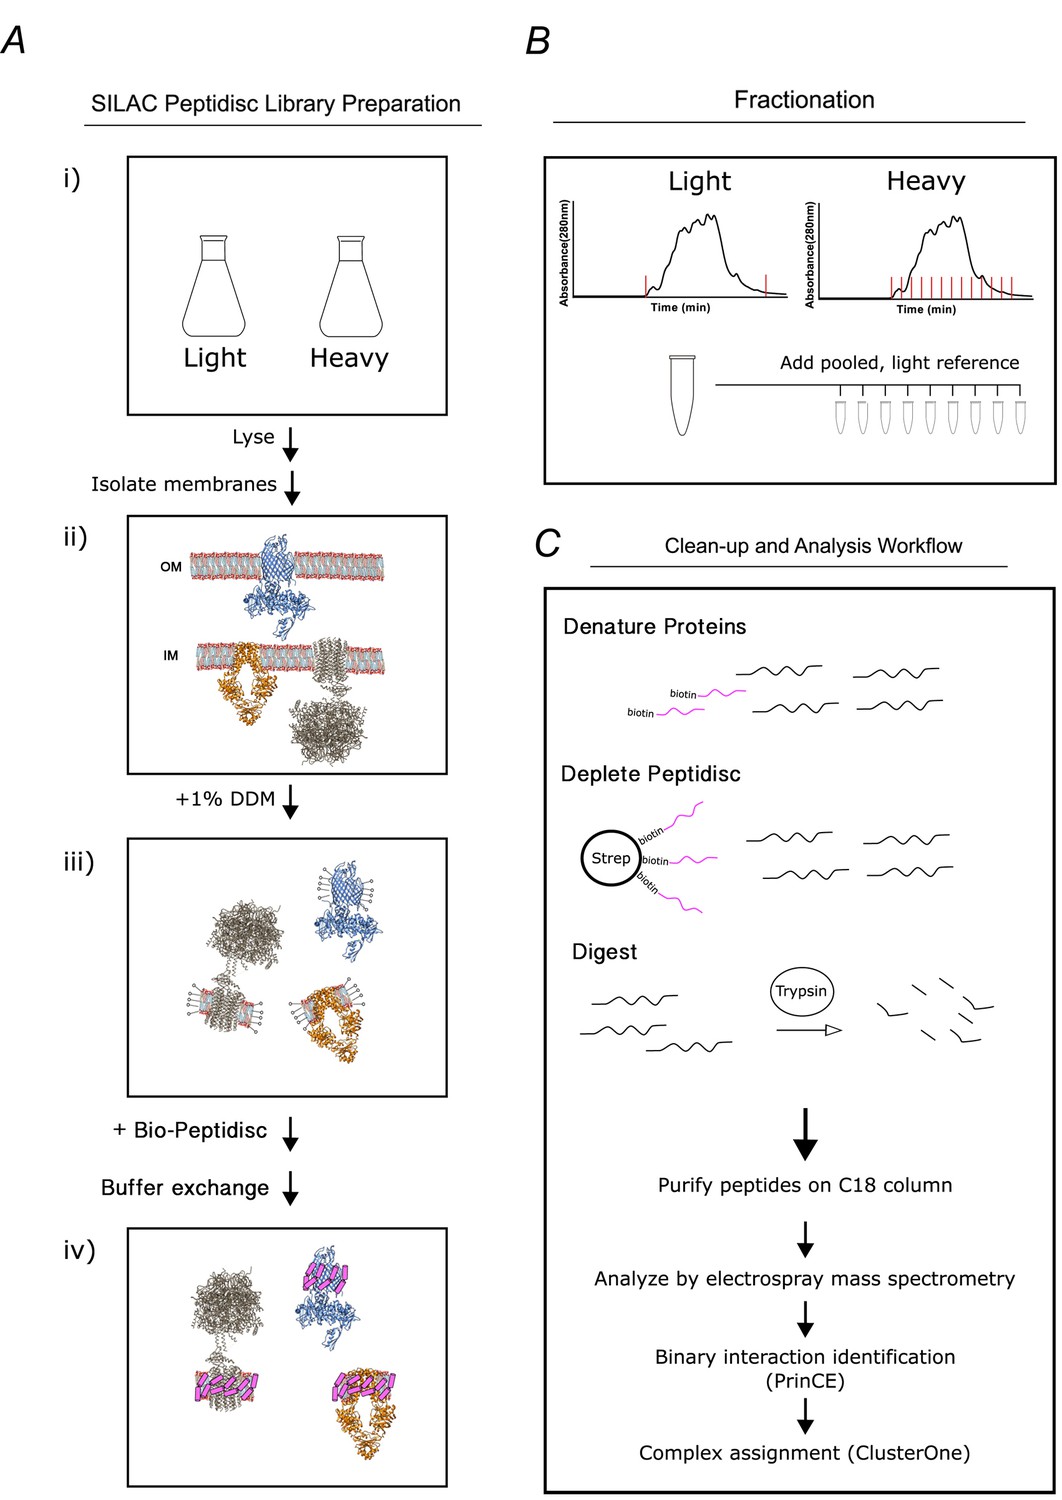
Overview of the peptidisc-based SEC-PCP-SILAC workflow.
(A) Identical E. coli cultures are labeled in SILAC media (i), lysed with french press and crude membrane fraction isolated by ultracentrifugation (ii). Membranes are solubilized in non-ionic detergent (DDM) (iii), transferred into biotinylated Peptidisc peptides (Bio-Peptidisc) solution, and then filtered to remove excess peptide and detergent (iv). (B) The light and heavy peptidisc libraries are separated by high-resolution SEC in detergent-free buffer. The light fractions are pooled and aliquoted into the heavy fractions as an internal quantification standard. (C) Proteins in each fraction are denatured, depleted for Bio-Peptidisc peptides, digested, and analyzed by LC-MS/MS. Maxquant is used to identify peptides and to quantify heavy protein enrichment in each fraction. Binary protein interactions are identified from the co-elution data using the prediction of interactomes bioinformatics pipeline (PrinCE). Binary interactions are subsequently segregated into predicted complexes using the ClusterONE algorithm.
Figure 2

The peptidisc captures detergent solubilized membrane proteins with high efficiency.
(A) SDS-PAGE analysis of detergent solubilized E. coli crude membrane before and after reconstitution into peptidiscs. The crude membrane preparation was solubilized in either 1% n-dodecyl-beta-maltoside (DDM), 3% ß-octyl glucoside (ß-OG), 1% sodium deoxycholate (DOC), or 1% lauryldimethylamine-N-oxide (LDAO), followed by reconstitution into peptidiscs by dilution and buffer exchange. (B) Protein number and overlap after SEC-fractionation of DDM extract and peptidiscs library prepared from DDM extract. A total of 20 fractions were collected, and the fraction containing the highest concentration of protein (fraction 12) analyzed by electrospray mass spectrometry in triplicate. The mass spectrometry data was searched together in MaxQuant. (C) SDS-PAGE analysis of native E. coli membranes incorporated into peptidisc after fractionation by size exclusion chromatography in detergent-free buffer. (D) As in C, with membranes solubilized in DDM and fractionated in buffer supplemented with DDM. (E) Clear native (CN)-PAGE analysis of crude membrane solubilized in DDM (Lane 1) or in peptidiscs (Lane 2). (F) The peptidisc library containing overexpressed MsbA (Lane 1) was bound to Ni-NTA beads, washed in Buffer A (Lane 2), and eluted in Buffer A + 250 mM imidazole (Lane 3). Samples were analysed by SDS-PAGE. (G) CN-PAGE analysis of MsbA purified in DDM (Lane 1) or purified in peptidiscs (Lane 2).
Figure 3 with 1 supplement
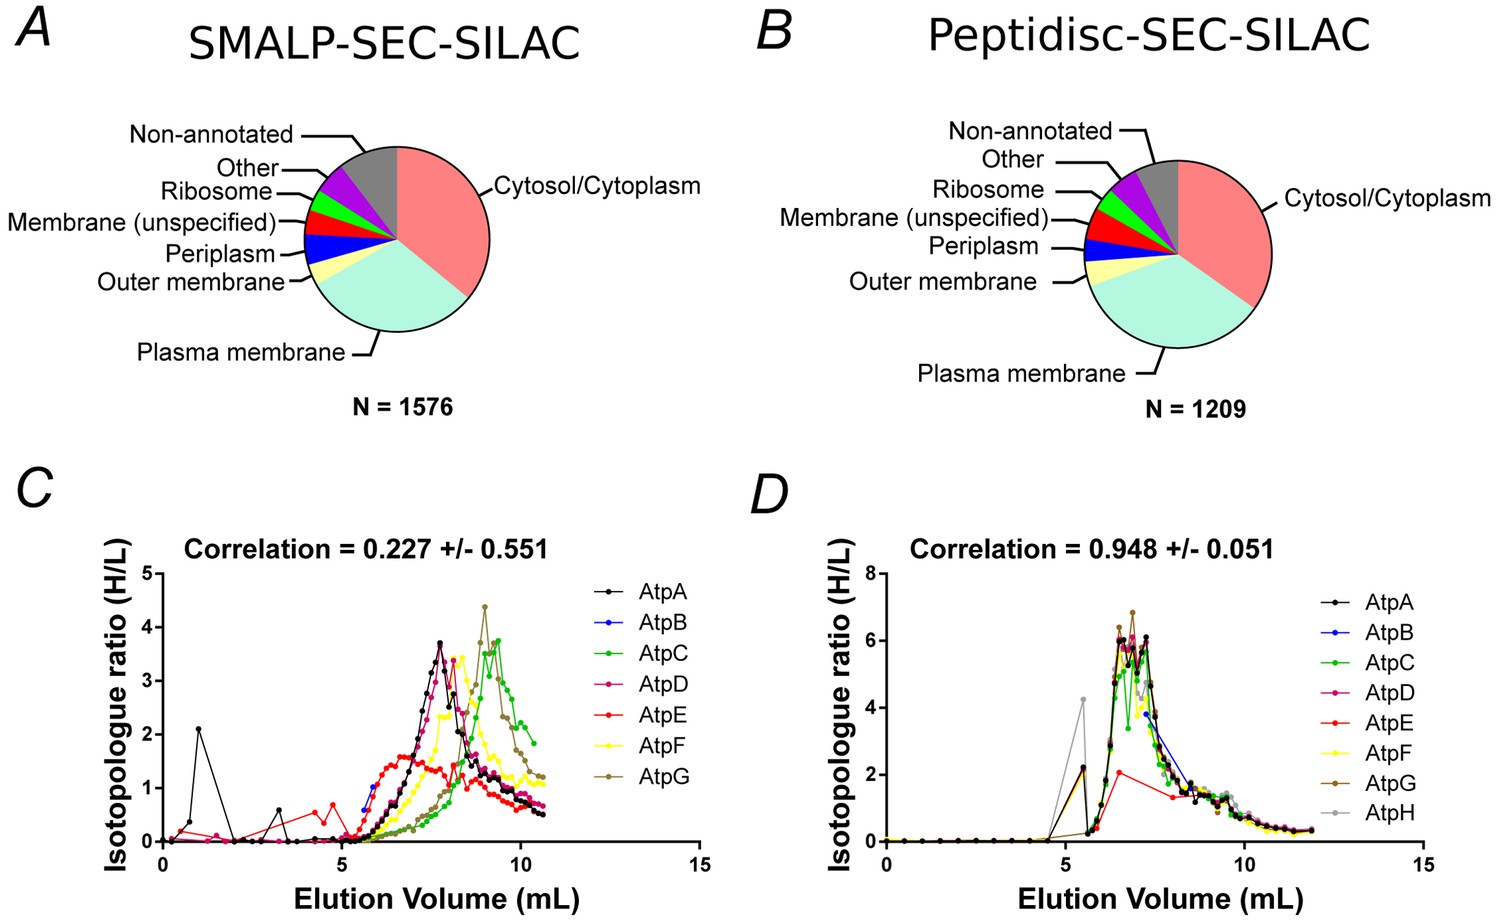
Proteomic analysis of soluble, SILAC-labeled E. coli membrane proteins in SMALPs or peptidisc libraries.
Gene ontology analysis of identified proteins and annotated cellular compartment of identified proteins in (A) SMALP library, or in (B) peptidisc library. Co-fractionation profiles for quantified subunits of the ATP synthase complex in (C) SMALPs (raw data presented in Supplementary file 2) or (D) peptidisc (raw data presented in Supplementary file 1). Note: total volume of column is 18 mL and void volume is 6 mL. Void volume is represented as the zero on the x-axis of all co-elution graphs.
Figure 3—figure supplement 1

Fractionation profiles for select E. coli membrane protein complexes solubilized in SMA and peptidisc.
(A) and (C) Co-fractionation profiles for quantified subunits of the Bam complex and respiratory chain complex, respectively, solubilized in SMALPs (raw data presented in Supplementary file 2). (B) and (D) Co-fractionation profiles for quantified subunits of the Bam complex and respiratory chain complex, respectively, solubilized in peptidiscs (raw data presented in Supplementary file 1). Average Pearson correlation and standard deviation between subunits is reported for the displayed complex. *Due to incomplete chromatograms, NuoE and NuoE plus NuoF were omitted from calculations of the average correlation coefficient for SMA and peptidisc, respectively.
Figure 4
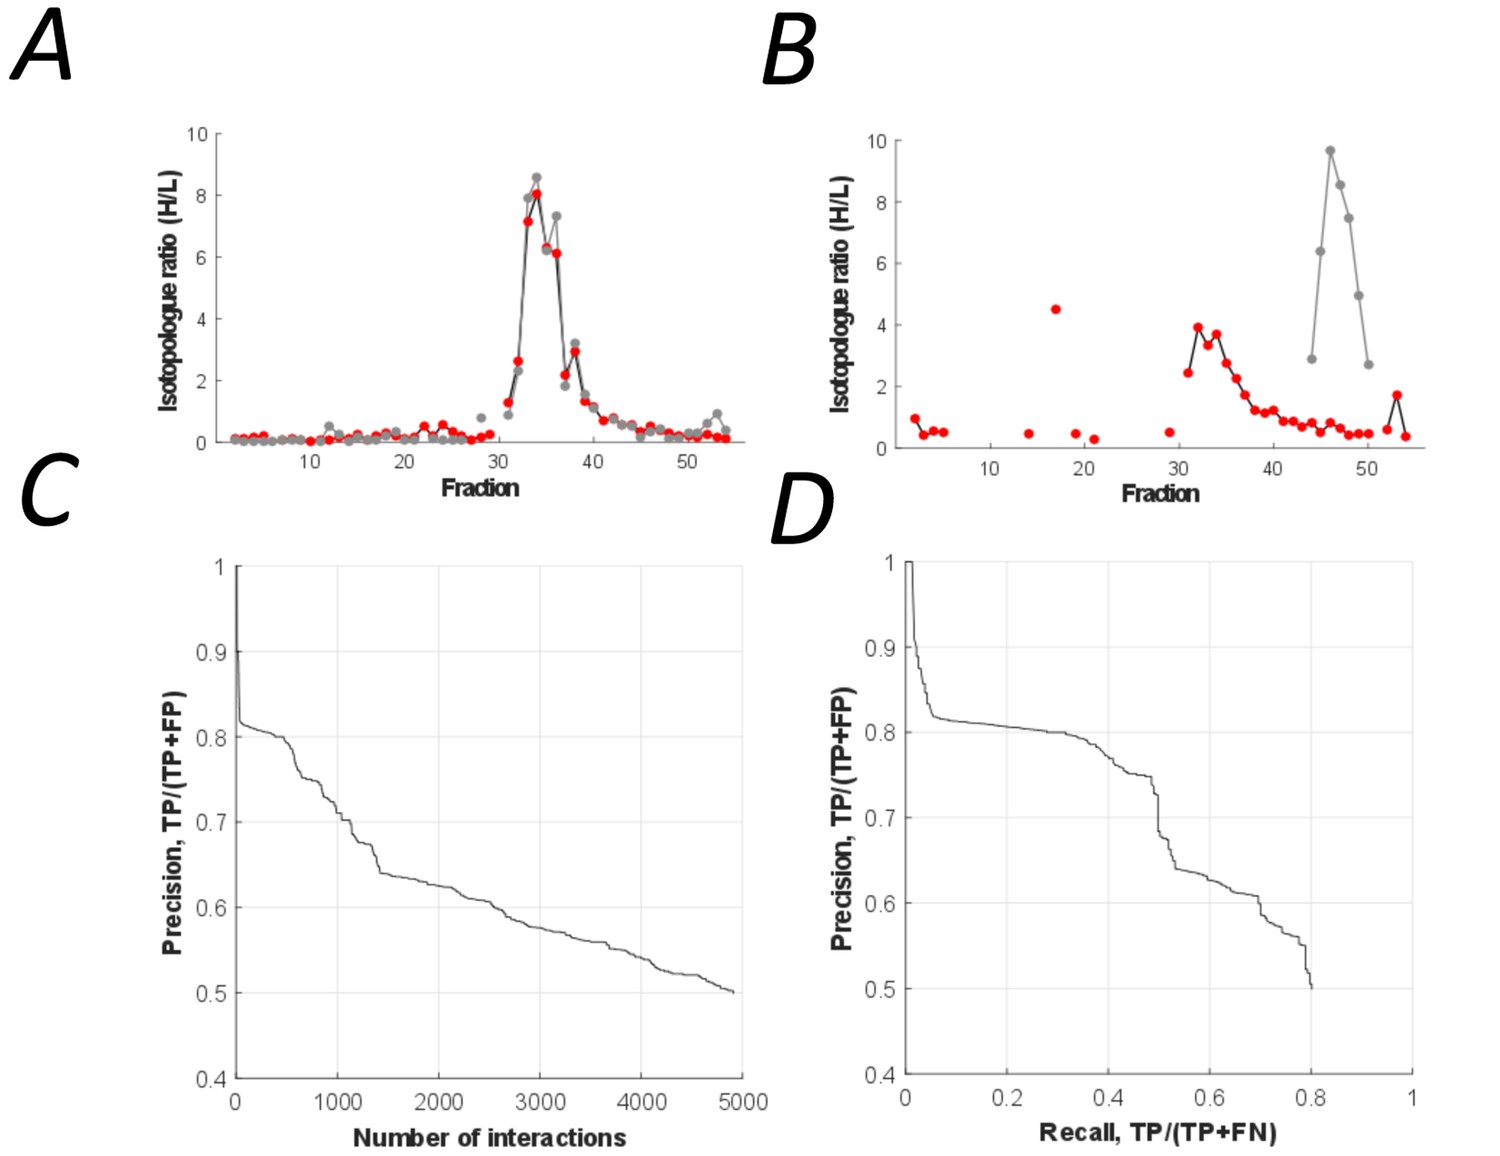
The peptidisc interactome is composed of 4911 co-fractionating protein pairs.
(A) Typical elution profiles of an interacting protein pair in the peptidisc interactome. (B) Example elution profiles of non-interacting proteins. (C) Precision vs. accumulated number of interactions. (D) Precision-recall curve of the peptidisc interactome.
Figure 5 with 1 supplement
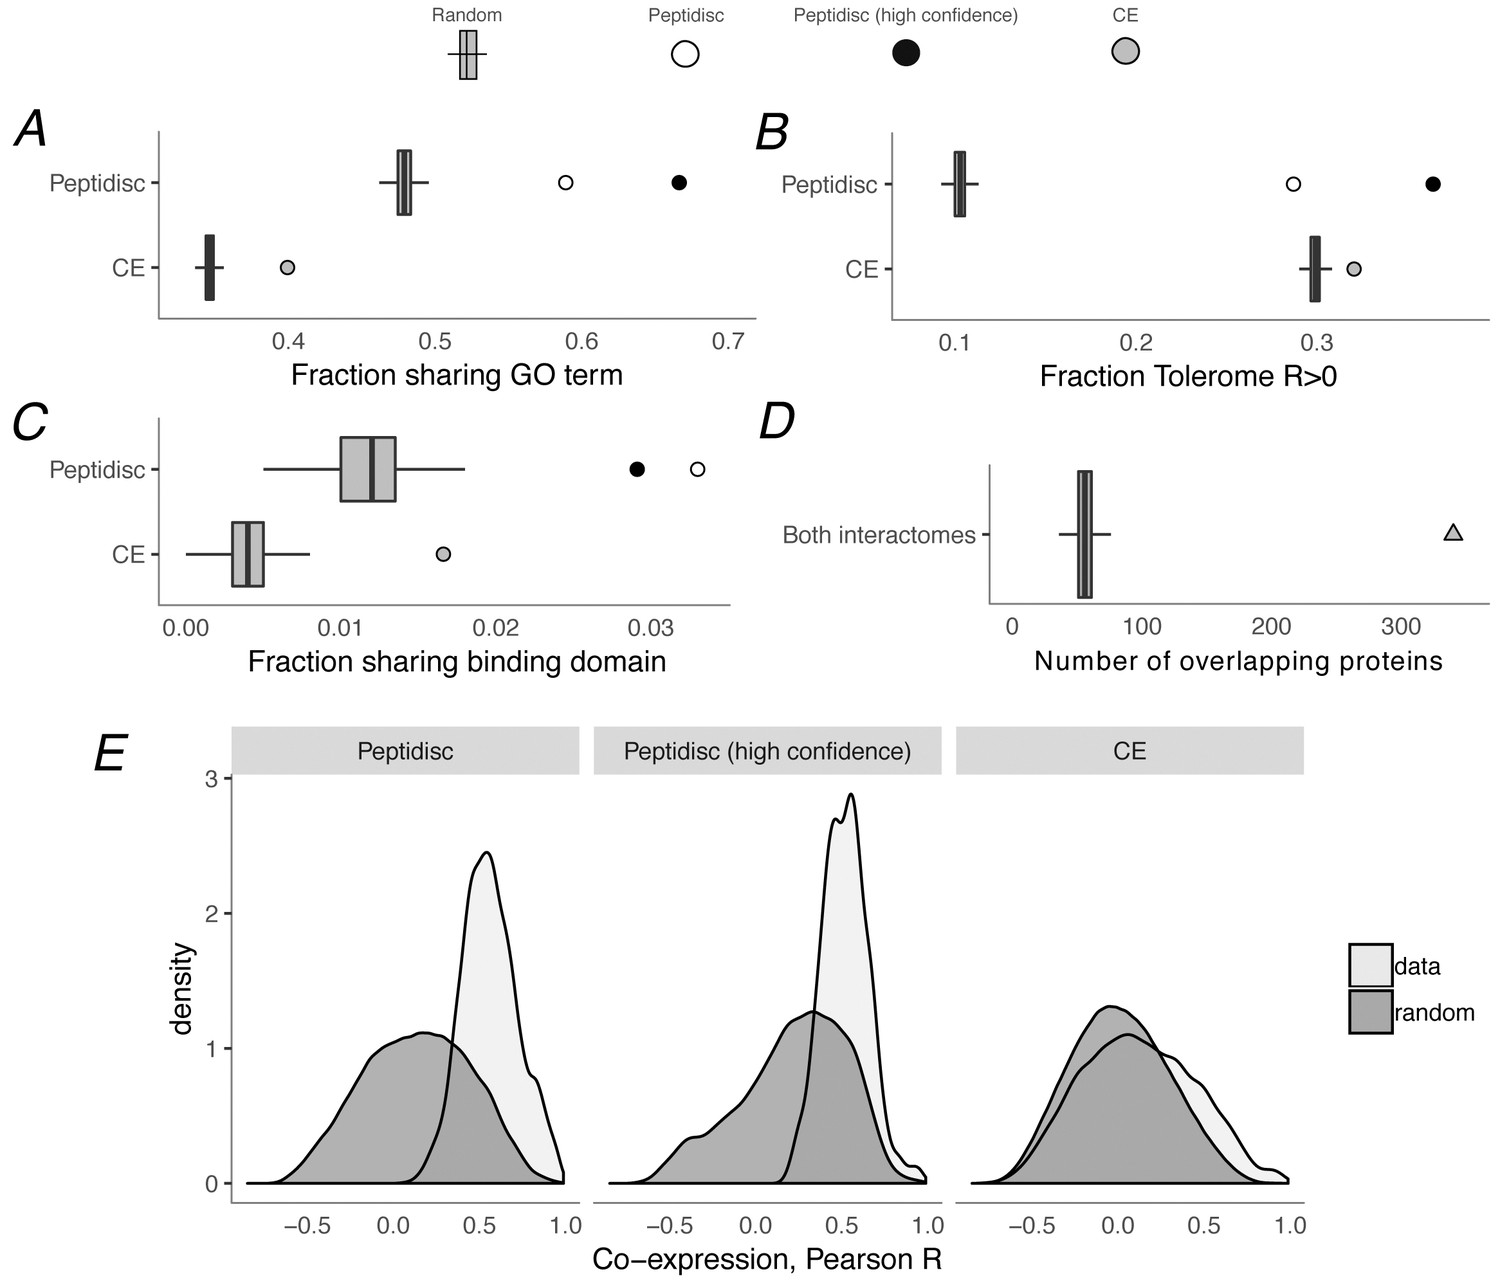
Computational validation of peptidisc interactome.
(A) Fraction of interacting pairs sharing a gene ontology (GO) term for the peptidisc (top) and CE interactomes (bottom). Both the full peptidisc interactome (4911 interactions, white) and the High Confidence subset are shown (black). ‘Random’ shows the expected number of shared terms from randomly rewired peptidisc and CE interactomes (1000 iterations, gray bars). (B) Fraction of interacting pairs with positively correlated Tolerome profiles (R > 0, Pearson correlation). (C) Fraction of interacting pairs sharing binding domains. (D) Number of overlapping interactions between peptidisc and CE interactomes compared to random. (E) True (‘data’) and random distributions for M3D co-expression correlation (Pearson) for peptidisc, High Confidence, and CE. Random distributions generated by randomly rewiring networks.
Figure 5—figure supplement 1
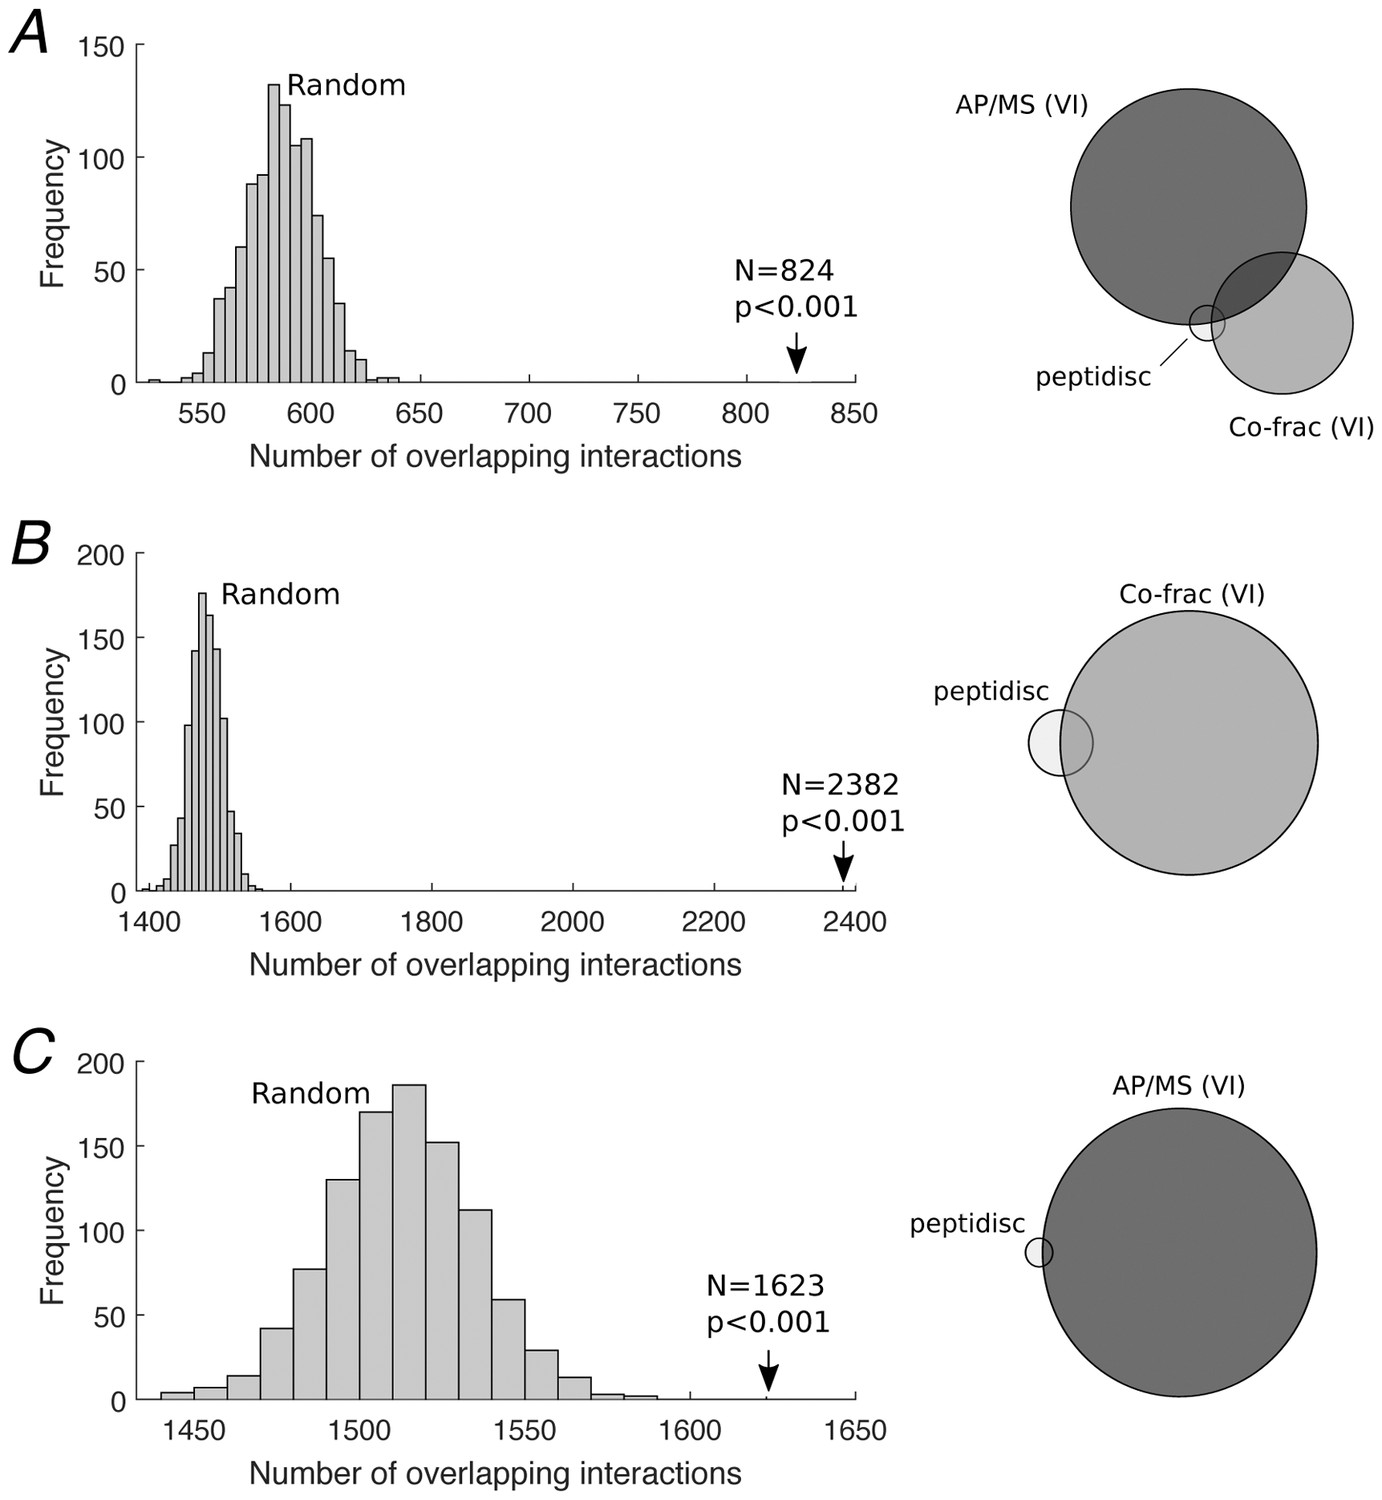
Defining the High Confidence subset of interactions.
(A) 824 High Confidence interactions were defined as the subset of the peptidisc interactome that was also detected by both the AP/MS and co-fractionation validating interactomes (right). Significance of the overlap was assessed via permutation test, where 4911 random interactions were assigned between proteins found in the peptidisc interactome and overlapping interactions were counted between the random interactome and validating interactomes; this process was repeated 1000 times, generating a null/random distribution (left). Overlap was significant (p<0.001). (B) Overlap between peptidisc interactome and the co-fractionation VI (right) and permutation test (left). (C) Overlap between peptidisc and AP/MS VI (right) and permutation test (left). VI: validating interactome.
Figure 6 with 1 supplement
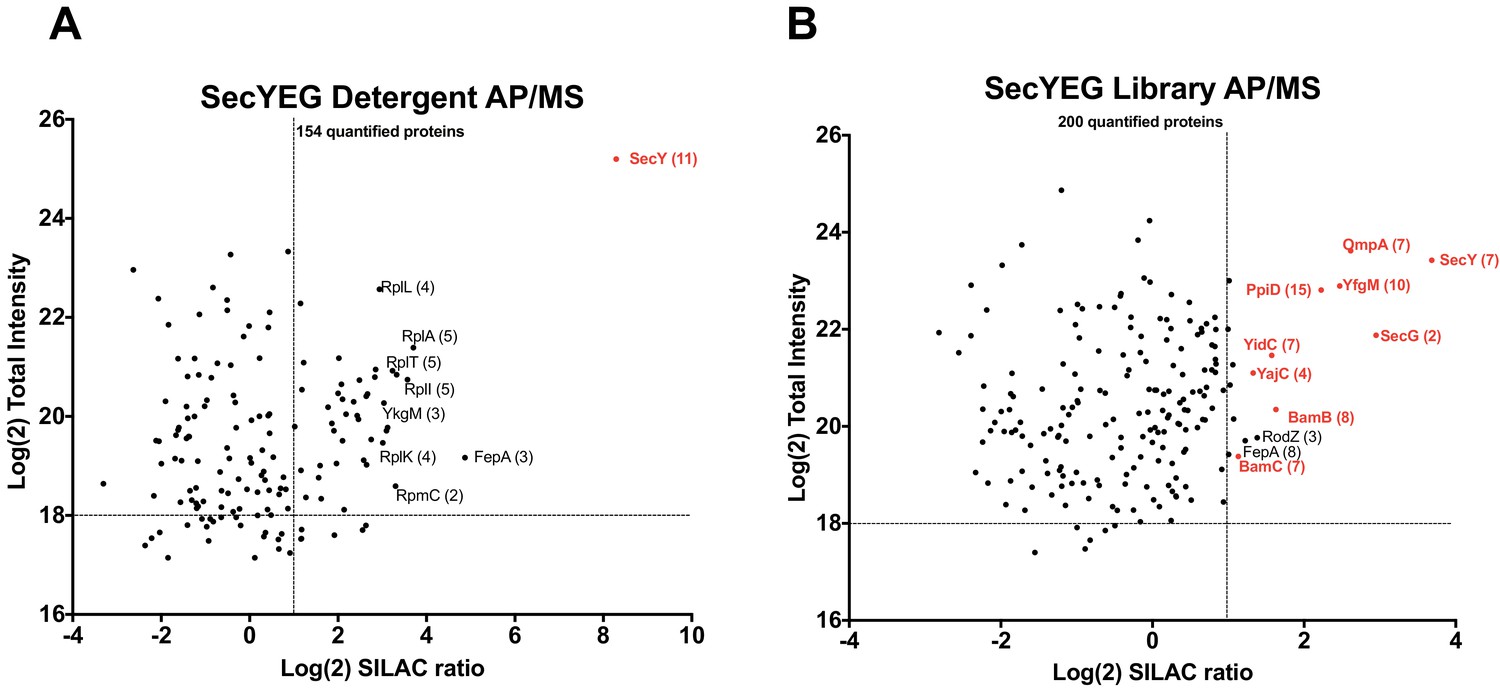
Validation of SecYEG interactors by AP/MS.
(A) Enrichment matrix of each quantified protein identified in the SecYEG detergent AP/MS pulldown. The Log(2) peptide intensity for each quantified protein is plotted against the corresponding Log(2) SILAC ratio. Arbitrary enrichment cutoffs were set for both the x and y axes; these are indicated on the plot as dashed lines to aid the eye. Proteins of interest are highlighted in red. The number of unique peptides detected for each protein of interest is given in parentheses. Each black dot is a protein quantified in the pulldown experiments (B) As in A, but for proteins quantified in the SecYEG peptidisc library pulldown. Raw data for both plots are presented in Supplementary file 5.
Figure 6—figure supplement 1
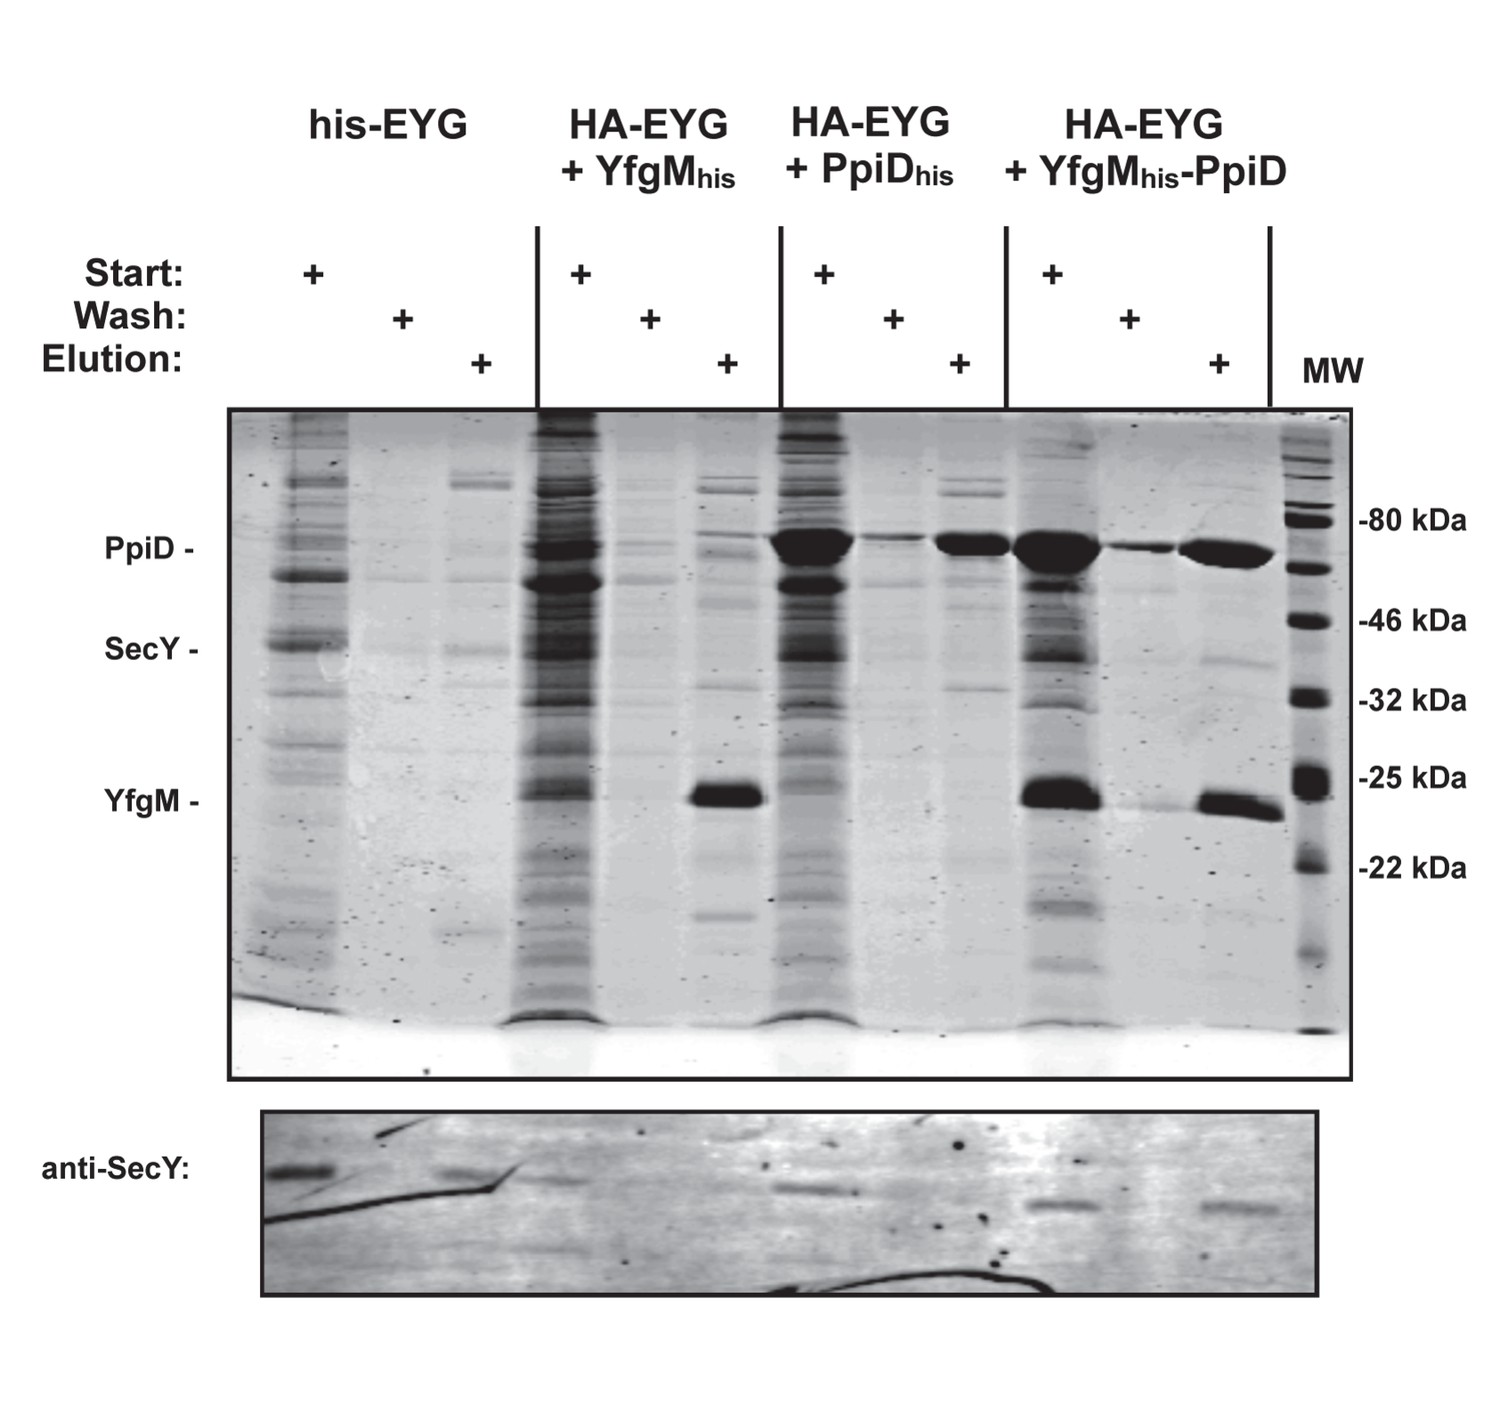
Co-elution of SecYEG with YfgMHis-PpiD.
E. coli membranes containing HA-tagged SecYEG co-expressed with either YfgMHis, PpiD His or YfgMHis-PpiD were solubilized in 1% DDM followed by pulldown using Ni-NTA resin. The his-tagged SecYEG complex was used as a pulldown control. Eluted proteins were analyzed by 15% SDS-PAGE followed by either Coomassie staining or an immunoblot using an anti-SecY antibody.
Figure 7

Validation of BamA interactors by AP/MS.
(A) Pair-wise co-elution plots of select BamA interactors as predicted from the peptidisc PCP-SILAC workflow (raw data presented in Supplementary file 1). Pairwise interaction correlation values are shown above each plot. (B) Enrichment matrix of each quantified protein quantified in the BamA detergent AP/MS pulldown. The data was plotted and labeled as in Figure 6. (C) As in A, but for proteins quantified in the BamA peptidisc AP/MS pulldown. Raw data for the plots shown in B and C is presented in Supplementary file 5.
Figure 8 with 2 supplements
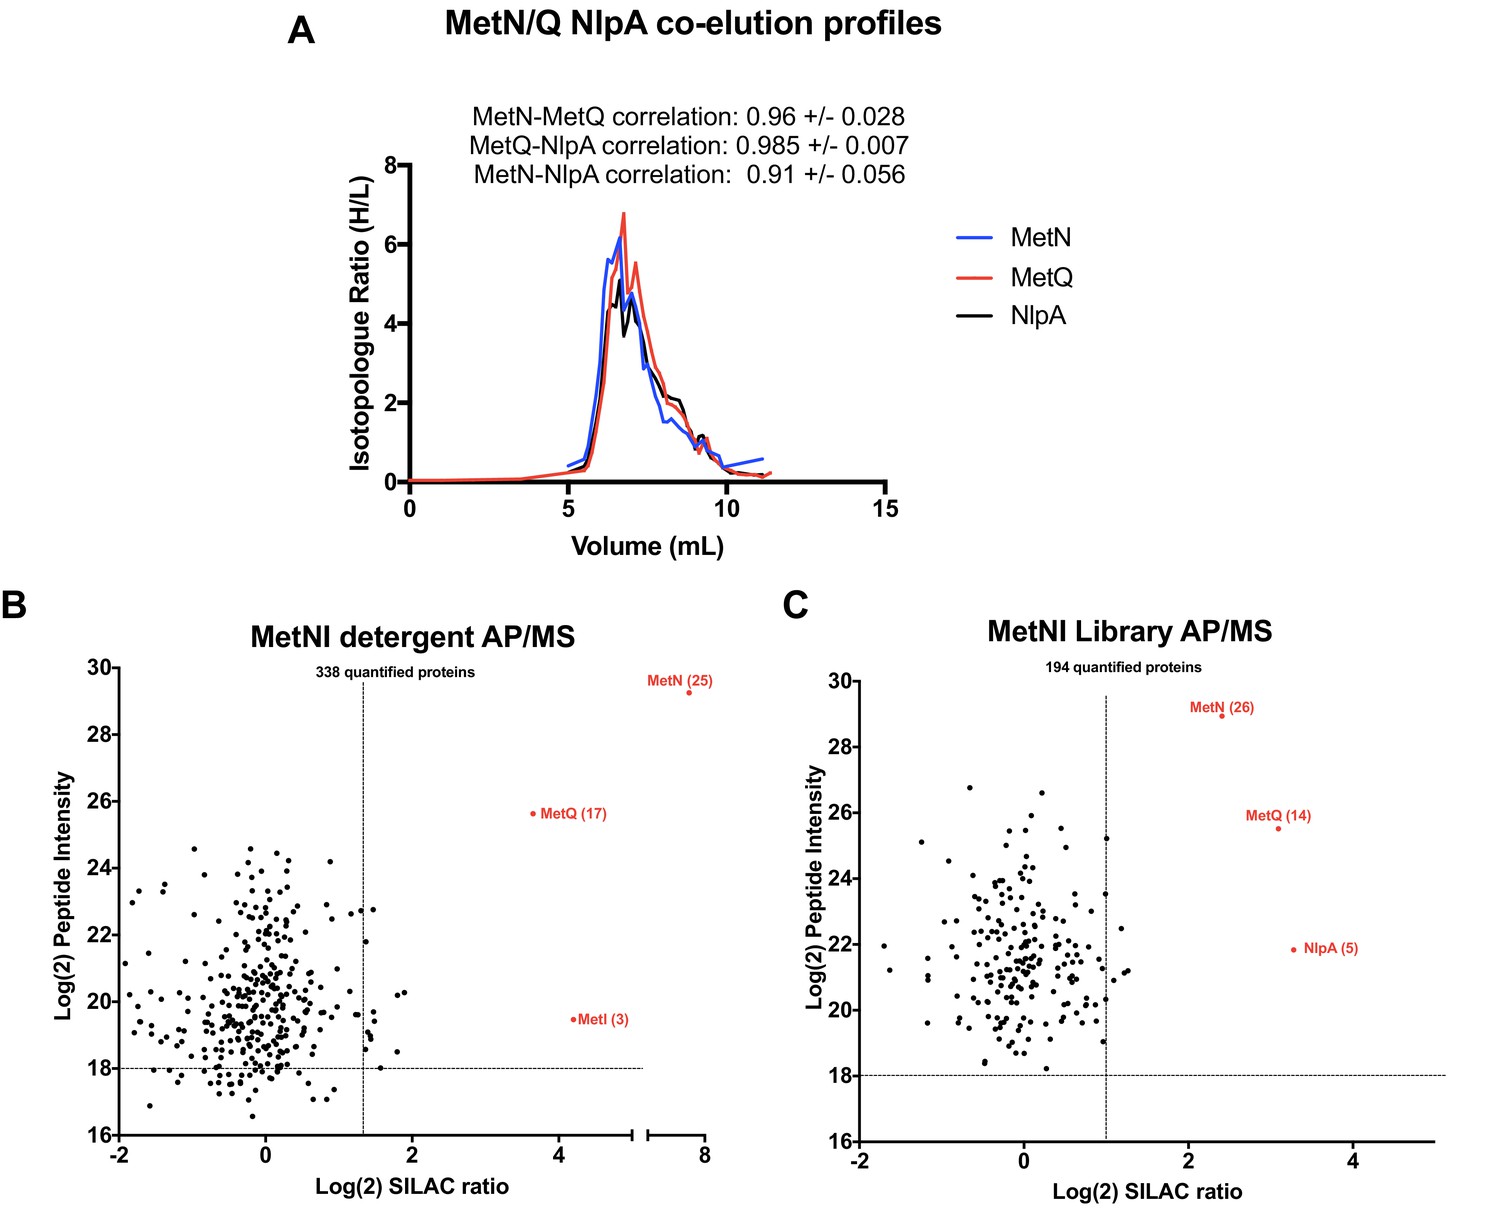
Validation of MetNI interactors of AP/MS.
(A) Co-elution plot of MetN with the predicted interactors MetQ and NlpA (raw data presented in Supplementary file 1). Pairwise correlation values for each interaction are shown above the plot. (B) Enrichment matrix of each quantified protein quantified in the MetNI detergent AP/MS pulldown. The data was plotted and labeled as in Figure 6. (C) As in A, but for proteins quantified in the MetNI peptidisc AP/MS pulldown. Raw data for the plots shown in B and C is presented in Supplementary file 5.
Figure 8—figure supplement 1
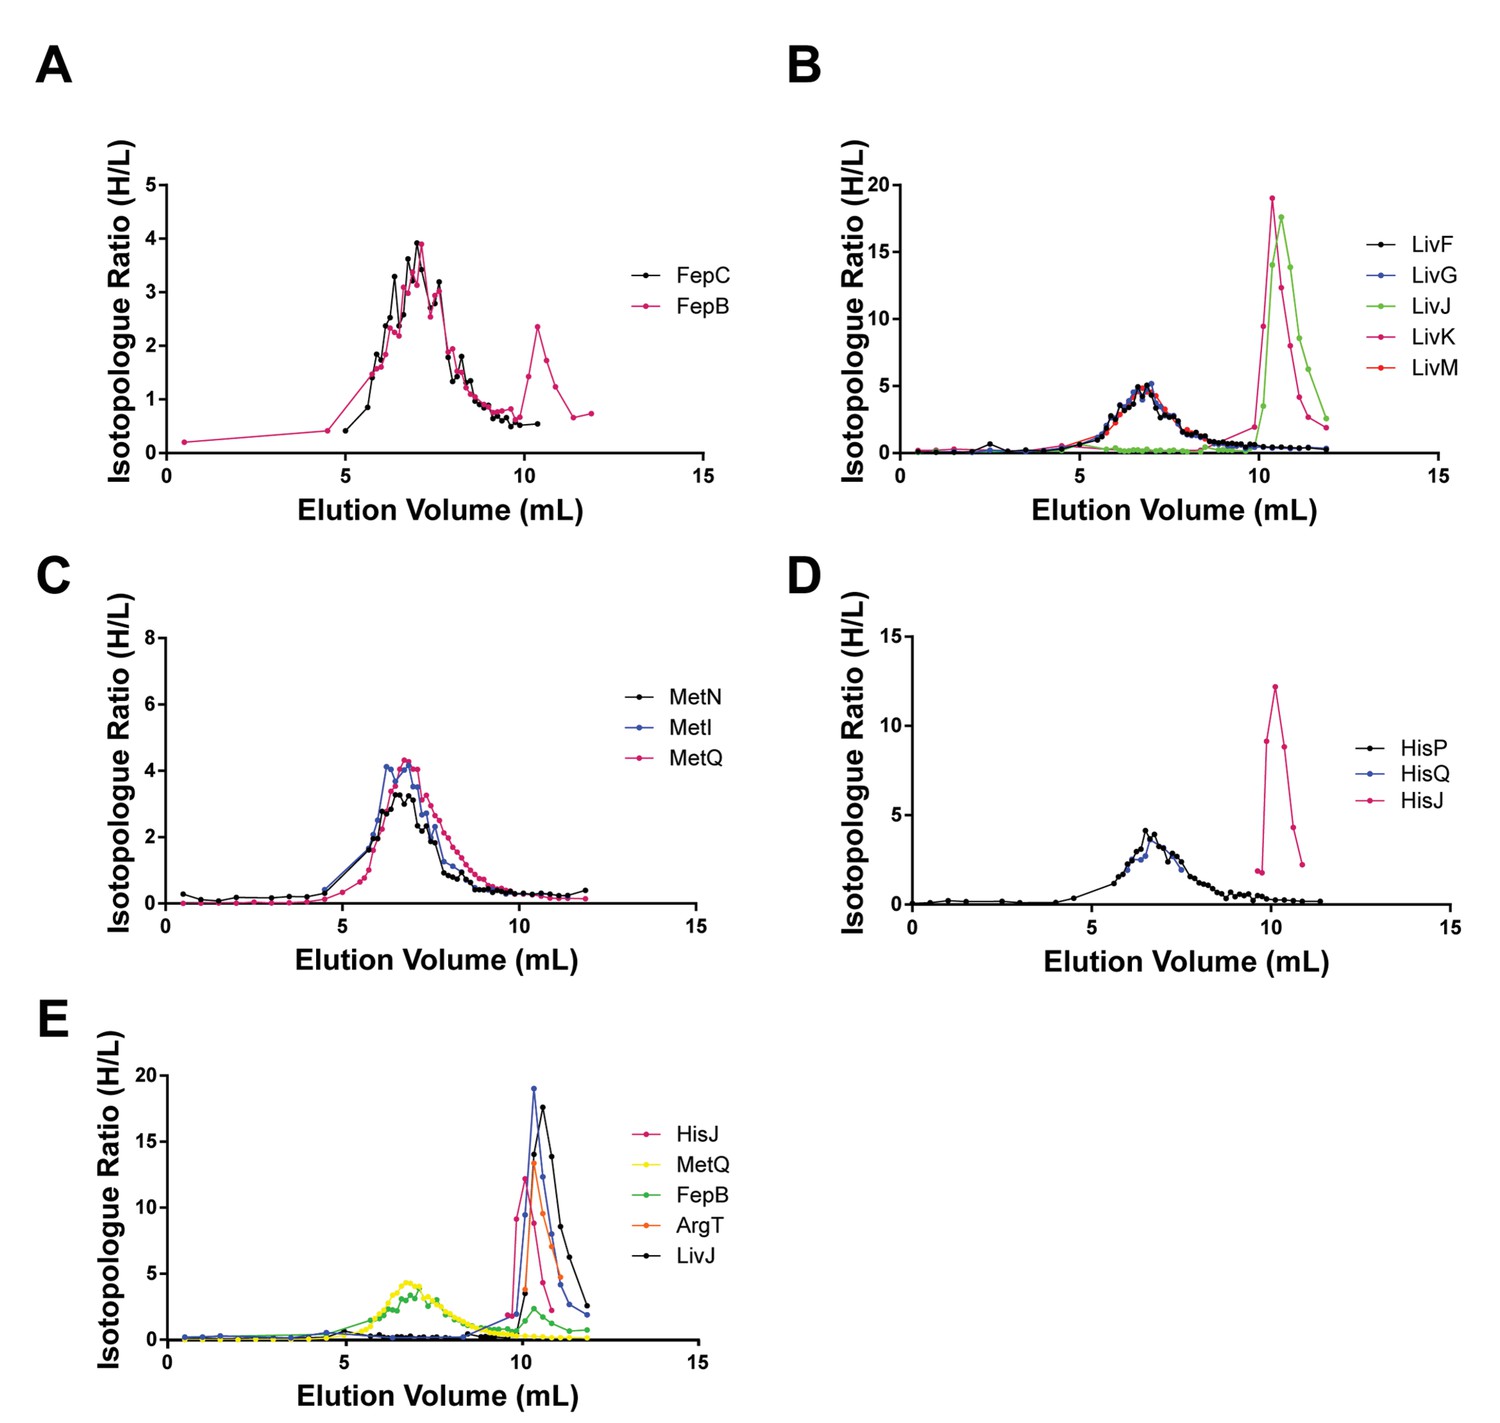
Co-fractionation profiles of ABC transporters and SBPs in peptidisc.
(A) Profile for Type II transporter FepC and SBP FepB. (B) Profile for Type I transporter LivFGM (black, blue and red trace, respectively) and corresponding SBPs LivJ and LivK (green and magenta trace, respectively). (C) Profile for Type I transporter MetNI (black and blue trace, respectively) and SBP MetQ (magenta trace). (D) Profile for Type I transporter HisPQ (black and blue trace, respectively), and SBP HisJ (magenta trace). (E) Elution profiles for select SBPs. Raw data for all plots in this figure is included in Supplementary file 1.
Figure 8—figure supplement 2
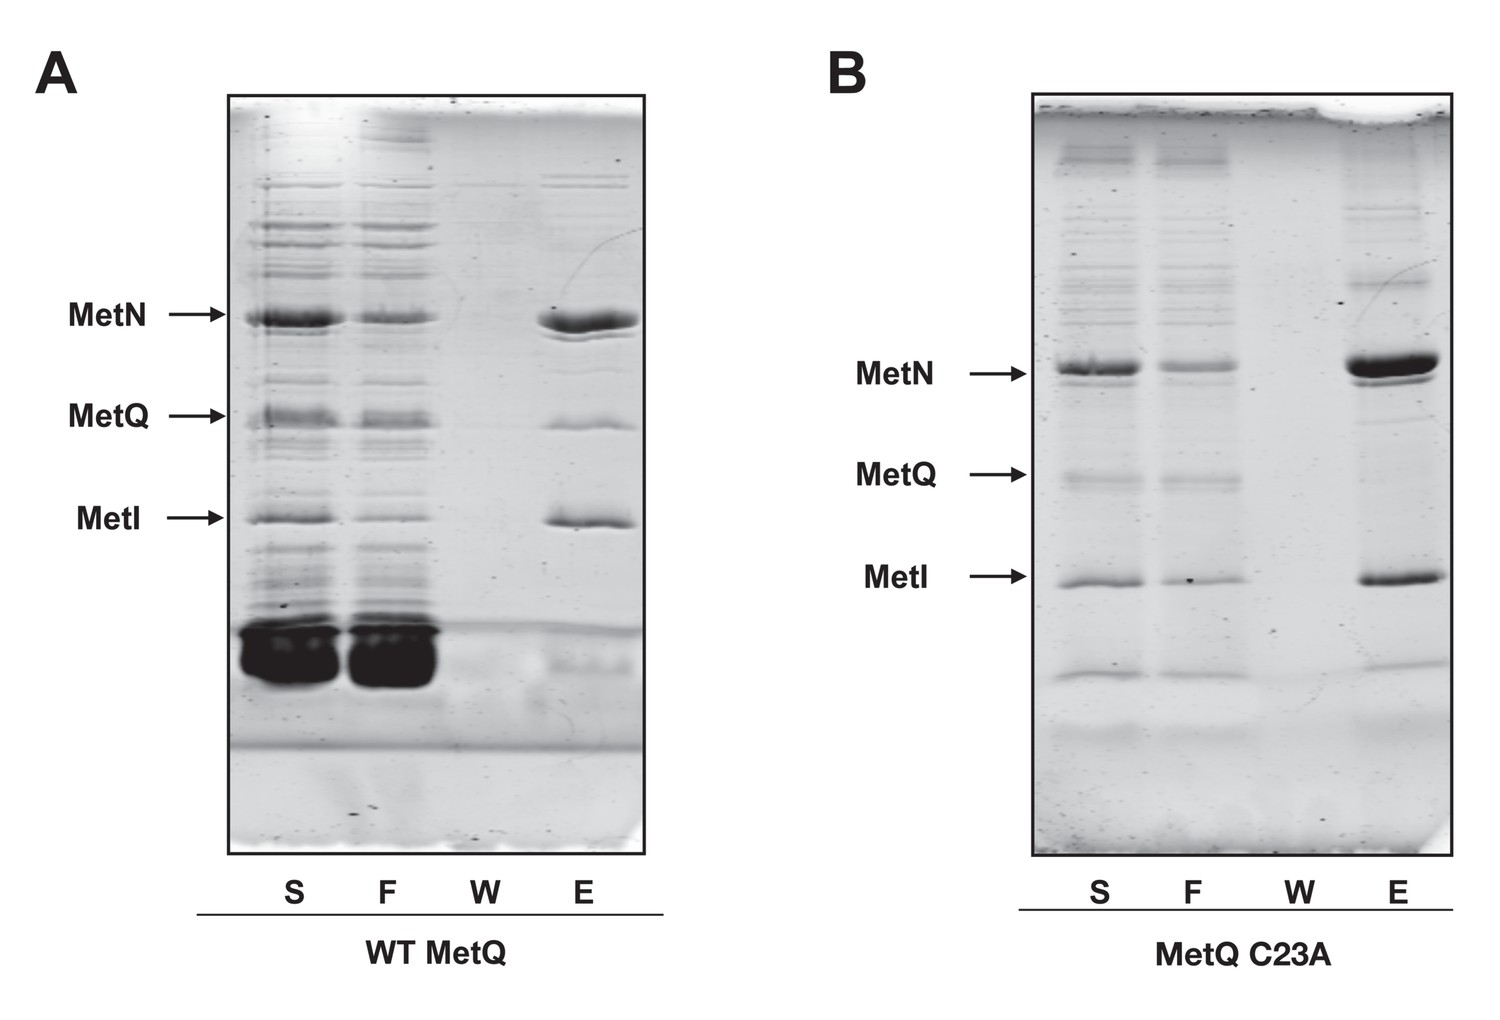
Lipidation of MetQ is required for its interaction with the MetNI transporter.
(A) Membranes containing hisMetNI co-expressed with MetQ were solubilized in DDM and then reconstituted into peptidisc libraries. The library was purified over Ni-NTA resin. Fractions were analyzed by SDS-PAGE (right lanes). (B) Membranes containing hisMetNI co-expressed with the non-lipidated MetQ C23A mutant were analyzed as described in A.
Tables
Table 1
List of GO terms used to predict protein association with the E. coli cell envelope.
https://doi.org/10.7554/eLife.46615.004| Gene ontology term (Associated with cell envelope) | |||||
|---|---|---|---|---|---|
| Anchored component of membrane | Anchored component of external side of membrane | Anchored component of periplasmic side of outer membrane | Extrinsic component of periplasmic side of plasma membrane | Gram-negative bacterium cell wall | Extrinsic component of plasma membrane |
| Integral component of membrane | Cell envelope | Cell outer membrane | Integral component of cell outer membrane | Integral component of plasma membrane | Integral component of membrane |
| membrane | Cell wall | External side of cell outer membrane | Intrinsic component of cell outer membrane | Intrinsic component membrane | Intrinsic component of plasma membrane |
| Plasma membrane | Extrinsic component of cell outer membrane | Extrinsic component of membrane | Intrinsic component of external side of plasma membrane | Intrinsic component of periplasmic side of plasma membrane | Intrinsic component of periplasmic side of cell outer membrane |
| Outer-membrane bounded periplasmic space | Periplasmic space | Plasma membrane | Intrinsic component of cytoplasmic side of plasma membrane | Outer membrane | |
| Periplasmic side of outer membrane | Peptidoglycan-based cell wall | ||||
Additional files
-
Supplementary file 1
Protein enrichment in SEC fractionated peptidiscs (Biological Replicates 1 and 2).
- https://doi.org/10.7554/eLife.46615.016
-
Supplementary file 2
Protein enrichment in SEC fractionated SMALPs (Biological Replicates 1 and 2).
- https://doi.org/10.7554/eLife.46615.017
-
Supplementary file 3
Annotated, binary interaction list of membrane proteins identified in the peptidisc library by PCP-SILAC.
- https://doi.org/10.7554/eLife.46615.018
-
Supplementary file 4
Predicted complexes from identified binary interactions in peptidisc library at 50% precision.
- https://doi.org/10.7554/eLife.46615.019
-
Supplementary file 5
Enrichment of proteins in AP/MS pulldowns of SecYEG, BamA, and MetNI.
- https://doi.org/10.7554/eLife.46615.020
-
Supplementary file 6
‘High Confidence’ interaction list - Protein interactions detected in both this study and Babu et al., 2018.
- https://doi.org/10.7554/eLife.46615.021
-
Transparent reporting form
- https://doi.org/10.7554/eLife.46615.022
Download links
A two-part list of links to download the article, or parts of the article, in various formats.
Downloads (link to download the article as PDF)
Open citations (links to open the citations from this article in various online reference manager services)
Cite this article (links to download the citations from this article in formats compatible with various reference manager tools)
Profiling the Escherichia coli membrane protein interactome captured in Peptidisc libraries
eLife 8:e46615.
https://doi.org/10.7554/eLife.46615


