Chromatin-bound CRM1 recruits SET-Nup214 and NPM1c onto HOX clusters causing aberrant HOX expression in leukemia cells
- National Institutes of Biomedical Innovation, Health and Nutrition (NIBIOHN), Japan
- Osaka University, Japan
- Kyushu University, Japan
- Osaka City University, Japan
Figures
Figure 1 with 2 supplements
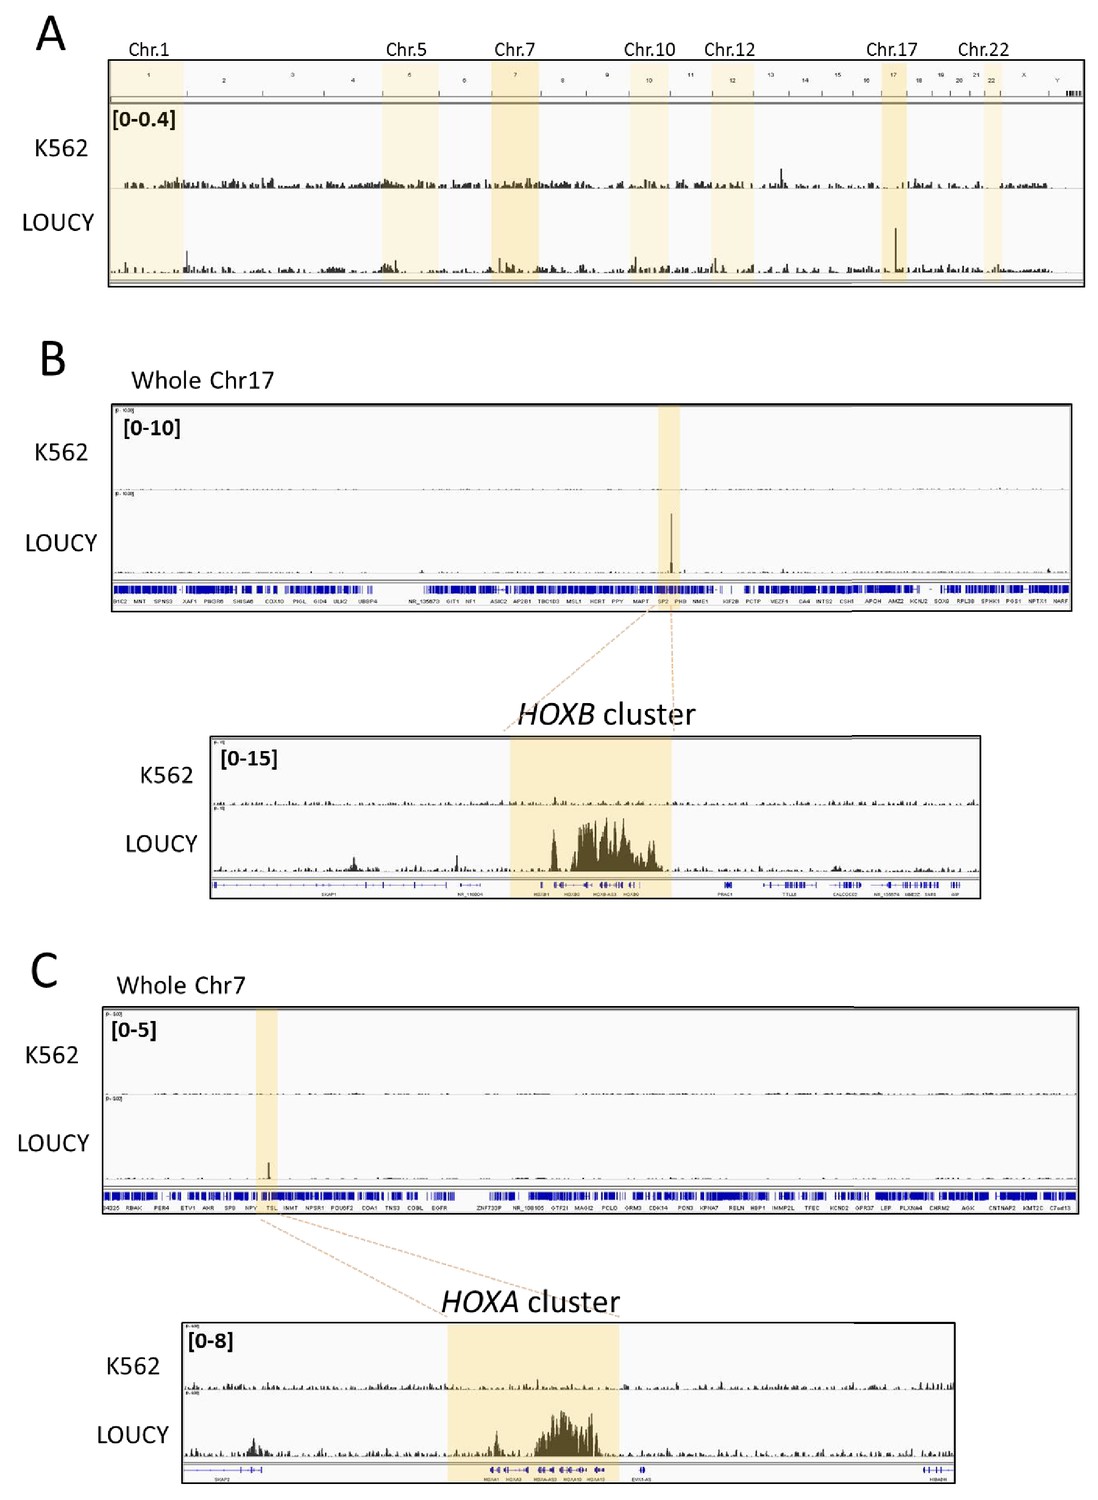
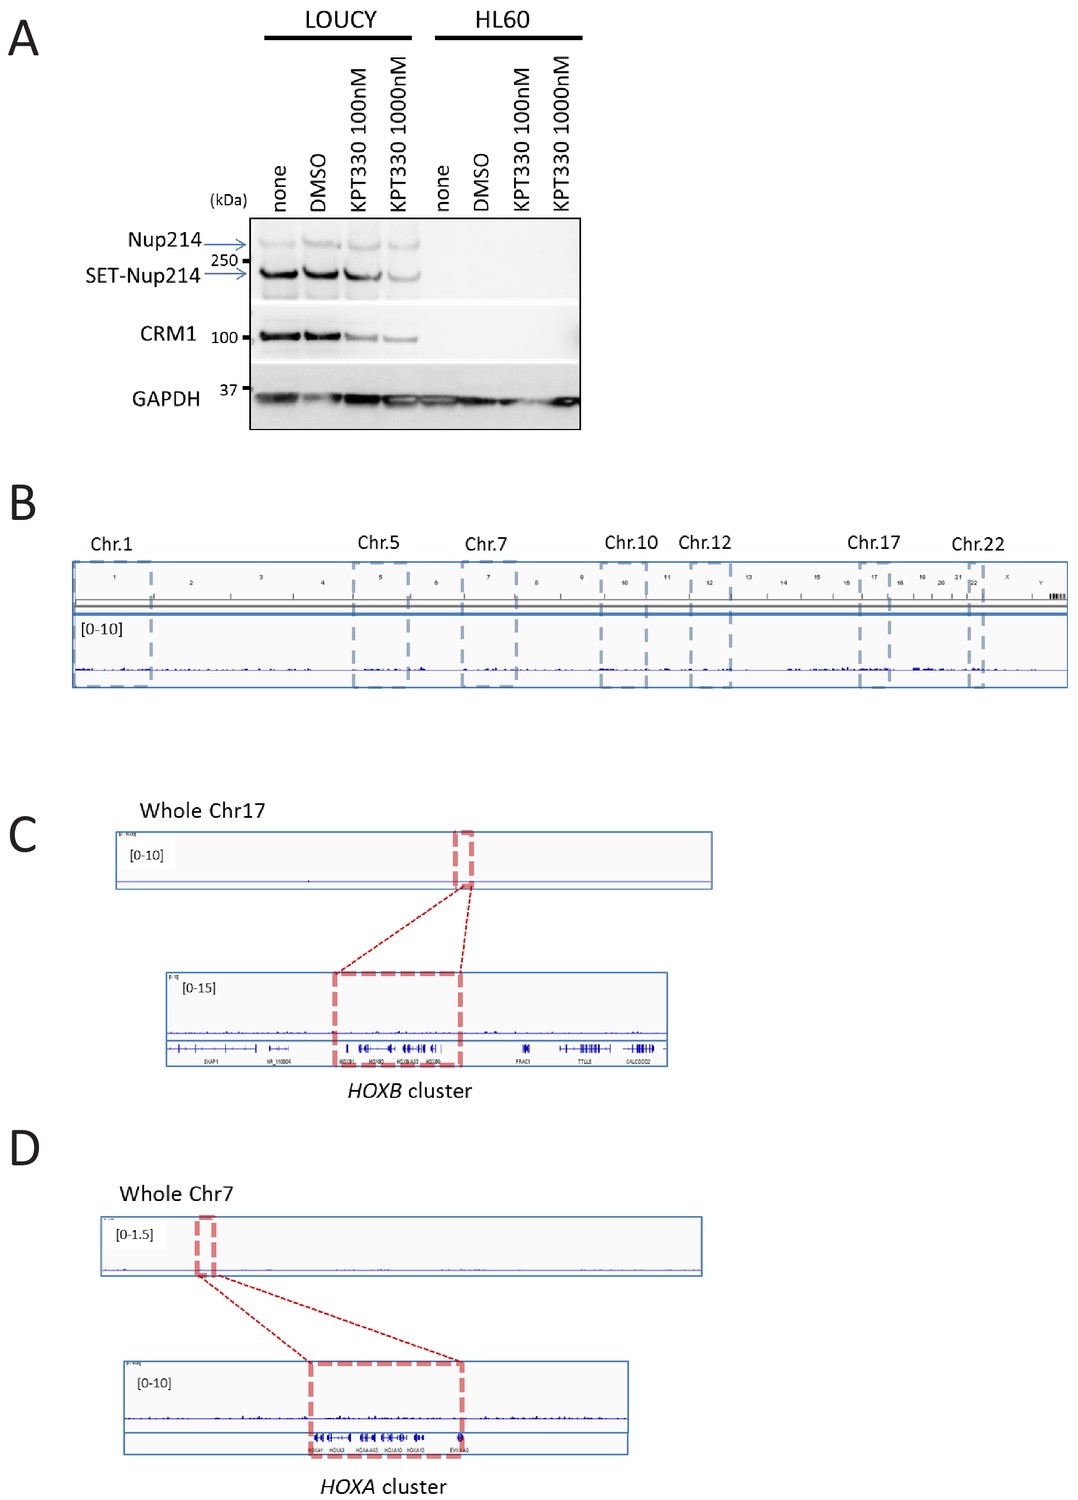
CRM1 accumulates on specific genome regions, including HOXA and HOXB cluster, in human Leukemia cells.
Binding profiles of CRM1 in K562 and LOUCY cell lines (A: whole genome; B: whole chromosome 17 and HOXB cluster, C: whole chromosome seven and HOXA cluster). ChIP-seq was performed using anti-CRM1 (CST, D6V7N, #46249) antibody. In (A), the chromosomes that contain strong CRM1 binding sites are shadowed (dark shadow; Chr.7 (HOXA) and Chr.17 (HOXB), light shadow; Chr.1 (CDKN2C), Chr.5 (LOC648987), Chr.10 (NR_038921, COMMD3-BMI1), Chr.12 (CLEC2B-KLRF2), Chr.22 (PRR34), see Figure 1—figure supplement 2 for details).
Figure 1—figure supplement 1
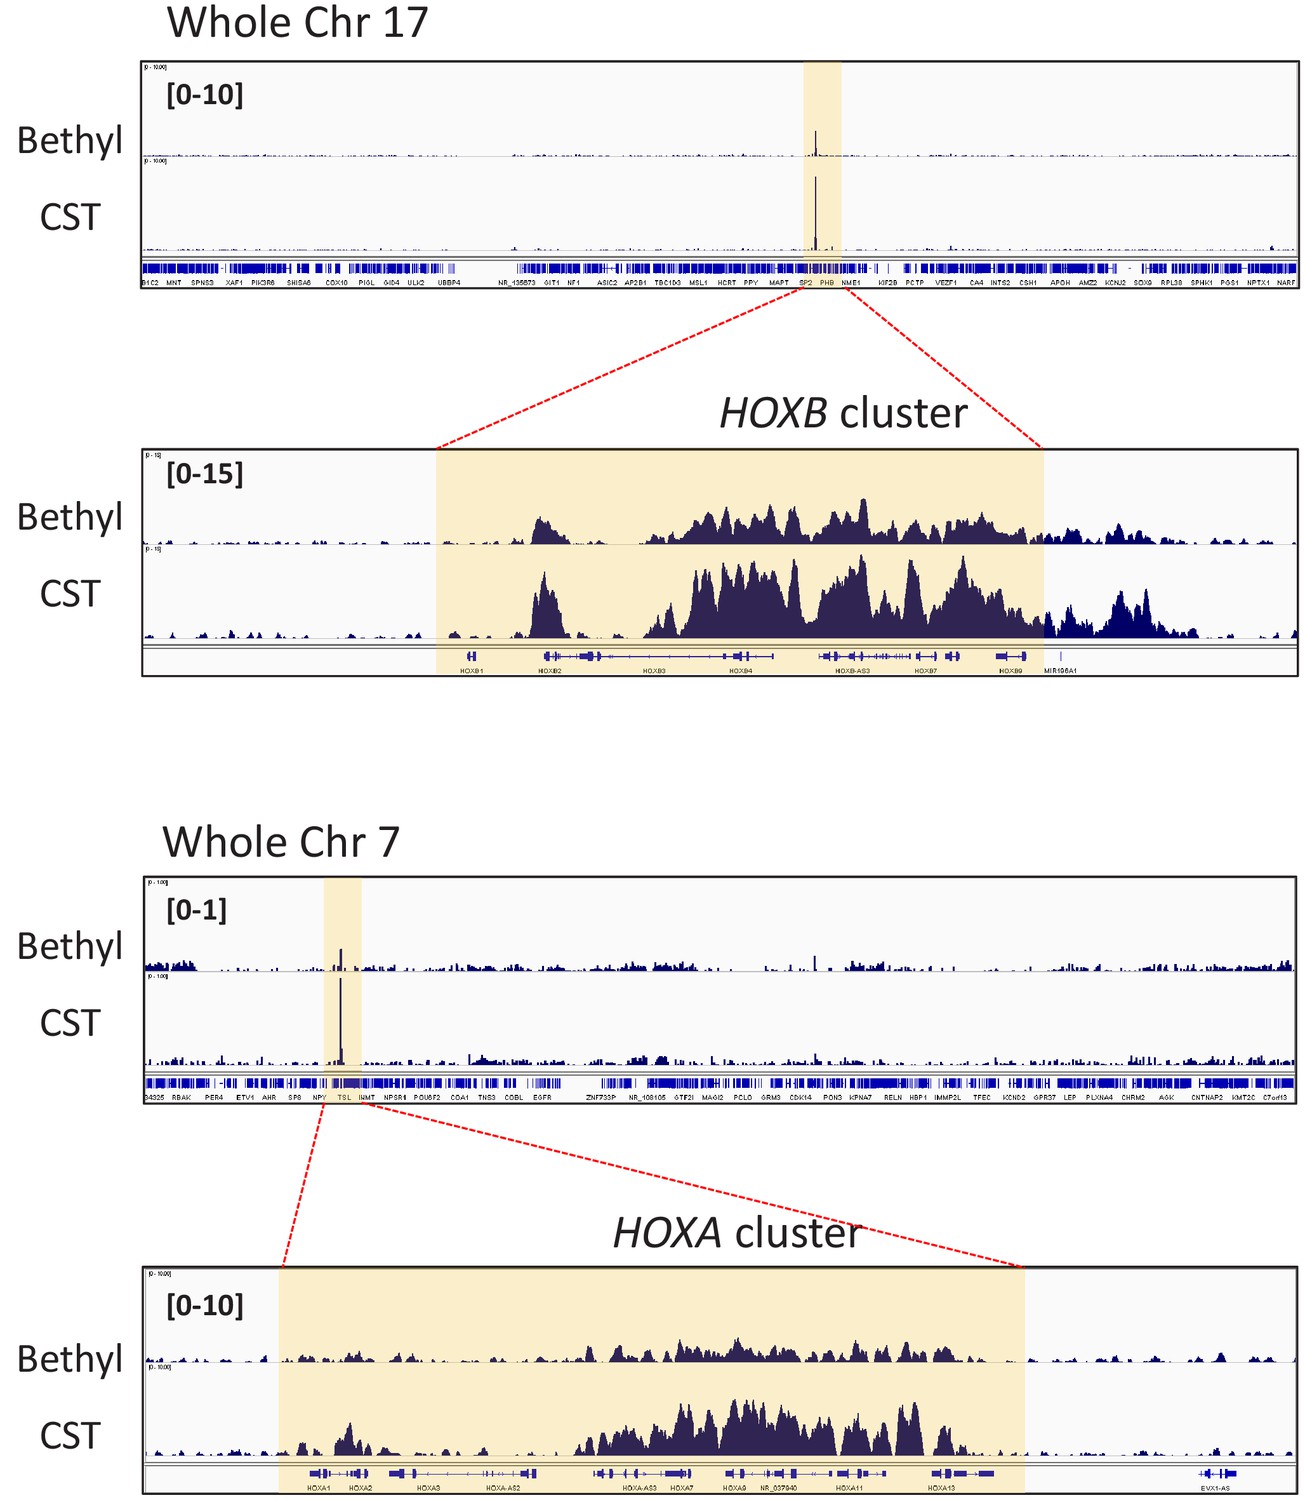
Two different anti-CRM1 antibodies show similar binding profiles of CRM1.
ChIP-seq was performed in LOUCY cells using two different anti-CRM1 antibodies (CST, D6V7N, #46249, rabbit monoclonal; Bethyl Laboratories, A300-469A rabbit polyclonal). Binding profiles of CRM1 in LOUCY cells are indicated: (A) whole chromosome 17 and HOXB cluster, (B) whole chromosome seven and HOXA cluster.
Figure 1—figure supplement 2
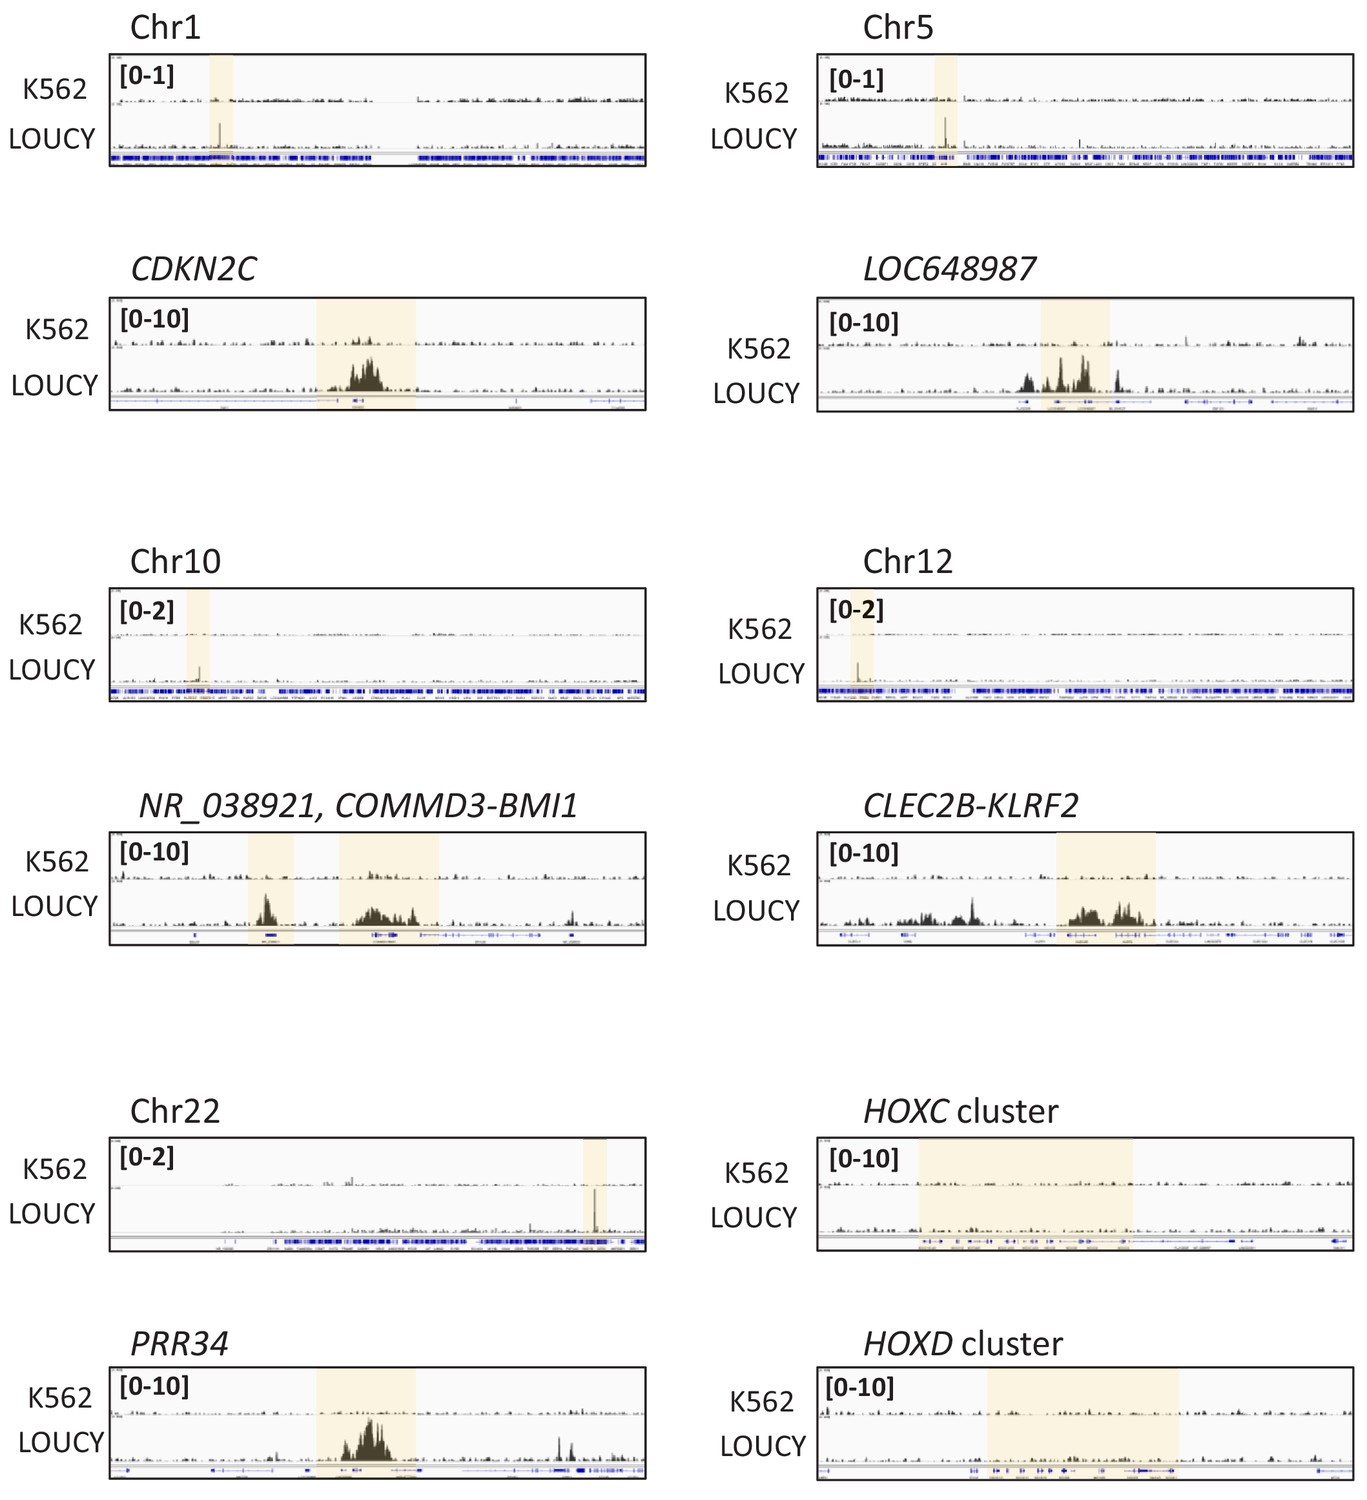
CRM1 accumulates on specific genome regions.
Binding profiles of CRM1 in K562 and LOUCY cell lines. Whole chromosomes (1, 5, 10, 12, 22) and specific regions [CDKN2C (Chr.1); LOC648987 (Chr.5); NR_038921, COMMD3-BMI1 (Chr.10); CLEC2B-KLRF2 (Chr.12); PRR34 (Chr.22)], and HOXC and HOXD cluster regions are shown.
Figure 2 with 1 supplement
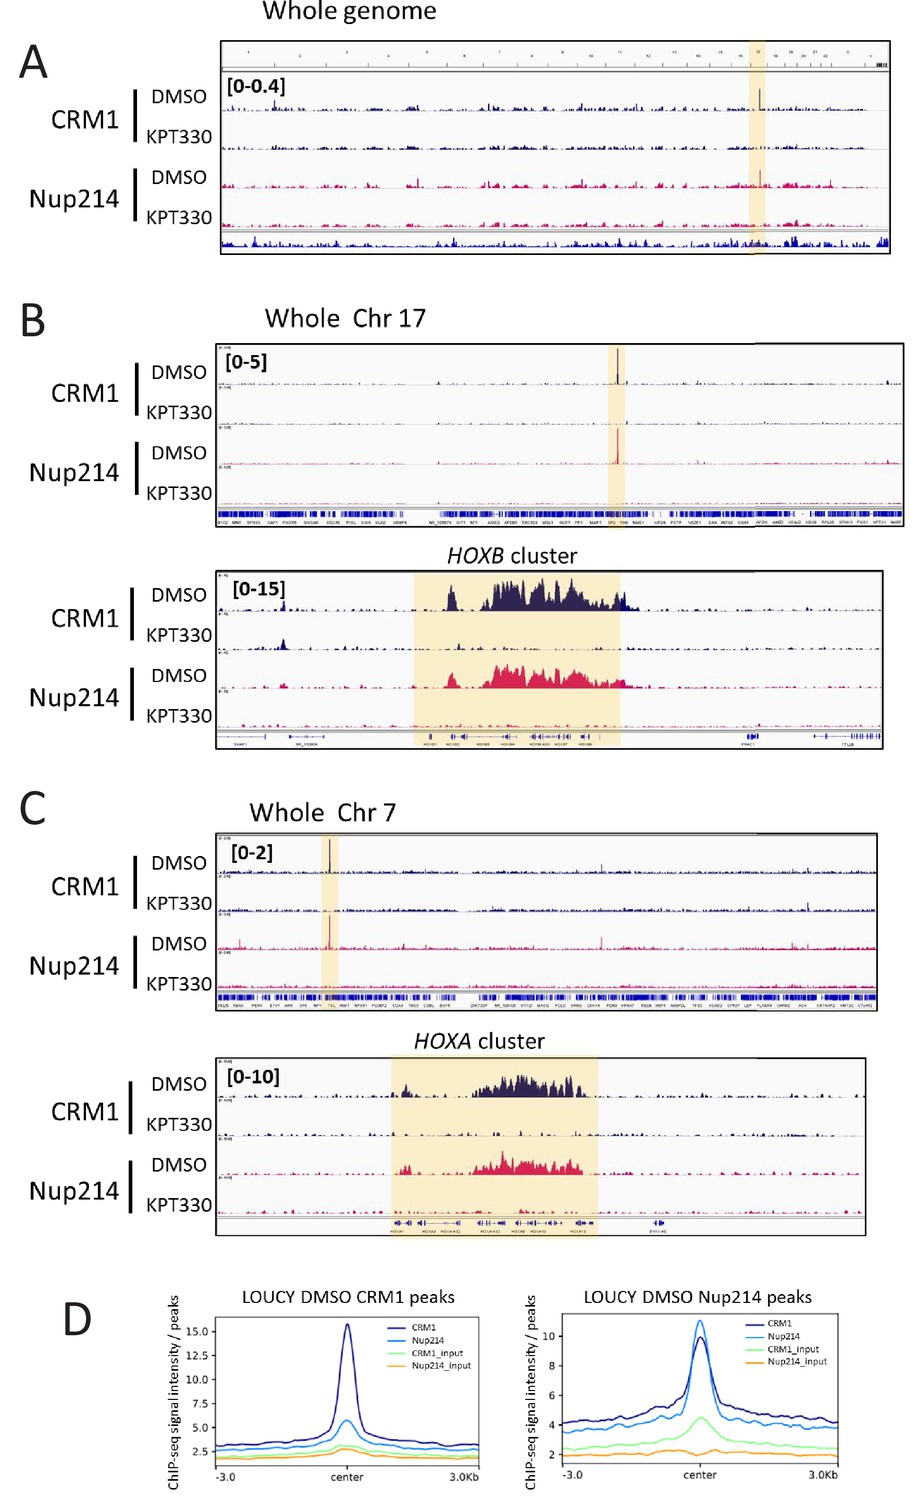
Accumulation of CRM1 and SET-Nup214 on HOX clusters is sensitive to CRM1 inhibitor KPT-330.
(A–C) The binding profiles of CRM1 and Nup214 in LOUCY cell line treated either in the presence of DMSO (vehicle control) or KPT-330 (1000 nM) for 24 hr. (A: whole genome, B: whole chromosome 17 and HOXB cluster, C: whole chromosome seven and HOXA cluster). (D) Aggregation plots of CRM1 and SET-Nup214 binding sites in LOUCY. Nup214 binding signals in control (DMSO-treated) cells are mapped against CRM1 binding sites (left panel), and CRM1 binding signals are mapped against Nup214 binding sites (right panel).
Figure 2—figure supplement 1
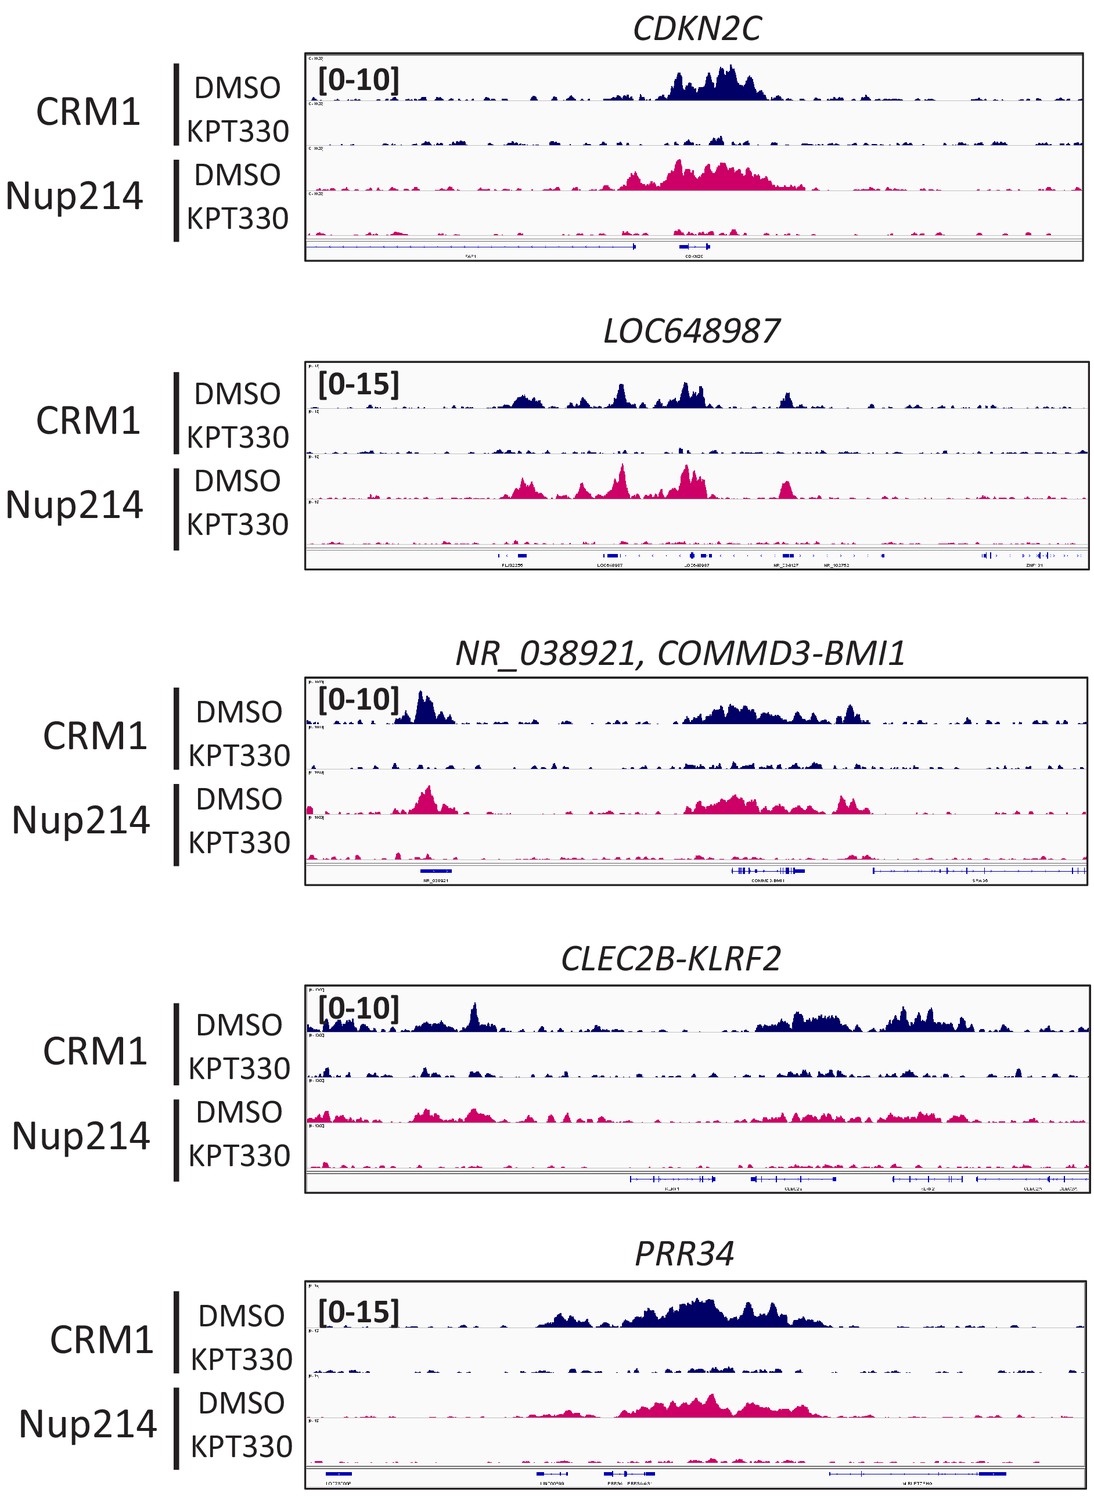
Accumulation of CRM1 and Nup214 on specific genome regions is sensitive to CRM1 inhibitor KPT-330.
Binding profiles of CRM1 and Nup214 in LOUCY cell line treated either in the presence of DMSO (vehicle control) or KPT-330 (1000 nM) for 24 hr. Specific regions (CDKN2, LOC648987, NR_038921 COMMD3-BMI1, CLEC2B-KLRF2, and PRR34) are shown.
Figure 3 with 5 supplements

The expression of HOX genes in LOUCY cells are sensitive to CRM1 inhibitor KPT-330.
(A) Protein expression of Nup214, SET-Nup214, CRM1, and GAPDH. LOUCY, HL60, and K562 cell lines were cultured either with DMSO (vehicle control) or KPT330 (1000 nM) for 24 hr; cell lysates were prepared by boiling the cells in a sample buffer and analyzed by immunoblotting using anti-Nup214, anti-CRM1, or anti-GAPDH antibodies. (B) qPCR analysis of HOX cluster genes (HOXA9, HOXA11, HOXB4, and HOXB9) in LOUCY, K562, and HL60 cell lines treated with DMSO (vehicle control) or KPT-330 (100 nM or 1000 nM) for 24 hr. GAPDH was used as a reference gene. Data are presented as mean values ± SEM of three independent experiments (n = 3). (C) The data in (B) were reanalyzed for the ratio as compared with the value for DMSO treated samples. Data are presented as mean values ± SEM. Low expressed genes (HOXA9 and HOXA11) in K562 cells were omitted in (C). Asterisks indicate statistical significance determined by Student’s t-test; *p<0.05; **p<0.01; ***p<0.001.
Figure 3—figure supplement 1
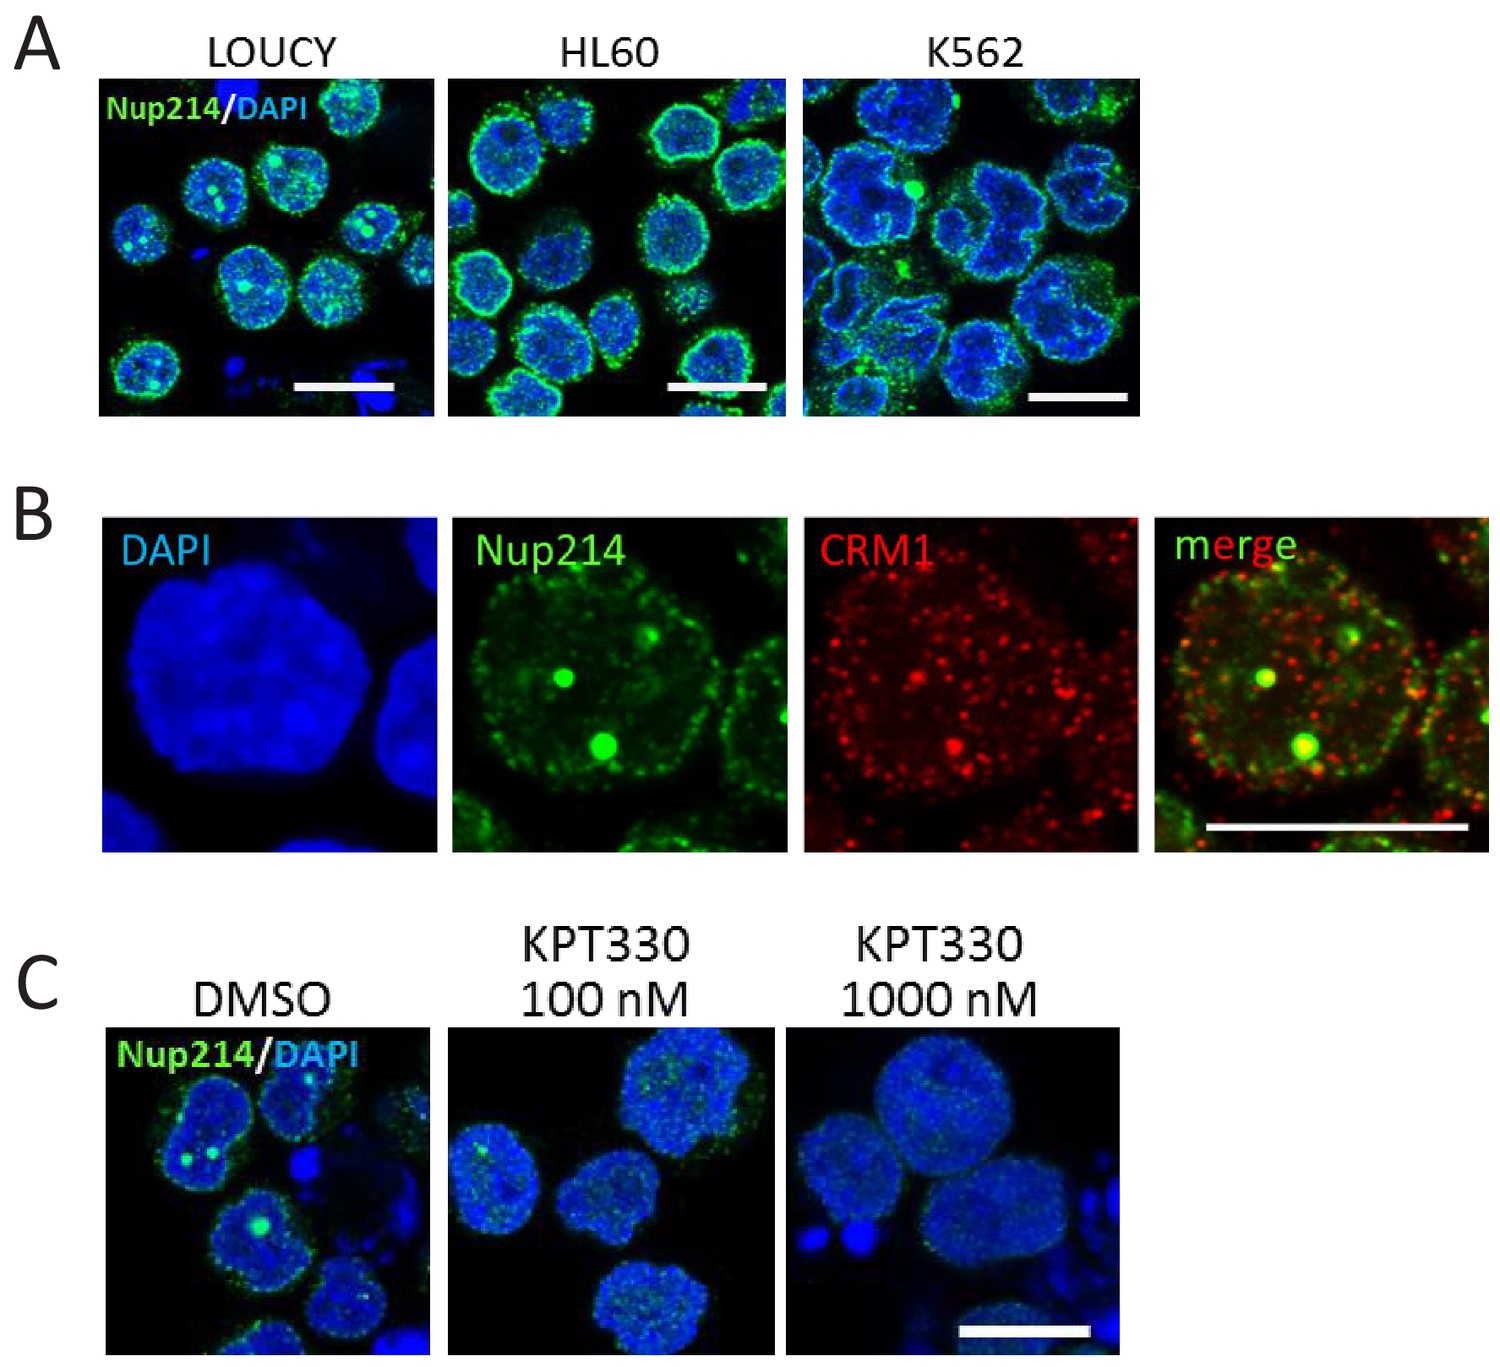
The nuclear dot structure in LOUCY cells are sensitive to CRM1 inhibitor KPT-330.
(A) Subcellular localization of Nup214 in LOUCY, HL60, and K562 cell lines. Cells were immunostained with anti-Nup214 antibody and observed by confocal microscopy. DAPI staining was used to visualize nuclei. Scale bars: 10 µm. (B) LOUCY cells were co-immunostained with anti-CRM1 and anti-Nup214 antibodies and observed by confocal microscopy. DAPI staining was used to visualize nuclei. Scale bar: 10 µm. (C) LOUCY cells were cultured in the presence of DMSO (vehicle control) or KPT-330 (100 nM or 1000 nM) for 24 hr, and immunostained with anti-Nup214 antibody. DAPI staining was used to visualize nuclei. Scale bar: 10 µm.
Figure 3—figure supplement 2
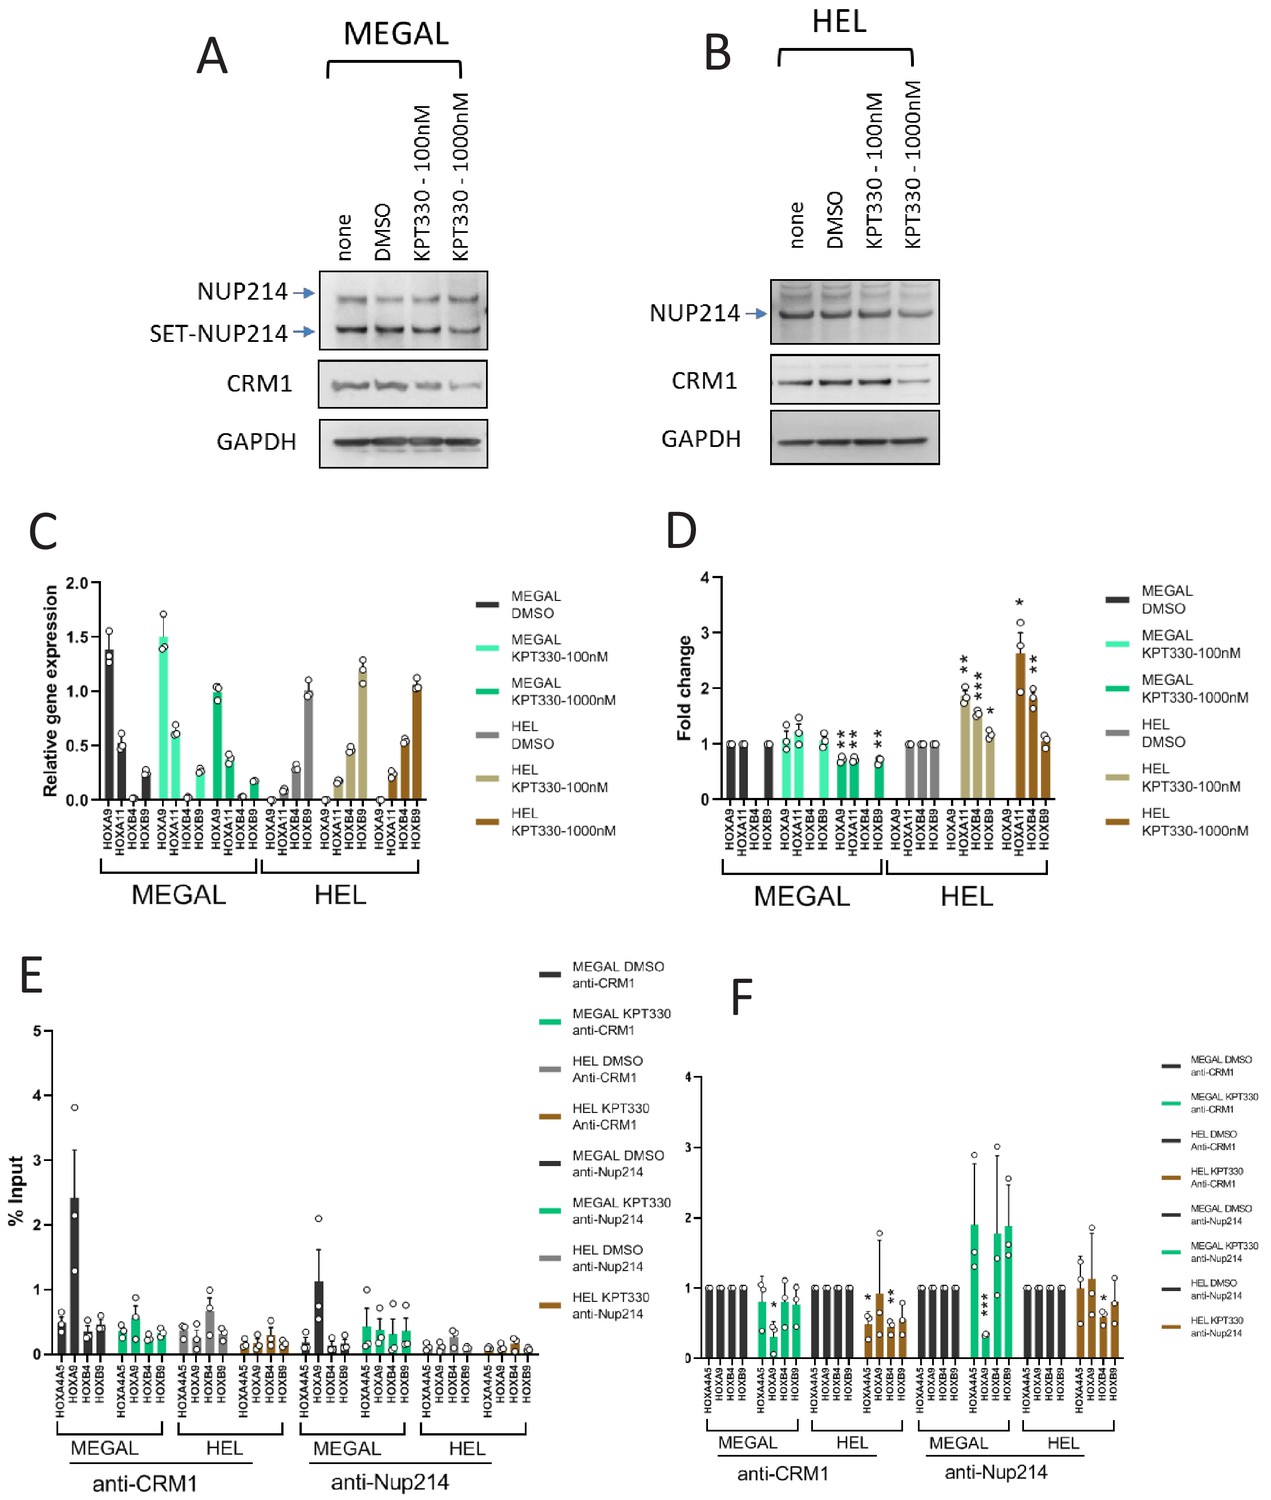
The effect of KPT-330 on gene expression, and binding of CRM1 to HOX regions in MEGAL and HEL cells.
(A-B) Protein expression of Nup214, SET-Nup214, CRM1, and GAPDH. (A) MEGAL and (B) HEL cells were cultured in the absence or presence of DMSO (vehicle control) or KPT-330 (100 nM or 1000 nM) for 24 hr; cell lysates were prepared using RIPA buffer and analyzed by immunoblotting using anti-Nup214, anti-CRM1, or anti-GAPDH antibodies. (C) qPCR analysis of HOX cluster genes (HOXA9, HOXA11, HOXB4, and HOXB9) in MEGAL and HEL cells treated without or with DMSO (vehicle control) or KPT-330 (100 nM or 1000 nM) for 24 hr. GAPDH was used as a reference gene. Data are presented as mean values ± SEM of three independent experiments (n = 3). (D) The data in (C) were reanalyzed to obtain a ratio by comparing with the values for DMSO-treated samples. Note that low expression genes (HOXA9 in HEL and HOXB4 in MEGAL) were omitted in (D). Data are presented as mean values ± SEM. Asterisks indicate statistical significance determined by Student’s t-test; *p<0.05; **p<0.01; ***p<0.001. (E) ChIP-qPCR analysis of CRM1 and Nup214 at HOX gene loci in MEGAL and HEL cells cultured either in the presence of DMSO (vehicle control) or KPT-330 (1000 nM) for 24 hr. The primer set used was as follows: HOXA4A5 (intergenic region between HOXA4 and HOXA5); HOXA9 (promoter); HOXB4 (promoter); HOXB9 (promoter). Data are presented as mean values ± SEM of three independent experiments (n = 3). (F) The data in (E) were reanalyzed to obtain a ratio by comparing with the value for DMSO treated samples. Data are presented as mean values ± SEM. Asterisks indicate statistical significance determined by Student’s t-test; *p<0.05; **p<0.01; ***p<0.001.
Figure 3—figure supplement 3
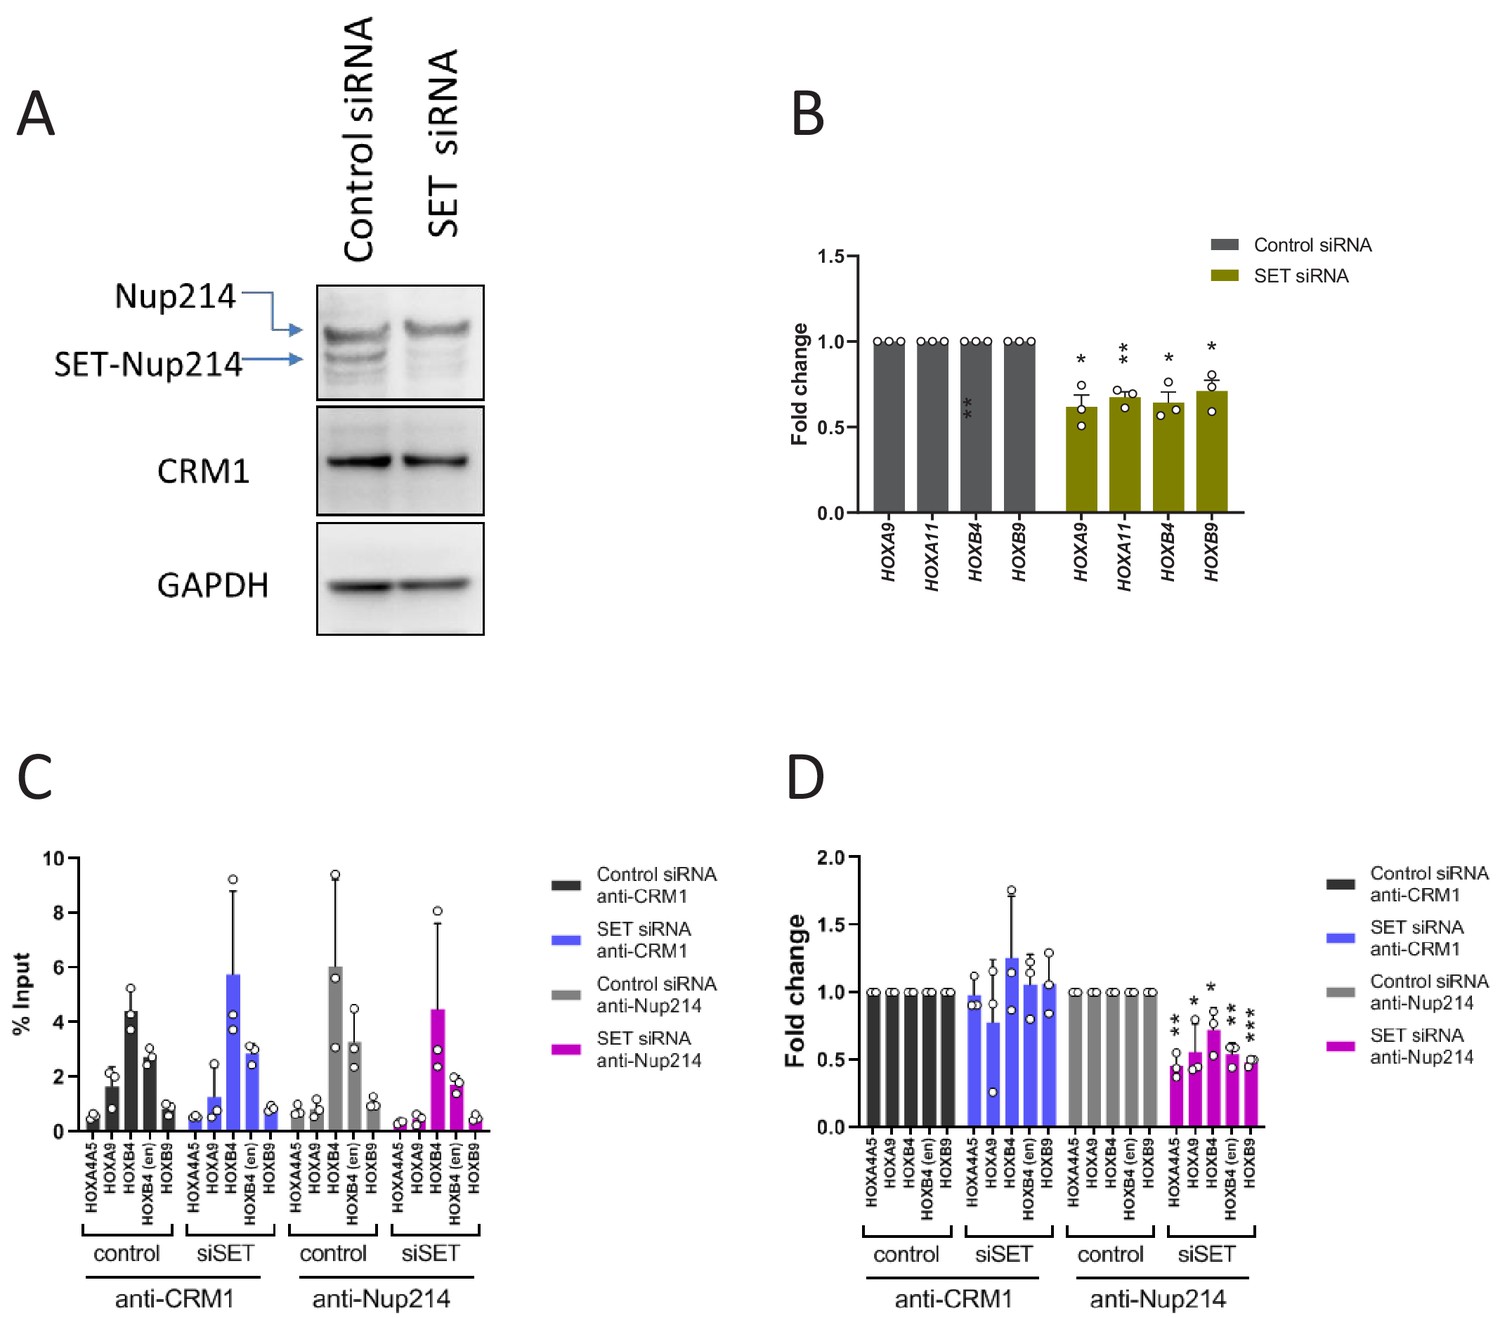
Effect of SET-Nup214 knockdown.
(A) Knockdown of SET-Nup214 was examined 4 days after nucleofection with either negative control siRNA or siRNA against SET by immunoblotting using anti-Nup214, anti-CRM1, or anti-GAPDH antibodies. (B) qPCR analysis of HOX cluster genes (HOXA9, HOXA11, HOXB4, and HOXB9) was performed using control siRNA or SET siRNA treated LOUCY cells (4 days). GAPDH was used as a reference gene. The data were expressed as fold change by comparing the SET siRNA values with the values for the control siRNA-treated samples. Data are presented as mean values ± SEM of three independent experiments (n = 3). Asterisks indicate statistical significance determined by Student’s t-test; *p<0.05; **p<0.01. (C) ChIP-qPCR analysis was performed using control siRNA or SET siRNA treated LOUCY cells (4 days). The primer set used was as follows: HOXA4A5 (intergenic region between HOXA4 and HOXA5); HOXA9 (promoter); HOXB4 (promoter); HOXB4 (enhancer); HOXB9 (promoter). Data are presented as mean values ± SEM of three independent experiments (n = 3). (D) The data in (C) were reanalyzed to obtain a ratio by comparing with the value for control siRNA-treated samples. Data are presented as mean values ± SEM. Asterisks indicate statistical significance determined by Student’s t-test; *p<0.05; **p<0.01; ***p<0.001.
Figure 3—figure supplement 4
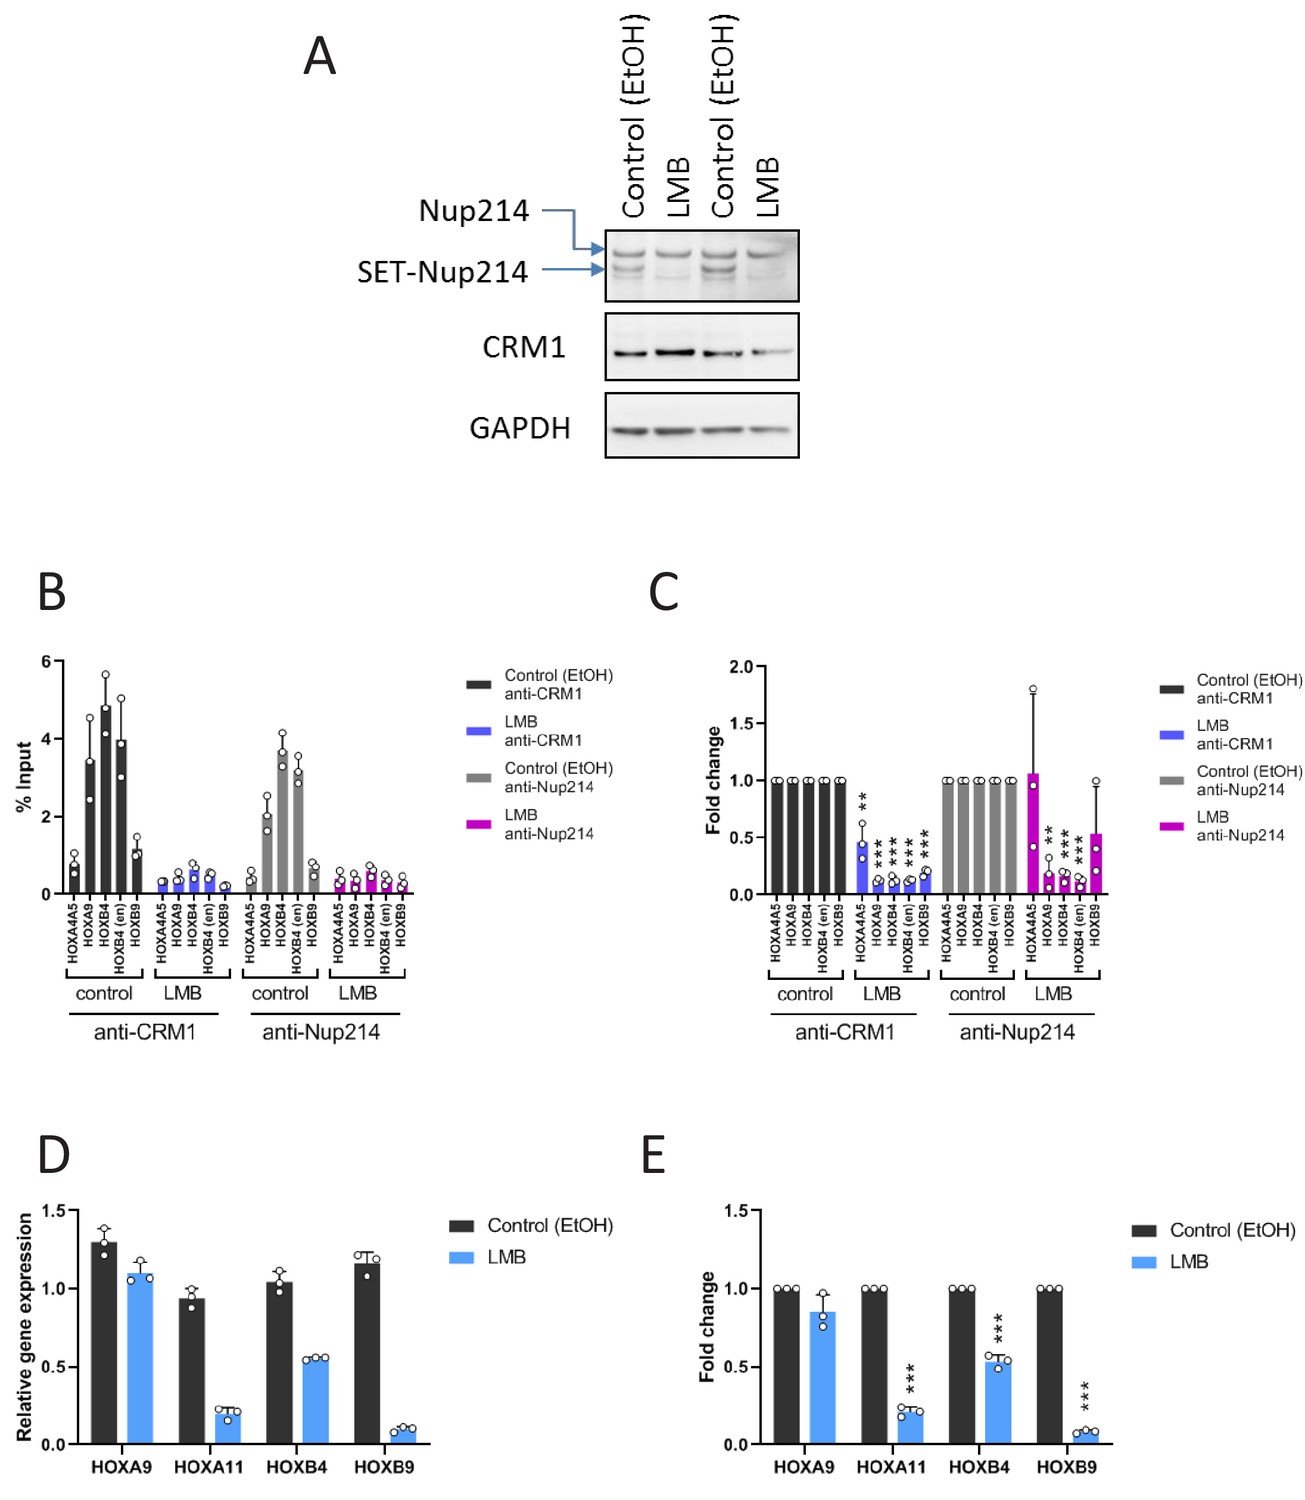
Effect of LMB on the accumulation of SET-Nup214/CRM1 onto HOX regions and gene activation.
(A) LOUCY cells were either treated with EtOH (vehicle control) or LMB (10 nM) for 24 hr. Cell lysates (in duplicate) were analyzed by immunoblotting using anti-Nup214, anti-CRM1, or anti-GAPDH antibodies. (B) ChIP-qPCR analysis of CRM1 and Nup214 at HOX gene loci in LOUCY cells cultured either in the presence of EtOH (vehicle control) or LMB (10 nM) for 24 hr. The primer set used was as follows: HOXA4A5 (intergenic region between HOXA4 and HOXA5); HOXA9 (promoter); HOXB4 (promoter); HOXB4 (enhancer); HOXB9 (promoter). Data are presented as mean values ± SEM of three independent experiments (n = 3). (C) The data in (B) were reanalyzed to obtain a ratio by comparing with the value for EtOH treated samples. Data are presented as mean values ± SEM. Asterisks indicate statistical significance determined by Student’s t-test; **p<0.01; ***p<0.001. (D) qPCR analysis of HOX cluster genes (HOXA9, HOXA11, HOXB4, and HOXB9) in LOUCY cells treated either with EtOH (vehicle control) or LMB (10 nM) for 24 hr. GAPDH was used as a reference gene. Data are presented as mean values ± SEM of three independent experiments (n = 3). (E) The data in (D) were reanalyzed to obtain a ratio by comparing with the value for EtOH treated samples. Data are presented as mean values ± SEM. Asterisks indicate statistical significance determined by Student’s t-test; ***p<0.001.
Figure 3—figure supplement 5
Protein expression and CRM1 binding profiles in HL60 cells.
(A) Protein expression of Nup214, SET-Nup214, CRM1, and GAPDH. LOUCY and HL60 cell lines were cultured in the absence or presence of DMSO (vehicle control) or KPT-330 (100 nM or 1000 nM) for 24 hr; cell lysates were prepared using RIPA buffer and analyzed by immunoblotting with anti-Nup214, anti-CRM1, or anti-GAPDH antibodies. (B–D) CRM1 ChIP-seq for HL60 cells was performed as described in Figure 1. (B: whole genome; C: whole chromosome 17 and HOXB cluster, D: whole chromosome seven and HOXA cluster).
Figure 4 with 1 supplement
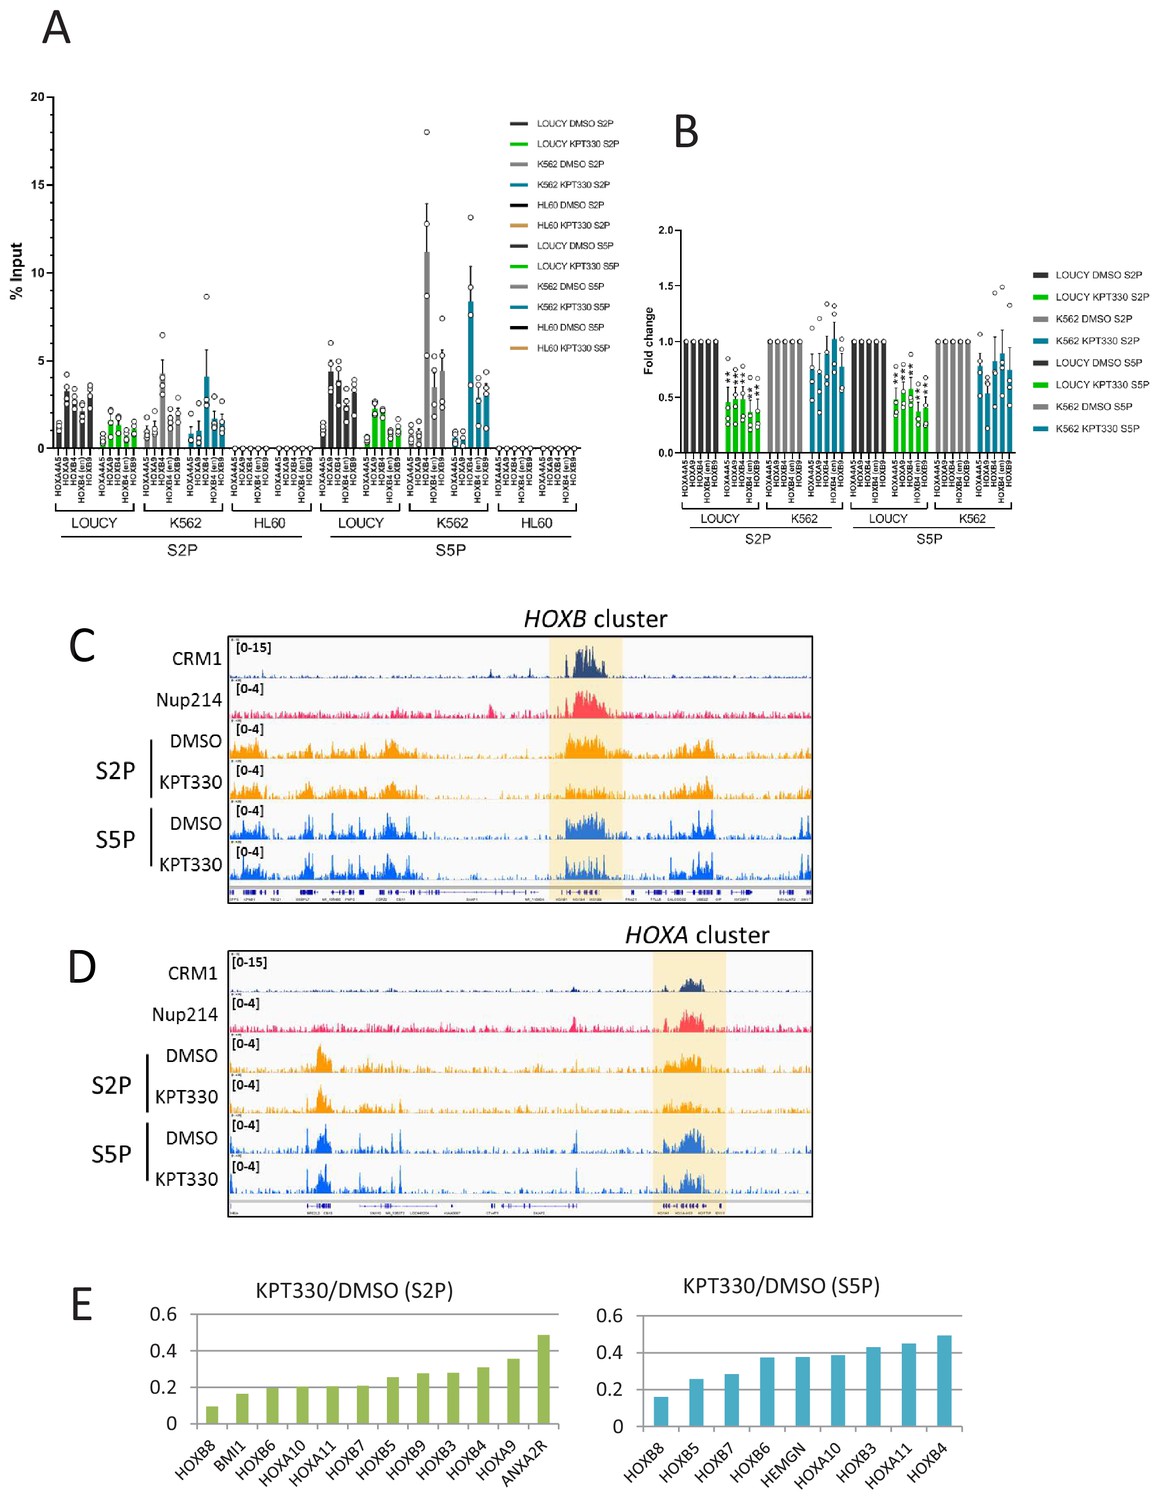
HOX cluster region shows CRM1-dependent activation of RNA Pol II in LOUCY cells.
(A) ChIP-qPCR analysis of active RNA Polymerase II (Pol II) (Ser2- or Ser5-phosphorylated) at HOX gene loci in LOUCY, K562, and HL60 cell lines cultured either in the presence of DMSO (vehicle control) or KPT-330 (1000 nM) for 24 hr. The primer set used was as follows: HOXA4A5 (intergenic region between HOXA4 and HOXA5); HOXA9 (promoter); HOXB4 (promoter); HOXB4 (enhancer); HOXB9 (promoter). Data are presented as mean values ± SEM of four independent experiments (n = 4). (B) The data in (A) were reanalyzed to obtain a ratio by comparing with the value for DMSO treated samples. Data are presented as mean values ± SEM. Asterisks indicate statistical significance determined by Student’s t-test; **p<0.01. (C–D) Binding profiles of Ser2- or Ser5-phosphorylated Pol II at HOXB (C) or HOXA (D) clusters cultured either in the presence of DMSO (vehicle control) or KPT-330 (1000 nM) for 24 hr. (E) The most affected genes (among CRM1-bound genes) by the treatment with KPT-330. S2P (left panel) and S5P (right panel).
Figure 4—figure supplement 1
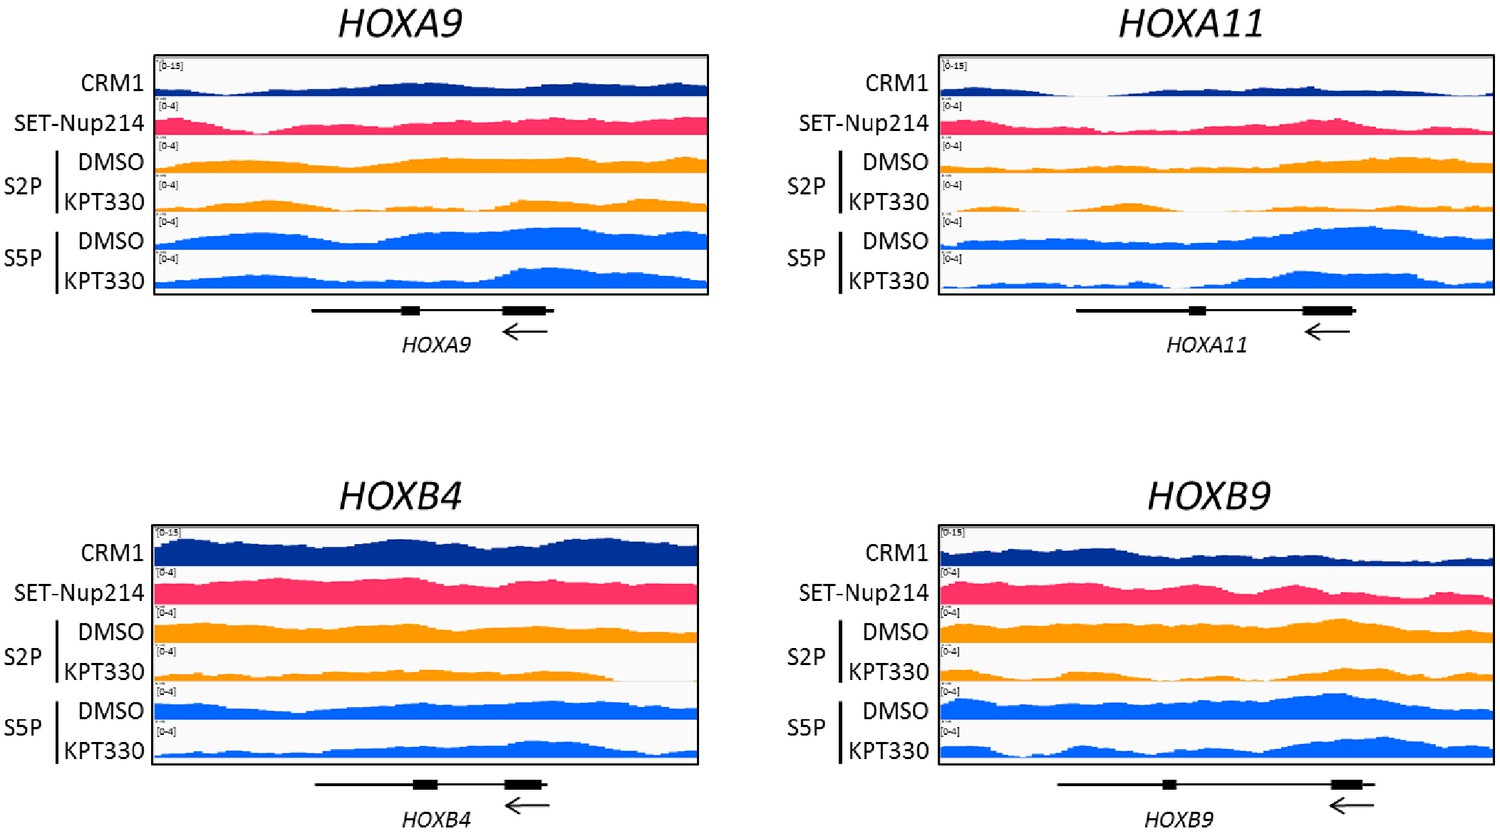
ChIP-seq profiles of CRM1, SET-Nup214, S2P (DMSO, KPT-330), S5P (DMSO, KPT-330) around HOXA9, HOXA11, HOXB4, and HOXB9 genes.
Figure 5 with 3 supplements
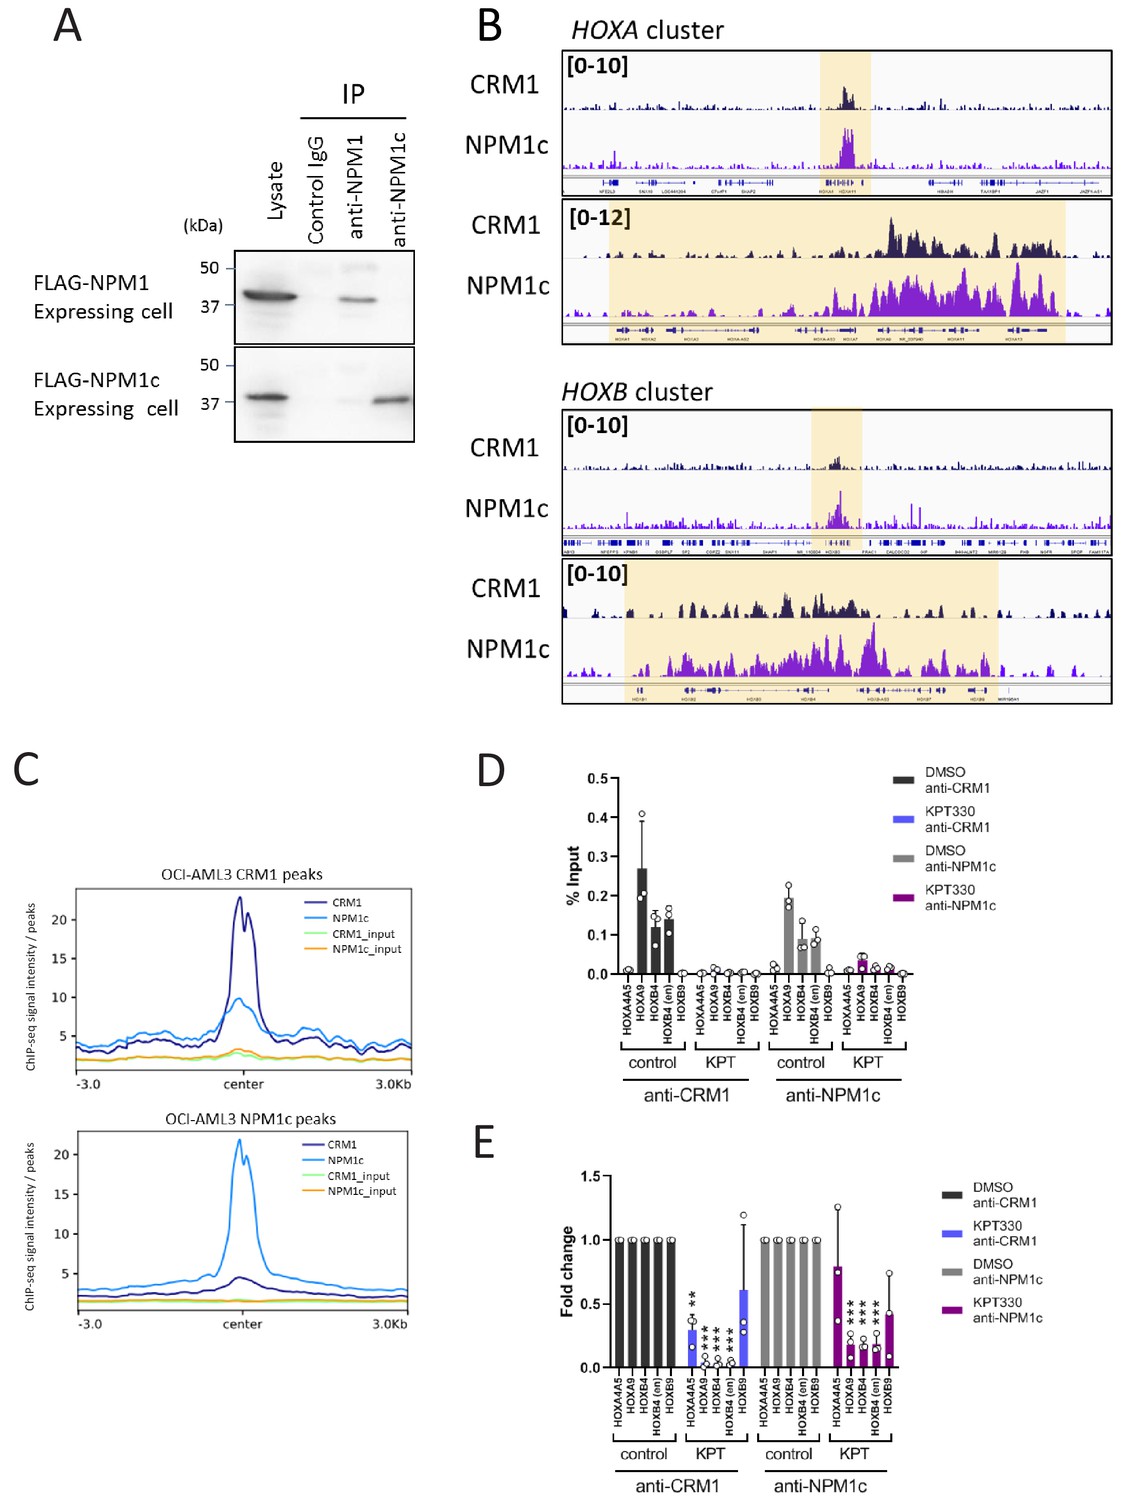
NPM1 mutant NPM1c accumulated onto HOX clusters together with CRM1.
(A) The specificity of anti-NPM1c or anti-NPM1 antibodies was demonstrated by immunoprecipitation. Cell lysates from mouse ES cells stably expressing either FLAG-NPM1 or FLAG-NPM1c were used for immunoprecipitation using indicated antibodies and analyzed by immunoblotting using anti-FLAG antibody. (B) Binding profiles of CRM1 and NPM1c in OCI-AML3 cell line (HOXA and HOXB clusters). ChIP-seq was performed using anti-CRM1 or anti-NPM1c antibodies. (C) Aggregation plots of CRM1 and NPM1c binding sites in OCI-AML3 cells. NPM1c binding signals in control (DMSO-treated) cells are mapped against CRM1 binding sites (top), and CRM1 binding signals of DMSO-treated cells are mapped against NPM1c binding signals (bottom). (D) ChIP-qPCR analysis of CRM1 and NPM1c at HOX gene loci in OCI-AML3 cells cultured either in the presence of DMSO (vehicle control) or KPT-330 (100 nM) for 24 hr. The primer set used was as follows: HOXA4A5 (intergenic region between HOXA4 and HOXA5); HOXA9 (promoter); HOXB4 (promoter); HOXB4 (enhancer); HOXB9 (promoter). Data are presented as mean values ± SEM of three independent experiments (n = 3). (E) The data in (D) were reanalyzed to obtain a ratio by comparing with the value for DMSO-treated samples. Data are presented as mean values ± SEM of three independent experiments (n = 3). Asterisks indicate statistical significance determined by Student’s t-test; **p<0.01; ***p<0.001.
Figure 5—figure supplement 1
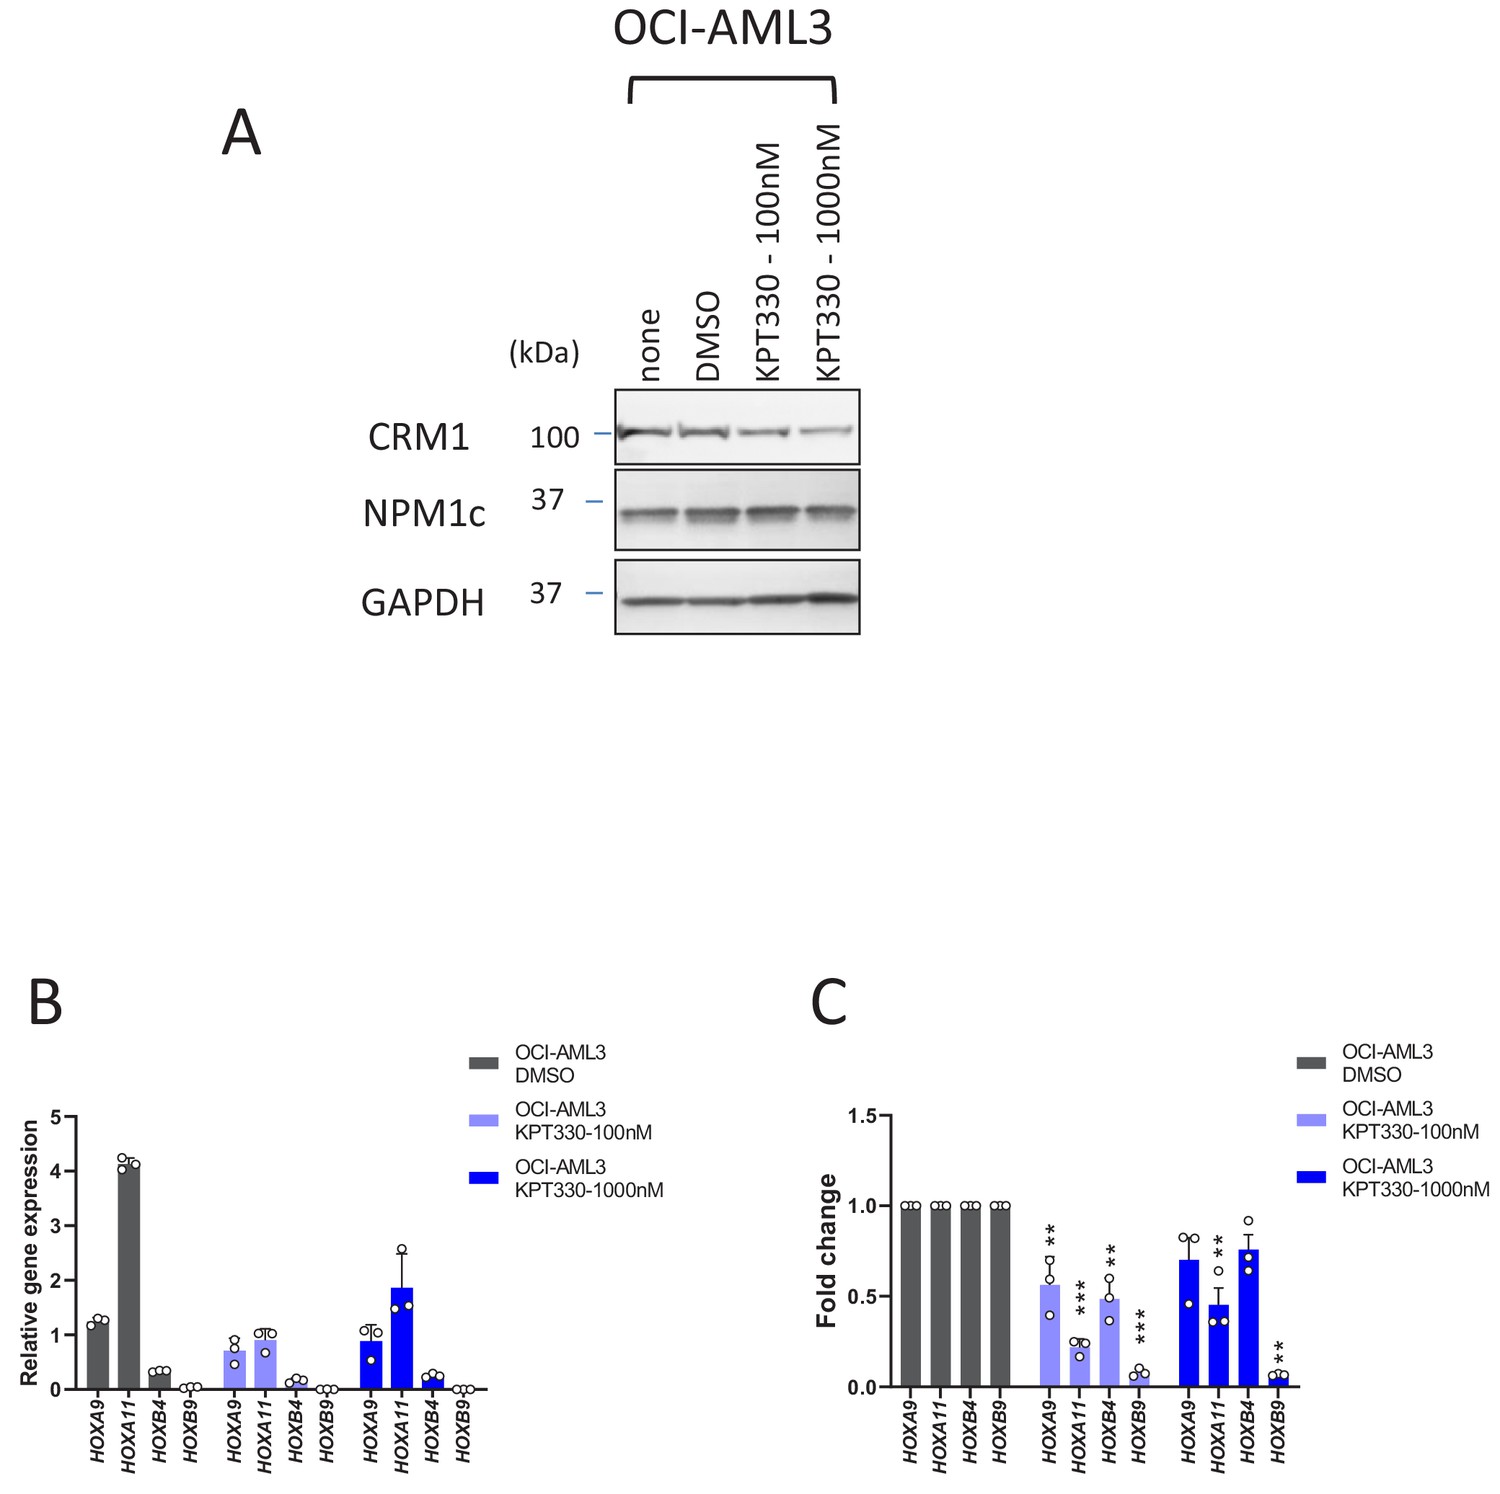
The effect of KPT-330 on the protein and HOX gene expression levels in OCI-AML3 cells.
(A) Protein expression of CRM1, NPM1c and GAPDH in OCI-AML3 cells cultured in the absence or presence of DMSO (vehicle control) or KPT-330 (100 nM or 1000 nM) for 24 hr. The cell lysates were prepared in RIPA buffer and analyzed by immunoblotting using anti-CRM1, anti-NPM1c, or anti-GAPDH antibodies. (B) qPCR analysis of HOX cluster genes (HOXA9, HOXA11, HOXB4, and HOXB9) in OCI-AML3 cells treated with DMSO (vehicle control) or KPT-330 (100 nM or 1000 nM) for 24 hr. GAPDH was used as a reference gene. Data are presented as mean values ± SEM of three independent experiments (n = 3). (C) The data in (B) were reanalyzed to obtain a ratio by comparing the values of the KPT-330-treated samples with the values for DMSO-treated samples. Data are presented as mean values ± SEM. Asterisks indicate statistical significance determined by Student’s t-test; **p<0.01; ***p<0.001.
Figure 5—figure supplement 2
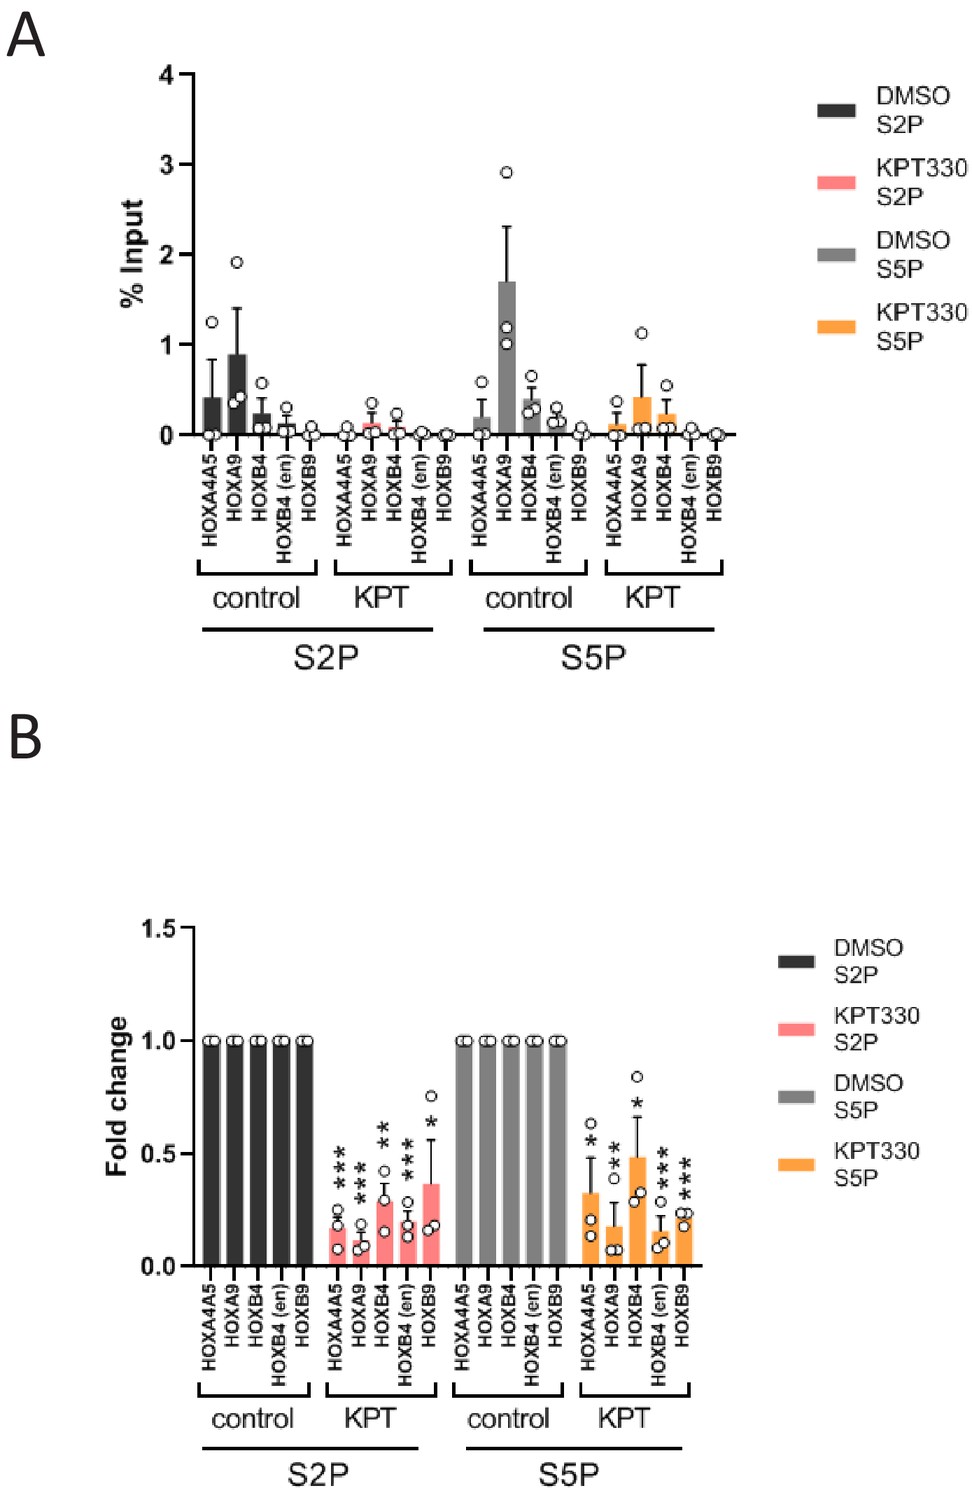
The effect of KPT-330 on active Pol II at HOX loci in OCI-AML3 cell line.
(A) ChIP-qPCR analysis of active RNA Polymerase II (Pol II) (Ser2- or Ser5-phosphorylated) at HOX gene loci in OCI-AML3 cell line cultured either in the presence of DMSO (vehicle control) or KPT-330 (100 nM) for 24 hr. The primer set used was as follows: HOXA4A5 (intergenic region between HOXA4 and HOXA5); HOXA9 (promoter); HOXB4 (promoter); HOXB4 (enhancer); HOXB9 (promoter). Data are presented as mean values ± SEM of three independent experiments (n = 3). (B) The data in (A) were reanalyzed to obtain a ratio by comparing with the value for DMSO treated samples. Data are presented as mean values ± SEM. Asterisks indicate statistical significance determined by Student’s t-test; *p<0.05; **p<0.01; ***p<0.001.
Figure 5—figure supplement 3
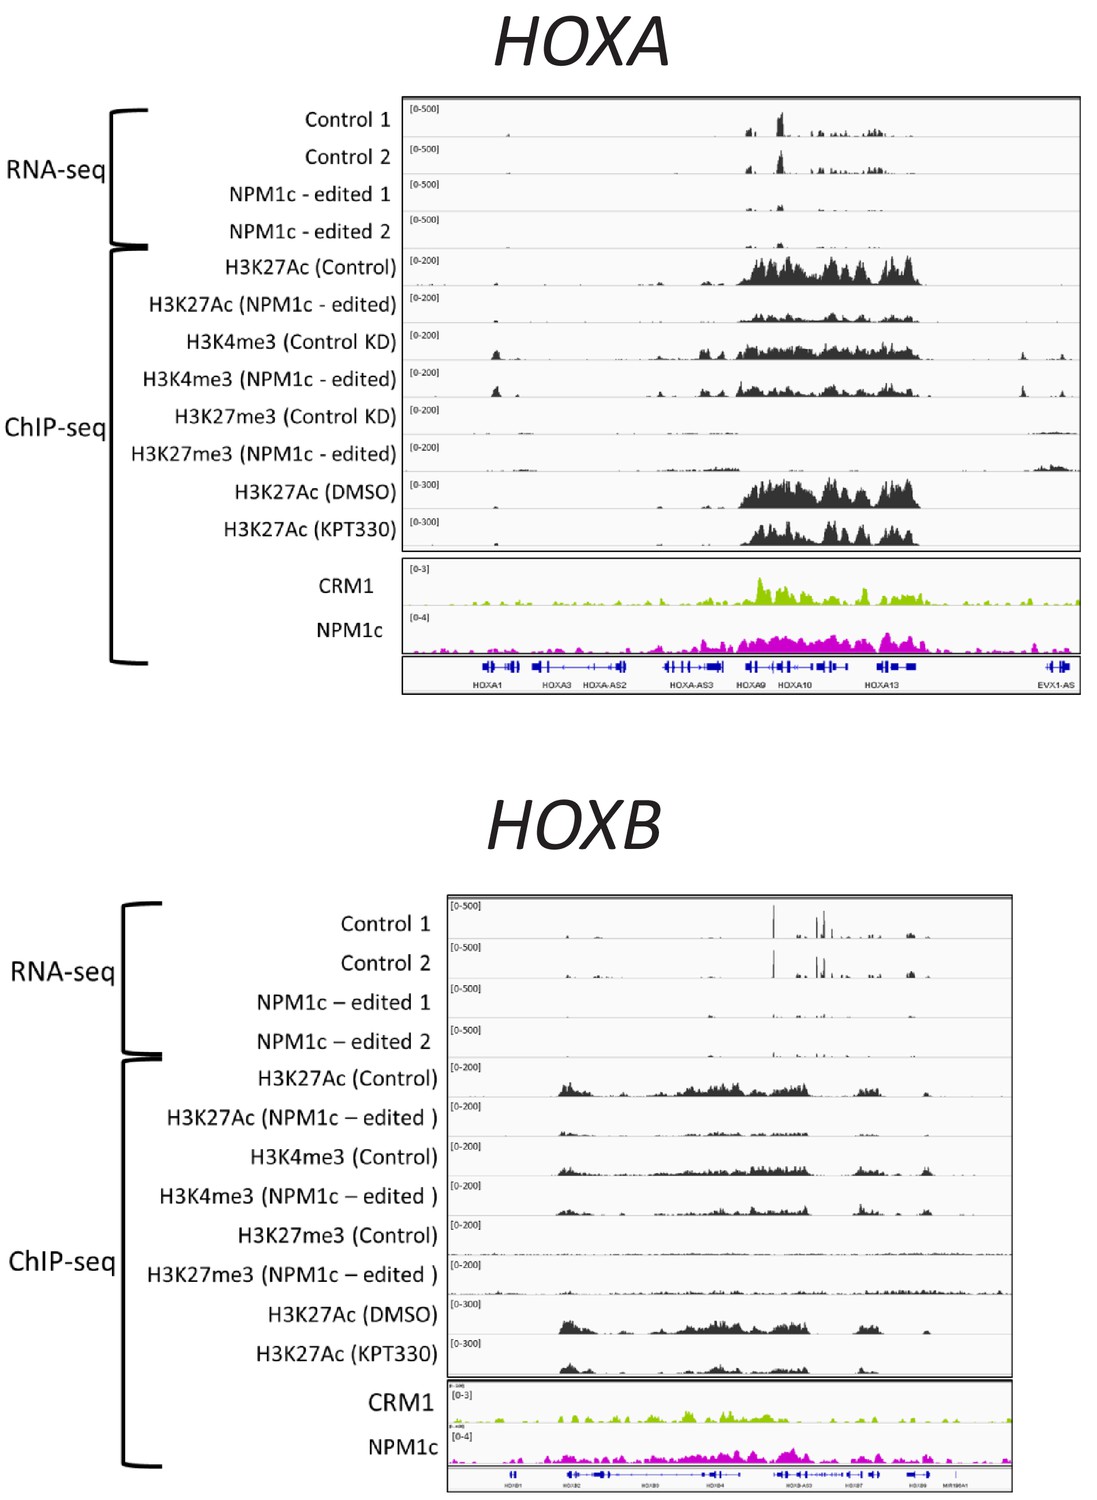
ChIP-seq data in this study (CRM1 and NPM1c in OCI-AML3 cells) were analyzed for comparison with RNA-seq and ChIP-seq data in OCI-AML3 (Brunetti et al., 2018).
RNA-seq data from GSE111178 [for control cells (sgCD45): GSM3024870_O3_CD45_d3_1 and GSM3024871_O3_CD45_d3_2, for NPM1c-edited (NES-disrupted NPM1c expressing) cells (sgNPM1c): GSM3024872_O3_sgNPM1c_d3_1 and GSM3024873_O3_sgNPM1c_d3_2), ChIP-seq data from GSE111179 (for H3K27Ac: GSM3024901_O3_sgCD45_H3K27ac, GSM3024904_O3_sgNPM1c_H3K27ac, GSM3024909_O3_DMSO_H3K27ac and GSM3024910_O3_KPT_H3K27ac), for H3K4me3: GSM3024903_O3_sgCD45_H3K4me3 and GSM3024906_O3_sgNPM1c_H3K4me3), for H3K27me3 (GSM3024902_O3_sgCD45_H3K27me3 and GSM3024905_O3_sgNPM1c_H3K27me3)].
Figure 6 with 1 supplement
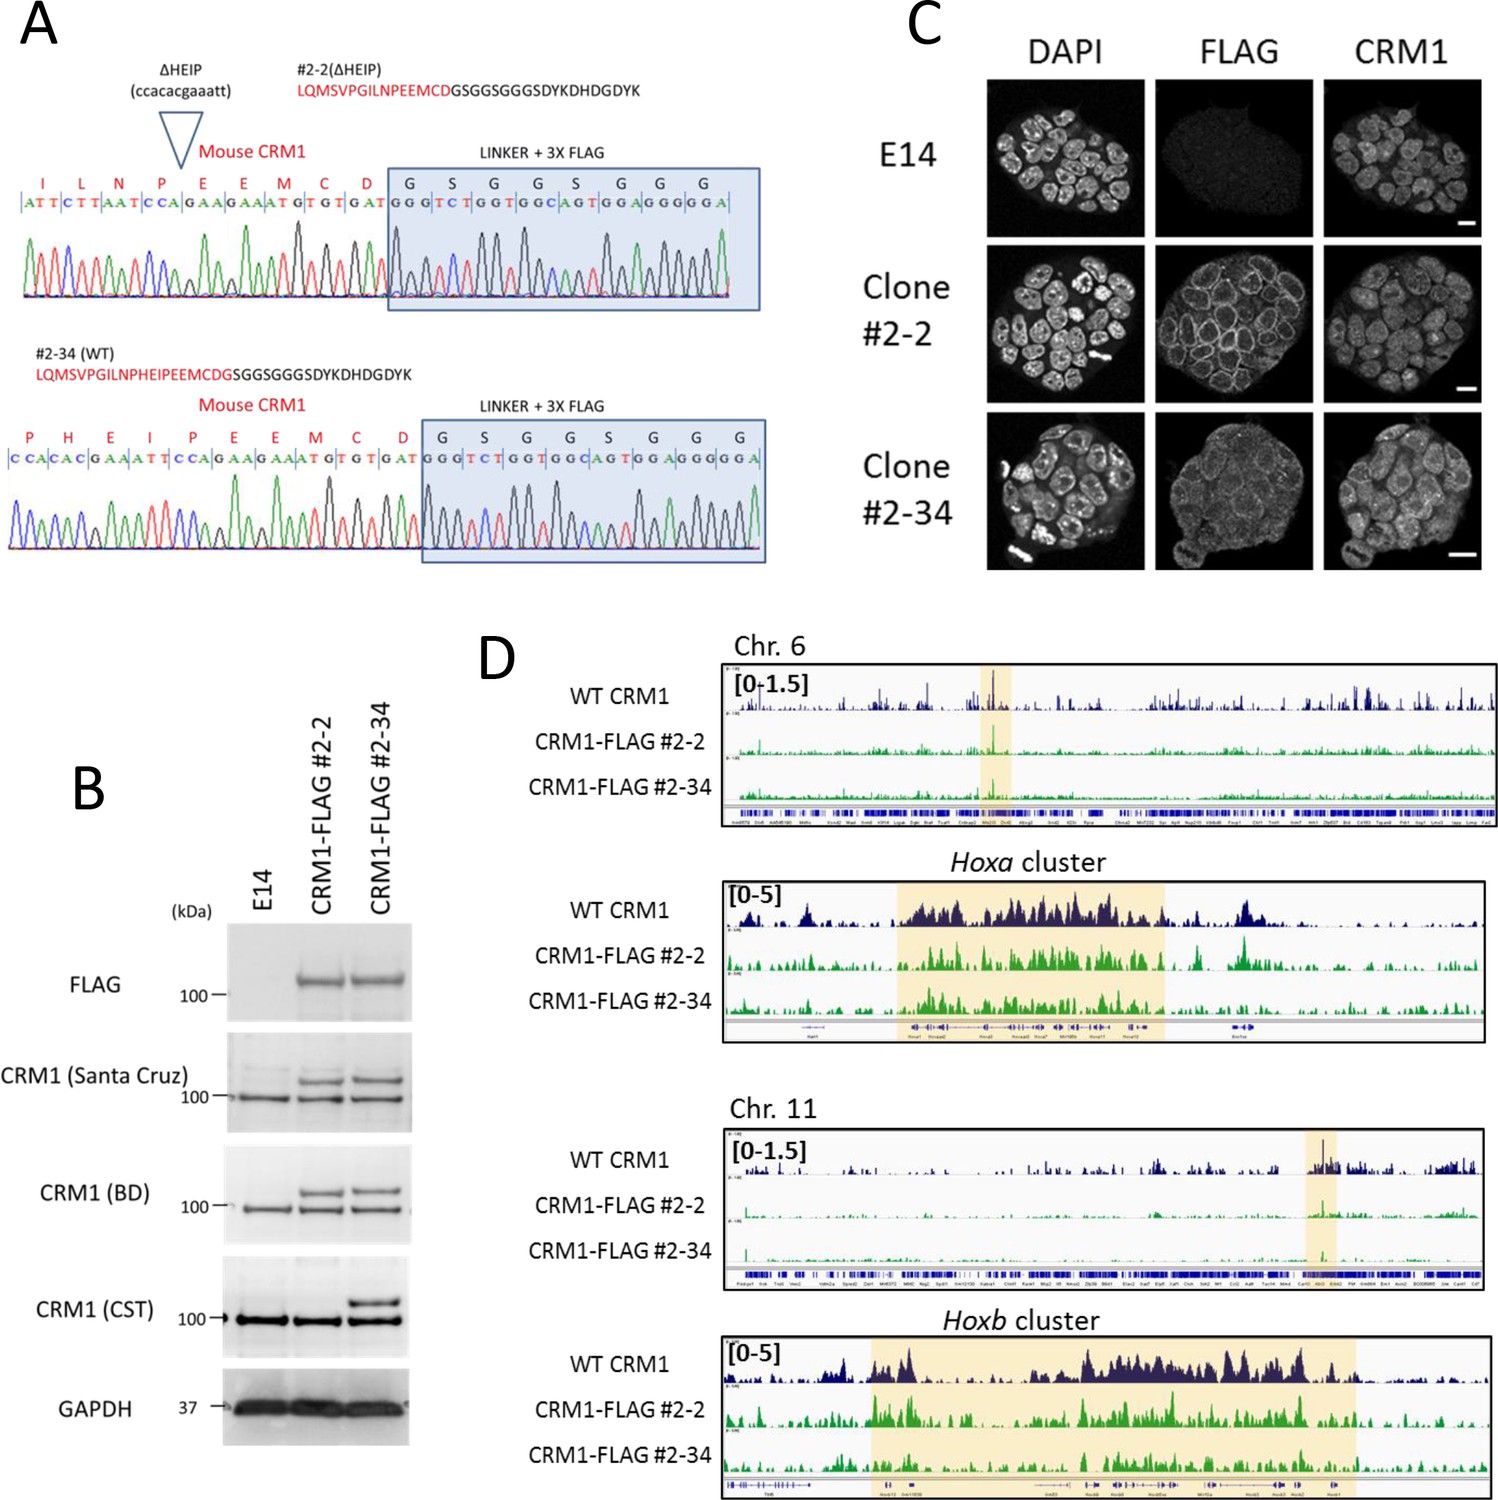
Characterization of the cell lines that express C-terminal FLAG-tagged endogenous CRM1 generated by genome editing.
(A) Genome sequence analysis of FLAG-tag knocked-in cells (ΔHEIP [clone#2–2] or WT [clone#2–34; no deletion]). (B) Immunoblotting analysis of cell lines using anti-FLAG, anti-CRM1, or anti-GAPDH antibodies. (C) Immunofluorescent analysis of cell lines using anti-FLAG and anti-CRM1 antibodies. Scale bars: 10μm. (D) ChIP-seq analysis of cell lines using anti-CRM1 (EB3; E14 derived ES; dark blue) or anti-FLAG antibody (FLAG-knocked-in ES cells; #2-2[ΔHEIP] or #2–34 [no deletion]). Whole chromosome six and HoxA cluster regions, or whole chromosome 11 and HoxB cluster regions are shown.
Figure 6—figure supplement 1
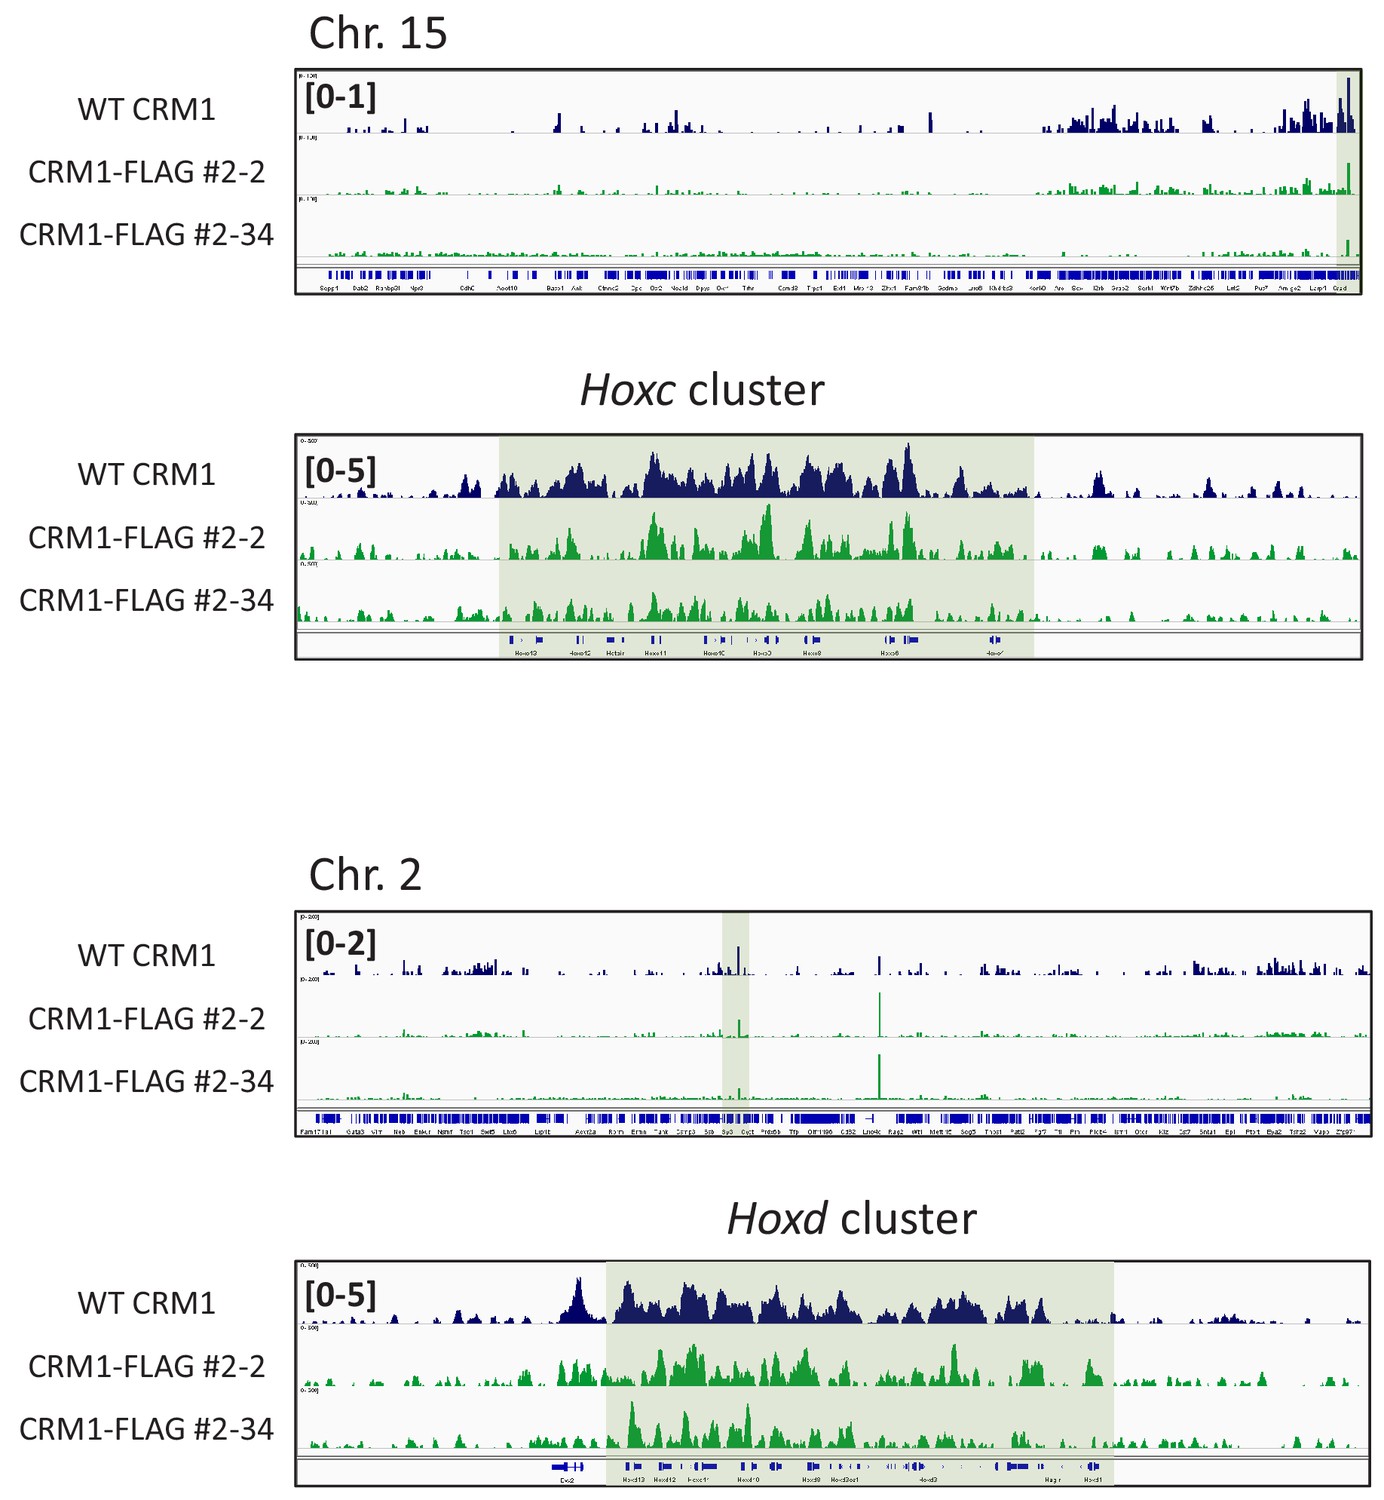
ChIP-seq analysis of indicated cell lines.
ChIP-seq was performed using anti-CRM1 (EB3; E14 derived ES; dark blue) or anti-FLAG antibody (FLAG-knocked-in ES cells; #2–34 [no deletion] or #2-2[ΔHEIP]). Whole chromosome 15 and HoxC cluster regions, or whole chromosome two and HoxD cluster regions are shown.
Figure 7
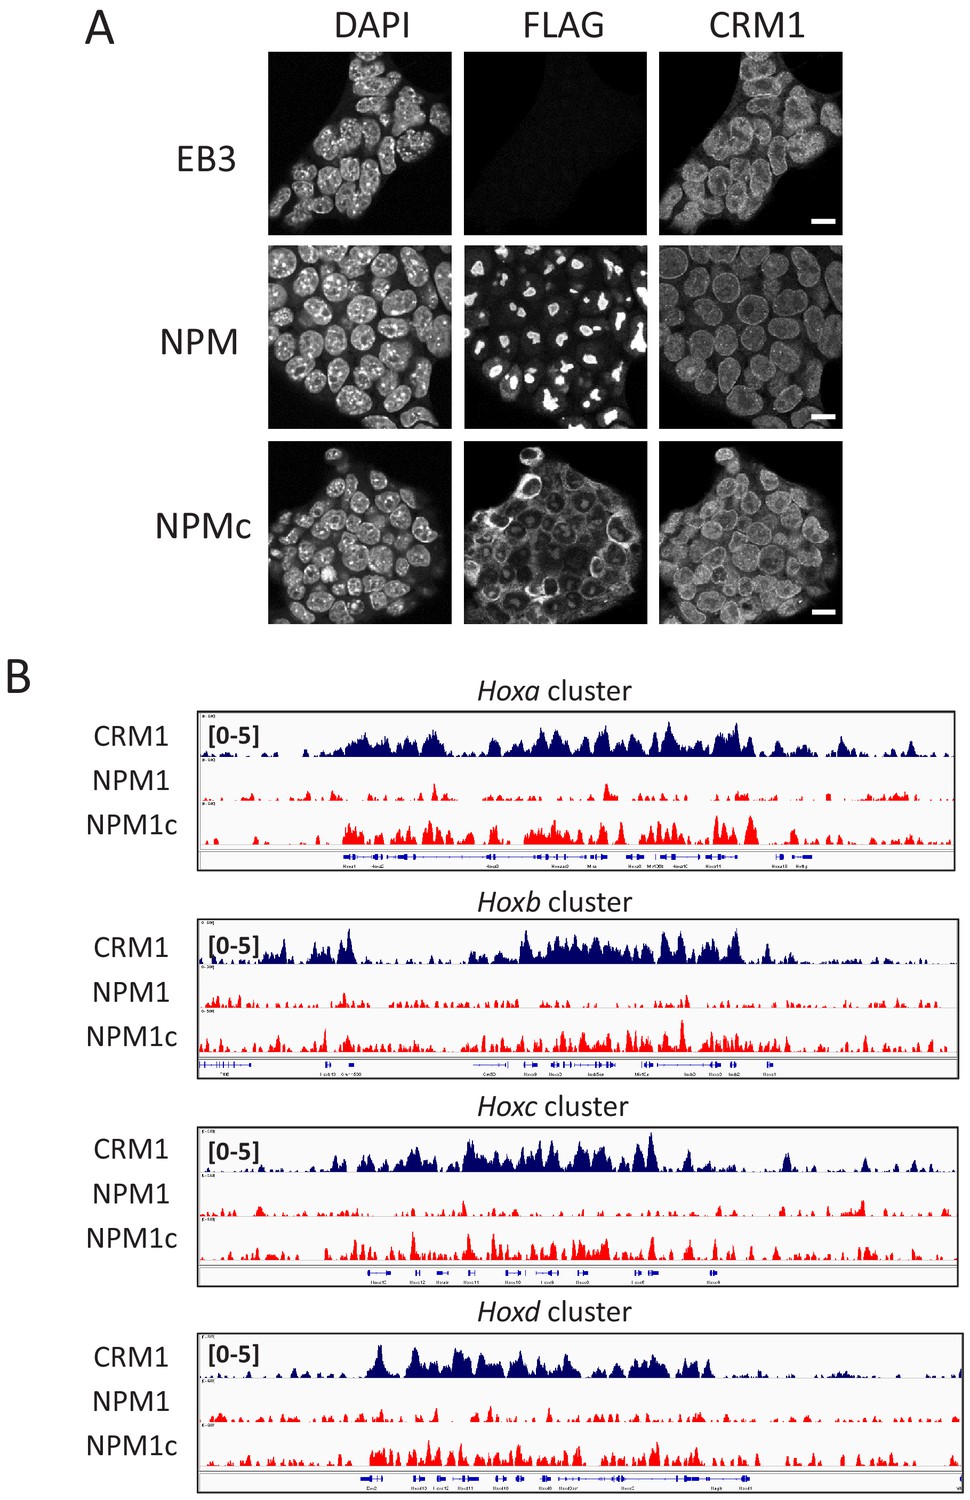
NPM1c binds to four Hox cluster regions in mouse ES cells.
(A) Immunofluorescent analysis of stable cell lines (EB3 parental ES cells, FLAG-NPM1 expressing ES cells, or FLAG-NPM1c expressing ES cells) using anti-FLAG or anti-CRM1 antibody. Scale bars: 10μm. (B) ChIP-seq analysis of cell lines indicated using anti-FLAG antibody. All four Hox cluster regions (HoxA, HoxB, HoxC, and HoxD) are shown. (Top) dark blue, anti-CRM1 ChIP signal; (middle) red, anti-FLAG ChIP signal for FLAG-NPM1 expressing ES cells; (bottom) red, anti-FLAG ChIP signal for FLAG-NPM1c expressing ES cells.
Figure 8
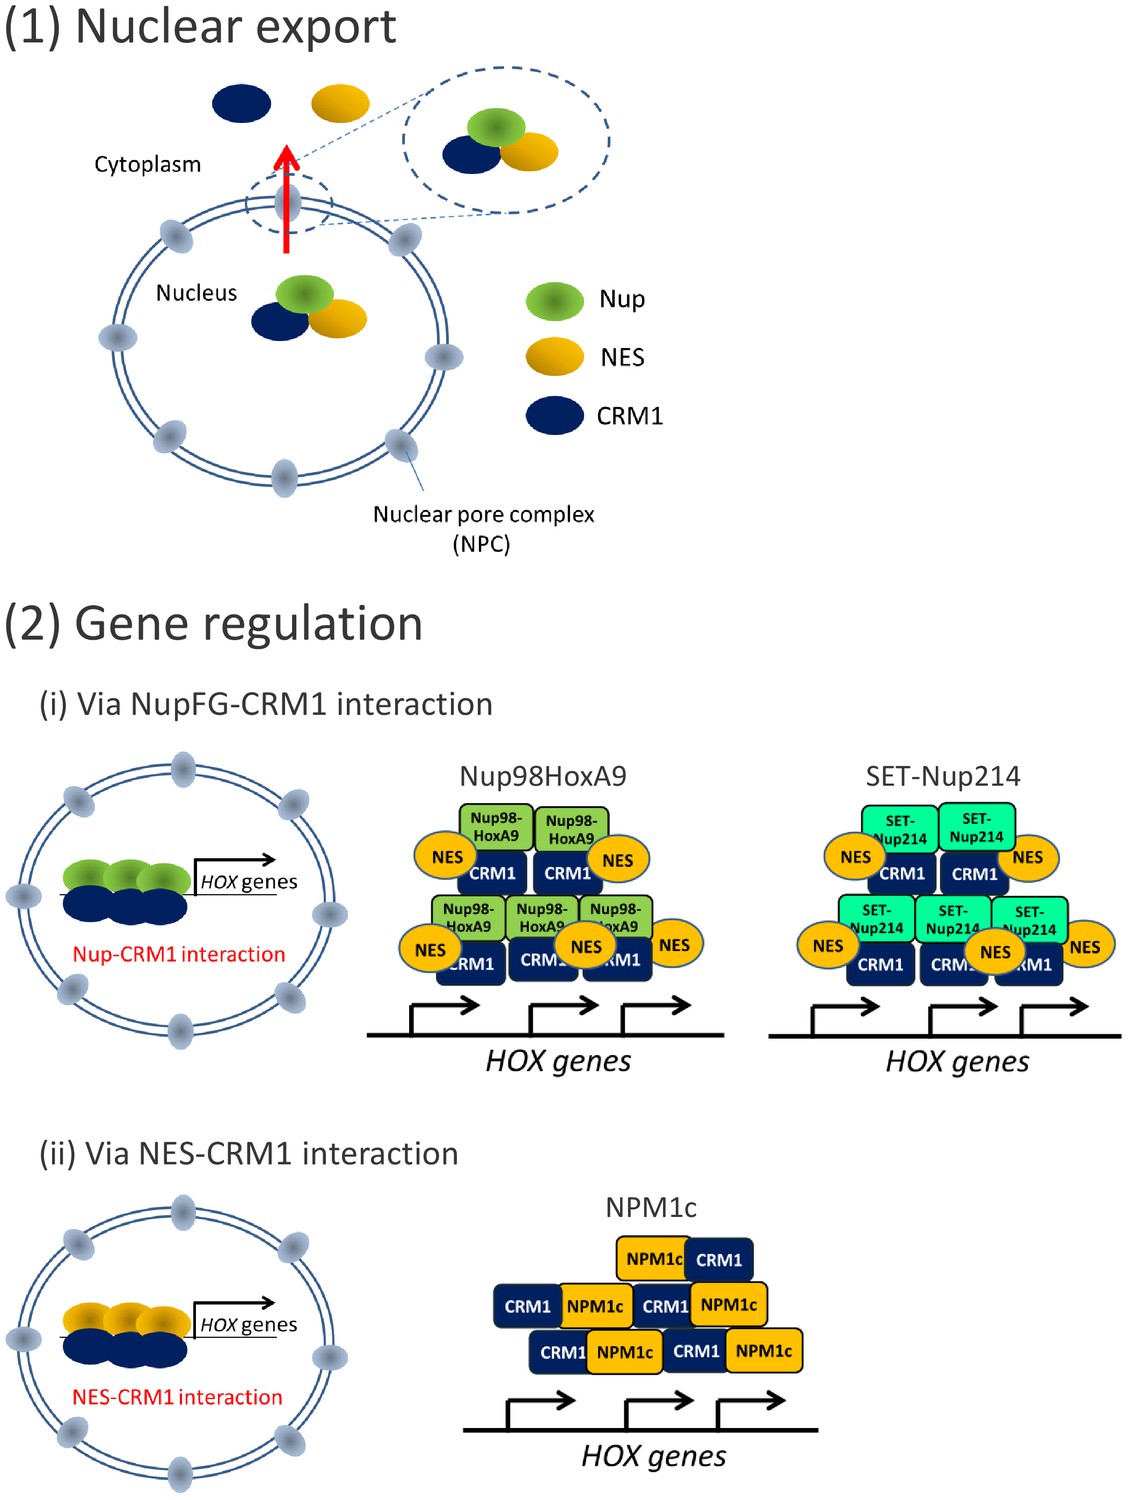
CRM1 functions as a platform to recruit leukemogenic proteins to HOX cluster regions.
CRM1 possesses two distinct functions: (1) Nuclear export of NES-cargo proteins, and (2) gene regulation. Leukemogenic proteins co-localize with CRM1 at HOX cluster regions either via (i) CRM1-nucleoporin (FG) interaction (Nup98HoxA9 and SET-Nup214) or (ii) CRM1-NES interaction (NPM1c). Note that both the binding of these leukemogenic proteins to HOX cluster(s) and HOX gene expression are dependent on CRM1. In the case of Nup98HoxA9 and SET-Nup214, the NES-containing protein(s) is/are most likely involved in the complex.
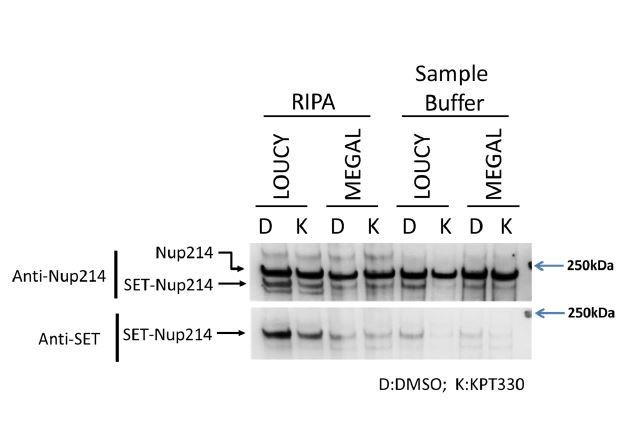
Author response image 1
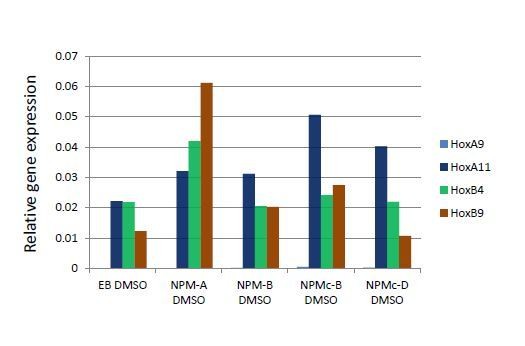
Author response image 2
Additional files
-
Supplementary file 1
List of primers used in this study.
- https://cdn.elifesciences.org/articles/46667/elife-46667-supp1-v1.xlsx
-
Supplementary file 2
Key resources table.
- https://cdn.elifesciences.org/articles/46667/elife-46667-supp2-v1.xlsx
-
Transparent reporting form
- https://cdn.elifesciences.org/articles/46667/elife-46667-transrepform-v1.docx
Download links
A two-part list of links to download the article, or parts of the article, in various formats.
Downloads (link to download the article as PDF)
Open citations (links to open the citations from this article in various online reference manager services)
Cite this article (links to download the citations from this article in formats compatible with various reference manager tools)
Chromatin-bound CRM1 recruits SET-Nup214 and NPM1c onto HOX clusters causing aberrant HOX expression in leukemia cells
eLife 8:e46667.
https://doi.org/10.7554/eLife.46667


