Lineage does not regulate the sensory synaptic input of projection neurons in the mouse olfactory bulb
- California Institute of Technology, United States
Figures
Figure 1 with 3 supplements
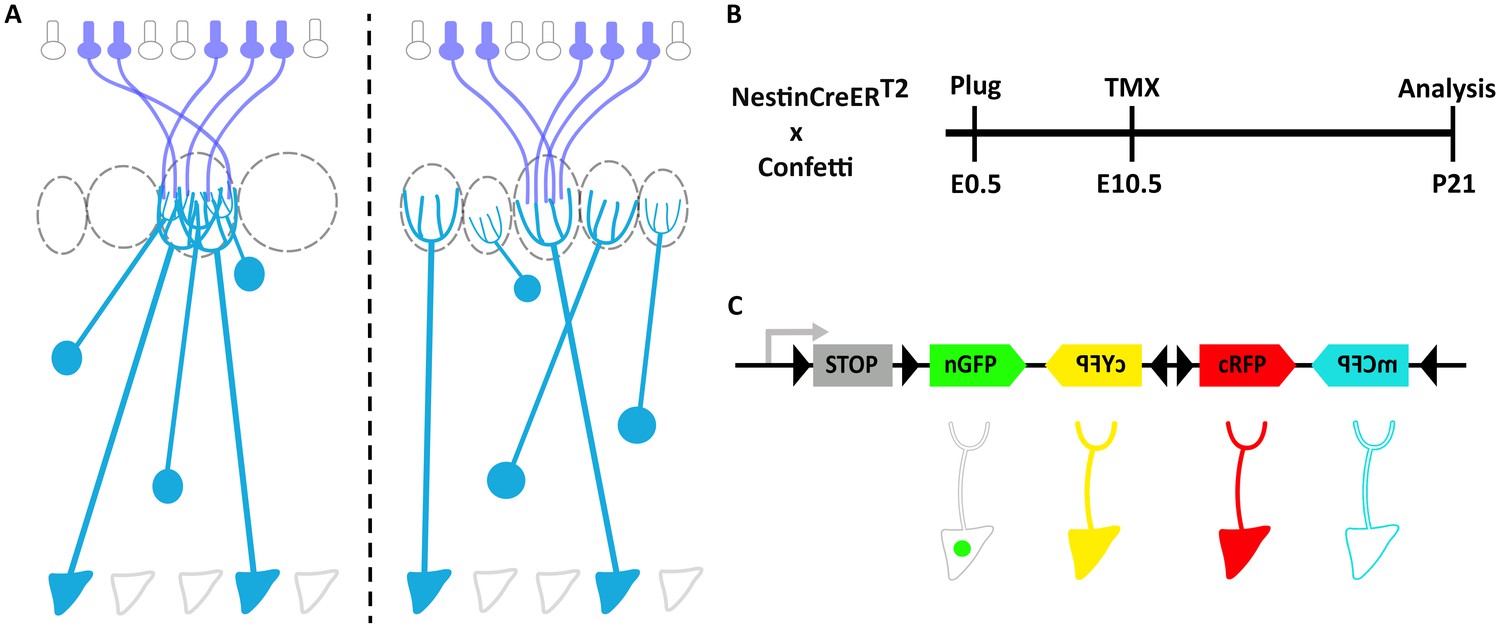
Clonal analysis of projection neurons using Nestin-CreERT2::Confetti mice to sparsely label neuronal progenitors.
(A) Schematic representation of the olfactory bulb (OB). Axons from olfactory sensory neurons (OSNs) expressing the same receptor project to a single glomerulus, forming synaptic contacts with the apical dendrites of mitral and tufted cells. Two possible scenarios of the relationship between lineage and connectivity are presented. (left) The apical dendrites of clonally related M/T cells innervate the same glomerulus, indicating that lineage regulates their connectivity. (right) The apical dendrites of sister M/T cells innervate different glomeruli, indicating that connectivity of M/T cells is independent of their lineage (B) Experimental design to label neuronal progenitors with tamoxifen (TMX) at embryonic day 10 (E10.5), and their posterior analyses at postnatal day 21 (P21). (C) The Confetti cassette encodes four different fluorescent proteins (nuclear GFP (nGFP), membrane CFP (mCFP), and cytoplasmic YFP (cYFP) and RFP (cRFP)). Upon Cre recombination, the STOP sequence is excised and randomly expressed one out four possible fluorescent proteins.
Figure 1—figure supplement 1
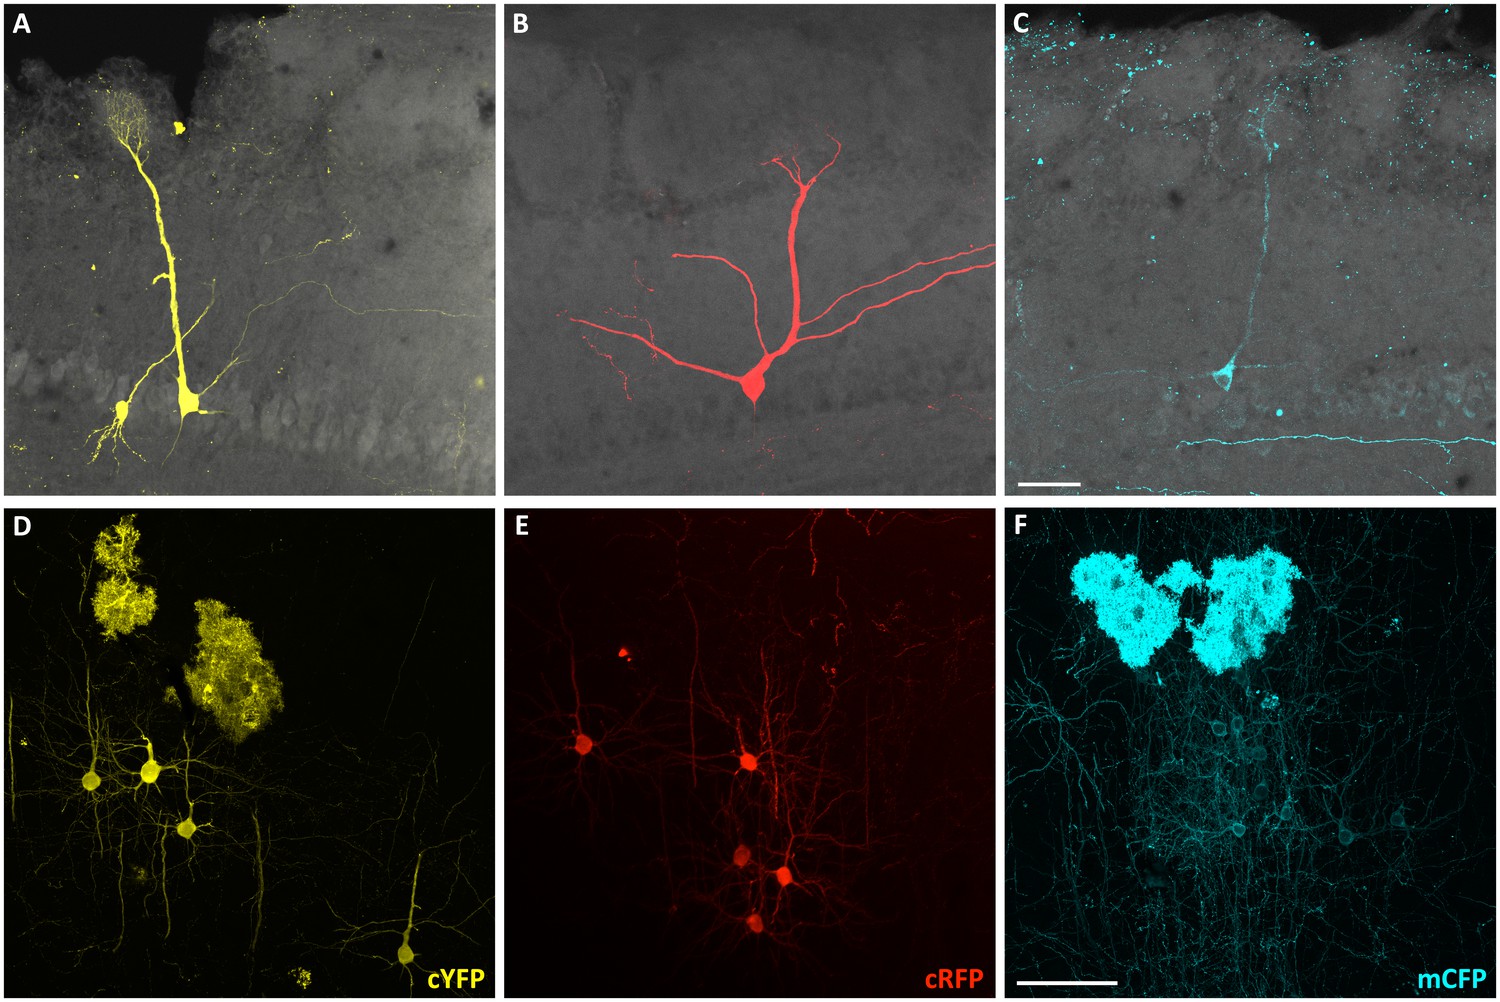
M/T and pyramidal neurons labeled with different fluorescent proteins.
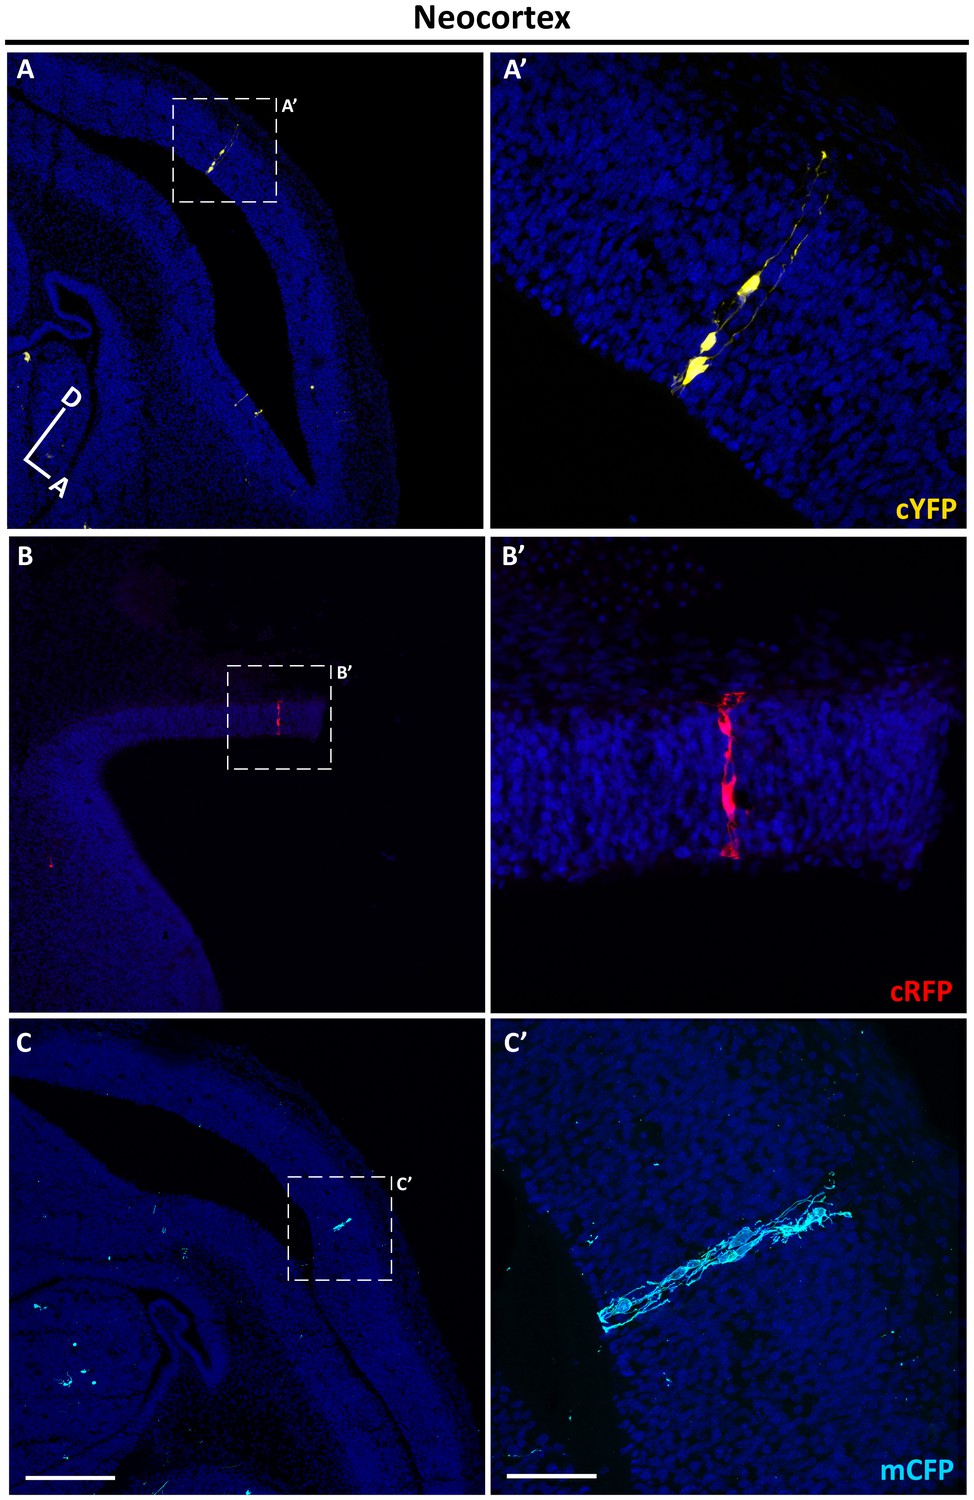
(A–C) Confocal images of three M/T cells and (D–F) three pyramidal neuron clones labeled with different fluorescent proteins in OB and neocortex in coronal sections of P21 mice treated with TMX at E10.5. (A, D) Cytoplasmic YFP (cYFP); (B, E) cytoplasmic RFP (cRFP) and (C, F) membrane CFP (mCFP). Scale bar in C is 50 µm. Scale bar in F is 100 µm.
Figure 1—figure supplement 2
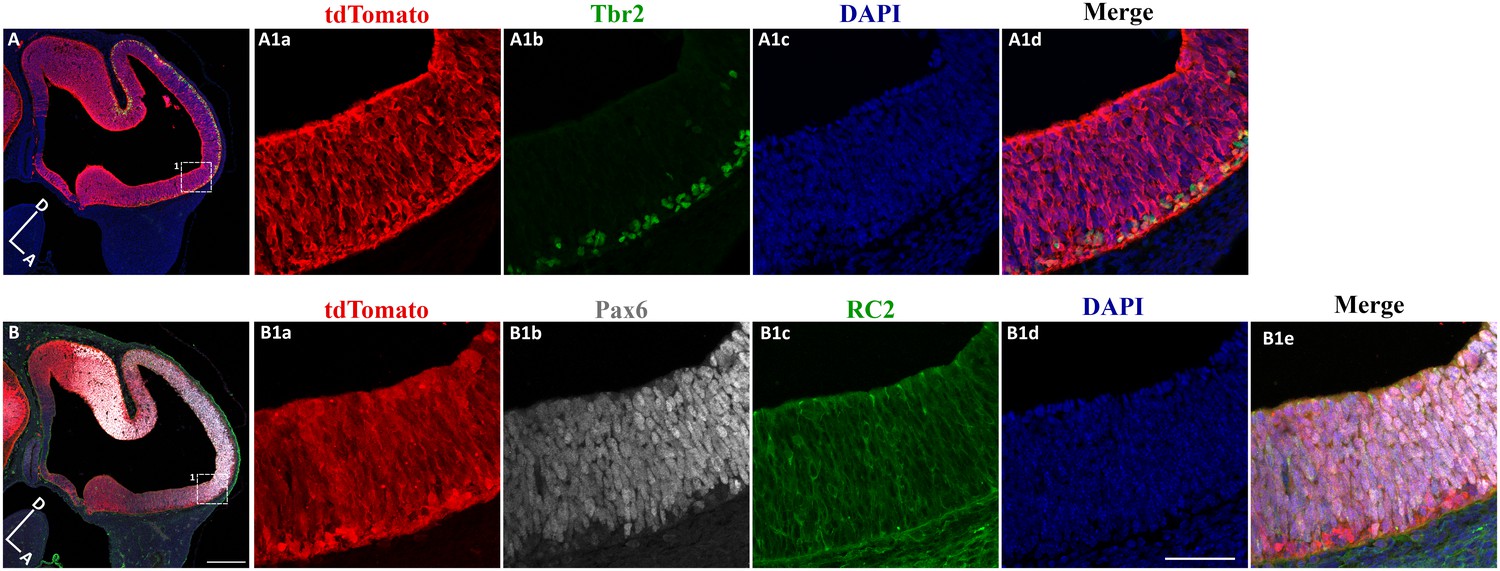
Labeling of progenitor cells at E10.5 in a Nestin-Cre::Ai9 mouse.
(A, B) Confocal images of two serial sagittal sections through the brain of an E10.5 Nestin-Cre:Ai9 mouse labeled with Tbr2 antibody (green in A) which is restricted to the pallium, and with the radial glial cells markers Pax6 and RC2 antibodies (gray and green in B). (A1) High-magnification image of the presumptive OB on A, showing tdTomato+ potential progenitor cells. (B1) High-magnification image of the presumptive OB on B, showing that tdTomato+ cells also express Pax6 and RC2. DAPI staining (blue) labels cell nuclei. Scale bar in B is 200 µm and applies to A-B. Scale bar in B1d is 50 µm and applies to A1a-B1e. Orientation of brains: D, dorsal; A, anterior.
Figure 1—figure supplement 3
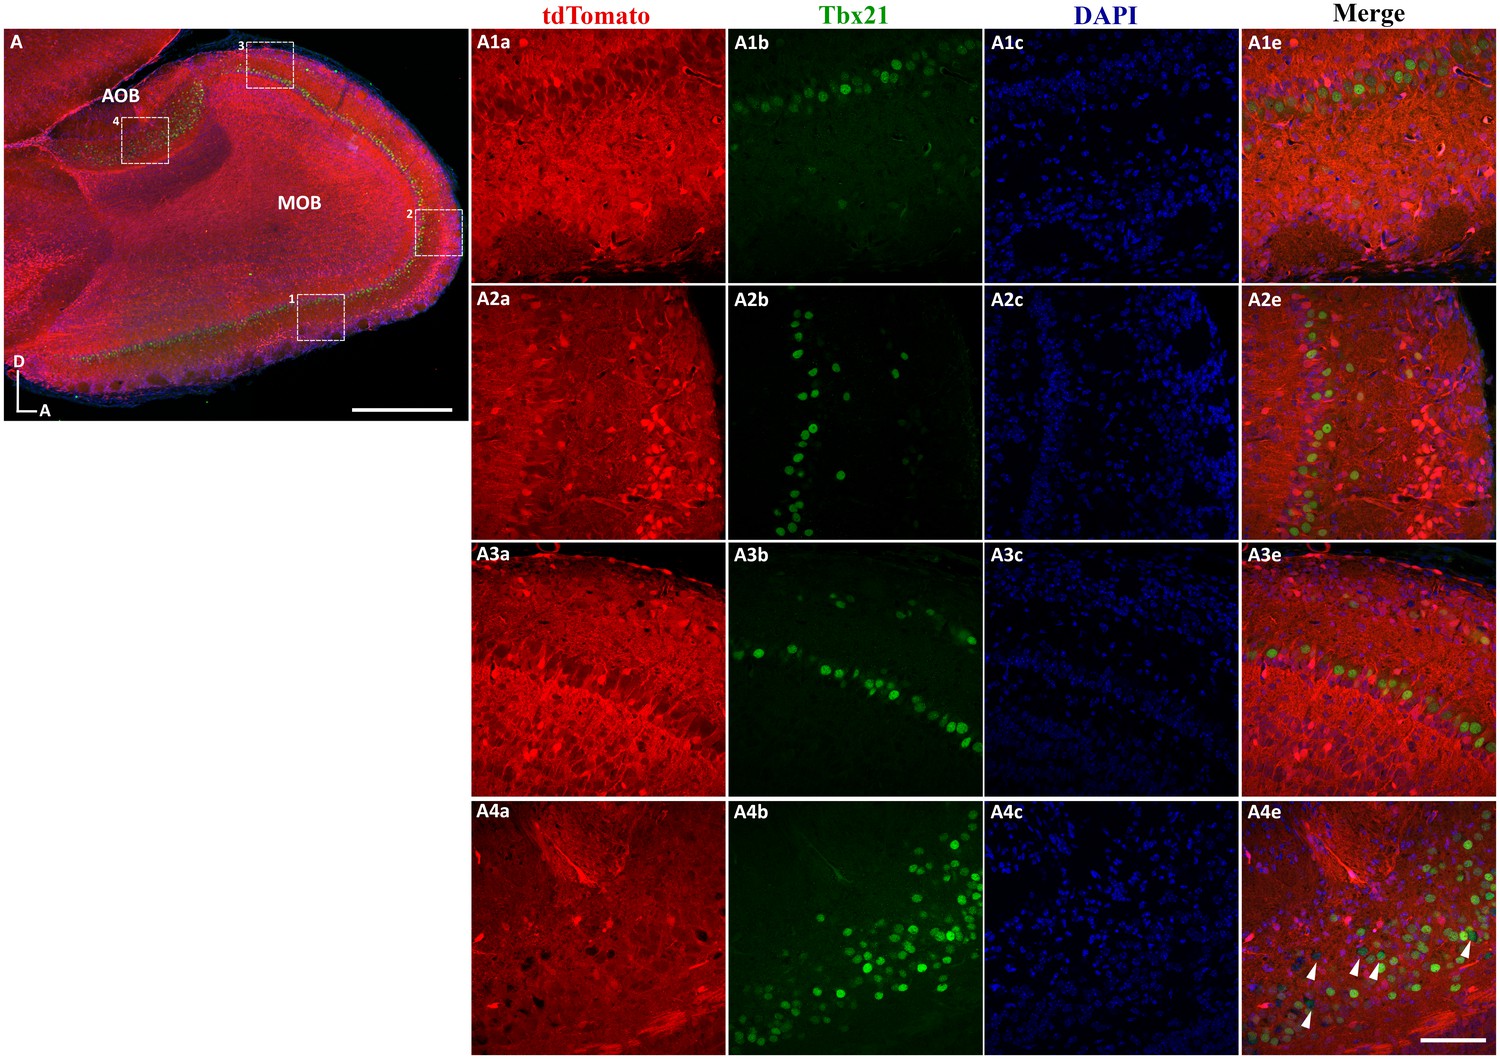
M/T cells labeled at P7 in a Nestin-Cre::Ai9 mouse.
(A) Sagittal sections through the OB of a P7 Nestin-Cre::Ai9 mouse labeled with Tbx21 antibody (green) to identify M/T cells. (A1–A3) High-magnification images of different positions of the main olfactory bulb (MOB) in A. (A4) High-magnification images of the accessory olfactory bulb (AOB) in A. Note that some Tbx21+ M/T cells in the AOB are not tdTomato+ (arrowheads in A4d). Scale bar in A is 500 µm. Scale bar in A4d is 50 µm and applies to A1a-A4d. Orientation of brain: D, dorsal; A, anterior.
Figure 2 with 1 supplement

Sparse labeling of progenitor cells in the embryonic mouse brain.
(A–D) Sagittal sections through the brain of an E12.5 mouse treated with TMX at E10.5. (A–B) Confocal images of individual clones labeled in the OB expressing cRFP (A–A’) and cYFP (B–B’). (A’–B’) High-magnification images of the clones shown in A and B. (C–D) Single clones labeled in the neocortex expressing cRFP (C–C’) and cYFP (D–D’). (C’–D’) High-magnification images of the clones shown in C–D). Cell nuclei are labeled with DAPI (blue). Scale bar in D is 200 µm and applies to A-D, scale bar in D’ is 50 µm applies to A’-D’. Orientation of brains: D, dorsal; A, anterior.
Figure 2—figure supplement 1
Progenitor cells labeled in neocortex with three different fluorescent proteins.
(A–C) Confocal images of single clones labeled in the neocortex with cYFP (A), cRFP (B) and mCFP (C) in brain sagittal sections of E12.5 mice treated with TMX at E10.5. (A’–C’) High-magnification images of the clones shown in A–C. DAPI staining (blue) reveals cell nuclei. Scale bar in C is 200 µm applies to A-C. Scale bar in C’ is 50 µm applies to A’-C’. Orientation of brains: D, dorsal; A, anterior.
Figure 3 with 4 supplements

Clone size and distribution of cells labeled in the olfactory bulb and neocortex.
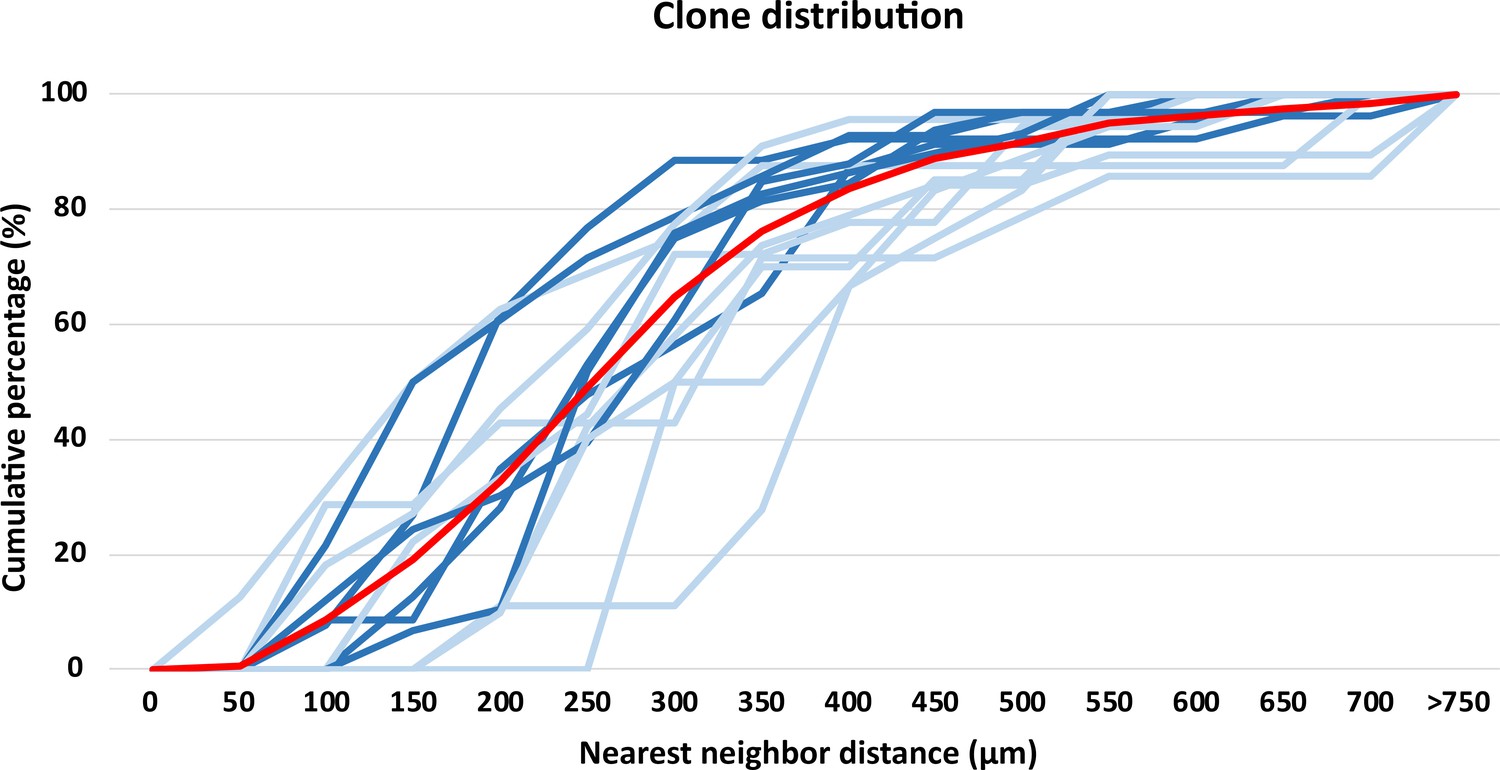
(A) Clone size quantification in the OB and neocortex. Data are shown as average showing all data points. (B–D) 3D reconstruction of a NestinCreERT2::Confetti P21 mice OB (B–C) and neocortex (D) treated with TMX at E10.5. Gray lines indicate the contours of the brain and red dots represent the cell bodies of labeled neurons. (B) Frontal and (C) lateral views of the 3D reconstruction of one OB. (D) Frontal view of the neocortex 3D reconstruction. (E) Cumulative percentage of the NNDs of sister neurons labeled in the OB (red) and neocortex (dark blue). Data are shown as average ± standard deviation (OB, n = 310 neurons in 14 clones; neocortex, n = 556 neurons in six clones). Pink and light blue lines represent 100 datasets of random simulations of OB and neocortex NND, respectively (see also Figure 3—source data 1). No significant differences were observed when real OB clones were compared to different real OB clones, or when real neocortex clones were compared to different real neocortex clones (OB, p=0.96; neocortex, p=0.95; two-way ANOVA). However, significant differences were observed when real clones were compared with their respective simulated clones (for both OB and neocortex, p<0.01: two-way ANOVA). Scale bar in C is 0.5 mm and applies to B-C. Scale bar in D is 1 mm. Orientation of diagrams in B-D: D, dorsal; A, anterior; M, medial.
-
Figure 3—source data 1
Quantification of the cell NNDs in real and randomized OB and neocortex clones at E10.5.
- https://doi.org/10.7554/eLife.46675.013
-
Figure 3—source data 2
Quantification of the cell NNDs in real OB and neocortex clones at E12.5.
- https://doi.org/10.7554/eLife.46675.014
Figure 3—figure supplement 1
3D reconstruction of clones labeled in the olfactory bulb.
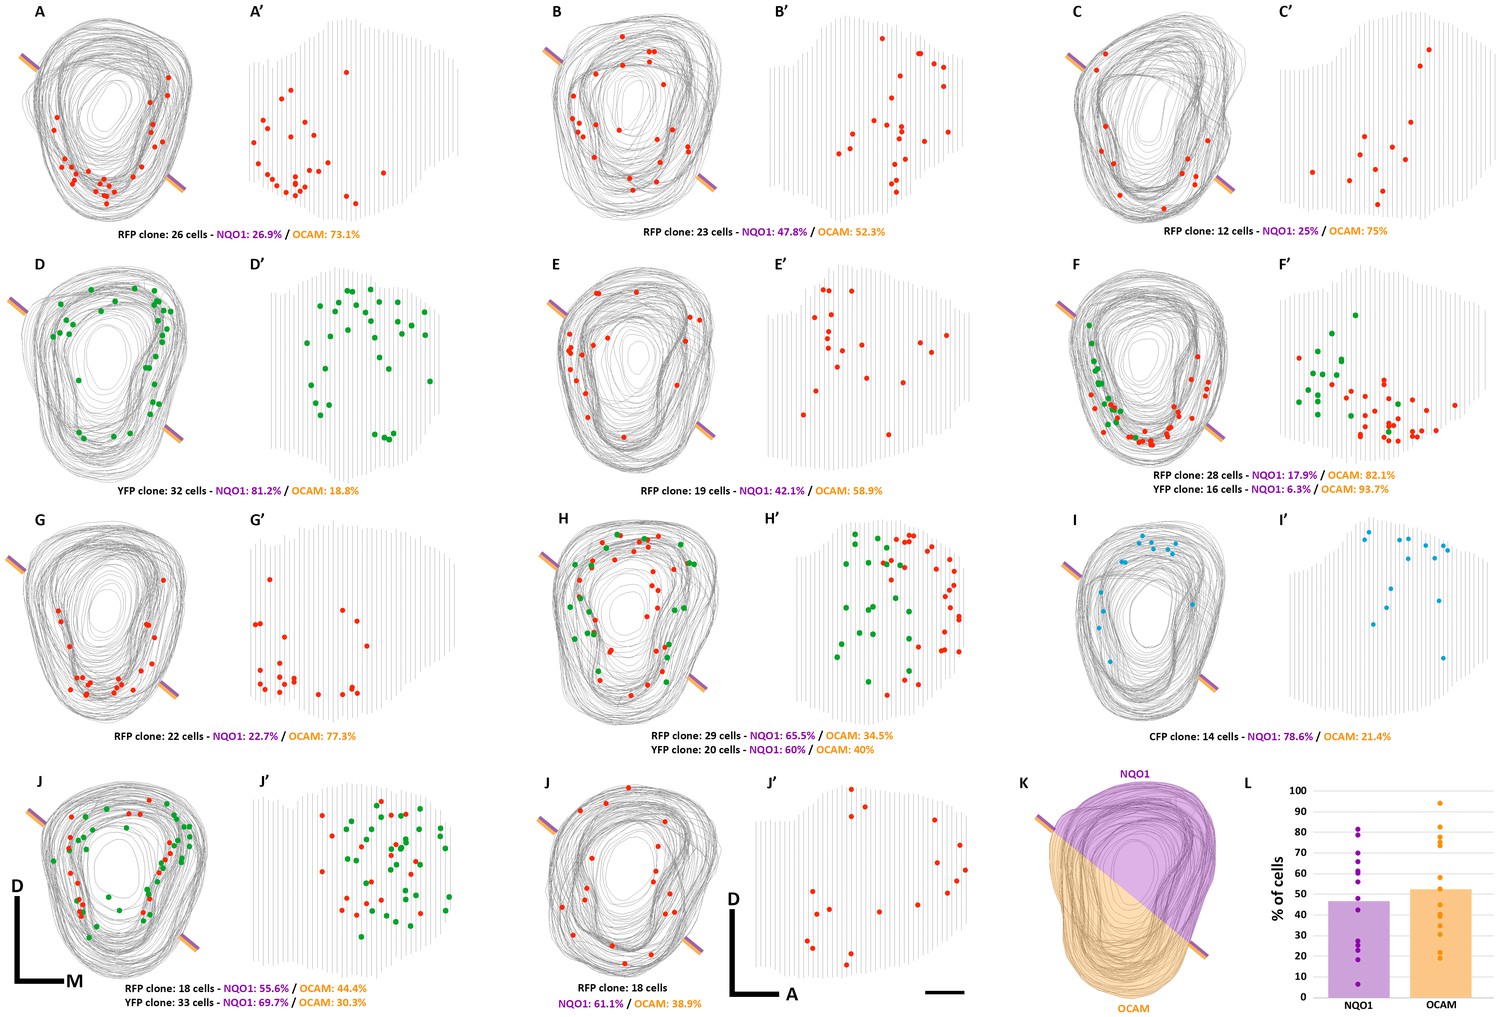
(A–J) 3D reconstructions from 11 OBs showing the 14 OB clones analyzed in Figure 3. (A–J) Frontal and (A’–J’) lateral views of the OBs. (K) Division of the OB in the approximate NQO1 (purple) and OCAM (orange) domains based on the results shown in Cho et al. (2007) and Imamura et al. (2011). (L) Analyses of the clone distribution in the NQO1 and OCAM domains (purple and orange lines in each 3D reconstruction) for all the OB clones (p=0.67, t-test). Number of cells in each clone and their distribution in the approximate NQO1/OCAM domains is indicated in each 3D reconstruction. Scale bar in J’ is 0.5 mm and applies to A-J’. Orientation of diagrams: A, anterior; D, dorsal; M, medial.
Figure 3—figure supplement 2
3D reconstruction of clones labeled in the neocortex.
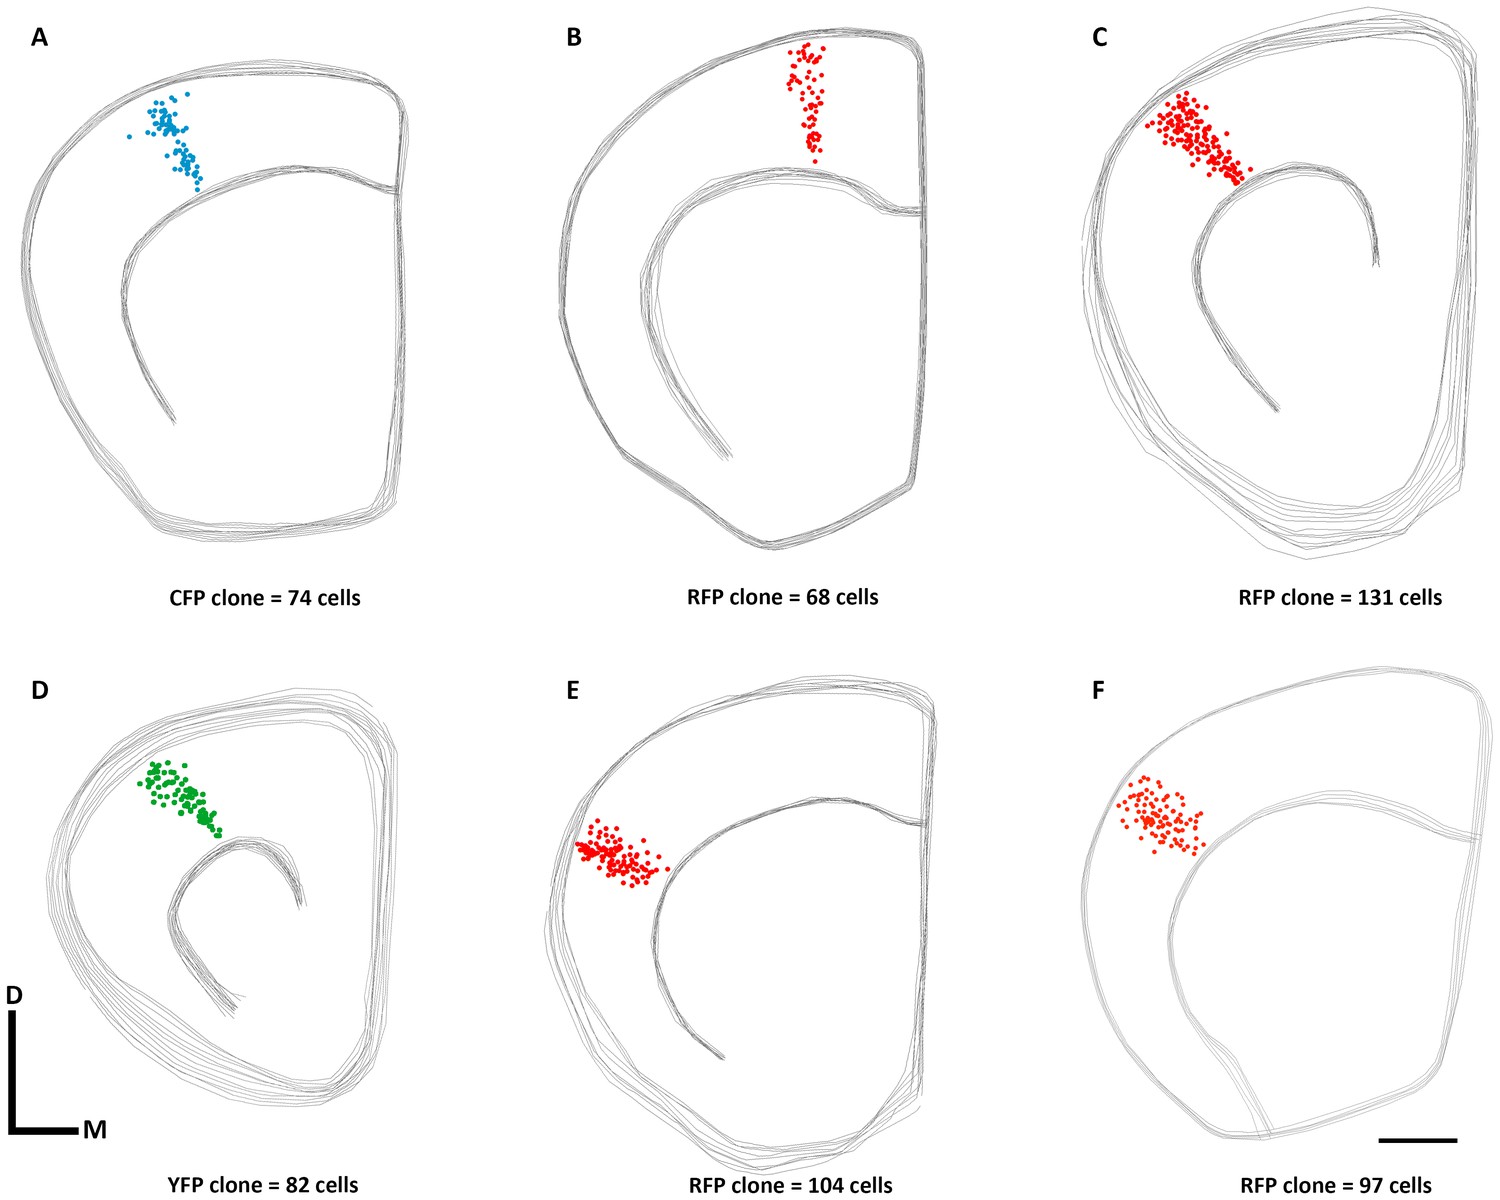
(A–F) 3D reconstructions from the six clones analyzed in the neocortex. Clone size is indicated below each 3D reconstruction. Scale bar in F is 1 mm and applies to A-F. Orientation of diagrams: D, dorsal; M, medial.
Figure 3—figure supplement 3
NND distribution of single clones based on their cell number.
(A) NND cumulative percentage of individual clones analyzed in the OBs (n = 14). Red line represents the NND average of all clones analyzed, while dark and light blue represents the NND of single clones containing a number of M/T cells above or below the mean (mean = 22.14), respectively. There are no differences in the distribution of M/T cells in a clone regarding of the number of cells per clone.
Figure 3—figure supplement 4
Clone size and distribution of cells labeled in the olfactory bulb and neocortex when TMX was administered at E12.5.
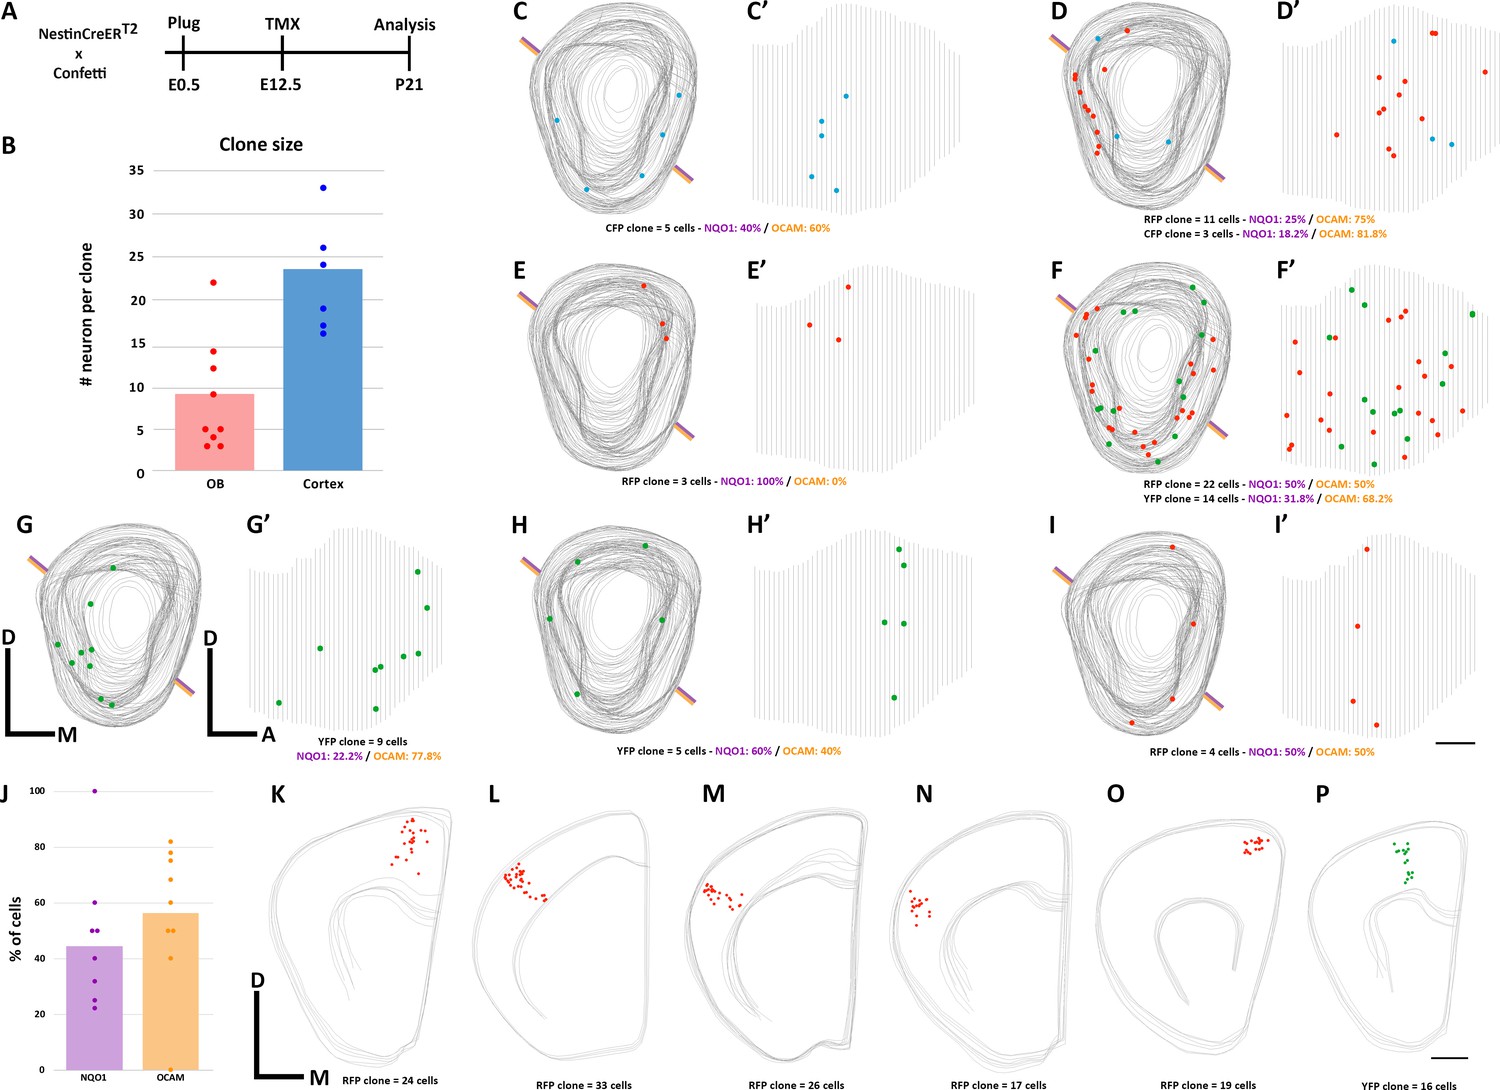
(A) Experimental design to label neuronal progenitors with tamoxifen (TMX) at embryonic day 12 (E12.5), and analyzed at postnatal day 21 (P21). (B) Clone size quantification in the OB and neocortex. Note that clone size is reduced in both OB and neocortex compared to the clones observed when TMX was administered at E10.5 (see Figure 3A). Data are shown as average showing all data points (see also Figure 3—source data 2). (C–I’) 3D reconstruction of a NestinCreERT2::Confetti P21 mice OB treated with TMX at E12.5. (C–I) Frontal and (C’–I’) lateral views of the 3D reconstruction of 7 OBs analyzed (n = 9 clones). (J) Analyses of the cell locations in the NQO1 and OCAM domains (purple and orange lines in each 3D reconstruction) for all the OB clones revealed that there are no significant differences in the distribution of the clones (p=0.51, t-test). Number of cells in each clone and their distribution in the NQO1/OCAM domains is indicated in each 3D reconstruction. (K–P) Frontal view of the neocortex 3D reconstruction treated with TMX at E12.5. Scale bar in I’ is 0.5 mm and applies to C-I’. Scale bar in P is 1 mm and applies to K-P. Orientation of diagrams in F and F’: D, dorsal; A, anterior; M, medial.
Figure 4 with 2 supplements
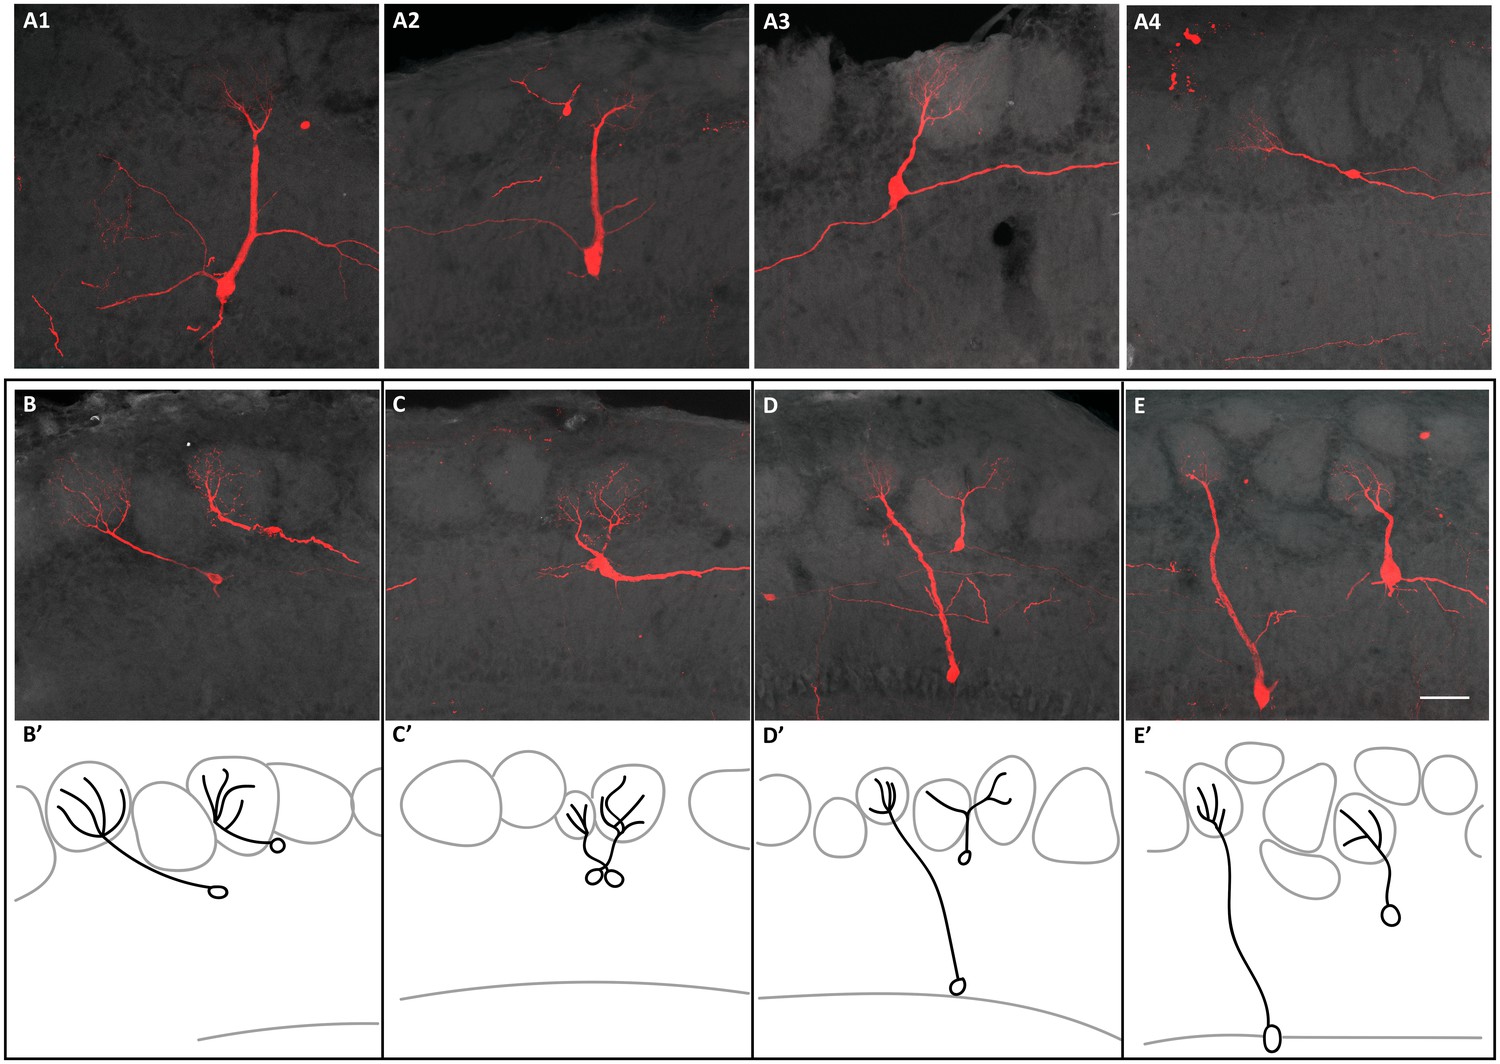
Connectivity of clonally related M/T cells when TMX was administered at E10.5.
(A) Confocal images of four sister M/T cells belonging to a putative individual clone in the OB. (B–E) Confocal images of sister M/T cells from four clones, in four different OBs, with their somata close to each other and their apical dendrites innervating different glomeruli. (B’–E’) Schematic representation of the confocal images in B-E. Scale bar in E is 50 µm and applies to A-E.
Figure 4—figure supplement 1
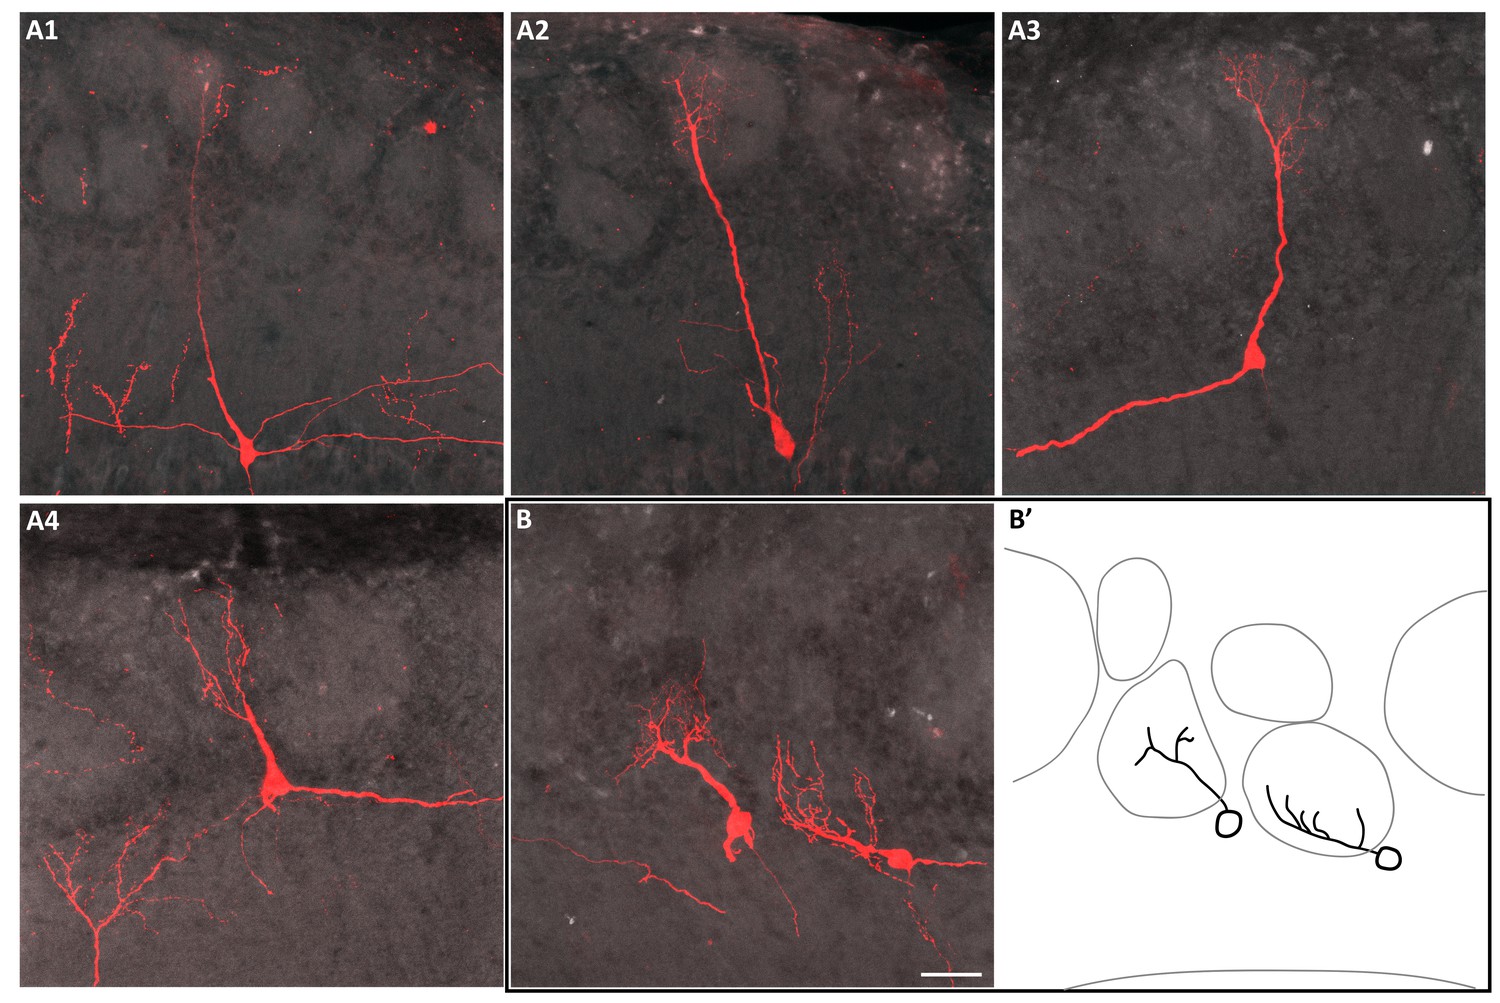
Connectivity of clonally related M/T cells when TMX was administered at E12.5.
(A) Confocal images of clonally related M/T cells belonging to a putative individual clone in the OB after TMX administration at E12.5. (B) Confocal image of two sister cells with their somata close to each other and their apical dendrites innervating different glomeruli. (B') Schematic representation of the confocal images in B. Scale bar in B is 50 µm and applies to A-E.
Figure 4—figure supplement 2
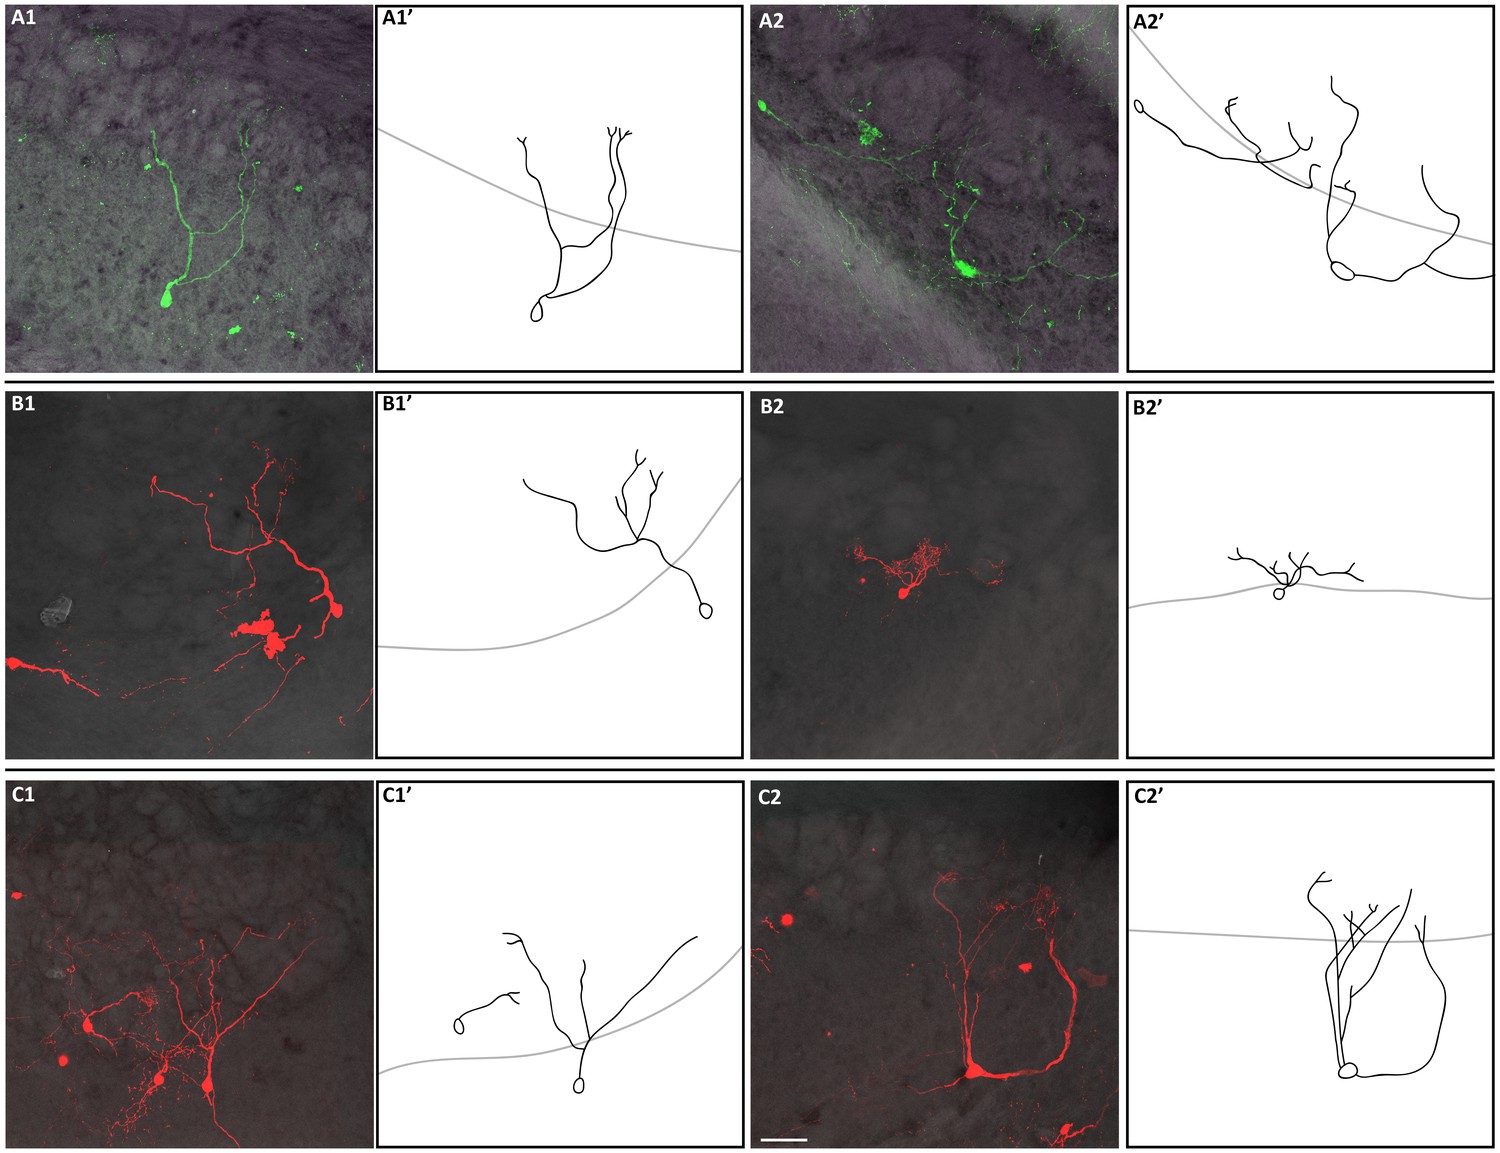
Connectivity of clonally related M/T cells in the AOB.
(A–C) Confocal images of M/T cells from three different clones (A, B, and C) in the accessory olfactory bulb (AOB) after TMX administration at E10.5. (A’–C’) Schematic representation of the confocal images in A-C’. Scale bar in F is 50 µm and applies to A-F.
Author response image 1
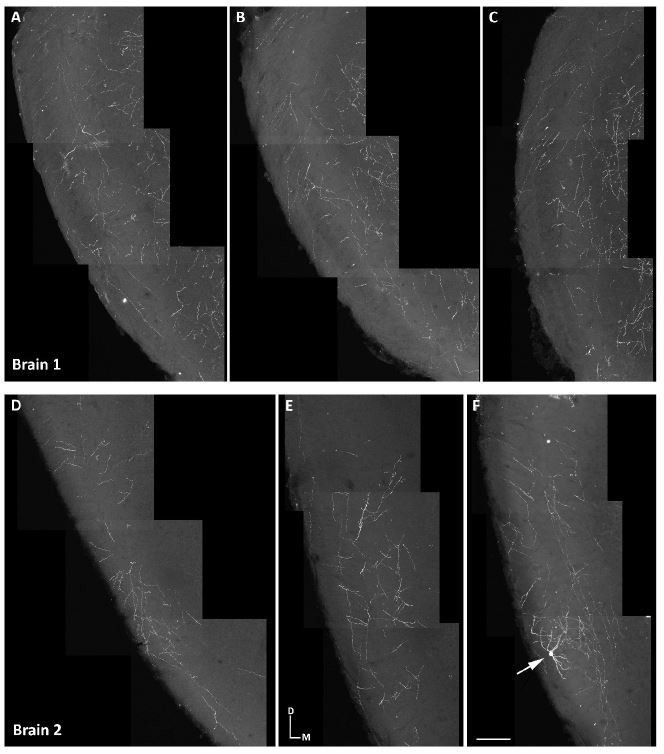
Axons in olfactory cortical regions.
(A-F) Confocal images of the axons in the lateral olfactory tract (LOT), in two different brains, at different anterior-posterior levels of the brain in coronal sections. (A-C) Axons in the LOT at the anterior olfactory nucleus and (D-F) piriform cortex in coronal sections from a brain with M/T cells labeled in the OB. Scale bar in F is 100 µm and applies to A-F. Orientation of brain: D, dorsal; M, medial.
Author response image 2
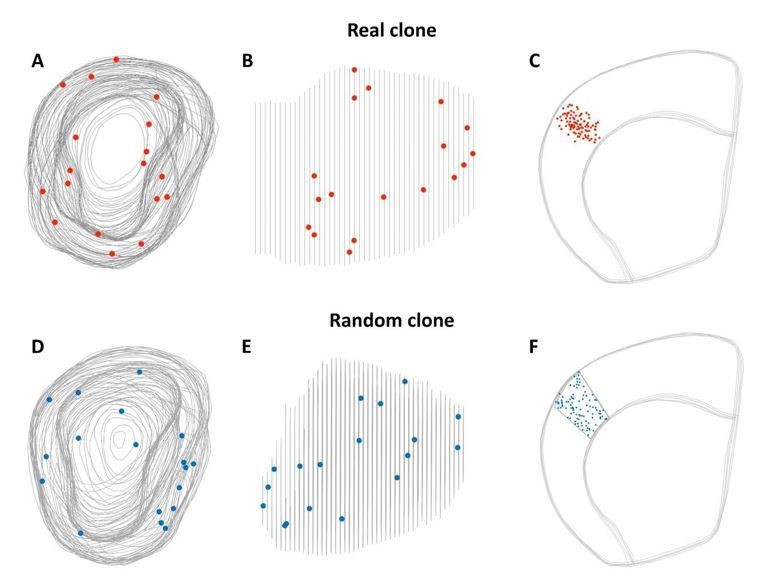
Volume for random dataset in the olfactory bulb and neocortex.
(A-C) 3D reconstruction from clones observed in OB (A-B) and neocortex (D) on our E10.5 experiment. (D-F) 3D reconstruction used to generate the random data set in the OB (D-E) and the neocortex (F).
Additional files
-
Supplementary file 1
M/T cells clones in the accessory olfactory bulb (A) Summary of all M/T cells clones observed in the accessory olfactory bulb (AOB), indicating the number of cells found in the AOB and the fluorescent protein expressed by M/T cells in the AOB and main OB.
- https://doi.org/10.7554/eLife.46675.018
-
Transparent reporting form
- https://doi.org/10.7554/eLife.46675.019
Download links
A two-part list of links to download the article, or parts of the article, in various formats.
Downloads (link to download the article as PDF)
Open citations (links to open the citations from this article in various online reference manager services)
Cite this article (links to download the citations from this article in formats compatible with various reference manager tools)
Lineage does not regulate the sensory synaptic input of projection neurons in the mouse olfactory bulb
eLife 8:e46675.
https://doi.org/10.7554/eLife.46675


