Classical conditioning drives learned reward prediction signals in climbing fibers across the lateral cerebellum
- Duke University School of Medicine, United States
Figures
Figure 1
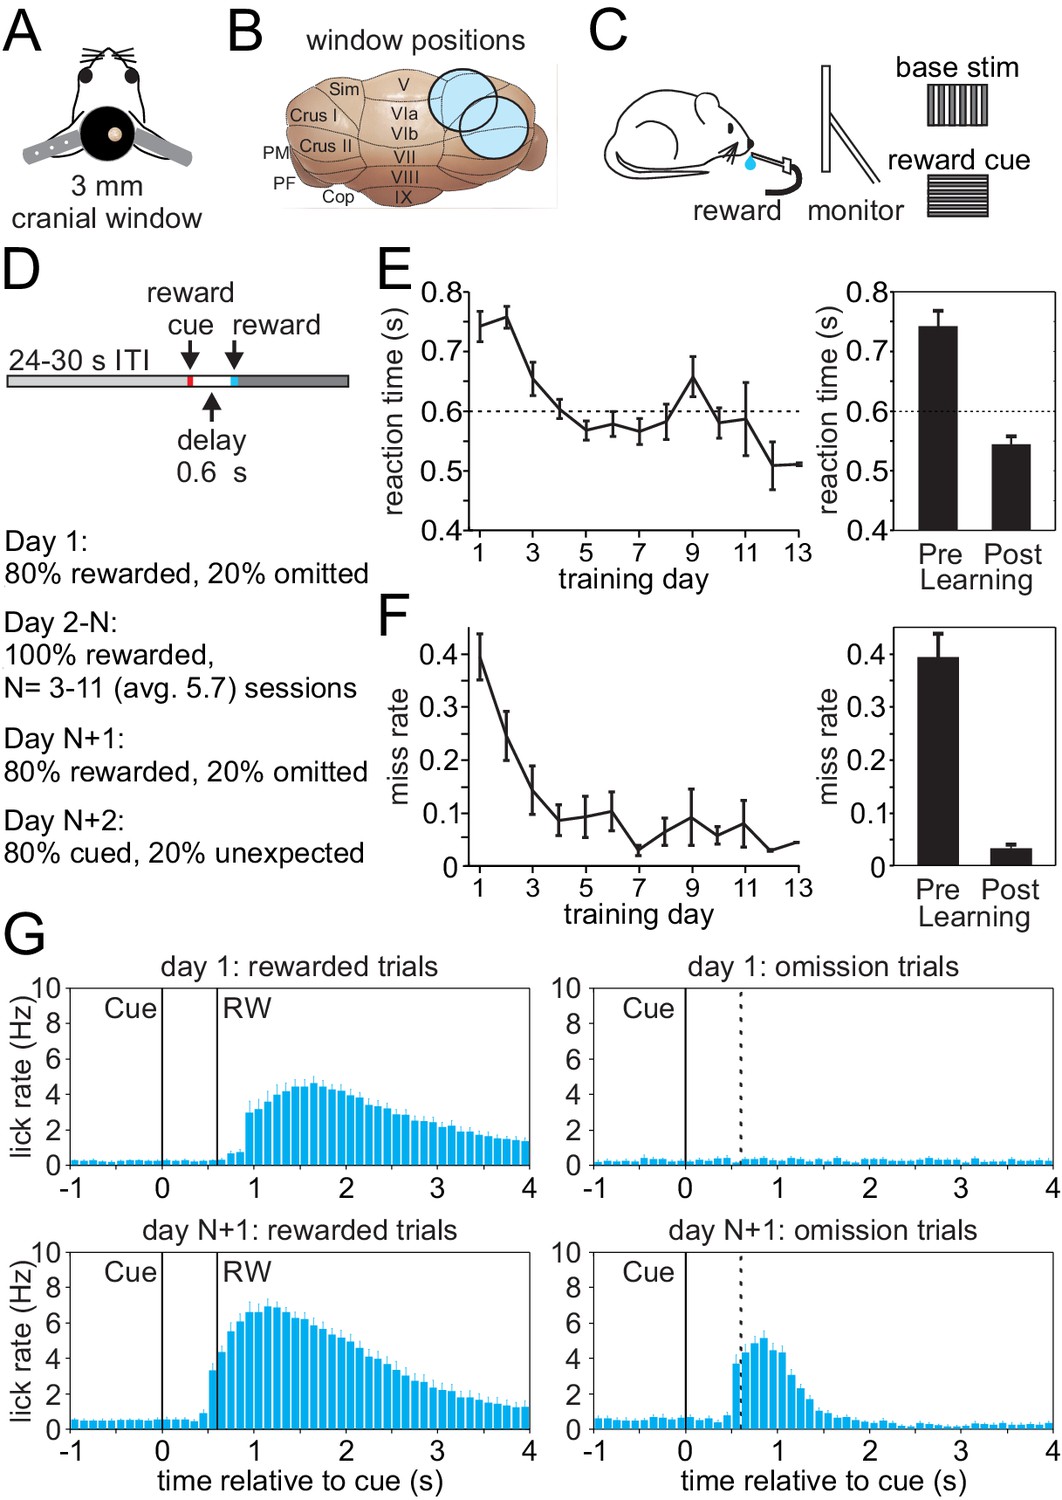
Appetitive classical conditioning regime for head-fixed mice.
(A) Diagram of headplate and 3 mm cranial window. (B) Scale representation of the 3 mm cranial windows over either Lobule Simplex (LS) or Crus I and II. (C) Mice viewed a static full screen vertical grating that was transiently replaced by a horizontal grating for 100 ms to cue reward delivery following a 600 ms delay. (D) Trial structure and progression of learning sessions. (E) Left, mean reaction time, defined as the first lick following the visual cue, on rewarded trials across training days. Right, mean reaction time on rewarded trials before learning and after learning. (F) Left, mean miss rate, defined as the fraction of trials with no licks within 1 s after the cue, on rewarded trials across training days. Right, mean miss rate on rewarded trials before and after learning (G) Mean lick rates aligned to visual cue onset, before (top) and after (bottom) learning for rewarded trials (RW, left) and omission trials (right, dotted line indicates time when reward would have been delivered).
Figure 2
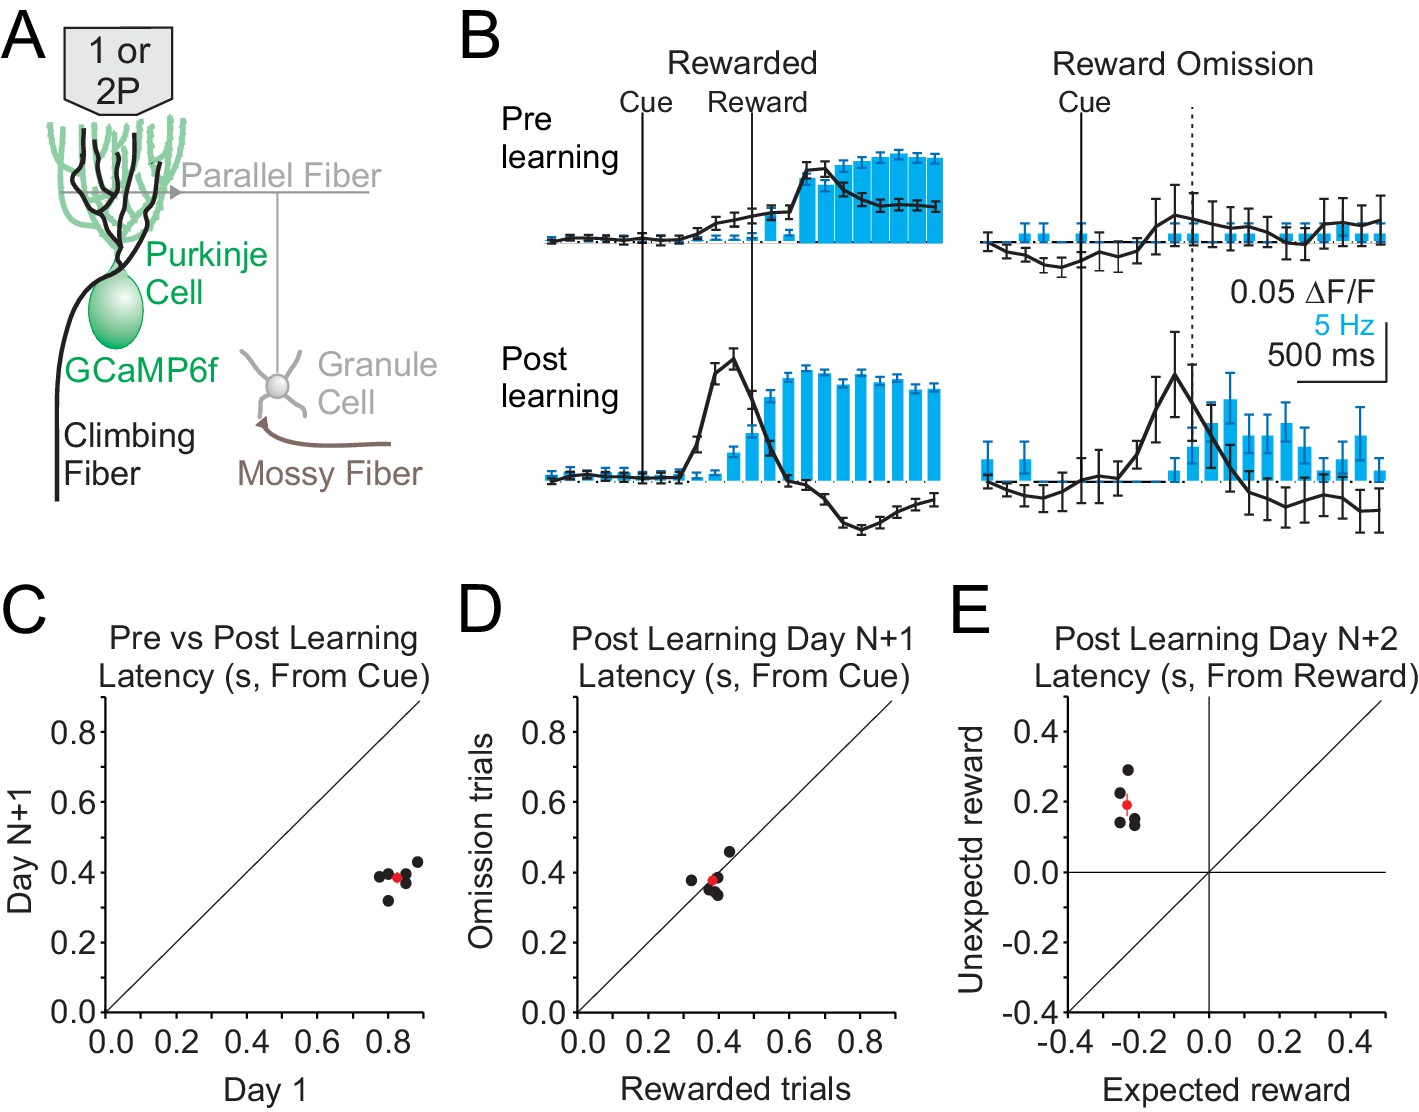
Single photon, mesoscale imaging of Cspk activity during behavior.
(A) Schematic of the cerebellar cortex with GCaMP6f expressed in PCs for single or two photon dendrite imaging. (B) Average ΔF/F timecourse (black, collected at 10 Hz) and lick rate (blue bars) for an example animal before (top) and after (bottom) learning for rewarded (left) and reward omission (right) trials. (C,D,E) Summary of bulk Cspk response latencies relative to the visual cue (C,D) or the reward (E) for all trial types. Response latency is defined by the maximum positive change in ΔF/F rate within 500 ms before the peak response.
Figure 3 with 3 supplements
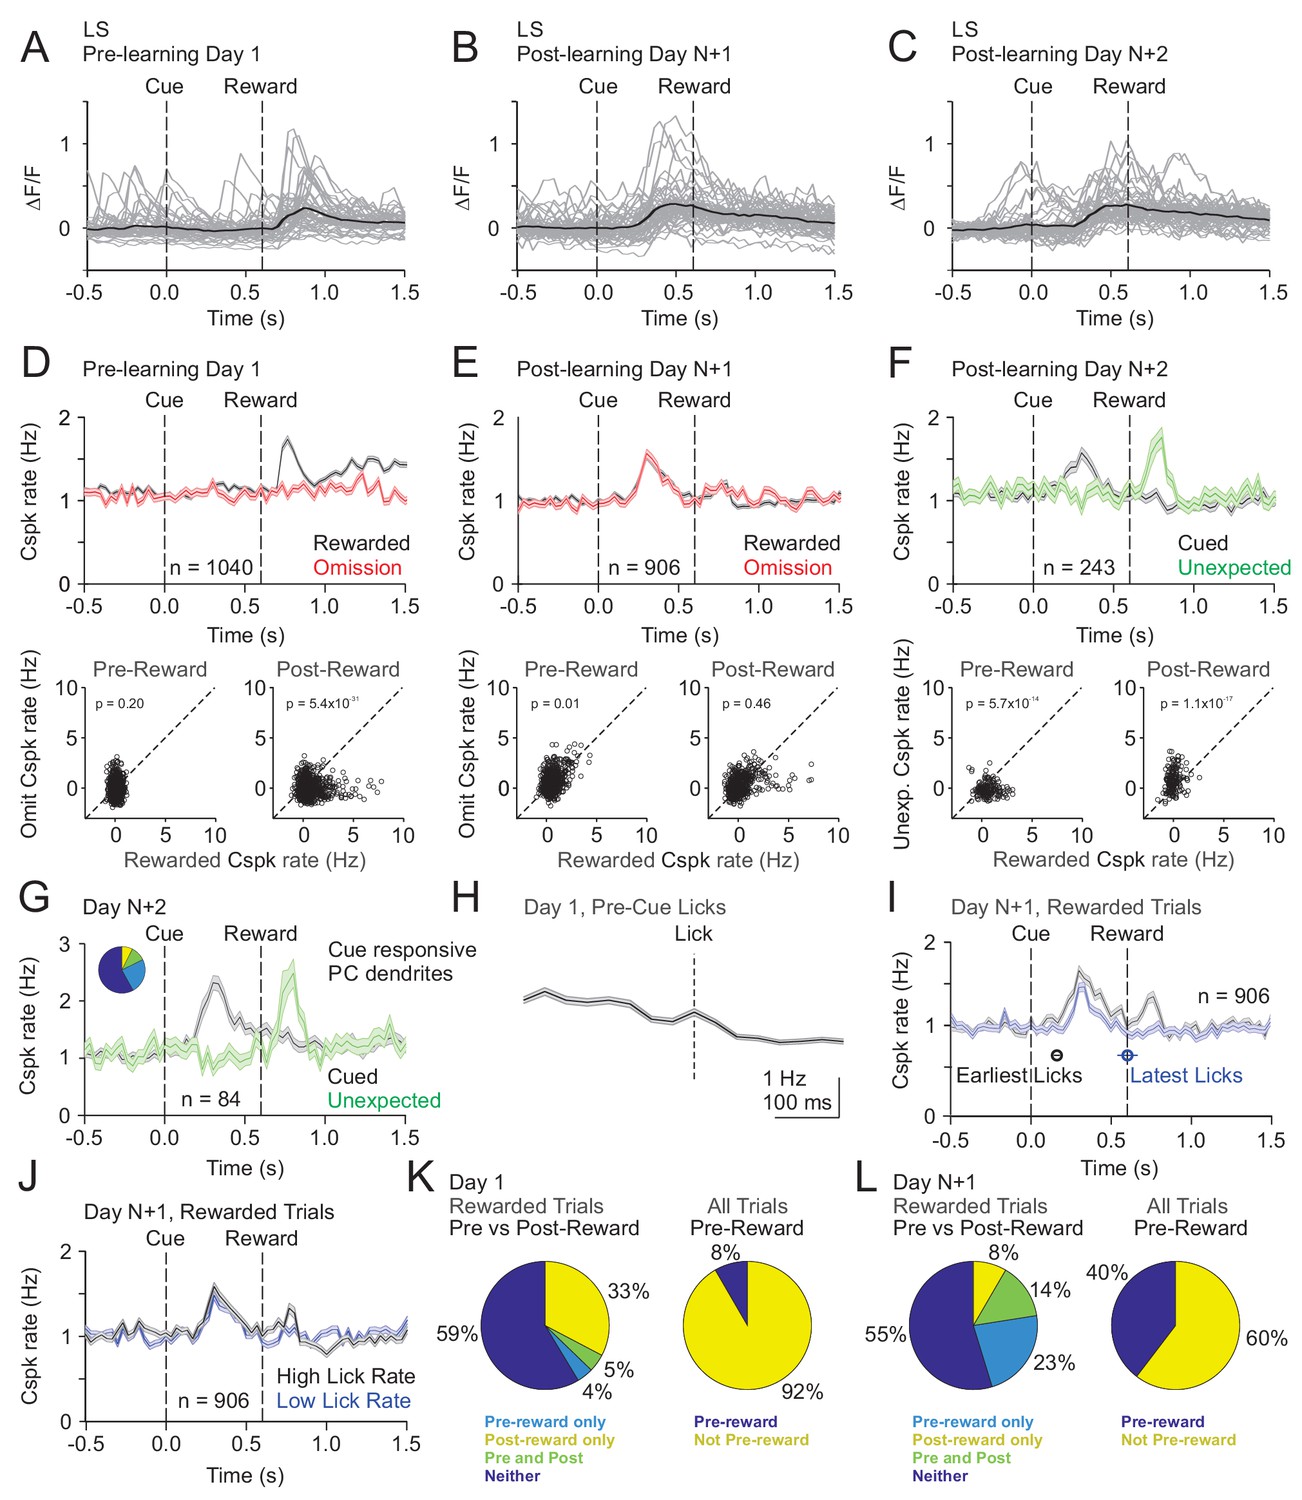
Cspk modulation in LS across learning.
(A) ΔF/F timecourses from an example neuron measured via two-photon calcium imaging for the first day of training in naïve mice. Gray traces are the first 50 trials and the black trace is the average of those 50 trials. (B) Same as (A), but on post-learning day N+1. (C) Same as (A,B) but for post-learning day N+2. (D) Top, mean cue-aligned peri-stimulus histograms (PSTHs) of Cspk rate on reward (black) and omission (red) trials for all PC dendrites on the first day of training in naïve mice. Bottom, summary scatterplot comparing the Cspk rate for individual PCs on rewarded vs omission trials in naïve mice. Spike rates were measured in a window preceding reward delivery (left) or immediately after reward delivery (right) (Materials and methods). (E) Same as D), but for rewarded and reward omission trials on post-learning day N+1 (F) Same as (D,E), but for rewarded and unexpected reward trials on post-learning day N+2. (G) Mean cue-aligned PSTH for PC dendrites that exhibited Cspk responses to the visual cue. Inset: fraction of the total dendrites on Day N+2 that responded in the pre-reward window on rewarded trials only (light blue, 24%), the post-reward window on unexpected reward trials only (yellow, 7%), both pre and post reward windows on rewarded and unexpected reward trials respectively (green, 10%), and neither window (blue, 58%). (H) Mean lick-triggered PSTH for licks during the inter-trial interval (ITI) in naïve animals. (I) Mean cue-aligned PSTHs for trained animals with rewarded trials segregated according to trials with the earlies 1/4 of licks (black, 162 ± 19 ms from cue) and latest 1/4 of licks (blue, 604 ± 64 ms from cue). (J) Mean cue-aligned PSTHs for trained animals with rewarded trials segregated according to trials with the highest 1/4 of lick rates (black, 5.4 ± 0.1 Hz) and the lowest 1/4 of lick rates (blue, 2.6 ± 0.1 Hz). (K) Fraction of all lobule simplex neurons which were responsive to specific task events on the first day of training for rewarded trials (left) and all trials (right). (L) Same as (K) but for training day N+1. Data points with horizontal error bars represent the mean lick timing ± SEM. For all PSTHs, shaded area represents ± SEM across dendrites.
Figure 3—figure supplement 1

Comparison of the mean ΔF/F response for all neurons segregated according to lobule, pre vs post learning, and pre vs post reward delivery. (A-C) (Schematic indicating imaging location (left) and summary of ΔF/F responses before and after learning for each area (right).
https://doi.org/10.7554/eLife.46764.005
Figure 3—figure supplement 2
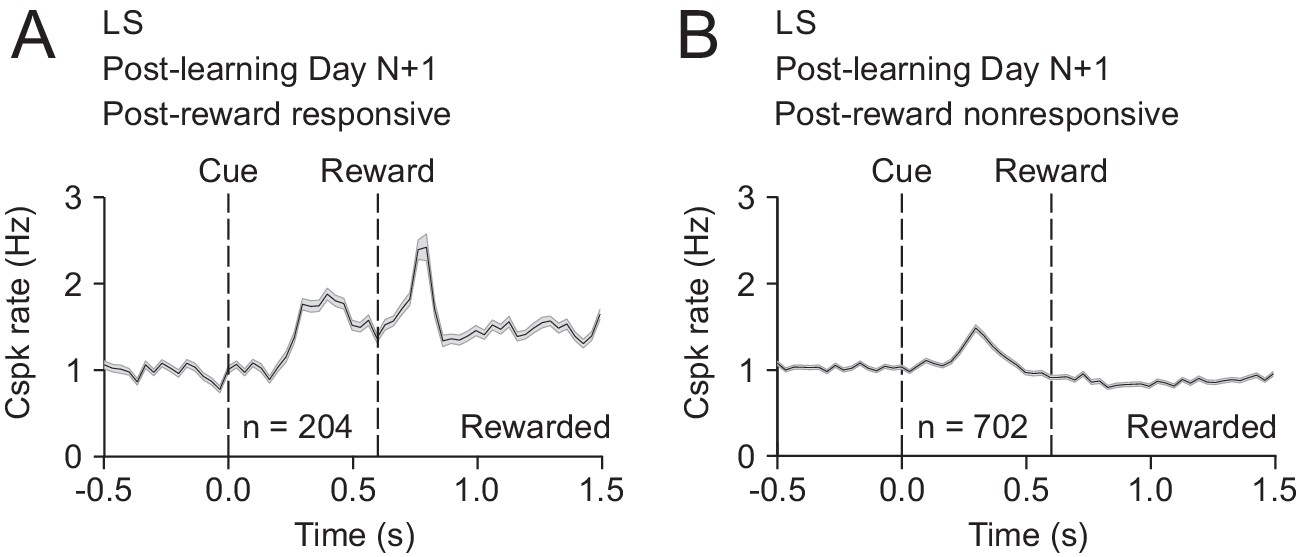
A minority of PC dendrites can respond to both reward and the reward-predictive cue after learning.
(A) Mean cue-aligned PSTH for PC dendrites that exhibited Cspk responses to reward. (B) Mean cue-aligned PSTH for PC dendrites that did not exhibit Cspk responses to reward.
Figure 3—figure supplement 3
No evidence of Cspk suppression following reward omission.
(A–C) Cspk responses identified as suppressed below baseline according to statistical criteria (Materials and methods) in LS, Crus I and Crus II show no suppression upon visual inspection. These small numbers of PC dendrites were likely identified based on noise in the PSTHs that crossed the threshold for significance.
Figure 4

Cspk responses measured in the same fields of view across learning.
(A) Example of manual identification from a field of view containing several of the same PC dendrites on day one and day N+1. Left, fields of view for day 1 (top) and day N+1 (bottom). Right, magnified view from the white box at left. Red arrows indicate an example PC dendrite identified both pre and post learning. Scale bars are 200 μm (x) x 50 μm (y). (B) Cue aligned calcium transients averaged across trials extracted from the PC dendrite identified in (A) for day 1 (top) and day N+1 (bottom). (C) Mean images taken from day 1 (left) and day N+1 (right) after independent rigid motion registration on each dataset. Scale bars are 200 μm (x) x 50 μm (y). (D) Pixel masks of PC dendrites independently extracted from the datasets in (C) (Materials and methods). (E) The post-learning data set from (C) right, was motion registered to the pre-learning dataset from (C) left. The resulting x-y pixel shifts were applied to the post-learning dendrite pixel masks from (D) right. (F,G) Following registration, the overlap between pre and post learning pixel masks was compared quantitatively (F) and graphically (G) with pre-learning masks labeled red, post-learning masks labeled green, and overlap labeled yellow. (H) Dendritic masks from (G) that had >50% overlap. (I) Summary of Cspk firing rates for individual PC dendrites in the pre (left) and post (right) reward window for all dendrites that had a > 50% overlap in their dendritic masks across learning (n = 61). (J) Summary of Cspk rates for the same individual PC dendrites in (I) measured in the post-reward window on Day one and the pre-reward window on Day N+1.
Figure 5
Cspk modulation in Crus I across learning.
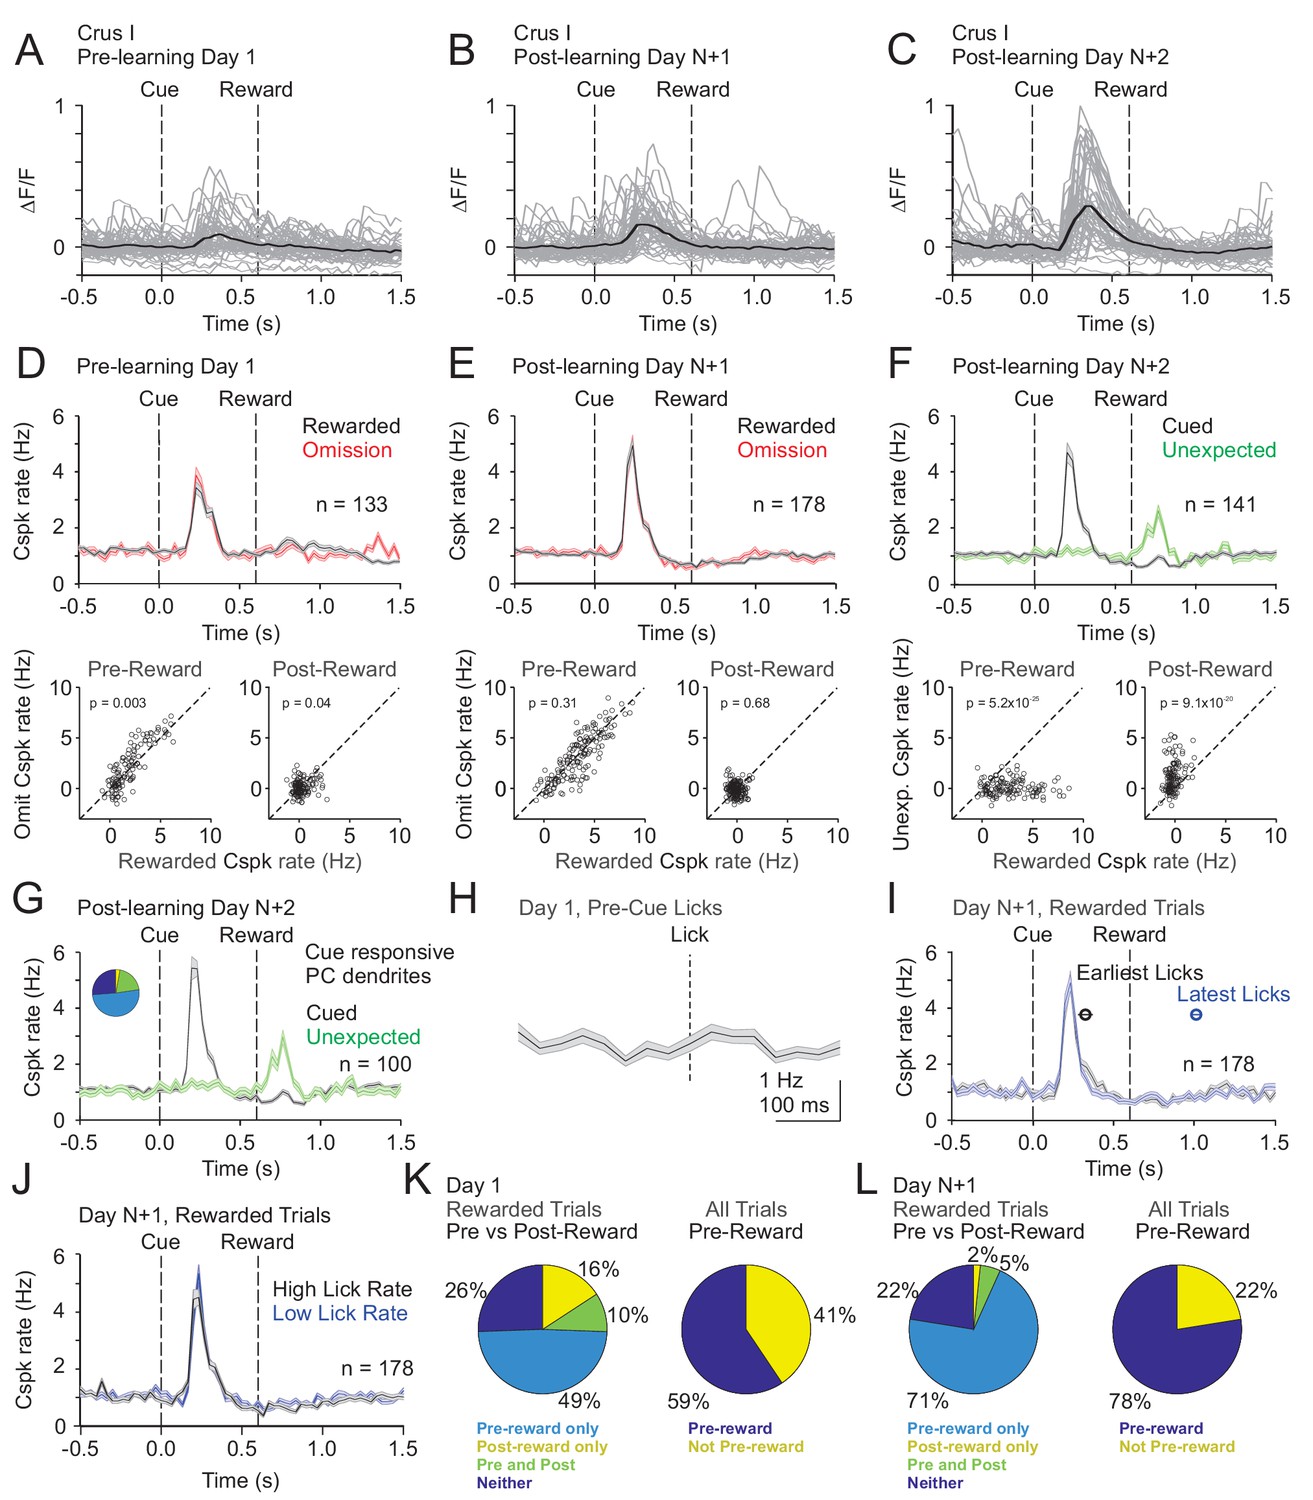
(A) ΔF/F timecourses from an example neuron measured via two-photon calcium imaging for the first day of training in naïve mice. Gray traces are the first 50 trials and the black trace is the average of those 50 trials. (B) Same as (A) but on post-learning day N+1. (C) Same as (A,B) but for post-learning day N+2. (D) Top, mean cue-aligned PSTHs of Cspk rate on reward (black) and omission (red) trials for all PC dendrites on the first day of training in naïve mice. Bottom, summary scatterplot comparing the Cspk rate for individual PCs on rewarded vs omission trials in naïve mice. Spike rates were measured in a window preceding reward delivery (left) or immediately after reward delivery (right) (Materials and methods). (E) Same as (D) but for rewarded and reward omission trials on post-learning day N +1 (F) Same as (D,E) but for rewarded and unexpected reward trials on post-learning day N+2. (G) Mean cue-aligned PSTH for PC dendrites that exhibited Cspk responses to the visual cue. Inset: fraction of the total dendrites on Day N+2 that responded in the pre-reward window on rewarded trials only (light blue, 51%), the post-reward window on unexpected reward trials only (yellow, 3%), both pre and post reward windows on rewarded and unexpected reward trials respectively (green, 20%), and neither window (blue, 26%). (H) Mean lick-triggered PSTH for licks during the ITI in naïve animals. (I) Mean cue-aligned PSTHs for trained animals with rewarded trials segregated according trials with the earlies 1/4 of licks (black, 326 ± 46 ms from cue) and latest 1/4 of licks (blue, 1010 ± 34 ms from cue). (J) Mean cue-aligned PSTHs for trained animals with rewarded trials segregated according to trials with the highest 1/4 of lick rates (black, 4.8 ± 0.1 Hz) and the lowest 1/4 of lick rates (blue, 2.1 ± 0.1 Hz) following reward delivery. (K) Fraction of all Crus I neurons which were responsive to specific task events on the first day of training for rewarded trials (left) and all trials (right). (L) Same as (K) but for training day N+1. Data points with horizontal error bars represent the mean lick timing ± SEM. For all PSTHs, shaded area represents ± SEM across dendrites.
Figure 6

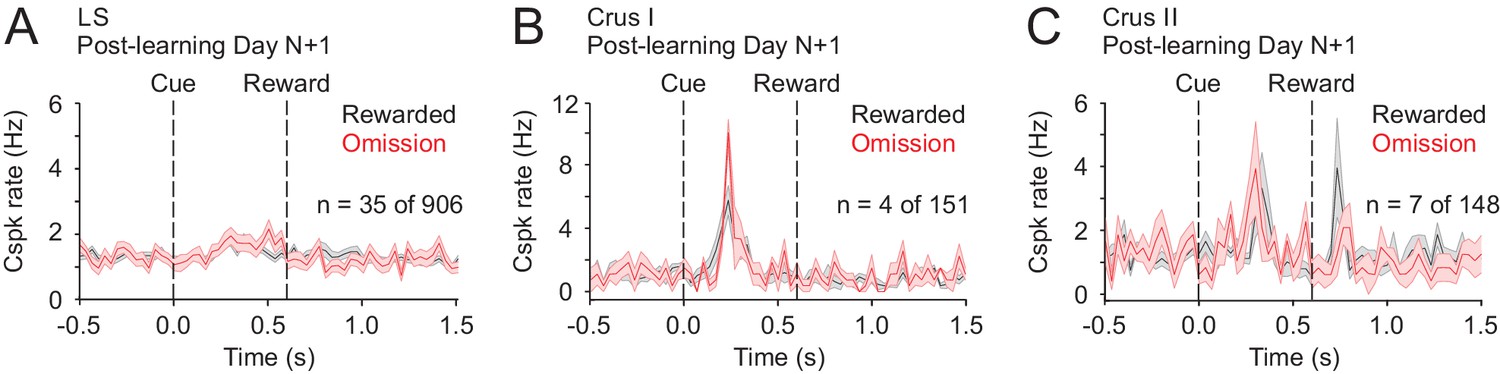
Cspk modulation in Crus II across learning.
(A) ΔF/F timecourses from an example neuron measured via two-photon calcium imaging for the first day of training in naïve mice. Gray traces are the first 50 trials and the black trace is the average of those 50 trials. (B) Same as A), but on post-learning day N+1. (C) Same as (A,B) but for post-learning day N+2. (D) Top, mean cue-aligned PSTHs of Cspk rate on reward (black) and omission (red) trials for all PC dendrites on the first day of training in naïve mice. Bottom, summary scatterplot comparing the Cspk rate for individual PCs on rewarded vs omission trials in naïve mice. Spike rates were measured in a window preceding reward delivery (left) or immediately after reward delivery (right) (Materials and methods). (E) Same as (D) but for rewarded and reward omission trials on post-learning day N +1 (F) Same as (D,E) but for rewarded and unexpected reward trials on post-learning day N+2. (G) Mean cue-aligned PSTH for PC dendrites that exhibited Cspk responses to the visual cue on Day N+2. Inset: fraction of the total dendrites on Day N+2 that responded in the pre-reward window on rewarded trials only (light blue, 19%), the post-reward window on unexpected reward trials only (yellow, 10%), both pre and post reward windows on rewarded and unexpected reward trials respectively (green, 14%), and neither window (blue, 57%). (H) Mean lick-triggered PSTH for licks during the ITI in naïve animals. (I) Mean cue-aligned PSTHs for trained animals with rewarded trials segregated according trials with the earlies 1/4 of licks (black, 296 ± 52 ms from cue) and latest 1/4 of licks (blue, 914 ± 78 ms from cue). (J) Mean cue-aligned PSTHs for trained animals with rewarded trials segregated according to trials with the highest 1/4 of lick rates (black, 5.0 ± 0.2 Hz) and the lowest 1/4 of lick rates (blue, 2.5 ± 0.2 Hz) following reward delivery. (K) Fraction of all Crus II neurons which were responsive to specific task events on the first day of training for rewarded trials (left) and all trials (right). (L) Same as (K) but for training day N+1. Data points with horizontal error bars represent the mean lick timing ± SEM. For all PSTHs, shaded area represents ± SEM across dendrites.
Figure 7
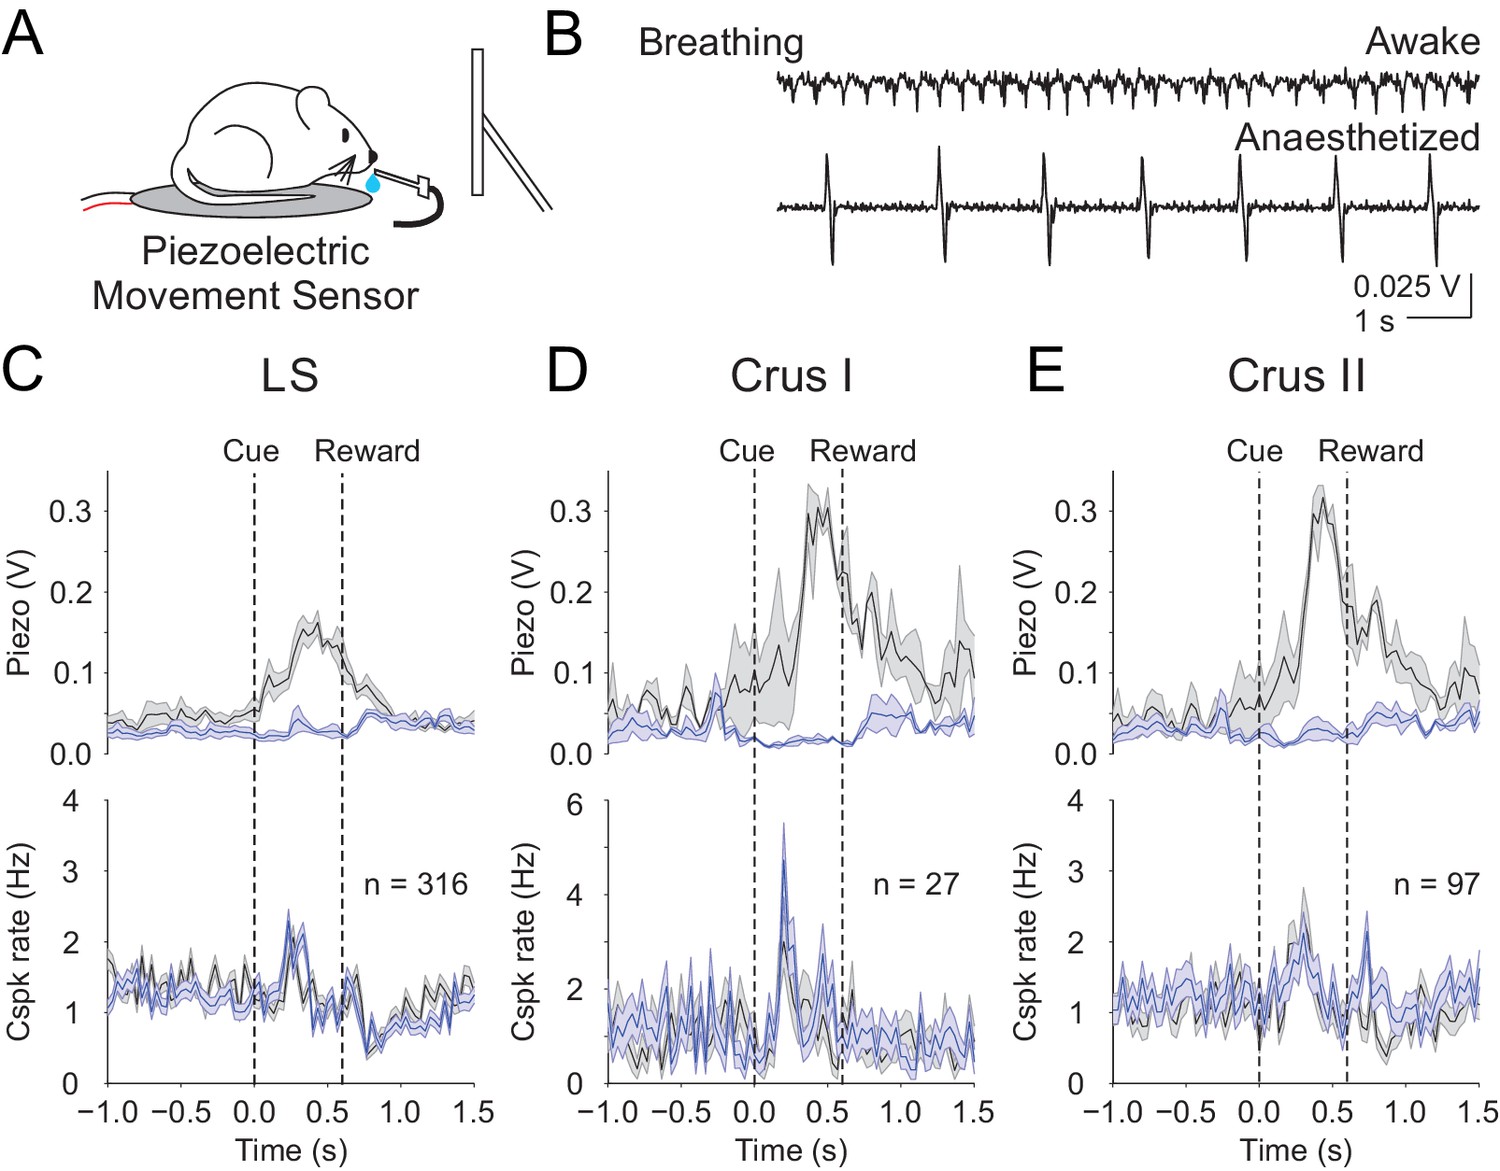
Body movements do not explain the learned reward predictive Cspks.
(A) Piezoelectric movement sensor was used to measure movements during the behavior for a subset of animals. (B) movement traces corresponding to mouse breathing during awake (top) and anesthetized (bottom) conditions. Note that breathing becomes both slower and deeper (larger amplitude movements) under anesthesia. (C) Top, movement traces for the 10% of trials with the most (black) and least (blue) movement in the pre-reward window. Bottom, mean cue-aligned PSTHs from PCs in the lobule simplex corresponding to the subset of trials with the most (black) and least (blue) movement. (D) Same as B) but for Crus I. (E) Same as (B,C) but for Crus II. For all PSTHs, shaded area represents ± SEM across dendrites.
Additional files
-
Source data 1
Data organization files.
Contains three files: A readme file that describes how the data are organized. "expNums_2P" and "expNums_LS_piezo" contain descriptive information about the two-photon experiments. expNums_2P is a 1x3 structure where each dimension is a different behavior condition (1=day1, 2=dayN+1, 3=dayN+2). The subfields contain information about which mice were imaged on each day, which lobules were imaged, and how many neurons were in the field of view. The file expNums_LS_piezo contains the same information but only for the lobule simplex datasets collected with the piezo movement data.
- https://doi.org/10.7554/eLife.46764.012
-
Source data 2
Widefield data.
- https://doi.org/10.7554/eLife.46764.013
-
Source data 3
Two photon LS piezo data.
- https://doi.org/10.7554/eLife.46764.014
-
Source data 4
Two photon C1.
- https://doi.org/10.7554/eLife.46764.015
-
Source data 5
Two photon C2.
- https://doi.org/10.7554/eLife.46764.016
-
Source data 6
Two photon LS data.
Day_N1 (1).
- https://doi.org/10.7554/eLife.46764.017
-
Source data 7
Two photon LS data.
Day_N1 (2).
- https://doi.org/10.7554/eLife.46764.018
-
Source data 8
Two photon LS data.
Day_1 (1).
- https://doi.org/10.7554/eLife.46764.019
-
Source data 9
Two photon LS data.
Day_1 (2).
- https://doi.org/10.7554/eLife.46764.020
-
Source data 10
Two photon LS data.
Day_N2.
- https://doi.org/10.7554/eLife.46764.021
-
Transparent reporting form
- https://doi.org/10.7554/eLife.46764.022
Download links
A two-part list of links to download the article, or parts of the article, in various formats.
Downloads (link to download the article as PDF)
Open citations (links to open the citations from this article in various online reference manager services)
Cite this article (links to download the citations from this article in formats compatible with various reference manager tools)
Classical conditioning drives learned reward prediction signals in climbing fibers across the lateral cerebellum
eLife 8:e46764.
https://doi.org/10.7554/eLife.46764


