Novel long-range inhibitory nNOS-expressing hippocampal cells
- University of Minnesota, United States
Figures
Figure 1 with 1 supplement
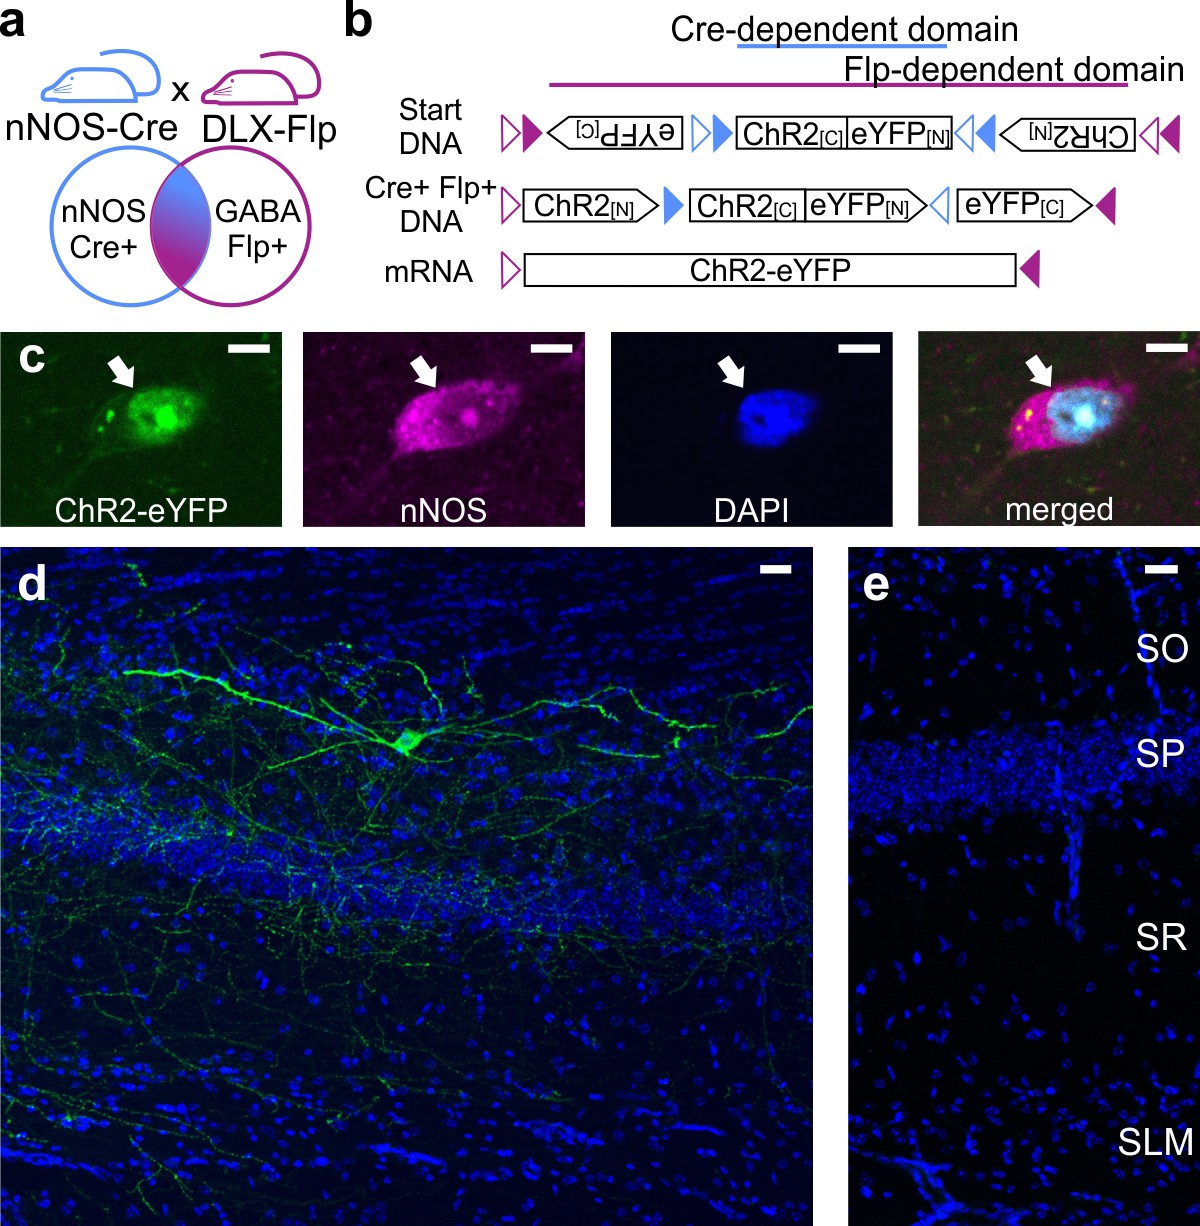
Intersectional genetic viral vector approach to target and characterize LINCs in the hippocampus.
nNOS-Cre x Dlx5/6-Flpe mice (a) that are injected with an intersectional AAV-DJ-ChR2-eYFP vector (b) show selective expression in nNOS-positive (c) inhibitory neurons (d) (LINCs). No expression is seen in injected negative control animals (e). Panel (b) is based on Fenno et al. (2014). Stratum oriens (SO), stratum pyramidale (SP), stratum radiatum (SR), stratum lacunosum moleculare (SLM). Scale bars: 5 µm (c); 25 µm (d, e).
Figure 1—figure supplement 1
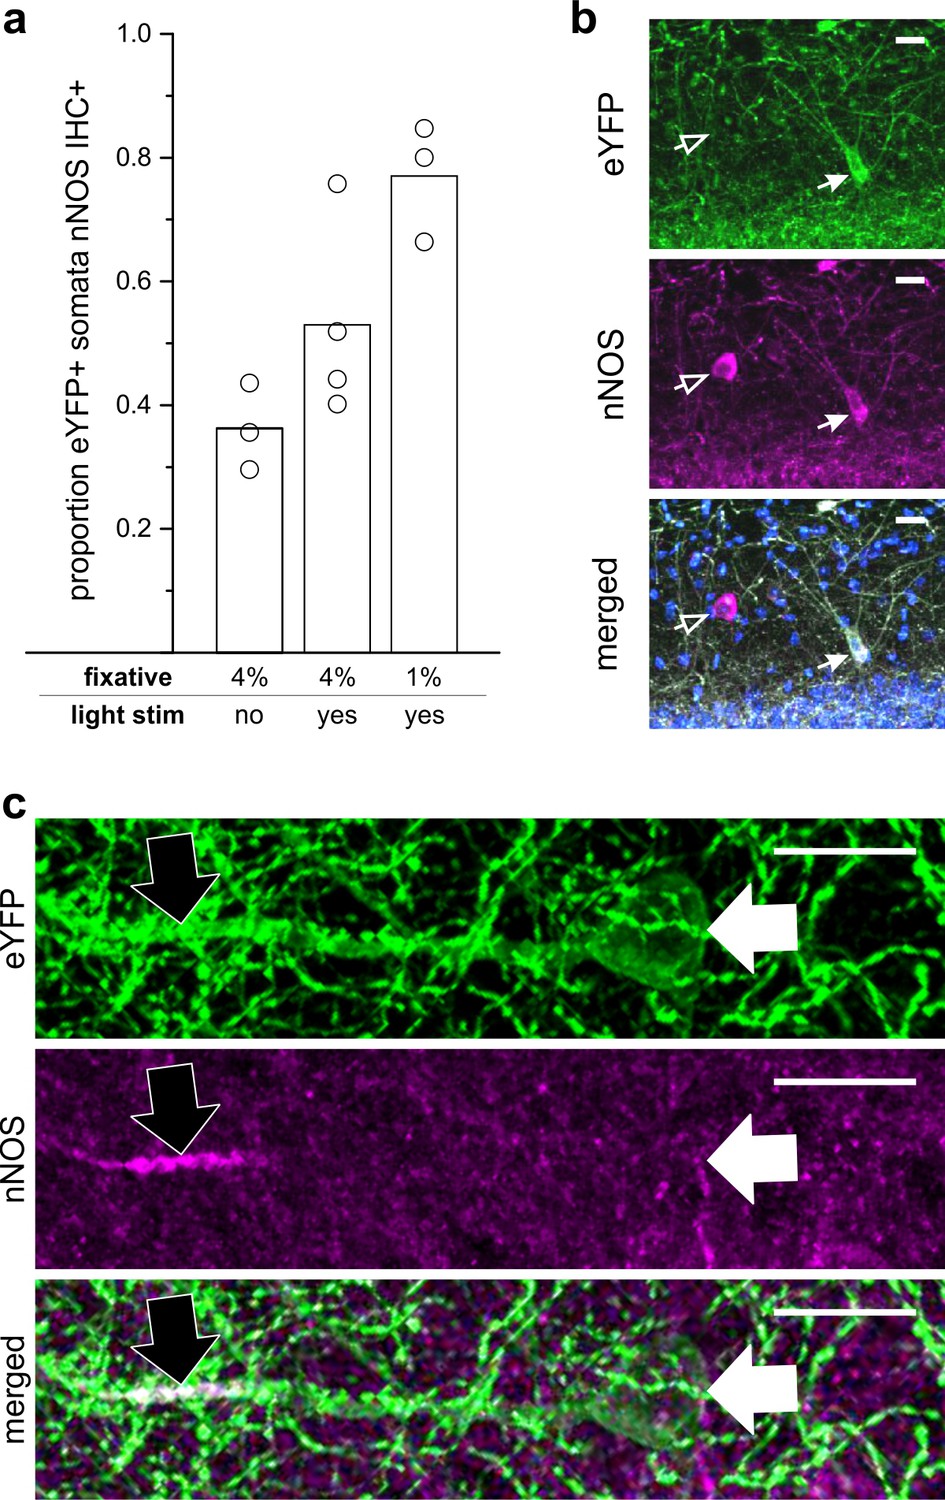
LINCs express nNOS.
(a) The proportion of eYFP+ somata that were nNOS immunoreactive (IHC+) by experimental condition and percent paraformaldehyde (PFA) fixative. Without optogenetic activation of LINCs, and following 4% paraformaldehyde fixation, a limited number of LINCs displayed obvious somatic nNOS immunoreactivity (303/811 eYFP+ cells, 36.2 ± 7.0%, n = 3 animals; mean ± SD). Although the regulated expression of NOS is most strongly associated with iNOS, the regulated expression of nNOS has also been reported (Santos et al., 2014; Shen and Gundlach, 1999; Walter et al., 2014; Wang et al., 1999). We therefore additionally examined the proportion of eYFP+ somata colocalizing with nNOS IHC after the delivery of light (light stim) to activate LINCs optogenetically (4% PFA; 326/565 eYFP+ cells, 53.0 ± 15.9%, n = 4 animals). nNOS immunochemistry is known to be sensitive to fixation; for example, CA1 PCs are nNOS IHC+ after fixation in 1% PFA, but not 4% PFA (Burette et al., 2002). Therefore, we also examined the immunolabeling of LINCs after brief 1% PFA, and found a high proportion of LINCS with nNOS immunoreactive somata (349/450 eYFP+ cells, 77.0 ± 9.5%, n = 3 animals). Data shown: mean (bar) with individual animals’ data (circles). (b) A representative example of the somatic colocalization of eYFP with nNOS IHC (closed arrow). Note that not all nNOS IHC+ neurons are labeled with the virus (open arrow). (c) In addition to somatic expression, nNOS can be found in dendrites, including PC dendrites after 1% PFA fixation (Burette et al., 2002) . In tissue with 1% PFA fixation, we noted instances in which LINC processes were nNOS IHC+ (black arrow) despite having immuno-negative somata (white arrow), indicating that the ~80% of eYFP+ cells with detected somatic nNOS immunoreactivity is a lower-bound of nNOS expression, which underestimates the expression of nNOS in LINCs. Scale bars = 20 µm (b,c).
Figure 2 with 3 supplements
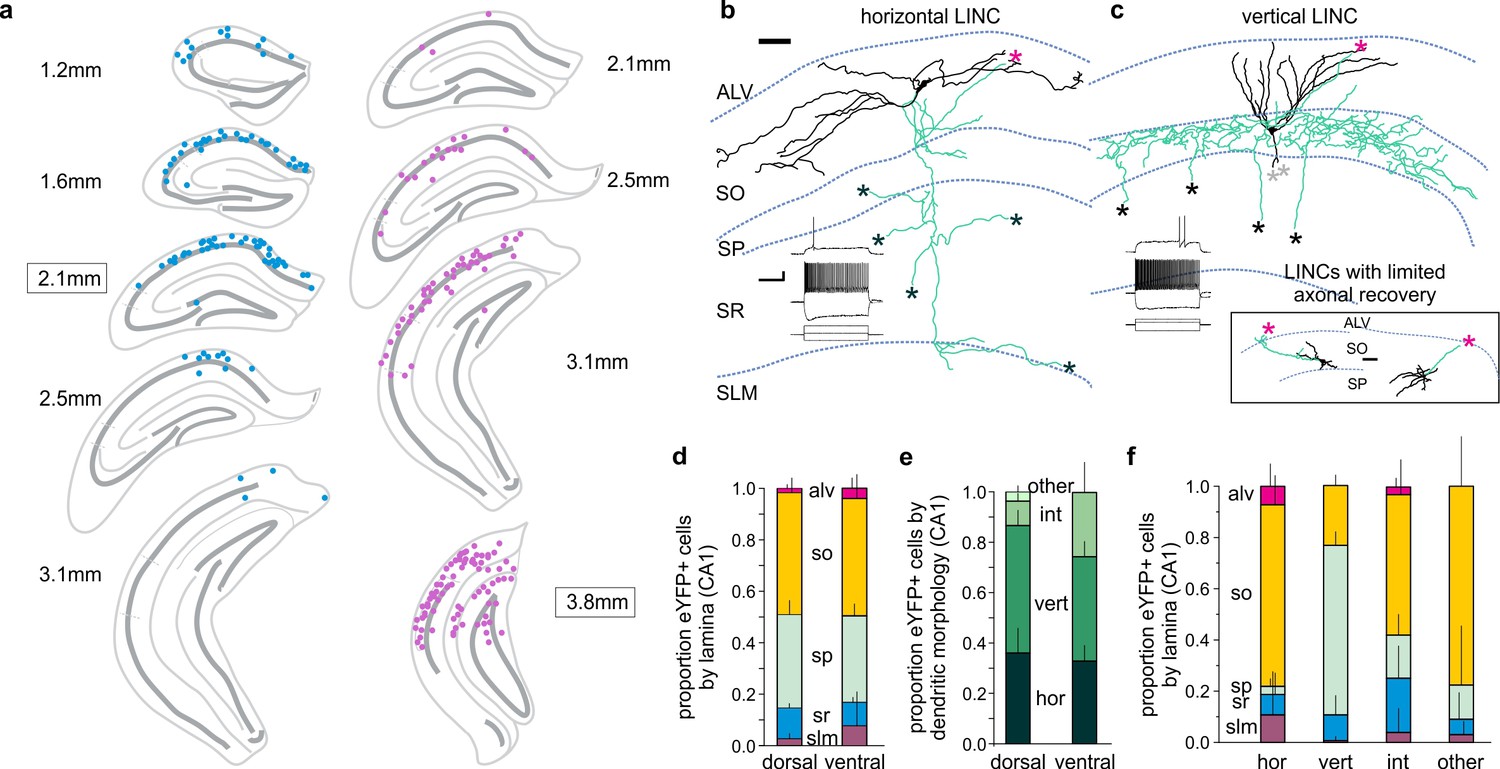
CA1 LINCs are typically located in SO or SP, largely display vertical or horizontal dendritic morphologies, and have axonal arbors consistent with long-range projections.
(a) eYFP+ somata location from a 1-in-4 coronal series after dorsal (blue) or more ventral (violet) virus injection (approximate injection position outlined). (b–c) LINCs have largely horizontal (b) or vertical (c) dendrites (black). In addition to local axons (green), all filled LINCs showed a severed axon (asterisk), often en route to the alveus (magenta asterisks). These axons were present even with limited axonal recovery (inset box), and are suggestive of long-range projections. Note that the example LINC in (c) was found to be PV-immunonegative. Insets in panels (b, c): firing properties of the cells. (d–f) CA1 LINCs by lamina (d), dendritic morphology (e), and location of cell body (f). Horizontal (hor), vertical (vert), intermediate (int), or other dendritic morphologies were counted. Cells without discernable dendrites were included in ‘other.’ Dorsal and ventral refer to the location of the viral injection. Alveus (ALV), stratum oriens (SO), stratum pyramidale (SP), stratum radiatum (SR), stratum lacunosum moleculare (SLM). Data are displayed as mean + SD in (d–f). Scale bars (b, c): 50 µm; 20 mV, 500 pA and 200 ms.
Figure 2—figure supplement 1
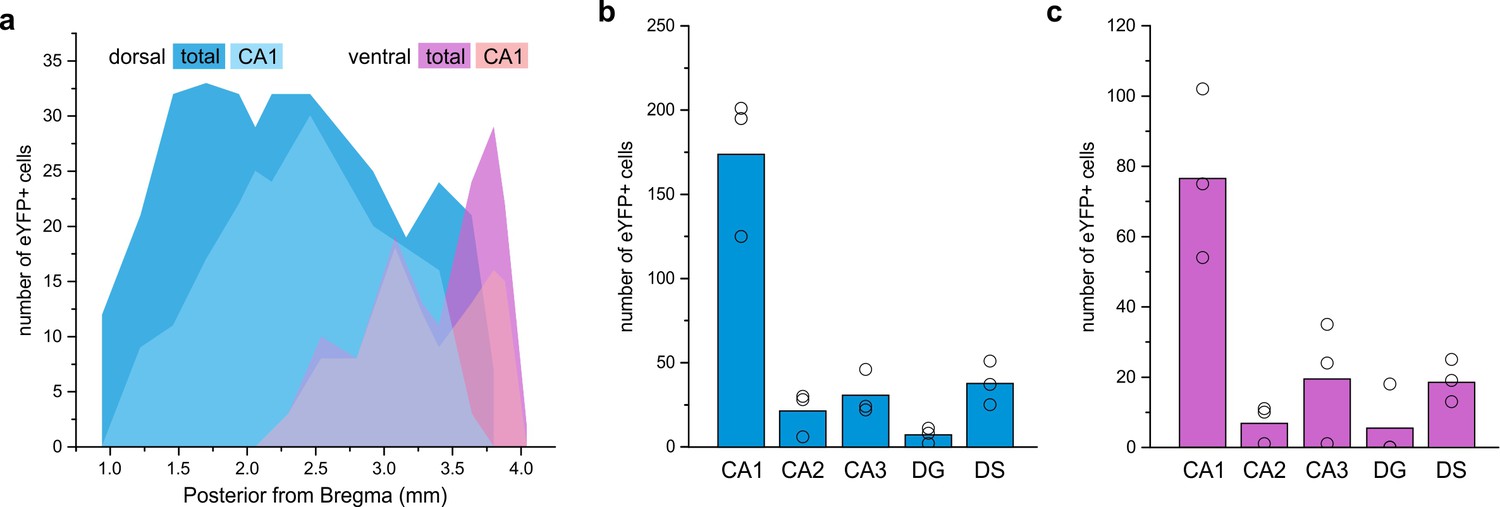
LINCs are found in anterior, intermediate, and posterior regions of the hippocampus.
(a) Distribution of eYFP-labeled cells in an animal after dorsal injection (blue) and an animal after a more ventral injection (violet), found in CA1 (light) or all hippocampal subfields (dark). (b–f) Summary data based on three dorsally injected and three ventrally injected animals. The majority of eYFP+ cells were found in CA1 (b, c), but some eYFP+ cells were located in each region of the hippocampal formation following either dorsal (b) or ventral (c) viral injection. Dentate gyrus (DG), dorsal subiculum (DS). Data in panels (b, c) are displayed as mean; circles represent data from individual animals.
Figure 2—figure supplement 2
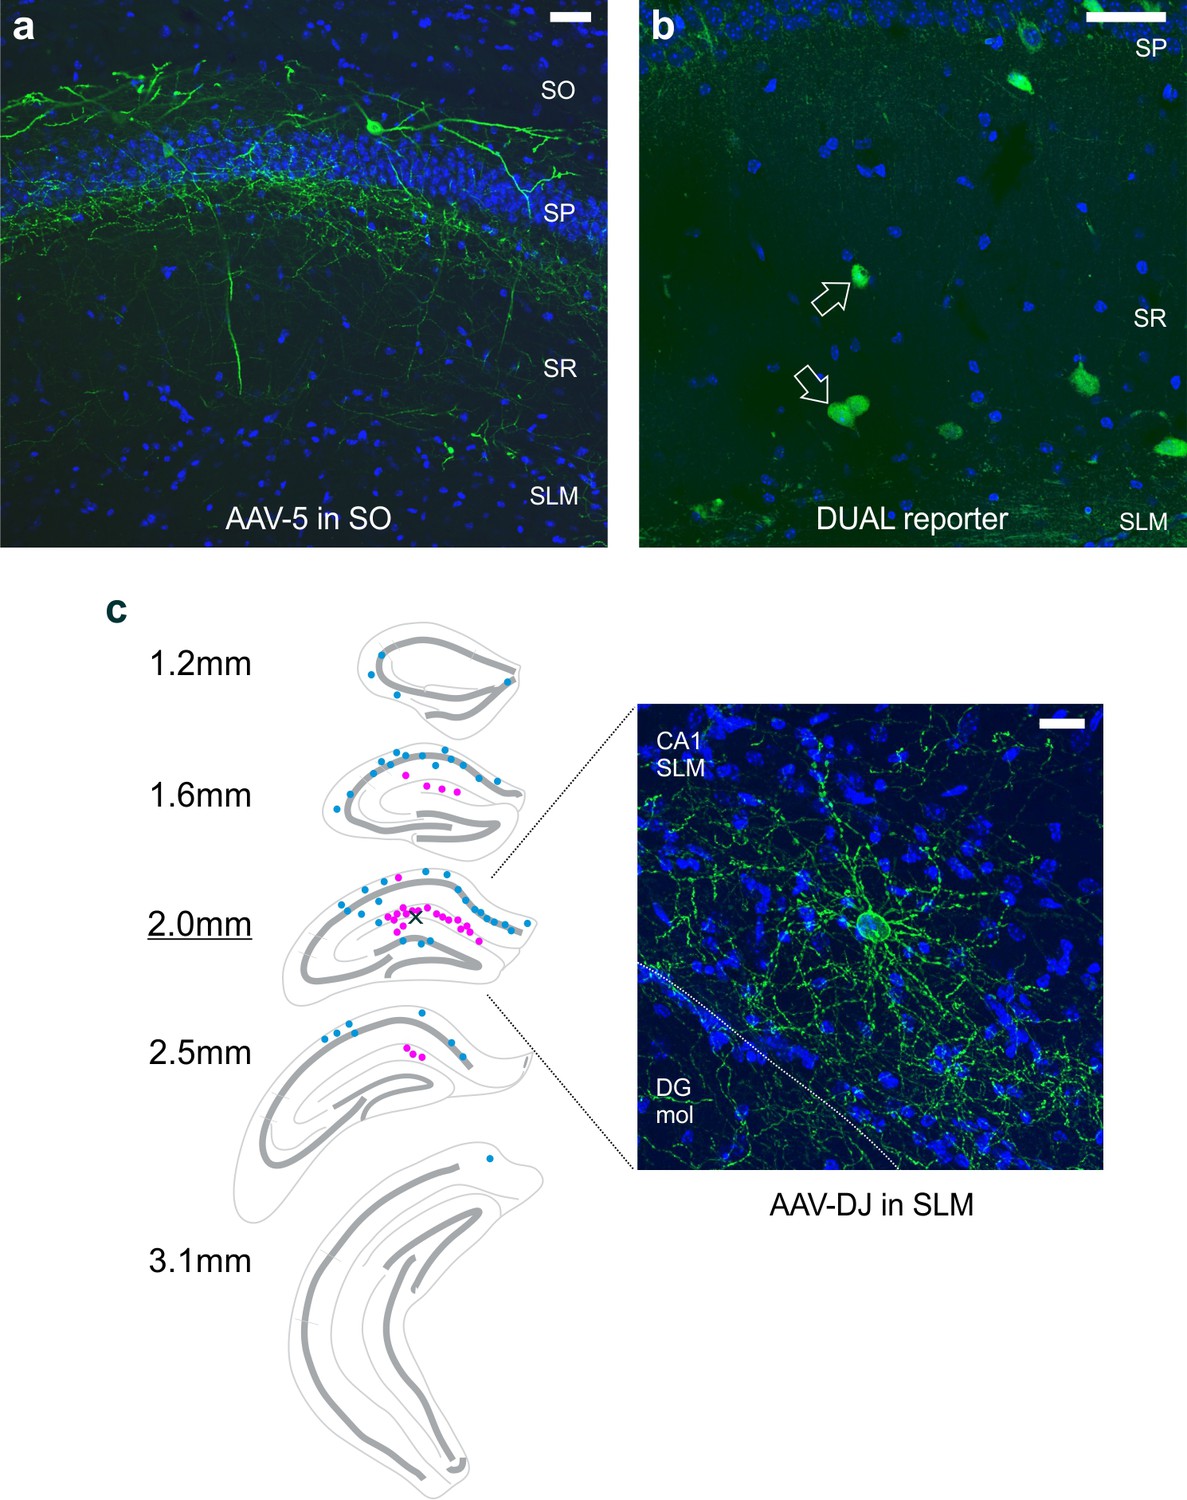
Labeling of putative neurogliaform cells depends, at least in part, on the location of virus injection.
(a) Injection of an AAV5 serotype of the Con/Fon-hChR2(H134R)-eYFP vector in the stratum oriens labels LINCs. (b) Crossing the nNOS-Cre and Dlx5/6-Flpe lines with a DUAL reporter mouse (RCE:dual) resulted in an expected profile of expression, which included GFP-positive cells near the stratum lacunosum moleculare and stratum radiatum border (arrows). (c) In experiments, viral injections were targeted to stratum oriens of CA1 (as in panel [A]) and did not result in strong labeling of neurogliaform cells. However, viral injections that were instead targeted to the hippocampal fissure or stratum lacunosum moleculare did result in noticeable labeling of putative neurogliaform cells (pink dots) in addition to LINCs (blue dots). The small X in the section 2.0 mm posterior from bregma marks the spot of viral injection in the example shown. Unlike LINCs, which had labeled cell bodies along the anterior-posterior extent of the hippocampus (Figure 2, Figure 2—figure supplement 1), the virally labeled putative neurogliaform cell bodies were concentrated immediately around the injection site. A representative putative neurogliaform cell is shown on the right. DAPI in blue, eYFP tagged ChR2 in green. Scale bars: 50 µm (a, b); 20 µm (c). Stratum oriens (SO), stratum pyramidale (SP), stratum radiatum (SR), stratum lacunosum moleculare (SLM). DG mol: molecular layer of the dentate gyrus.
Figure 2—figure supplement 3
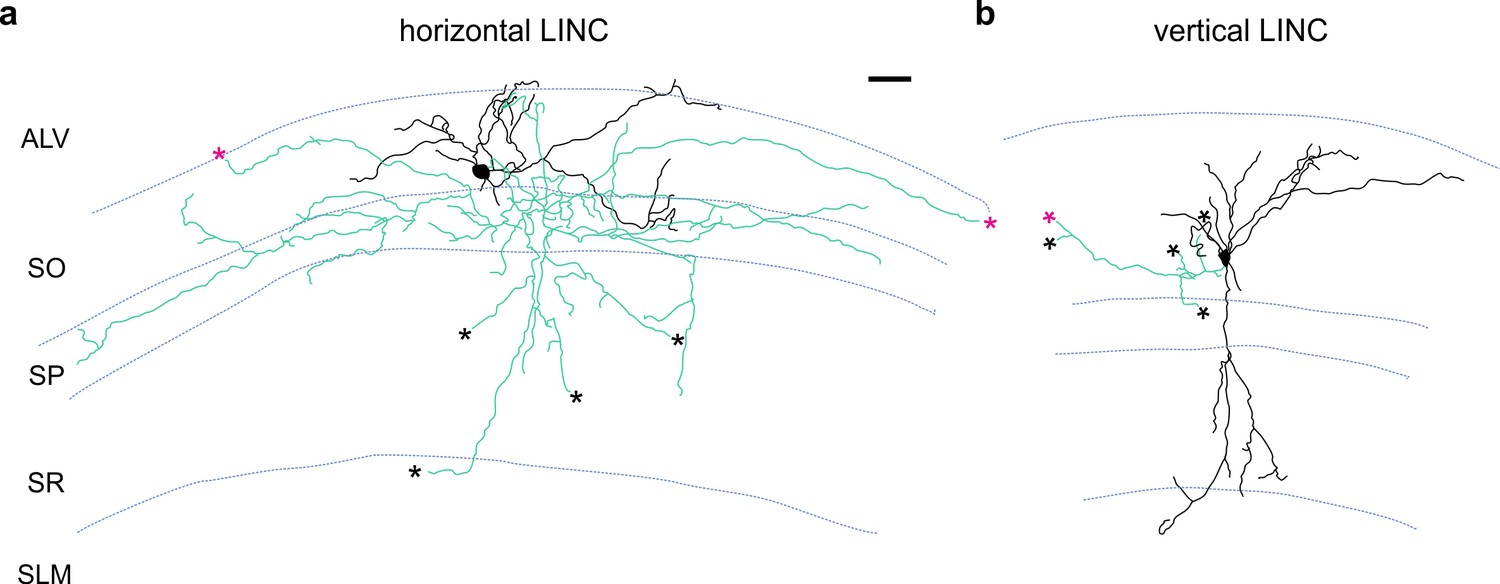
Additional examples of LINC morphology.
LINCs filled and recovered in sagittal sections. LINCs show either largely horizontal (a) or vertical (b) dendrites (black). Note that in addition to local axons (green), filled LINCs show severed axons (asterisks), which are suggestive of long-range projections. Alveus (ALV), stratum oriens (SO), stratum pyramidale (SP), stratum radiatum (SR), stratum lacunosum moleculare (SLM). Scale bar: 50 µm (a,b).
Figure 3 with 1 supplement
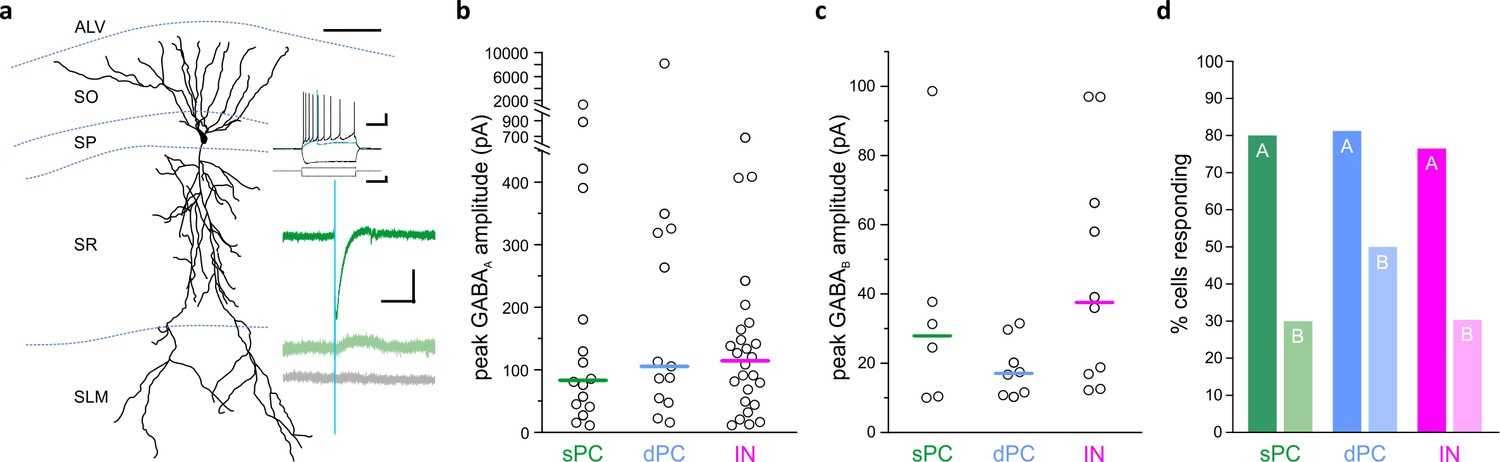
LINCs provide broad and long-lasting inhibition.
Optogenetic activation of LINCs produces postsynaptic inhibitory responses in superficial pyramidal cells (sPC, green; example morphology, firing properties, and light-evoked inhibitory post-synaptic currents (IPSCs) are shown in panel [a]), deep pyramidal cells (dPC, blue), and inhibitory neurons (IN, pink). (a) Top green trace, light-evoked IPSC; middle green trace, in gabazine; bottom gray trace, in gabazine plus CGP55845. (b, c) Peak amplitudes of GABAA (b) or GABAB responses (c) in individual cells showing a response. Bar denotes median amplitude. (d) Percentage of sPCs, dPCs, and INs with GABAA response (denoted with ‘A’) or a GABAB response ('B'). Scale bars (a): 50 µm; 20 mv, 200 ms (top set); 400 pA, 200 ms (middle); 50 pA, 200 ms (bottom).
Figure 3—figure supplement 1

LINCs produce fast and long-lasting inhibitory postsynaptic currents in a variety of inhibitory neurons in CA1.
Brief optogenetic activation of LINCs produces postsynaptic inhibitory responses in inhibitory neurons (INs) in CA1 of the hippocampus. (a) Light-evoked IPSCs were recorded from INs in all strata, with particularly strong GABAA-mediated IPSCs recorded from cell bodies in the pyramidal cell layer (SP). ([i] Excluding non-responses: Kruskal-Wallis [K-W] p=0.02; post hoc M-W tests p=0.04 [SO v. SP], p=0.01 [SP v. SR], p=0.03 [SP v. SLM]; [ii] including non-responses: K-W p=0.01; post hoc M-W tests p=0.01 [SO v. SP], p=0.004 [SP v. SR], p=0.004 [SP v. SLM]). (b) GABAB–mediated responses were also evident in many INs (with no statistically significant differences between layers; [i] excluding non-responses: K-W p=0.44; [ii] including non-responses: K-W p=0.26). (c) The percentage of inhibitory neurons with cell bodies in each layer of CA1 that showed a postsynaptic GABAA (denoted with ‘A’) or GABAB response ('B'). Notably, every recorded SP interneuron showed a GABAA response (8/8 cells). Note that only cells showing a response are illustrated in panels (a) and (b).
Figure 4 with 3 supplements
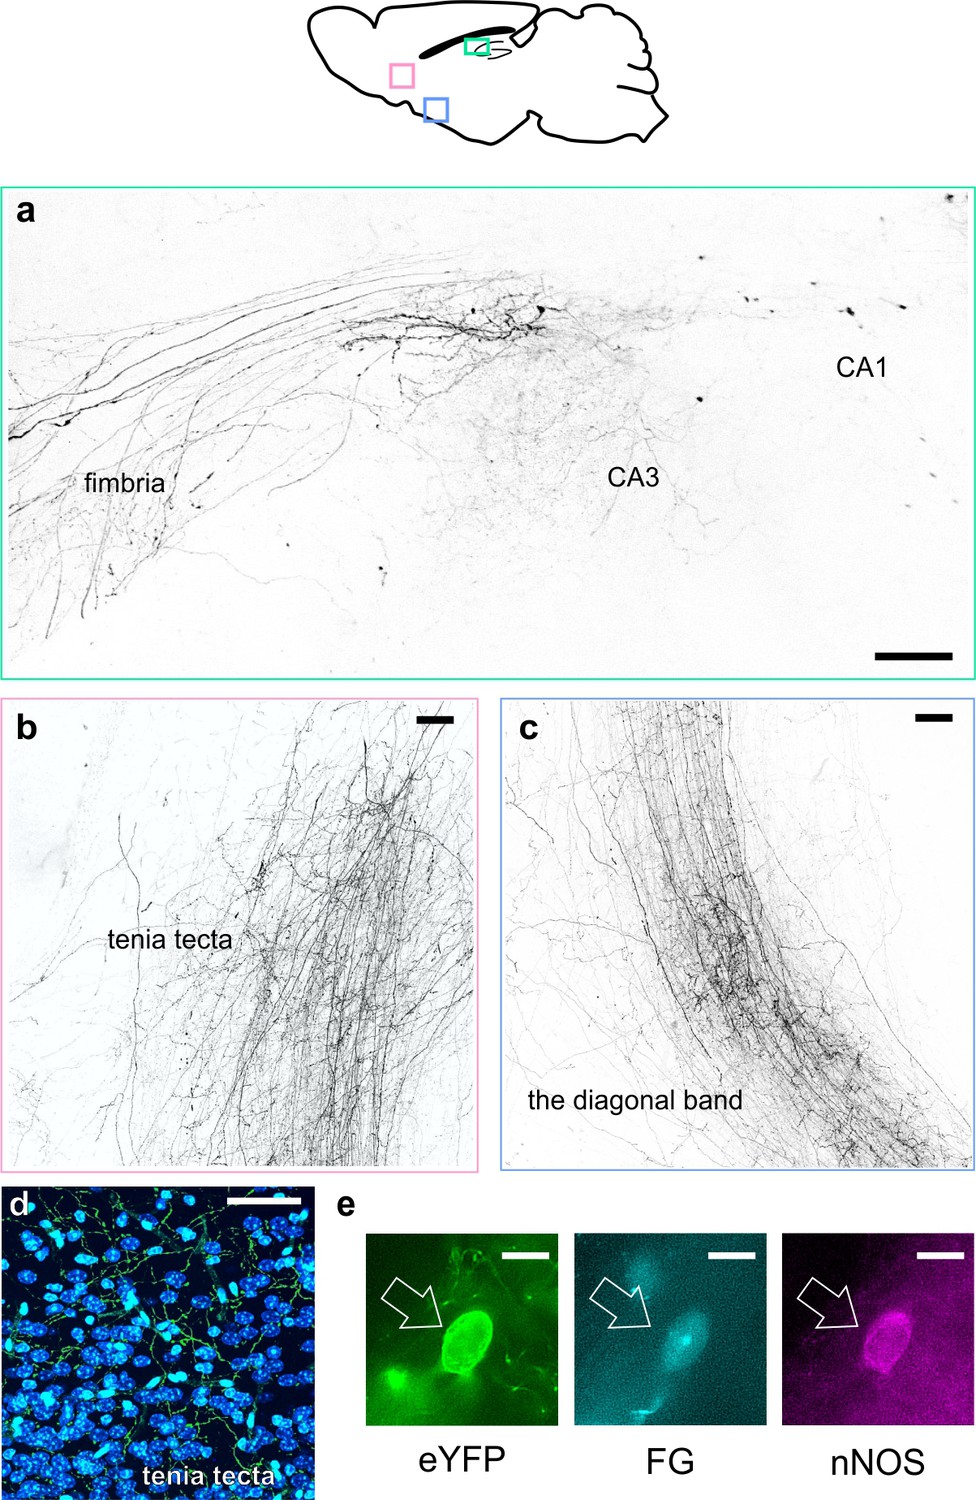
LINCs have extrahippocampal projections.
LINCs project out of the hippocampus (a), through the medial septum, and into the tenia tecta (b, d), the diagonal band (c), and other areas (Figure 4—figure supplement 1). (a–c) Max projections from X-CLARITY cleared tissue. (d) eYFP+ processes viewed in the dorsal tenia tecta from a 50 µm section; DAPI in blue. (e) Example LINC colabeled with the retrograde tracer Fluorogold (FG) and confirmed immunoreactive for nNOS following injection of FG into the diagonal band. Scale bars: 100 µm (a–c), 50 µm (d), and 10 µm (e).
Figure 4—figure supplement 1
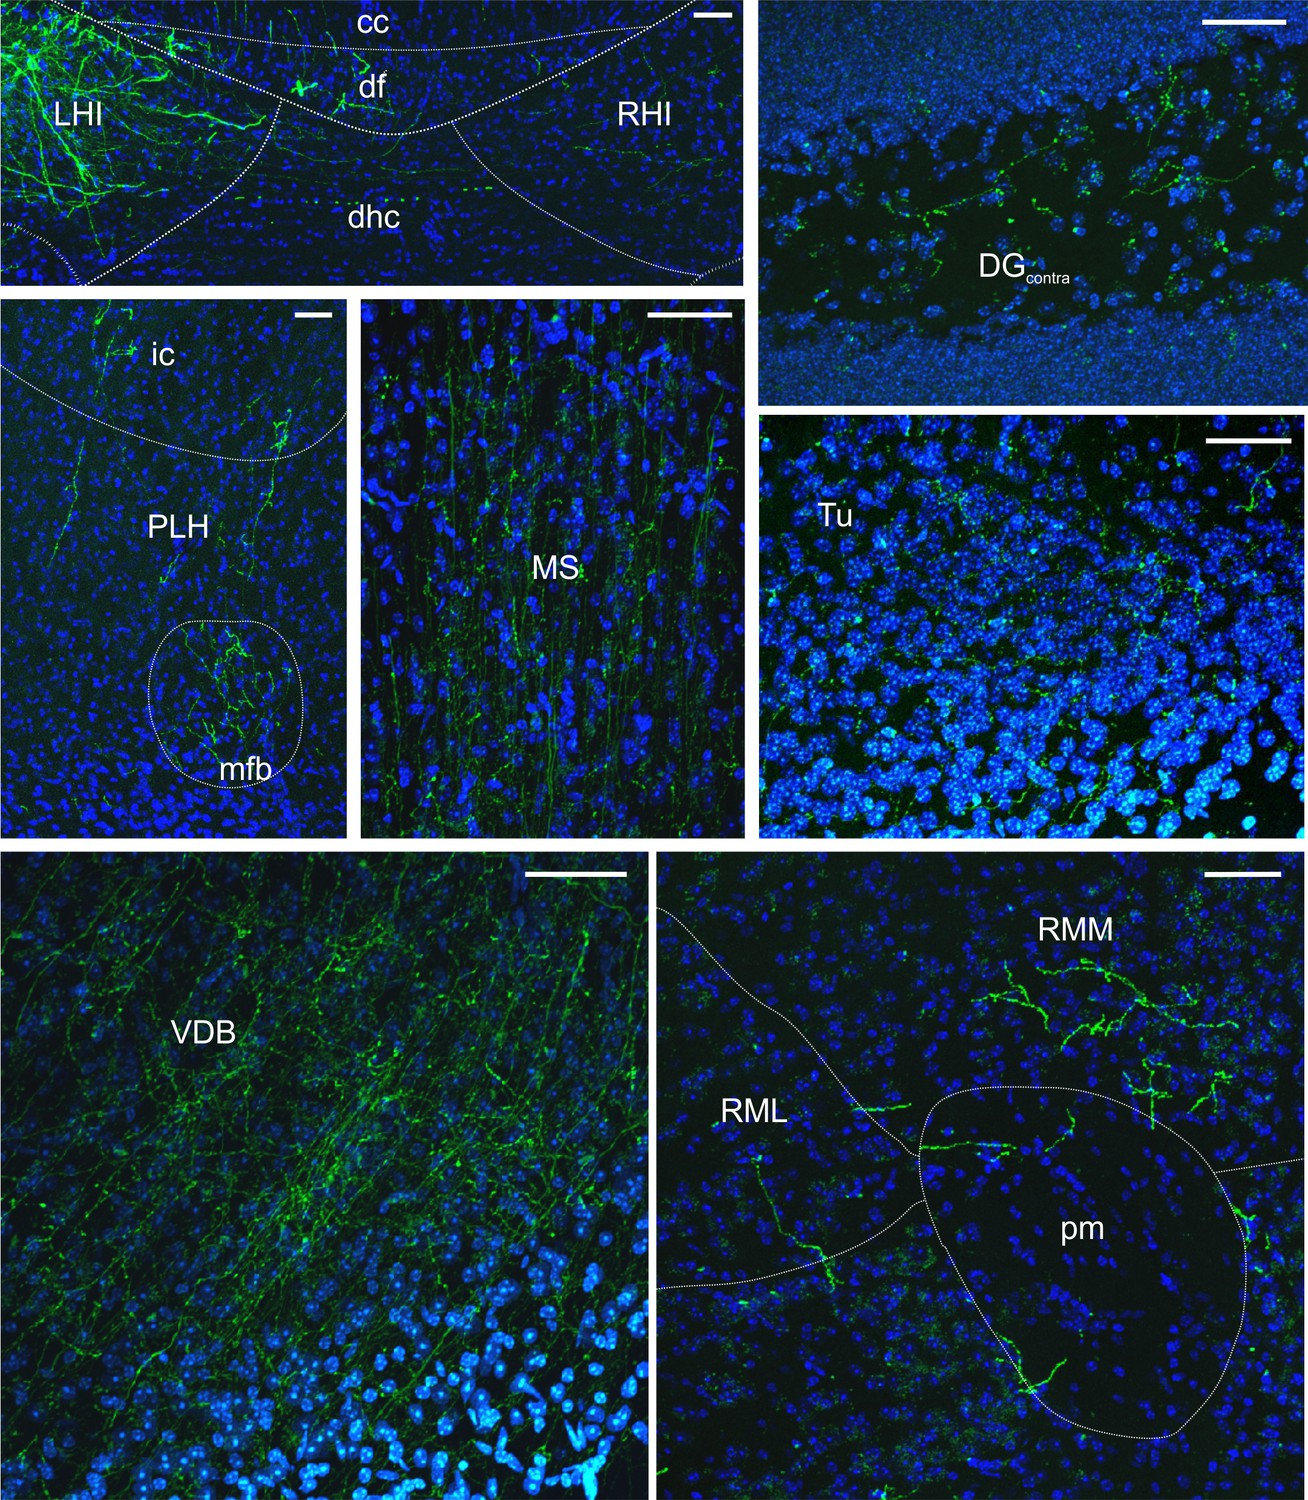
LINCs have long-range projections to several extrahippocampal regions.
Representative images of eYFP+ fibers in various projection regions taken from 50 µm coronal sections; neuroanatomical abbreviations and outlines estimated following Franklin and Paxinos (2007). DAPI in blue. Corpus callosum (cc), dentate gyrus (DG), dorsal fornix (df), dorsal hippocampal commissure (dhc), internal capsule (ic), left hippocampus (LHI), medial forebrain bundle (mfb), medial septum (MS), peduncular part of the lateral hypothalamus (PLH), principal mammillary tract (pm), right hippocampus (RHI), retromammillary nucleus, lateral (RML), retromammillary nucleus, medial (RMM), olfactory tubercle (Tu), vertical limb of the diagonal band of Broca (VDB). Scale bars = 50 µm.
Figure 4—figure supplement 2

Quantification of LINC fibers.
eYFP fibers labeled after injection of AAV-DJ-hSyn-Con/Fon-hChR2(H134R)-eYFP-WPRE into cNOS-fDLX mice, or for comparison cSOM-fDLX mice, were quantified in the medial septum (MS; [a]), diagonal band of broca (DB; [b]), and dorsal tenia tecta (TT; [c]). Left: example confocal images of eYFP+ fibers from the MS (sagittal; [a]), DB (coronal; [b]), and TT (sagittal; [c]). Right: Histograms of fiber length by region and mouse line; cumulative data from n = 3 animals are shown (three cNOS-fDLX mice and three cSOM-fDLX mice; one 50 μm section each). Note that cSOM-fDLX mice were used as a point of comparison because SOM+ GABAergic projection cells are a known population of hippocampal neurons that project to the MS/DB area (referred to in the literature as hippocampal-septal cells [Jinno et al., 2007; Klausberger, 2009]). While LINCs robustly project to the MS and DB (a, b), LINC projections in the MS branch less profusely than SOM+ projections, as seen in the reduced number of short fibers (a), while the number of longer fibers (passing through the MS) are similar (inset in panel [a], right). (d) Fiber density, however, is lower in MS and DB in cNOS-fDLX compared to cSOM-fDLX animals. Substantial eYFP fibers are also seen in the TT in all cNOS-fDLX animals, although similar fibers are essentially lacking in cSOM-fDLX mice (c, d), supporting the hypothesis that LINCs, but not SOM+ hippocampal-septal cells, project to the TT. Open dots in panel (d) represent data from individual animals; bars represent the mean. (e) These basic findings based on eYFP expression were confirmed upon FG injection into the medial septum, diagonal band, or tenia tecta, and they suggest both some overlap between SOM+ hippocampal-septal cells and LINCs, as well as the existence of distinct SOM-immunonegative LINCs. A portion of FG-labeled LINCs were SOM immuno+ after FG injection into the medial septum (8 of 12 FG+ LINCs were SOM+, n = 3 animals, cells counted in every other 50 µm section), and after FG injection into the diagonal band of Broca (4 of 29 FG+ LINCs in CA1, n = 3 animals, cells counted in every fourth 50 µm section). However, paralleling the eYFP fiber quantification, no FG+ LINCs were SOM+ after FG injection into the tenia tecta (n = 3 animals, cells counted in every other 50 µm section). Scale bars in panels (a–c) = 100 µm.
Figure 4—video 1
eYFP+ fibers exiting the hippocampus through the fimbria.
Virally labeled cell bodies in the hippocampus send projections to extrahippocampal areas through the fimbria. This video shows projections, as viewed sagittally, in X-CLARITY cleared tissue. Note that an inverted max projection of these images is also shown in Figure 4a.
Figure 5 with 1 supplement
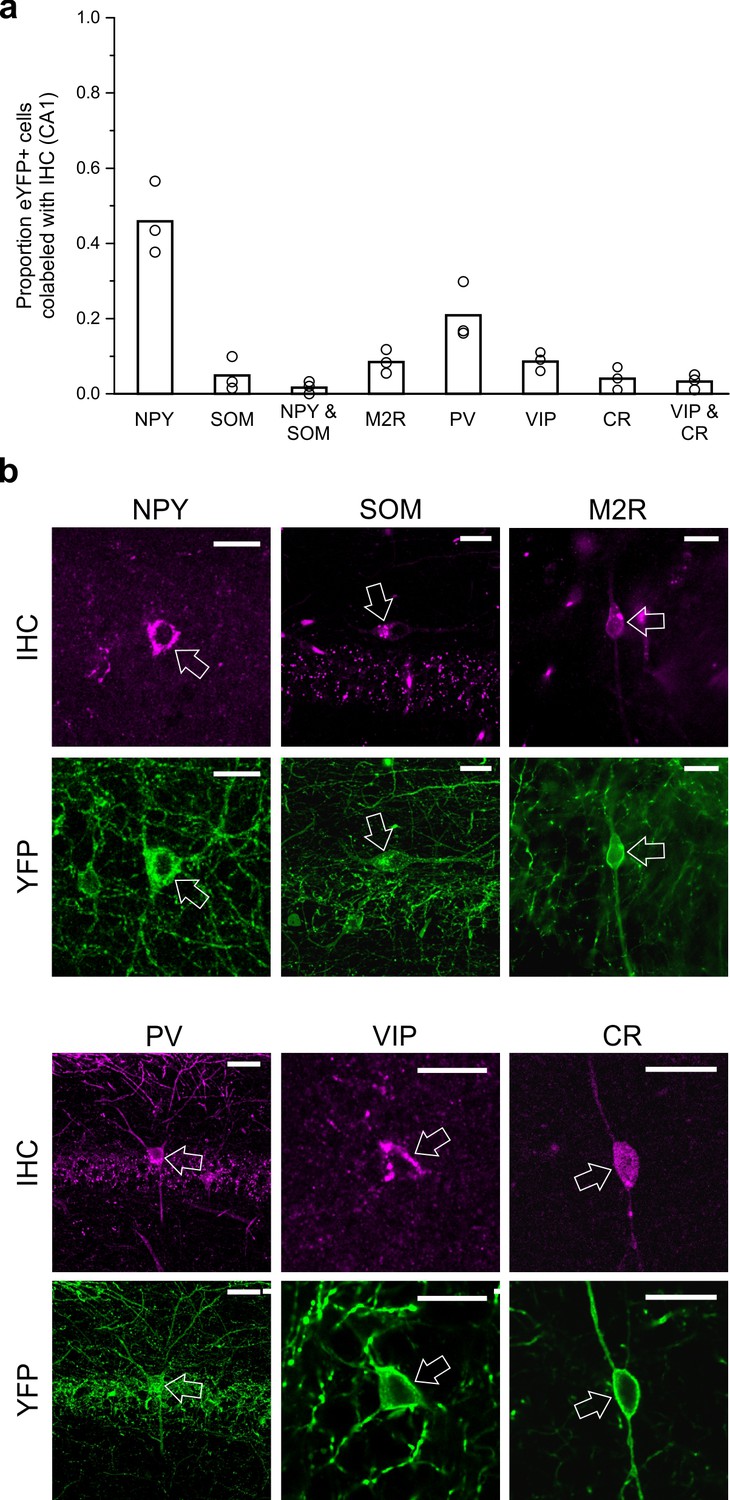
LINCs can express NPY but typically do not express SOM, M2R, PV, VIP, or CR.
Virally labeled (eYFP+) somata in CA1 were examined for immunofluorescent colocalization with various molecular markers or combinations of markers associated with other long-range projecting inhibitory cells or other nNOS+ interneurons. (a) Although a substantial number of eYFP+ cells were immunopositive for neuropeptide Y (NPY), few were immunopositive for somatostatin (SOM), and even fewer for both NPY and SOM, or for muscarinic acetylcholine receptor M2 (M2R), parvalbumin (PV), vasoactive intestinal peptide (VIP), and/or calretinin (CR). (b) Representative images of viral colocalization with immunofluorescence (arrows). Data in panel (a) are means, circles represent data from individual animals. Virally labeled cells were counted and viewed for immunofluorescence in every fourth 50 µm hippocampal section in n = 3 animals following a viral injection targeting dorsal CA1. An additional three animals were instead injected with virus targeting towards ventral CA1 and assessed for colocalization with SOM, M2R, and PV (data shown in Figure 5—figure supplement 1) and show largely the same pattern of molecular expression. Scale bars = 10 µm.
Figure 5—figure supplement 1
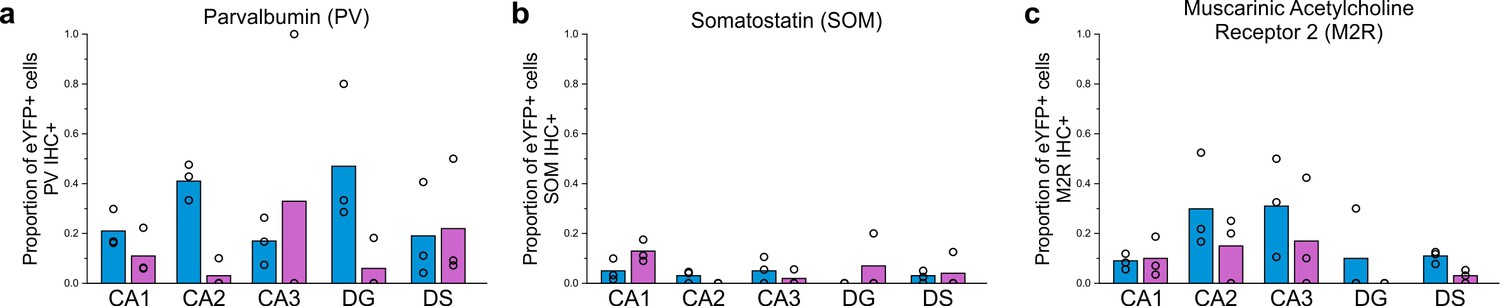
Expanded immunohistochemical data, including data for regions outside of CA1 following viral injection targeted to the dorsal or ventral hippocampus.
The proportion of eYFP+ cells that colocalize with PV (a), SOM (b), or M2R (c) immunohistochemistry (IHC) following a dorsal (blue) or ventral (violet) viral injection, by hippocampal formation region. Note that the CA1 data from dorsal injections (a-c) is discussed in the main text, but has also been included here for easy reference. Note also the relatively high proportion of eYFP-labeled cells in the DG that colocalize with PV-immunofluorescence after dorsal virus injection; these cells may correspond to the PV+ nNOS+ cells of the DG noted previously, of which little is known (Jinno and Kosaka, 2002; Tricoire and Vitalis, 2012). Dentate gyrus (DG), dorsal subiculum (DS). Data are displayed as means; circles represent data from n = 3 individual animals for each injection location.
Figure 6
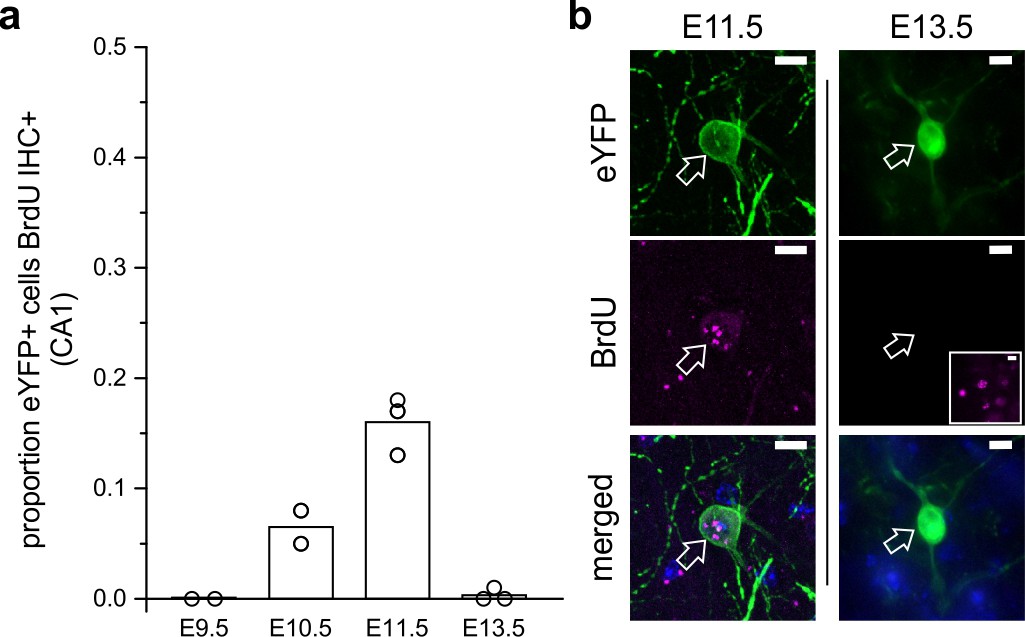
LINCs are born on or around embryonic day 11.
(a) The proportion of eYFP+ cells in CA1 that colocalized with BrdU in adult mice that were previously exposed to BrdU at embryonic day 9.5 (E9.5), 10.5, 11.5, or 13.5. (b) Representative images of eYFP colocalizing with BrdU at E11.5 but not at E13.5. The inset shows BrdU elsewhere in the hippocampus at E13.5 with the same image acquisition settings. Data are shown as means; circles represent data from individual animals. Scale bars = 10 µm.
Figure 7 with 1 supplement
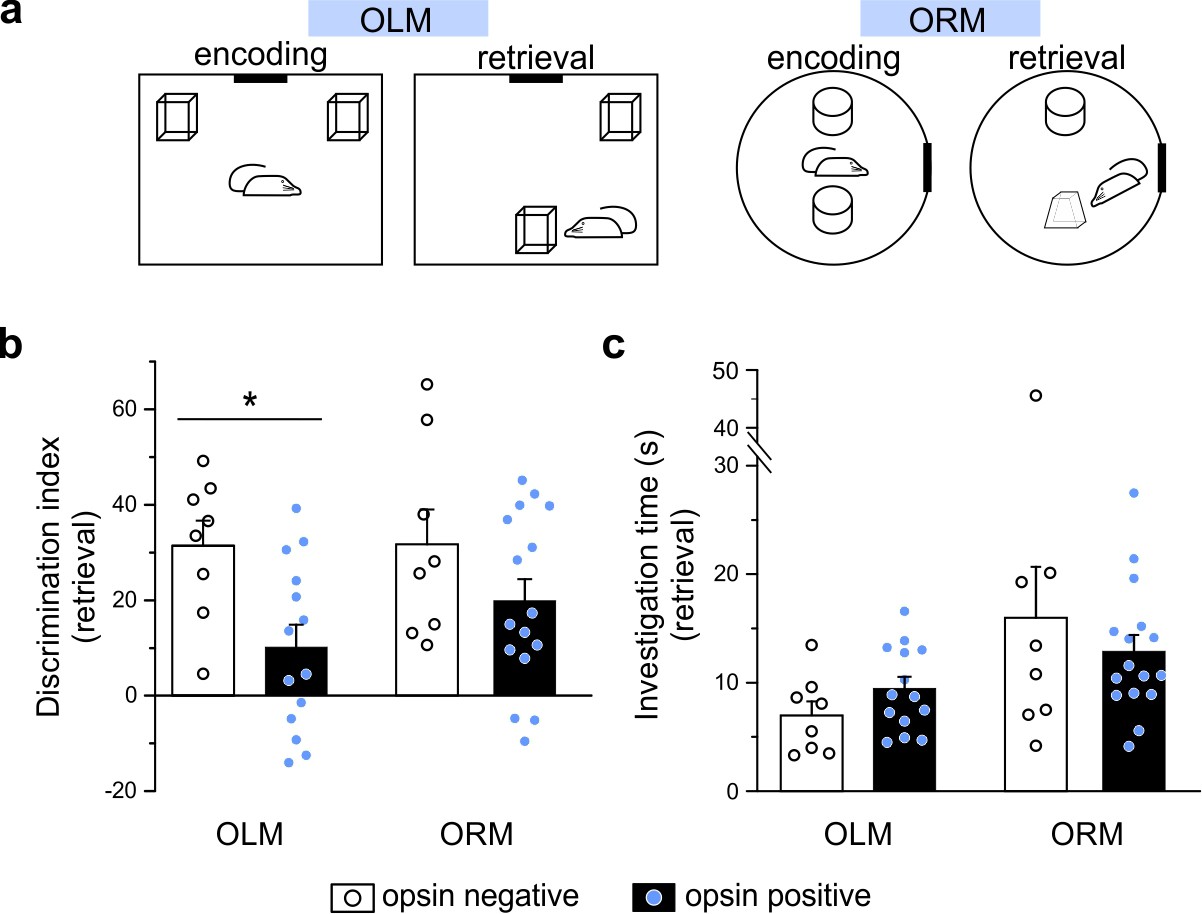
Optogenetic manipulation of LINCs in vivo affects spatial memory.
(a) Schematics for object location (OLM) and recognition memory (ORM) tasks. (b) Light stimulation significantly decreases performance (i.e. discrimination index) in opsin-positive animals in the OLM task but not in the ORM task. (c) Light stimulation does not affect total object investigation time during retrieval. (b, c) Data shown: mean ± SEM, with circles representing data points from individual animals. Asterisk: p-value<0.05, M-W, opsin+ vs opsin-negative.
Figure 7—figure supplement 1
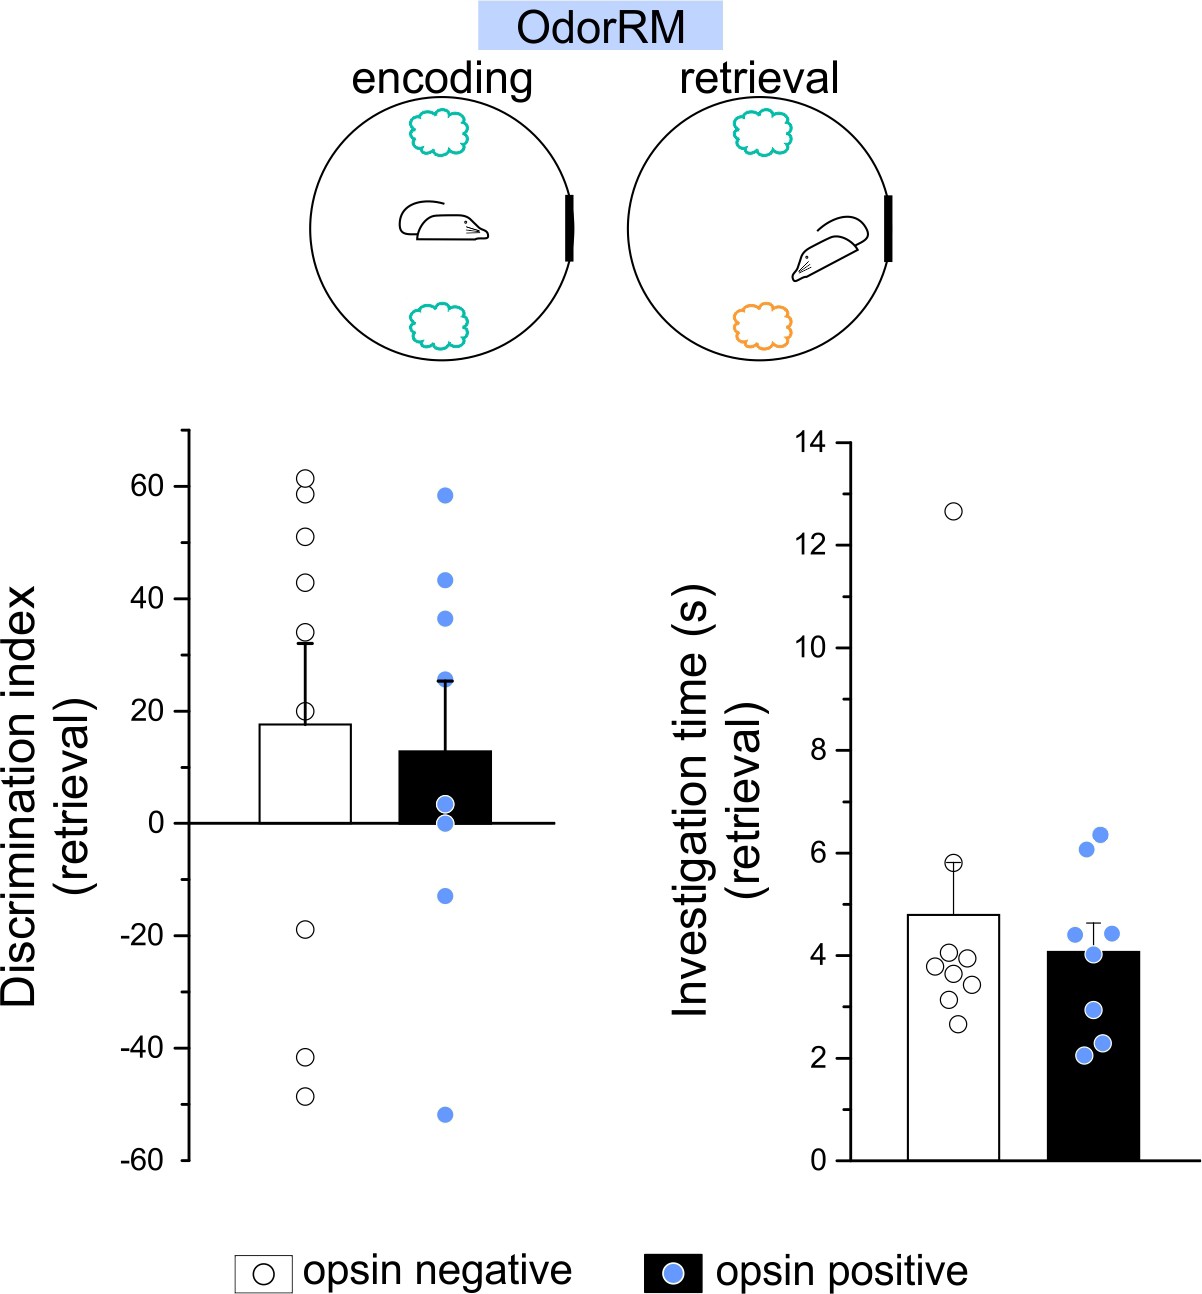
Manipulating LINCs did not impact performance in an odor recognition memory task.
Performance (as measured by discrimination index [DI] during retrieval) on an odor recognition memory task (OdorRM) in which opsin+ (filled) and opsin-negative (open) animals were allowed to explore familiar and novel odors. In the OdorRM test, there was considerable variability in retrieval DI, in both opsin+ and opsin-negative mice, and only modest average DIs (opsin+: 12.8 ± 12.6 (mean ± SEM); opsin–: 17.7 ± 14.4; n = 8 and n = 9 animals, respectively; no significant difference between genotypes: p=0.67, M-W). This was potentially due to inter-mouse variability in which odor was preferred (i.e., novel [Scott et al., 2013] vs familiar [Pena et al., 2017]; note the large negative DIs for some animals). When the sign (positive/negative) of the DI was not taken into account, OdorRM average DIs were markedly higher in both genotypes (opsin+: 29.0 ± 7.8, opsin-15 negative: 41.9 ± 5.1, not illustrated), but there remained no significant difference between genotypes (opsin+ vs. opsin–, p=0.27, M-W). (b) Time spent investigating the objects during retrieval. Data are shown as means ± SEM with individual animals’ data points.
Figure 8 with 1 supplement
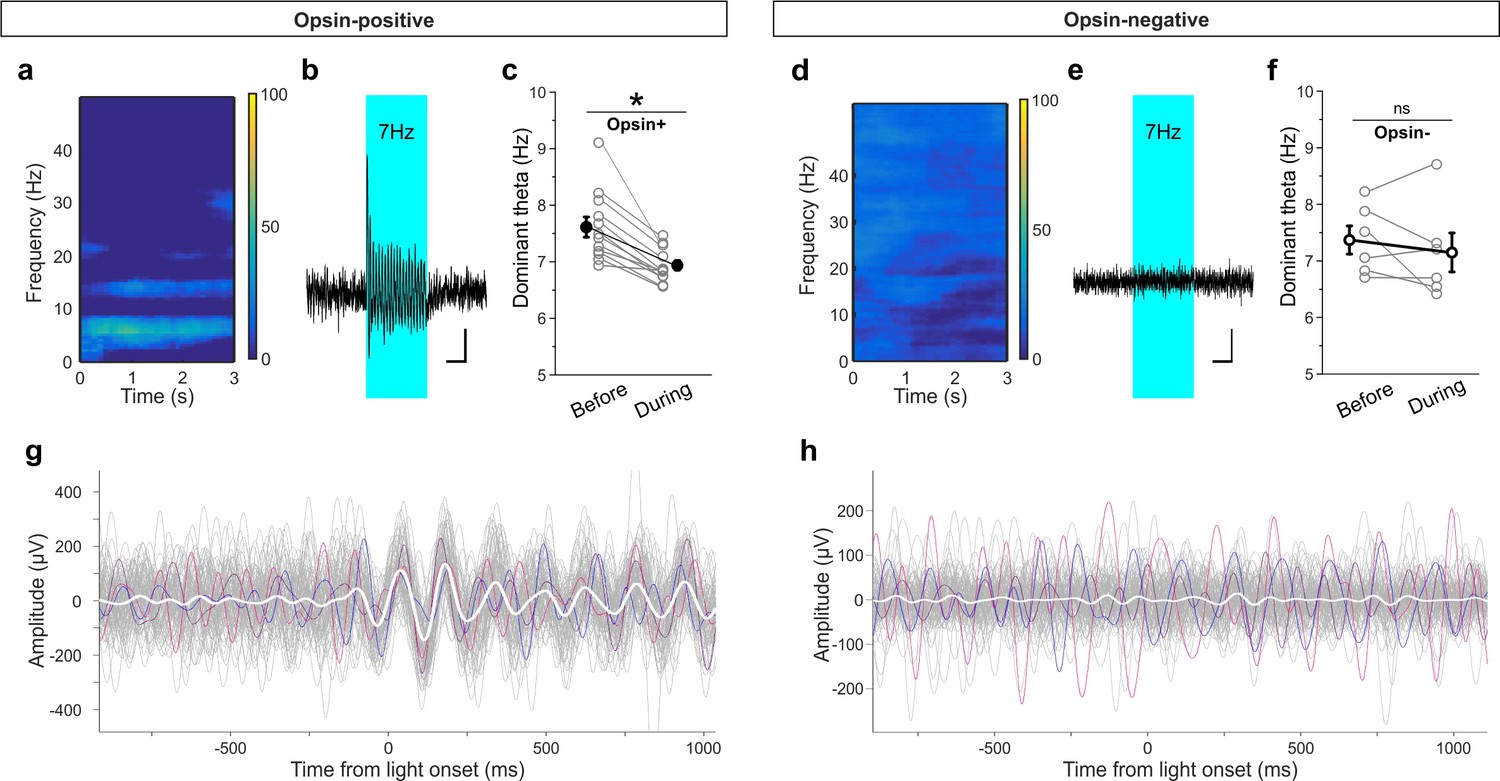
Light delivery alters hippocampal theta oscillations.
Light delivery at ~7 Hz (50 ms on, 100 ms off) for 3 s once every 30 s increases hippocampal power at and around 7 Hz in opsin-positive animals (spectrogram shows averaged percent change in hippocampal power during a period of light delivery from n = 12 opsin+ animals) (a) but not opsin-negative (d) animals (n = 6 opsin– animals). (b, e) Average unfiltered traces showing LFP response to the pulsed light in one opsin+ (b) and one opsin– (e) animal. The blue boxes indicate the period of light delivery. (c, f) Dominant frequency within the theta range is pulled towards the light delivery frequency in opsin+ (c) but not opsin– (f) animals. Gray circles show individual animals’ average dominant theta frequency during trials when the animals were in native theta states; bold circles show means across animals; error bars represent SEM. (g, h) Light delivery at ~7 Hz disrupts on-going theta oscillations (band pass filtered between 5–12 Hz) by inducing an alignment to light delivery. Example traces (gray, colored) during theta states from one example opsin+ (g) or opsin– (h) animal. White shows the averaged trace. The asterisk in panel (c) indicates p<0.01, M-W test. Scale bars (b, e) = 1 s, 25µV.
Figure 8—figure supplement 1
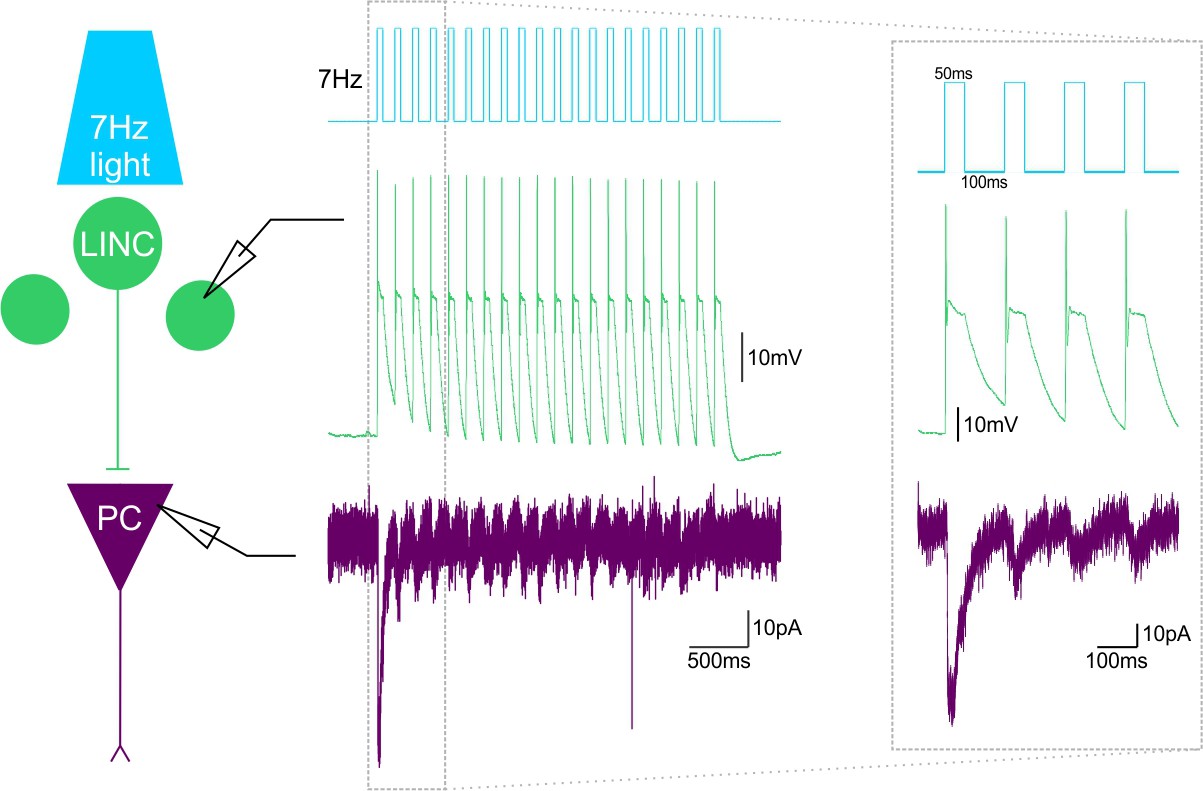
~7Hz light stimulation produces LINC firing and IPSCs in their postsynaptic targets.
Ex vivo light delivery at ~7 Hz (50 ms on, 100 ms off) for 3 s (top, blue schematic trace) (mimicking in vivo light delivery during behavioral testing), action potential firing in LINCs (middle, green trace) and IPSCs in post-synaptic cells (bottom, purple trace). Example simultaneous dual recordings from a LINC and a pyramidal cell (PC) are shown.
Figure 9 with 5 supplements
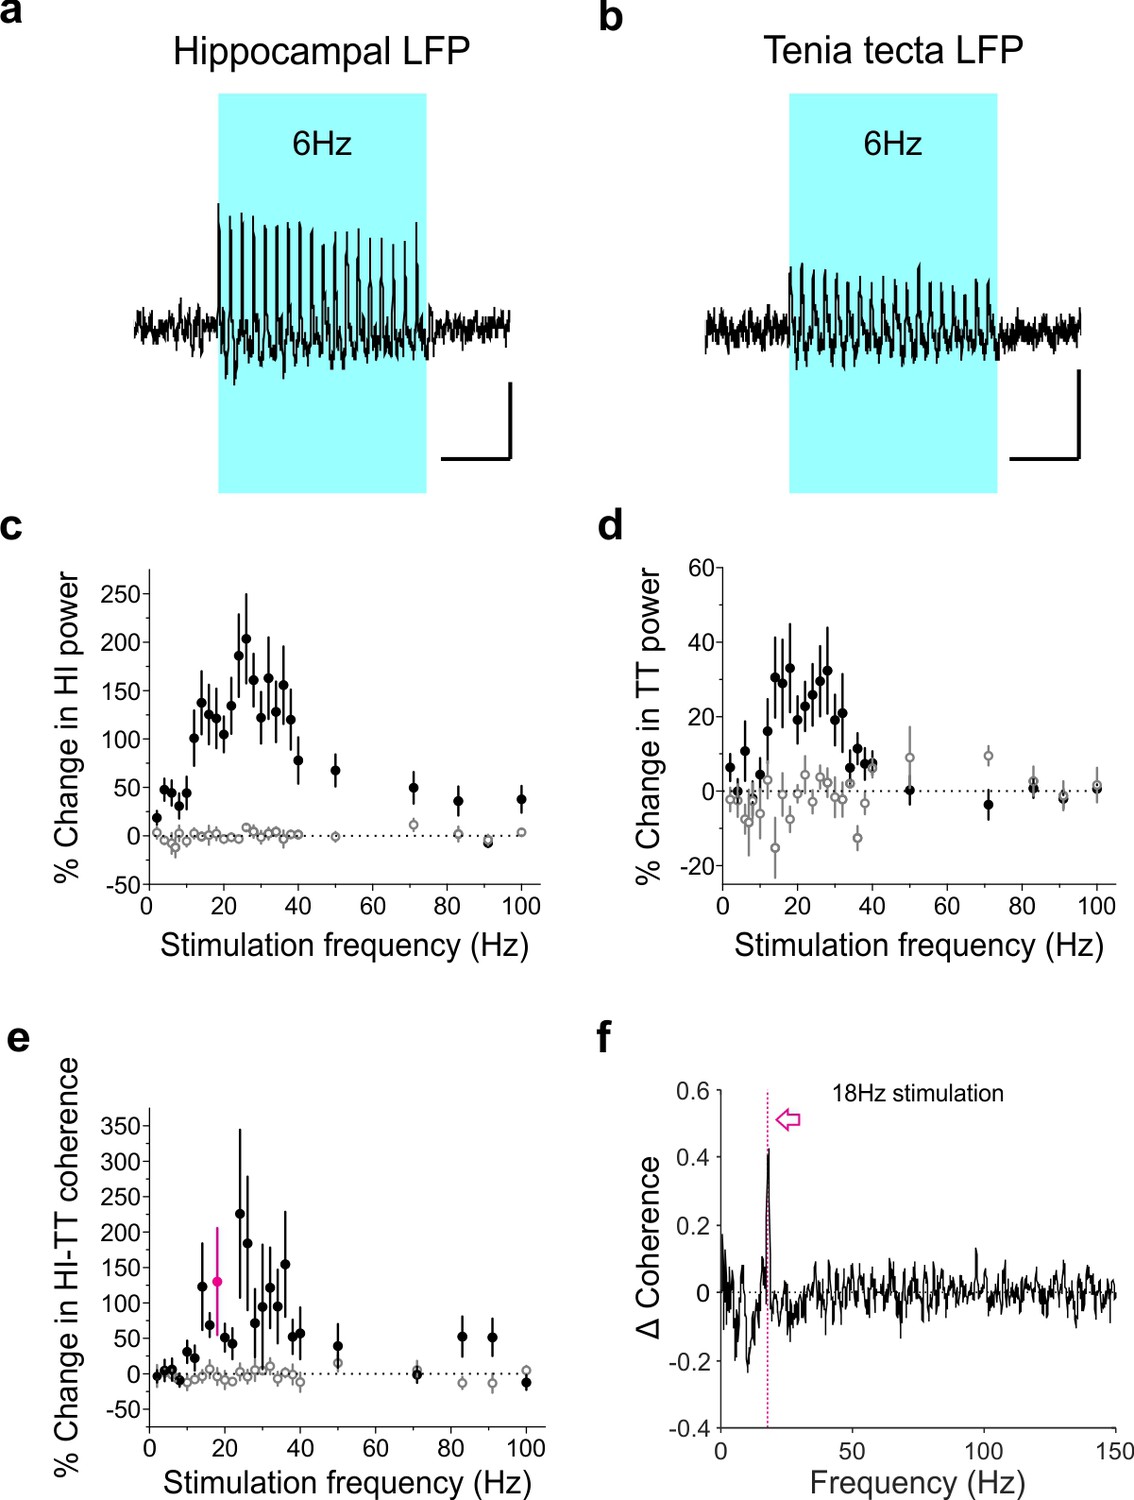
Optogenetic activation of LINCs produces a corresponding increase in hippocampal and tenia tecta power and coherence across a range of frequencies.
(a–b) Averaged hippocampal (a) and tenia tecta (b) LFP traces from one opsin+ animal receiving 6 Hz blue light stimulation (5 ms pulse duration). (c–d) Percent change in hippocampal (HI) (c) and tenia tecta (TT) (d) power at the stimulation frequency during light stimulation (opsin+: closed circles; opsin–: open circles). (e) Percent change in hippocampal-tenia tecta coherence at the stimulation frequency. (f) Change in coherence in an opsin+ animal with 18 Hz stimulation (magenta). Data for individual animals are shown in Figure 9—figure supplement 1 and average differential spectrograms for each stimulation frequency below 50 Hz are provided in Figure 9—figure supplements 2–4. Scale bars (a,b) = 1 s, 25 µV.
Figure 9—figure supplement 1
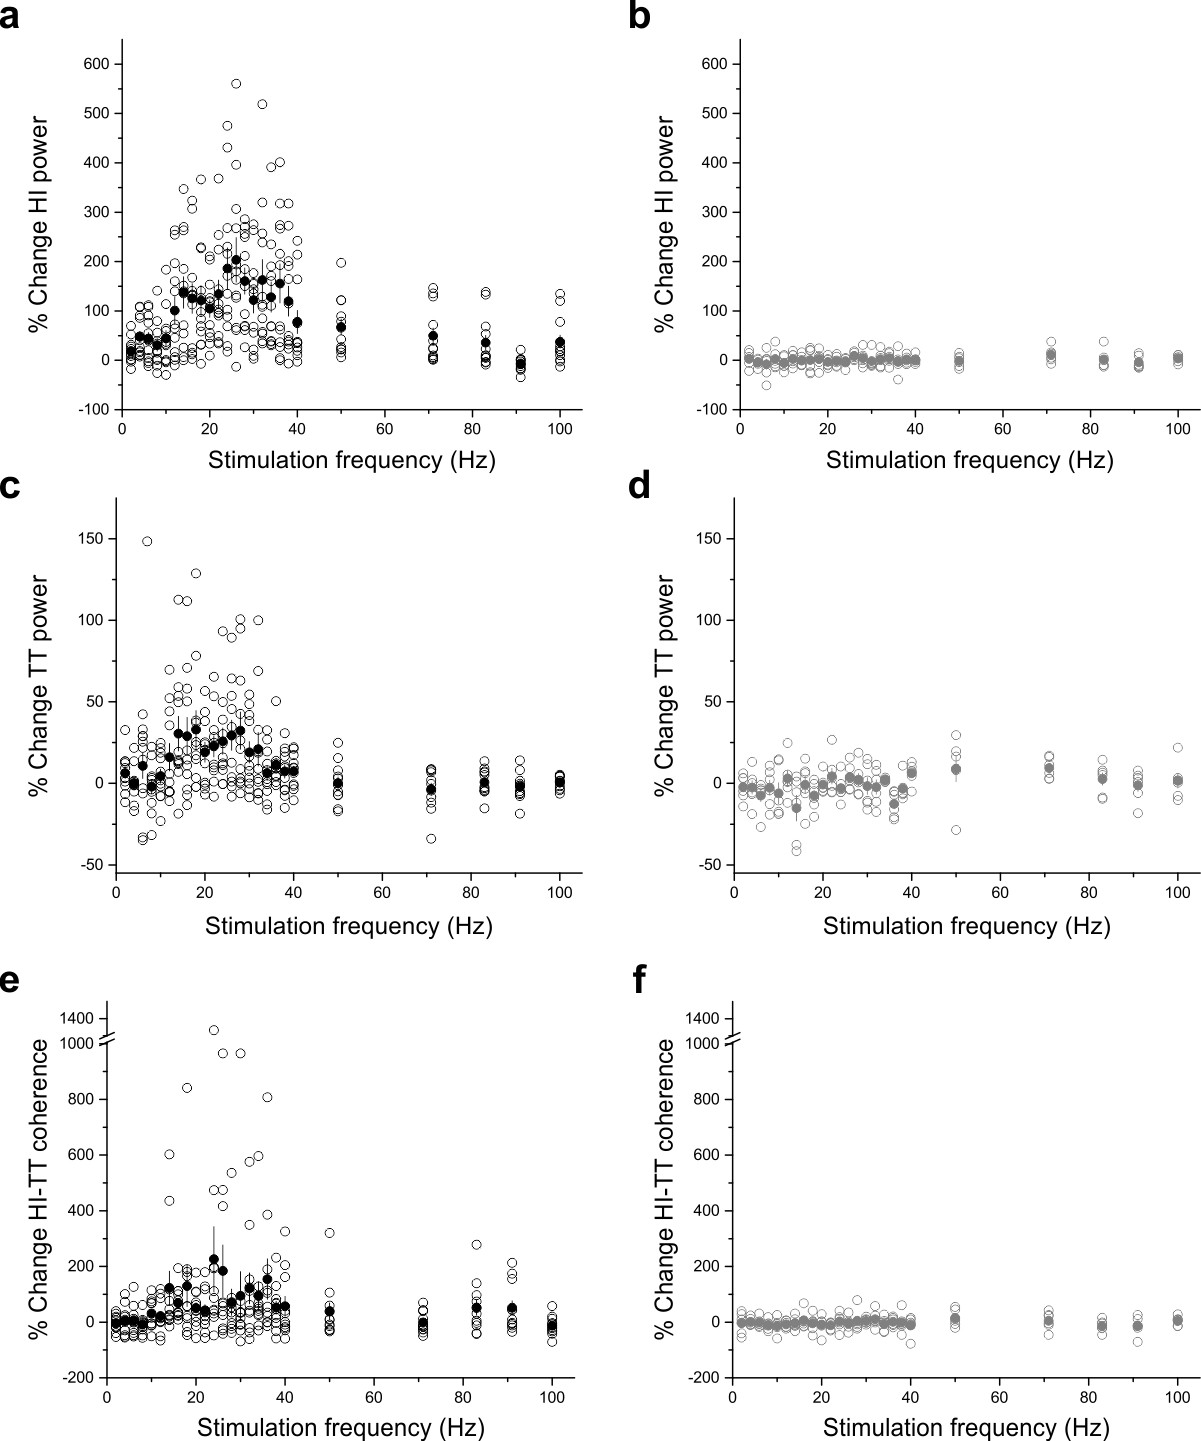
Expansion of in vivo electrophysiology, showing individual data points.
(a–b) Percent change in hippocampal (a,b) or tenia tecta (c,d) power or in hippocampal-tenia tecta coherence (e,f) when LINCs were stimulated at a variety of frequencies (5 ms pulse width) in opsin+ (a,c,e) and opsin– (b,d,f) animals. Open circles show mean data from individual animals. Closed circles show means across animals. Note y-axis changes for the different plots, and that this figure expands upon Figure 9, to show data points for individual animals.
Figure 9—figure supplement 2

Differential spectrograms showing increases in hippocampal and TT power with different stimulation frequencies (Part 1).
Average percent change in power during light delivery is shown for each stimulation frequency between 2 Hz and 18 Hz for opsin+ (left) and opsin– (right) animals in the hippocampus and tenia tecta. Stimulating LINCs in the hippocampus, at a variety of frequencies (5 ms pulses), strongly affected hippocampal power at that stimulation frequency in opsin+ animals. An increase in power at the stimulation frequency when optogenetically activating LINCs in the hippocampus was also apparent in the TT, although this increase was smaller than that seen in the hippocampus itself.
Figure 9—figure supplement 3
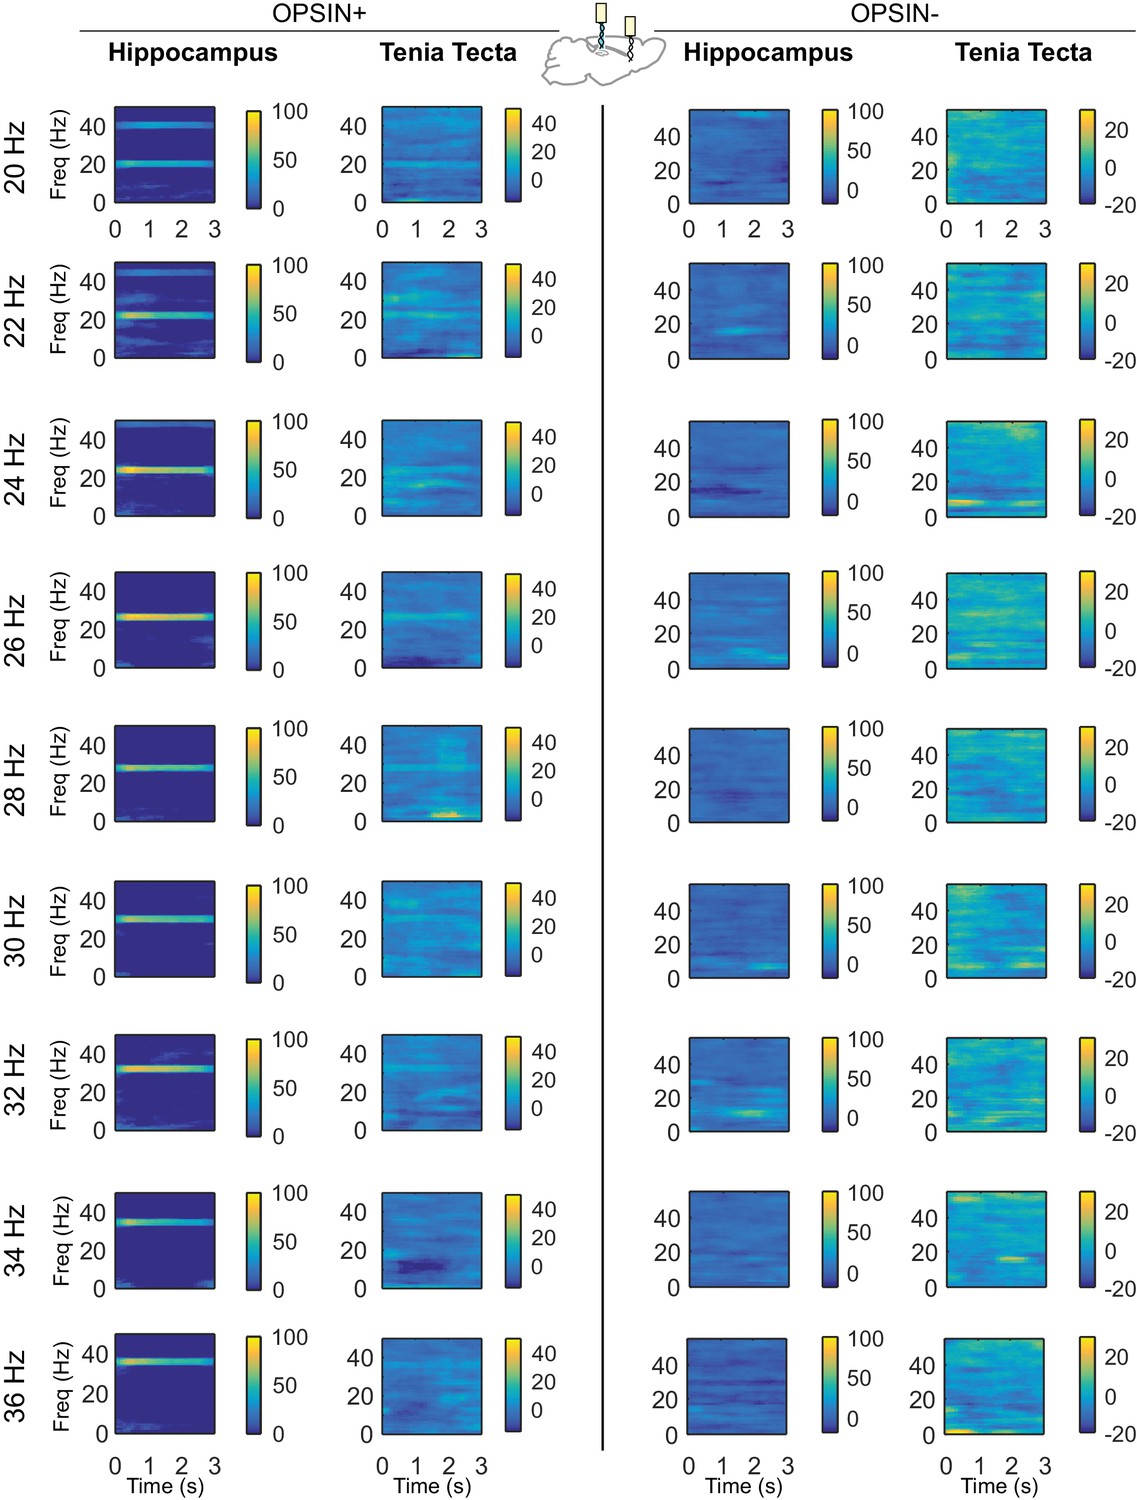
Differential spectrograms showing increases in hippocampal and TT power with different stimulation frequencies (Part 2).
Average percent change in power during light delivery is shown for each stimulation frequency between 20Hz and 36Hz for opsin+ (left) and opsin– (right) animals in the hippocampus and tenia tecta. Stimulating LINCs in the hippocampus, at a variety of frequencies (5 ms pulses), strongly affected hippocampal power at that stimulation frequency in opsin+ animals. An increase in power at the stimulation frequency when optogenetically activating LINCs in the hippocampus was also apparent in the TT, although this increase was smaller than that seen in the hippocampus itself.
Figure 9—figure supplement 4
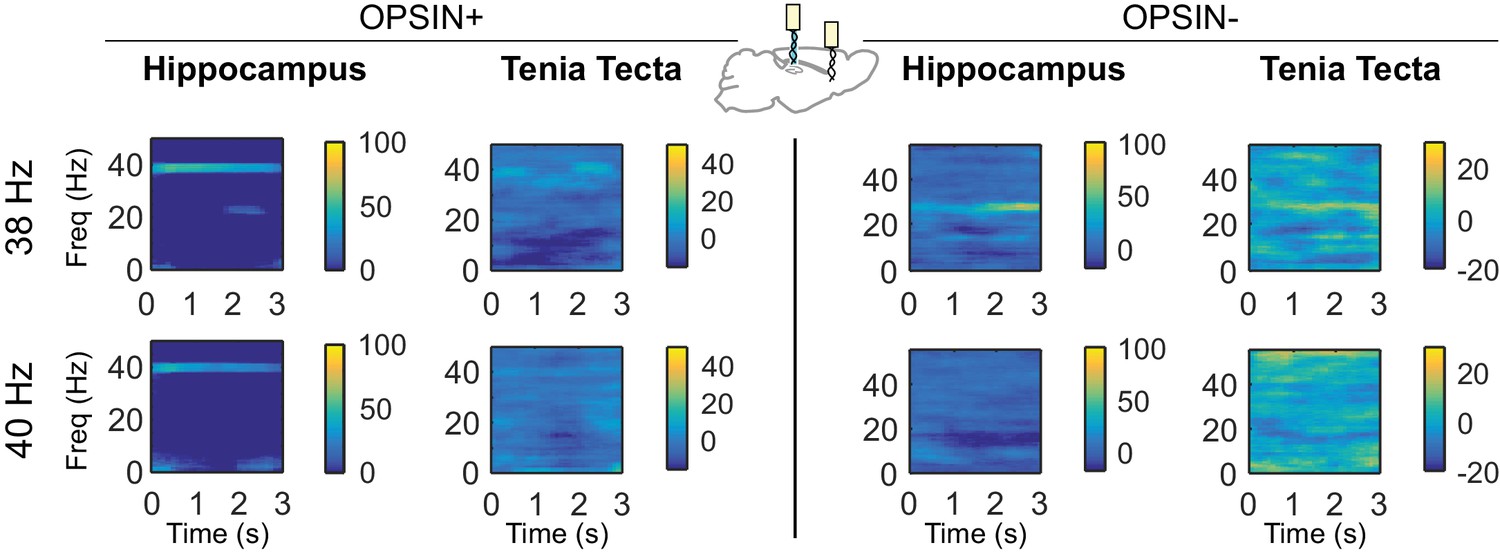
Differential spectrograms showing increases in hippocampal and TT power with different stimulation frequencies (Part 3).
Average percent change in power during light delivery is shown for each stimulation frequency between 38Hz and 40Hz for opsin+ (left) and opsin– (right) animals in the hippocampus and tenia tecta. Stimulating LINCs in the hippocampus, at a variety of frequencies (5 ms pulses), strongly affected hippocampal power at that stimulation frequency in opsin+ animals. An increase in power at the stimulation frequency when optogenetically activating LINCs in the hippocampus was also apparent in the TT, although this increase was smaller than that seen in the hippocampus itself.
Figure 9—figure supplement 5
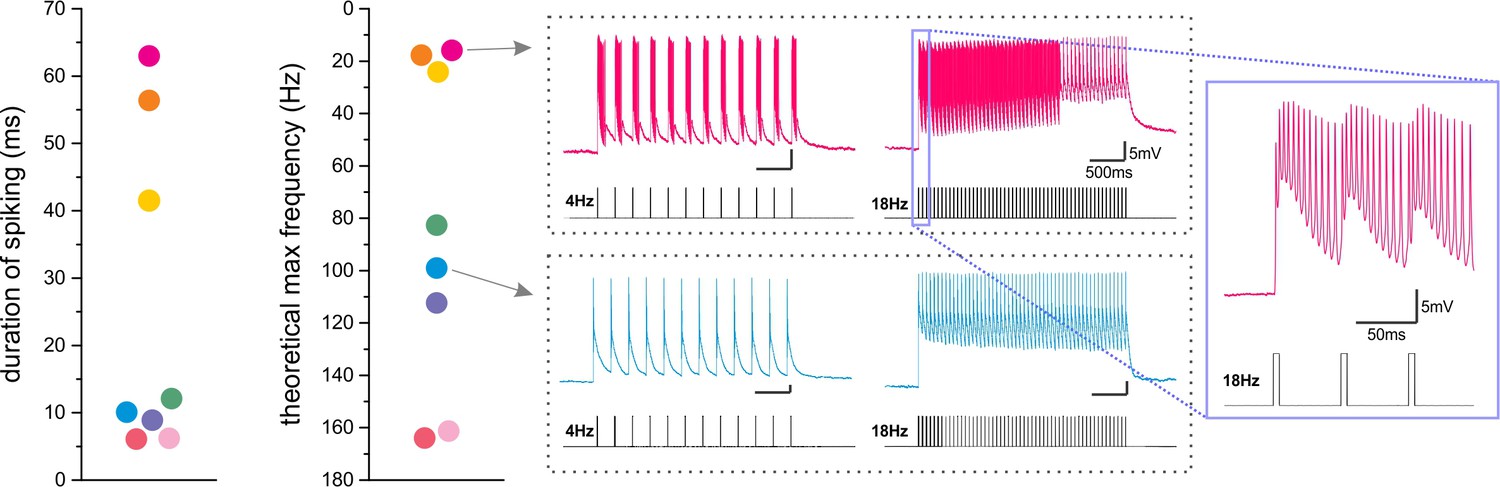
ChR2-expressing LINCs differ in their ability to follow light trains.
(a) Ex vivo, whole-cell patch-clamp electrophysiology recordings from LINCs showed that LINCs could continue to fire action potentials after the termination of a 5 ms light pulse, but that the duration of this additional firing differed between recorded cells. Each colored dot represents data from a different LINC, with color schemes maintained between panels. (b) The theoretical maximum frequency of light that it would be possible for each individual LINC to follow (i.e., with a period of not firing action potentials between each pulse of light) was defined as the inverse of the duration of spiking, and also showed dramatic differences between LINCs. This is further illustrated for two example cells: one with a long duration of firing and correspondingly low maximum following frequency (pink), and one with a short duration of firing and correspondingly relatively high maximum following frequency (blue). Note that both cells are able to follow at 4 Hz light delivery, but at 18 Hz, the cell with more extended firing (pink) has no pause between pulses (expanded window).
Tables
Table 1
Electrophysiological properties of LINCs by dendritic morphology.
https://doi.org/10.7554/eLife.46816.008| Horizontal mean ± SEM (median) | Vertical mean ± SEM (median) | p-values (corrected α = 0.0045) | |
|---|---|---|---|
| Vrest (mV) | −55.1 ± 2.5 (−52.8) | −59.7 ± 3.1 (−56.9) | 0.35 |
| Input resistance (MΩ) | 169 ± 20 (181) | 191 ± 30 (198) | 0.62 |
| Threshold voltage (mV) | −44.7 ± 0.6 (−45.0) | −44.2 ± 1.0 (−44.0) | 0.52 |
| Firing frequency near threshold (Hz) | 33 ± 11 (13) | 30 ± 8 (18) | 0.85 |
| Max firing frequency (Hz) | 149 ± 22 (160) | 78 ± 18 (55) | 0.02 |
| Adaptation ratio of the interspike interval (ISI) at max firing | 0.39 ± 0.05 (0.41) | 0.63 ± 0.05 (0.67) | 0.009 |
| Spike amplitude at threshold (mV) | 54.4 ± 2.8 (54.8) | 52.9 ± 1.5 (52.6) | 0.62 |
| Spike amplitude at max firing frequency (mV) | 39.7 ± 2.9 (38.6) | 41.3 ± 3.0 (43.6) | 0.43 |
| Action potential half width at threshold (ms) | 0.67 ± 0.10 (0.55) | 0.96 ± 0.15 (0.92) | 0.16 |
| Action potential half width at max firing frequency (ms) | 0.72 ± 0.15 (0.83) | 1.20 ± 0.19 (1.17) | 0.57 |
| Coefficient of variance of the ISI at max firing | 11.7 ± 2.6 (10.2) | 24.4 ± 3.6 (23.3) | 0.009 |
| Proportion of cells showing persistent firing | 0/9 | 2/10 | 0.16 |
-
Two-tailed Mann-Whitney tests performed with Bonferroni corrected α; χ2 test performed for comparison of proportions showing persistent firing. Note that persistent firing (Krook-Magnuson et al., 2011; Sheffield et al., 2011), also known as axonal barrage firing (Sheffield et al., 2013), is associated with a different population of nNOS-expressing CA1 interneurons (i.e., 80% of neurogliaform cells display persistent firing, whereas only ~20% of cells of other interneuron types display this phenomenon [Krook-Magnuson et al., 2011; Sheffield et al., 2013; Suzuki et al., 2014]), but is only rarely found in LINCs. Note also that despite potential subtle differences in firing pattern, LINCs show similar thresholds, input resistance, and firing frequency near threshold regardless of their dendritic morphology. Individual data points for each cell are included in Table 1—source data 1.
-
Table 1—source data 1
Source data for the electrophysiological properties of individual LINCs.
Data collected from whole cell patch clamp recordings from individual LINCs in CA1, including neuroanatomical descriptions such as dendritic morphology and cell body location, and section orientation. These data are summarized across horizontal and vertical LINCs in Table 1.
- https://doi.org/10.7554/eLife.46816.009
Additional files
-
Transparent reporting form
- https://doi.org/10.7554/eLife.46816.029
Download links
A two-part list of links to download the article, or parts of the article, in various formats.
Downloads (link to download the article as PDF)
Open citations (links to open the citations from this article in various online reference manager services)
Cite this article (links to download the citations from this article in formats compatible with various reference manager tools)
Novel long-range inhibitory nNOS-expressing hippocampal cells
eLife 8:e46816.
https://doi.org/10.7554/eLife.46816


