IFN-mediated negative feedback supports bacteria class-specific macrophage inflammatory responses
- National Institute of Allergy and Infectious Diseases, National Institutes of Health, United States
- National Institutes of Health, United States
Figures
Figure 1 with 2 supplements
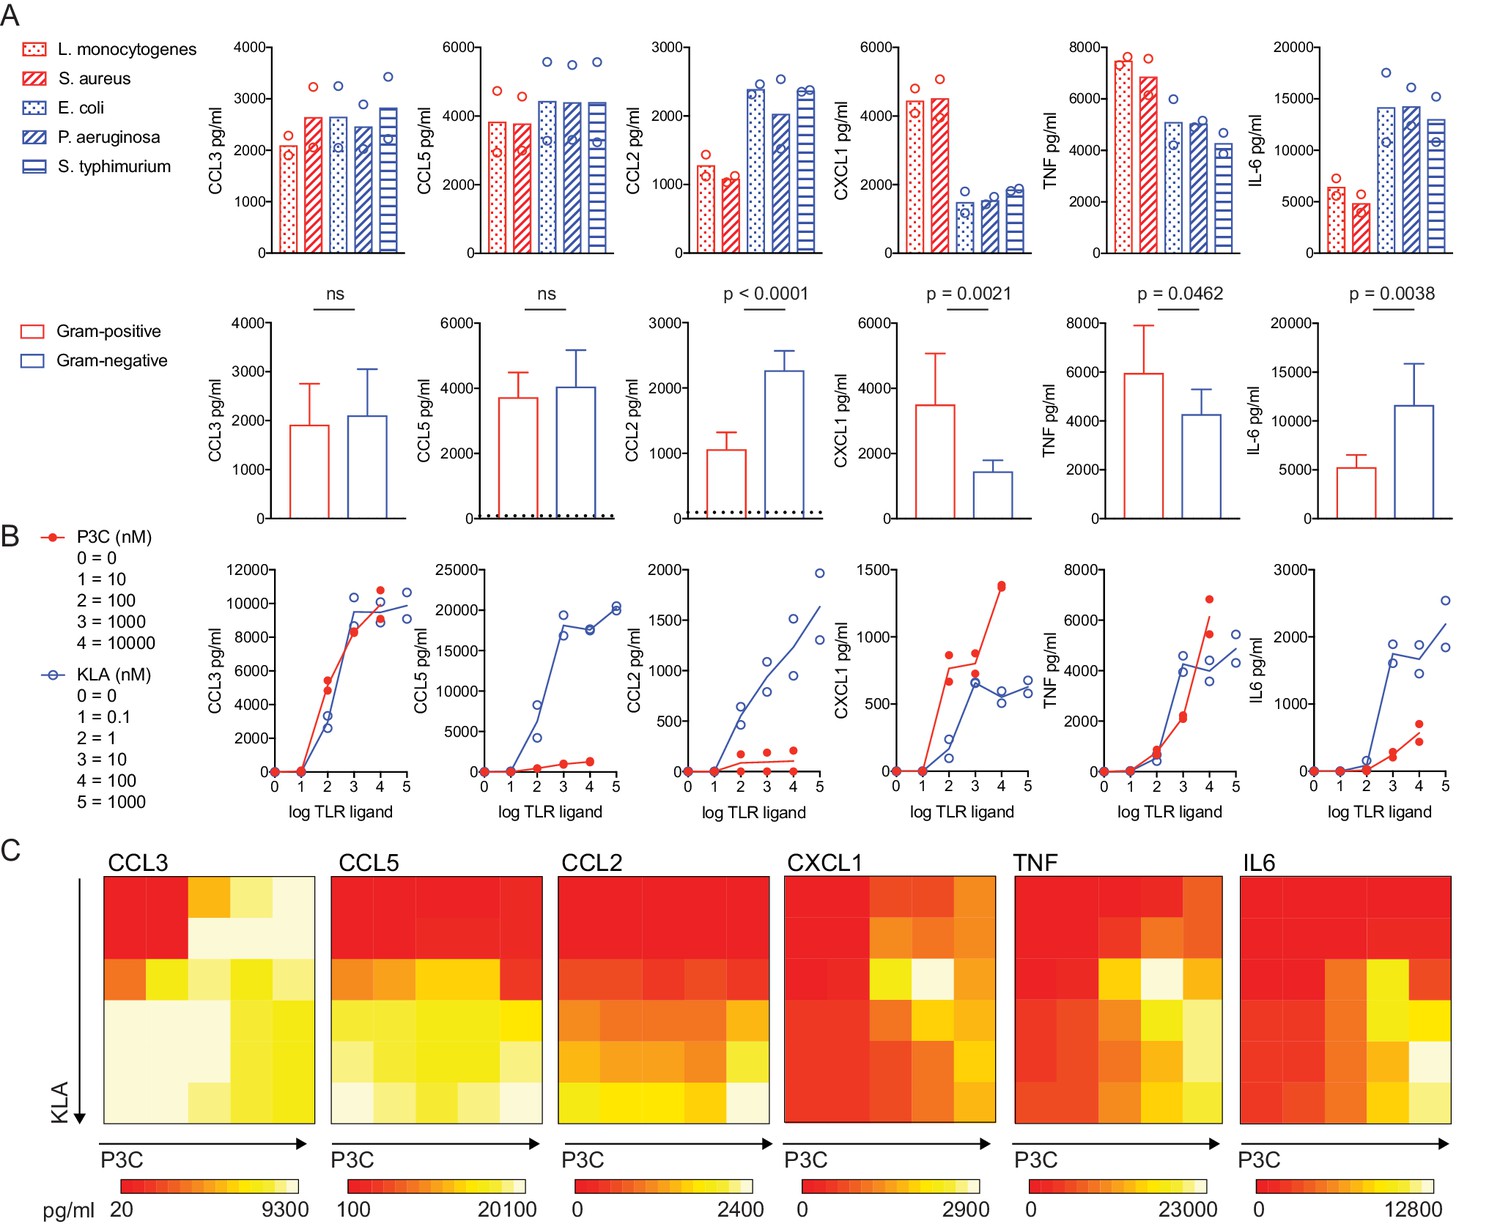
TLR pathway non-additivity supports context-specific inflammatory responses.
BMDM were stimulated with heat-killed bacteria at an MOI of 100 (Red = Gram-positive: L. monocytogenes or S. aureus; Blue = Gram-negative: E. coli, P. aeruginosa, or S. Typhimurium) or soluble TLR ligand (P3C = TLR2 ligand Pam3CKS4; KLA = TLR4 ligand KDO2-LipidA), as indicated. After 12 hr (A) or 6 hr (B, C) supernatants were collected and cytokines were quantified using cytometric bead array. Data points represent independent experiments. (A) Data from bacterial species (upper row) were combined from three independent experiments to show the distinct effects of Gram-positive and Gram-negative bacteria on inflammatory cytokine production in BMDM (lower row); statistical significance based on unpaired t-tests, between Gram-negative- and Gram-positive-stimulated samples. Dotted lines in the lower row represent the mean values for unstimulated BMDM (0–12 hr). In some cases, these controls are not visible because they are below the level of detection (a zero value). Ligand concentrations in (C) correspond to single ligand concentrations shown in (B), in pairwise combinations. Data are representative of three independent experiments.
Figure 1—figure supplement 1

TLR2 and TLR4 ligation by heat-killed bacteria.
HEK293 cells stably expressing either TLR2 or TLR4 were stimulated with the indicated heat-killed bacteria for 20 hr. Supernatants were analyzed by ELISA and IL-8 production was used as a readout of TLR ligation and downstream function. IL-8 was not detected in unstimulated HEK293. Data are pooled from two independent experiments.
Figure 1—figure supplement 2
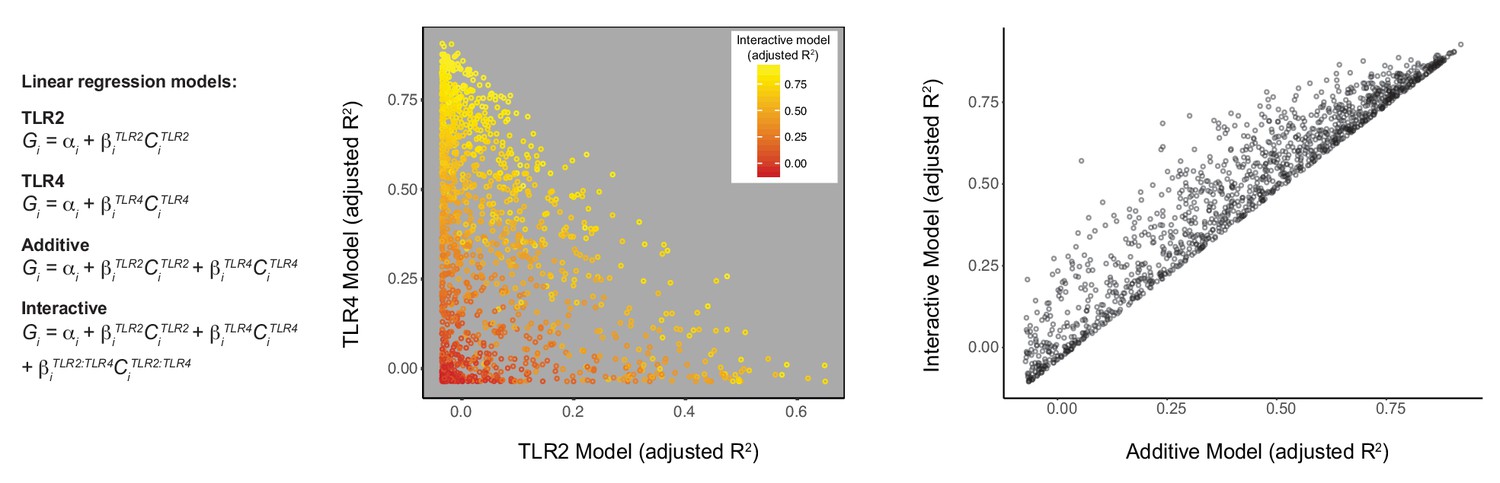
Linear regression analysis highlights non-additive TLR pathway interactions.
Using the titration matrix conditions shown in Figure 1, BMDM were stimulated for 2 hr, induced gene expression was measured by microarray, and linear regression analysis was performed for each gene across the 30-condition dataset. Points represent individual gene probes induced above 1.5-fold in at least three conditions.
Figure 2 with 1 supplement
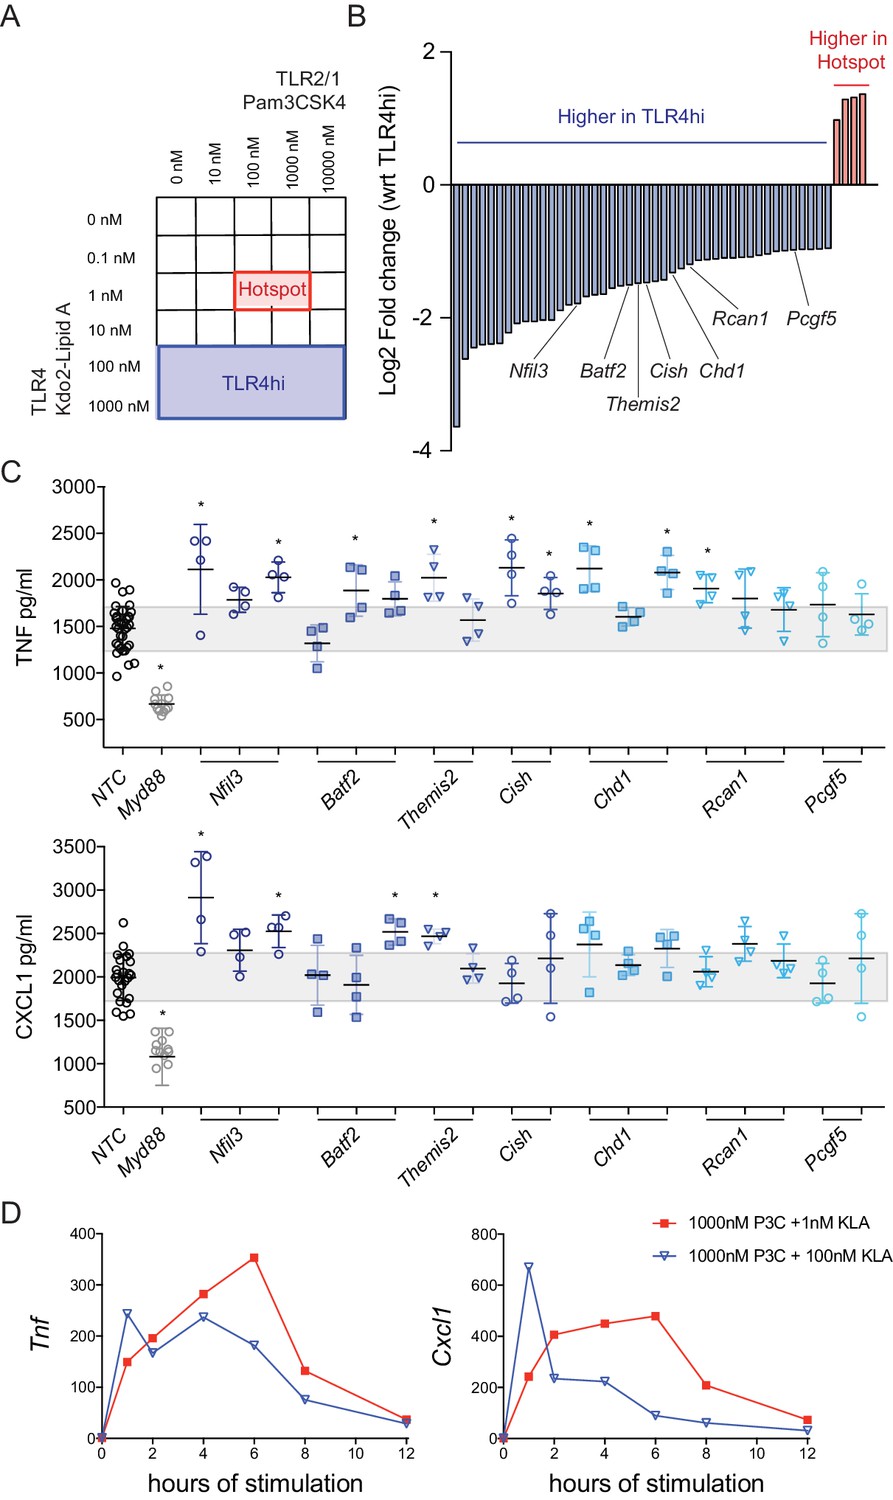
Regulator genes are induced above a threshold of TLR4 ligand.
(A, B) Using the titration matrix conditions shown in Figure 1, BMDM were stimulated for 2 hr and induced gene expression was measured by microarray. Differential gene expression analysis was performed between the hotspot and TLR4 high regions of the dual ligand titration matrix. Candidate regulator genes preferentially induced by high TLR4 ligand are noted (B). (C) BMDM were treated with three independent siRNA per candidate regulator (siRNA resulting in less than 50% viability were excluded), MyD88 siRNA, or non-targeting control (NTC) siRNA for 48 hr prior to stimulation with 1000 nM P3C and 100 nM KLA (TLR4hi condition). After 6 hr of stimulation, TNF or CXCL1 was quantified in supernatants by ELISA and values were normalized based on cell viability. Individual data points represent wells treated independently with siRNA and TLR ligand, and the gray bar depicts NTC standard deviation. Candidate genes were differentially expressed in three independent microarray or qPCR experiments and siRNA results are representative of two independent experiments. Stars represent statistical significance based on ordinary one-way ANOVA, versus control (*p≤0.05). (D) BMDM were stimulated with the indicated concentrations of TLR ligand and harvested at the indicated time. Gene expression was quantified using qPCR and fold change was calculated compared to unstimulated BMDM. Data are representative of three independent experiments.
-
Figure 2—source data 1
Microarray data for titration matrix.
Using the titration matrix conditions shown in Figure 1, BMDM were stimulated for 2 hr and gene expression was measured by microarray. Data are show as log2 fold change compared to unstimulated.
- https://doi.org/10.7554/eLife.46836.007
Figure 2—figure supplement 1
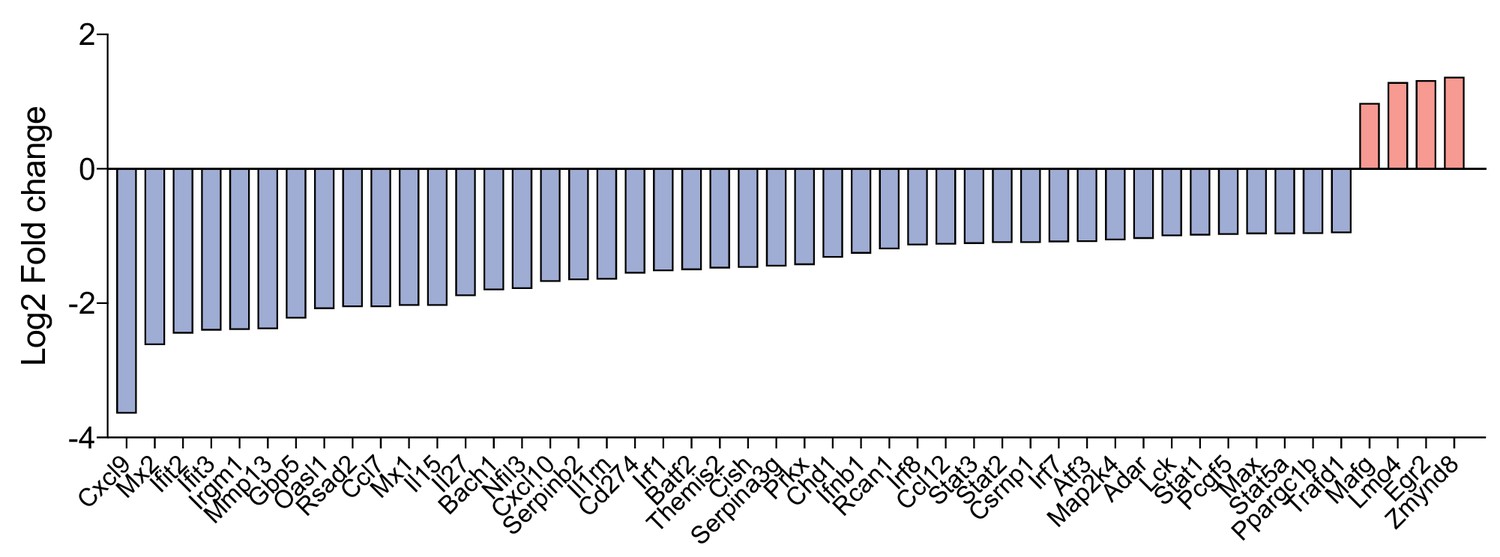
Genes induced above a threshold of TLR4 activation.
Microarray data from Figure 2B are expanded so as to show the identities of the TLR4-driven genes (blue) as well as those associated with the titration matrix ‘hotspot’ (red).
Figure 3 with 2 supplements
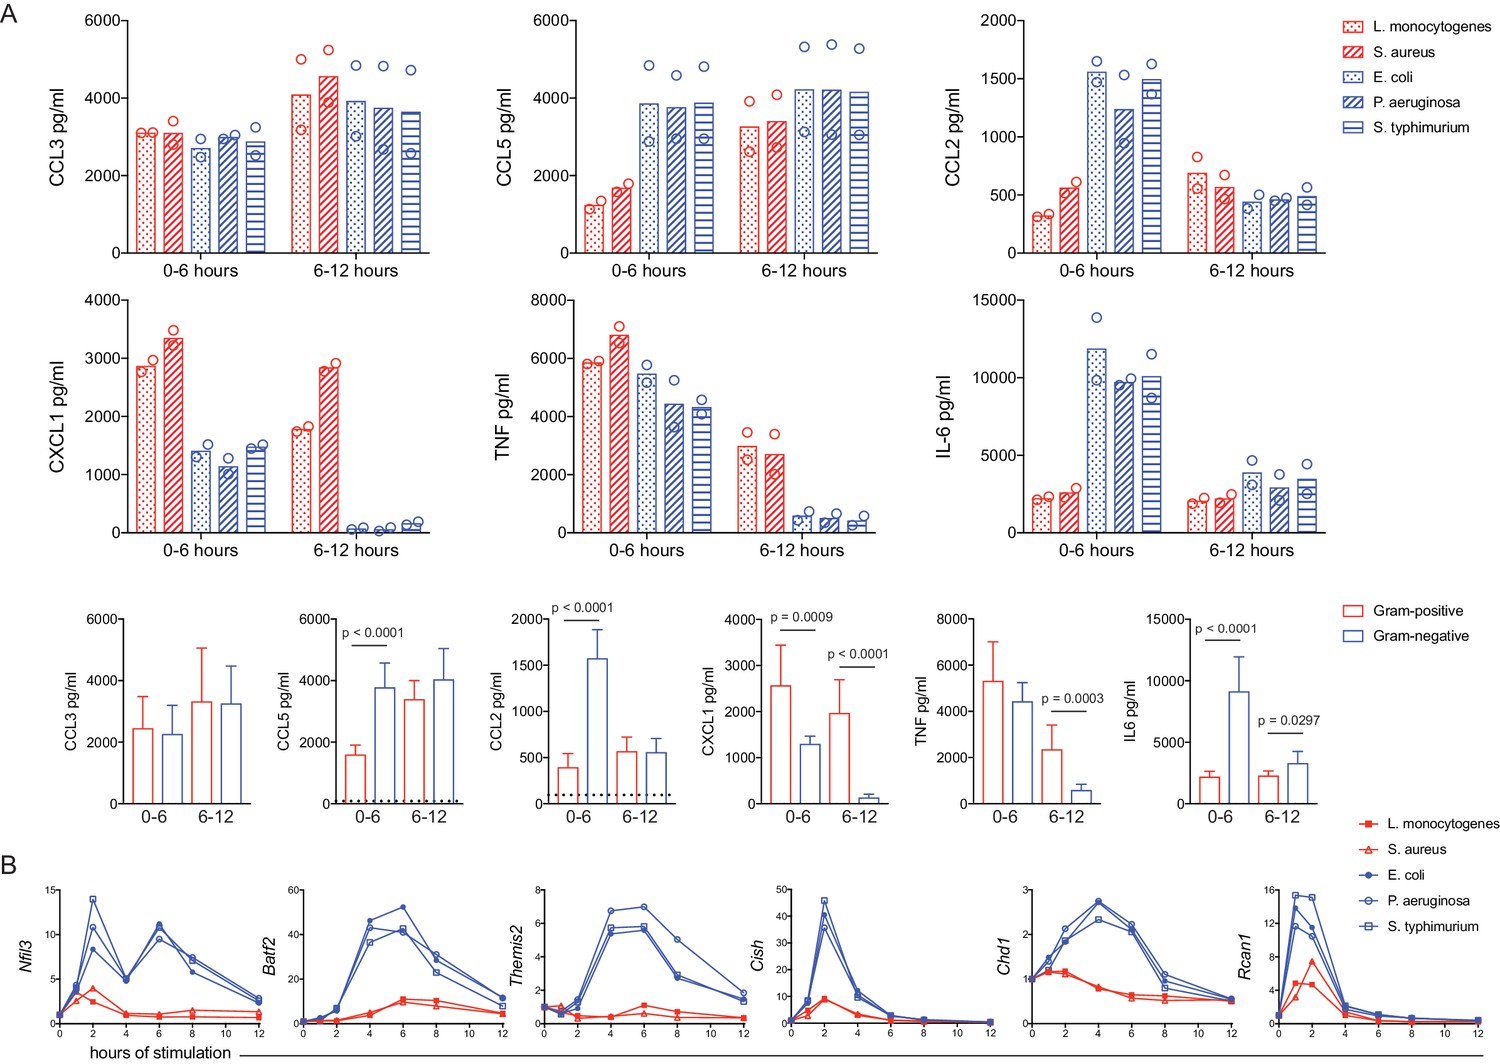
A dual TLR titration matrix predicts bacteria-specific cytokine shutdown and regulator induction.
BMDM were stimulated with heat-killed bacteria. (A) After 6 hr of stimulation, supernatants were removed (0–6 hr) and replaced with fresh medium for a subsequent 6 hr of stimulation (6–12 hr). Cytokines were quantified using cytometric bead array and data points are experimental replicates. Data from bacterial species (upper rows) were combined from three independent experiments (lower row) and statistical significance was determined using unpaired t-tests between Gram-negative- and Gram-positive-stimulated samples; where no p-value is indicated, results were not significant. Dotted lines in the lower row represent the mean values for unstimulated BMDM (0–12 hr). In some cases, these controls are not visible because they are below the level of detection (a zero value). (B) Cells were harvested at the indicated time, gene expression was quantified using qPCR, and fold change was calculated compared to unstimulated BMDM. Results are representative of four or more independent experiments.
Figure 3—figure supplement 1
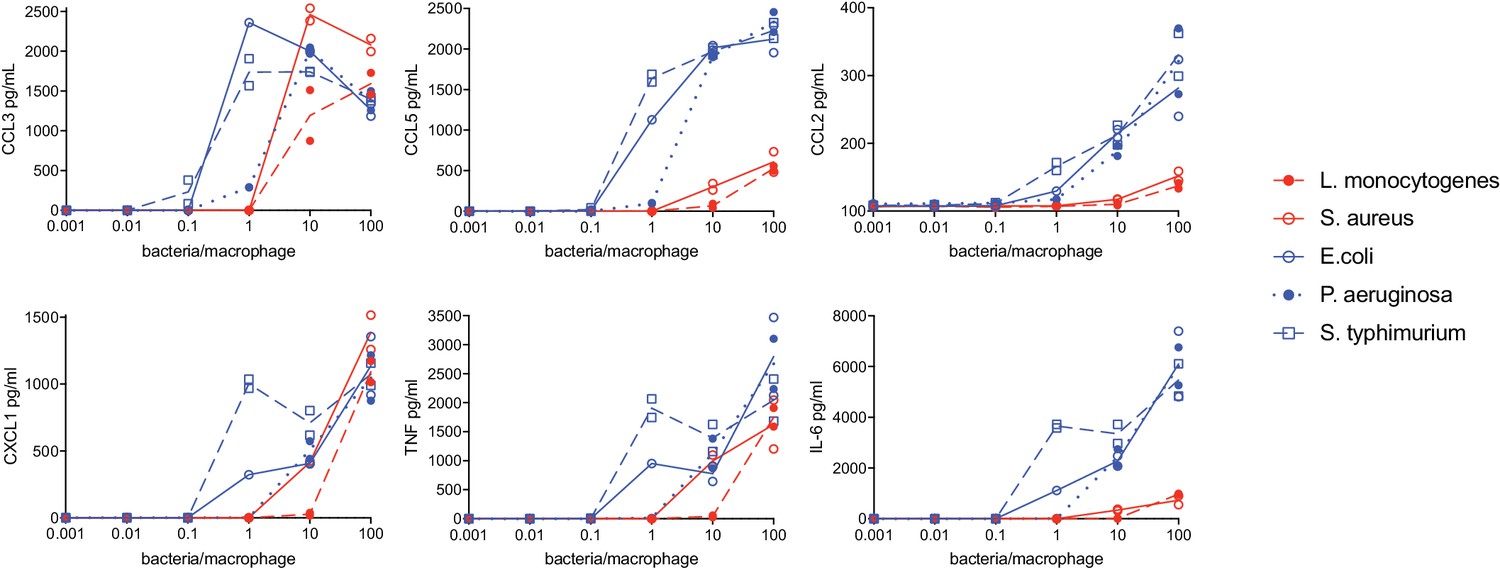
Macrophage cytokine secretion in response to varying concentrations of heat-killed bacteria.
BMDM were stimulated with heat-killed bacteria. After 6 hr of stimulation, supernatants were collected and cytokines were quantified using cytometric bead array. Data points represent replicate wells.
Figure 3—figure supplement 2
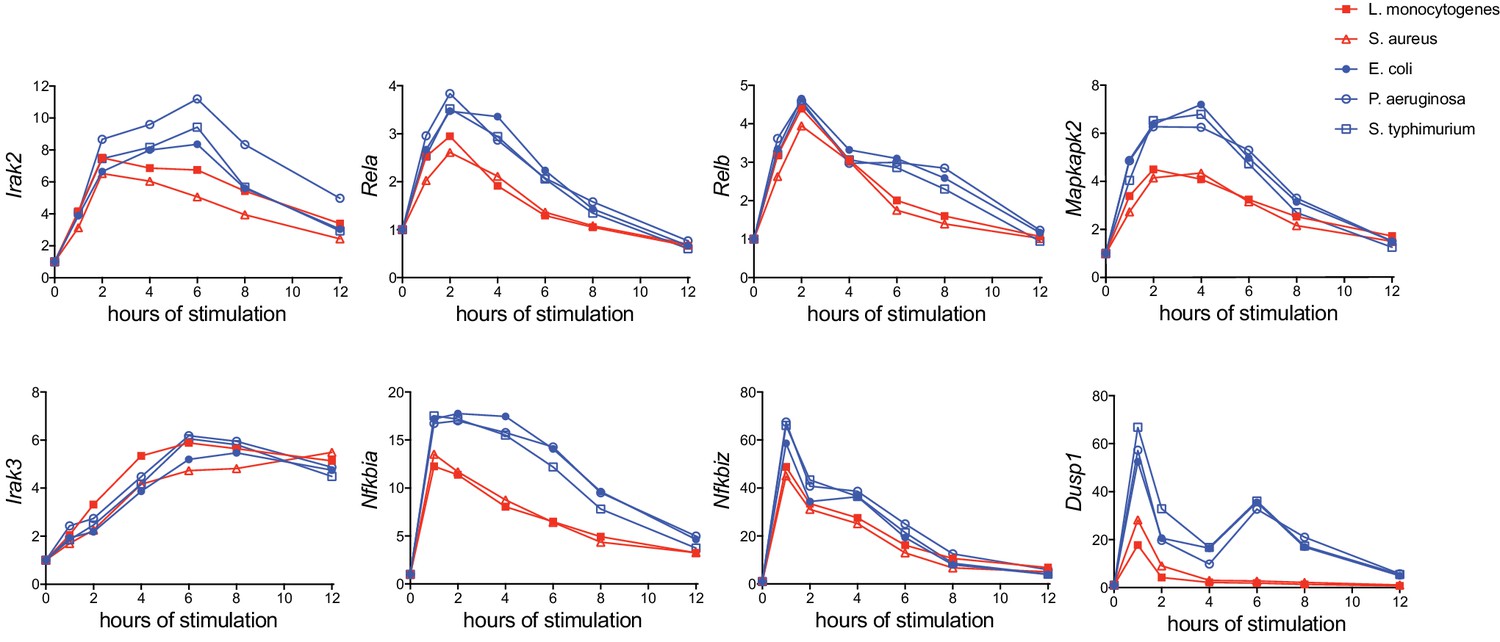
Known negative regulators of inflammatory signaling are more highly induced by Gram-negative pathogens.
Cell were stimulated as in Figure 3 and mRNA transcripts of known immune regulators that were not identified in our microarray were measured by qPCR. Gene expression was quantified based on fold-change compared to unstimulated BMDM. Results are representative of two independent experiments.
Figure 4
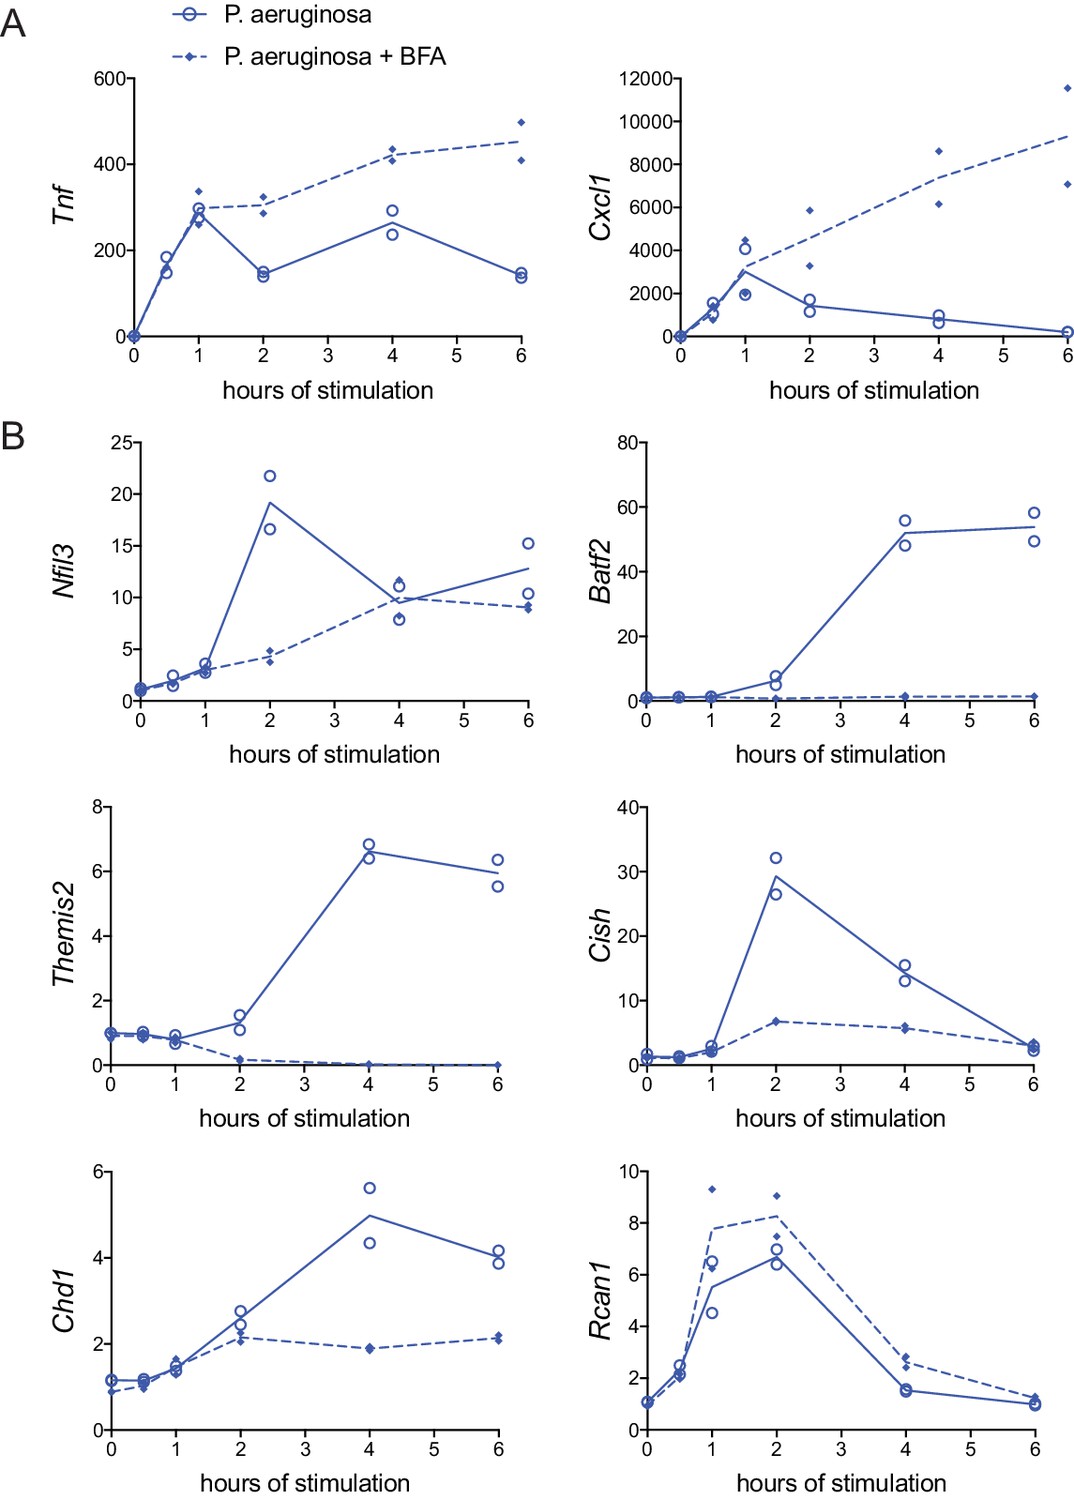
Rapid Gram-negative-driven inflammatory response decay and regulator induction are dependent on cytokine feedback.
BMDM were stimulated with heat-killed P. aeruginosa with or without protein transport inhibitor brefeldin A (BFA). Inflammatory cytokine genes (A) and candidate regulator genes (B) were quantified by qPCR and fold change was calculated compared to unstimulated BMDM. Data shown are from two independent experiments.
Figure 5
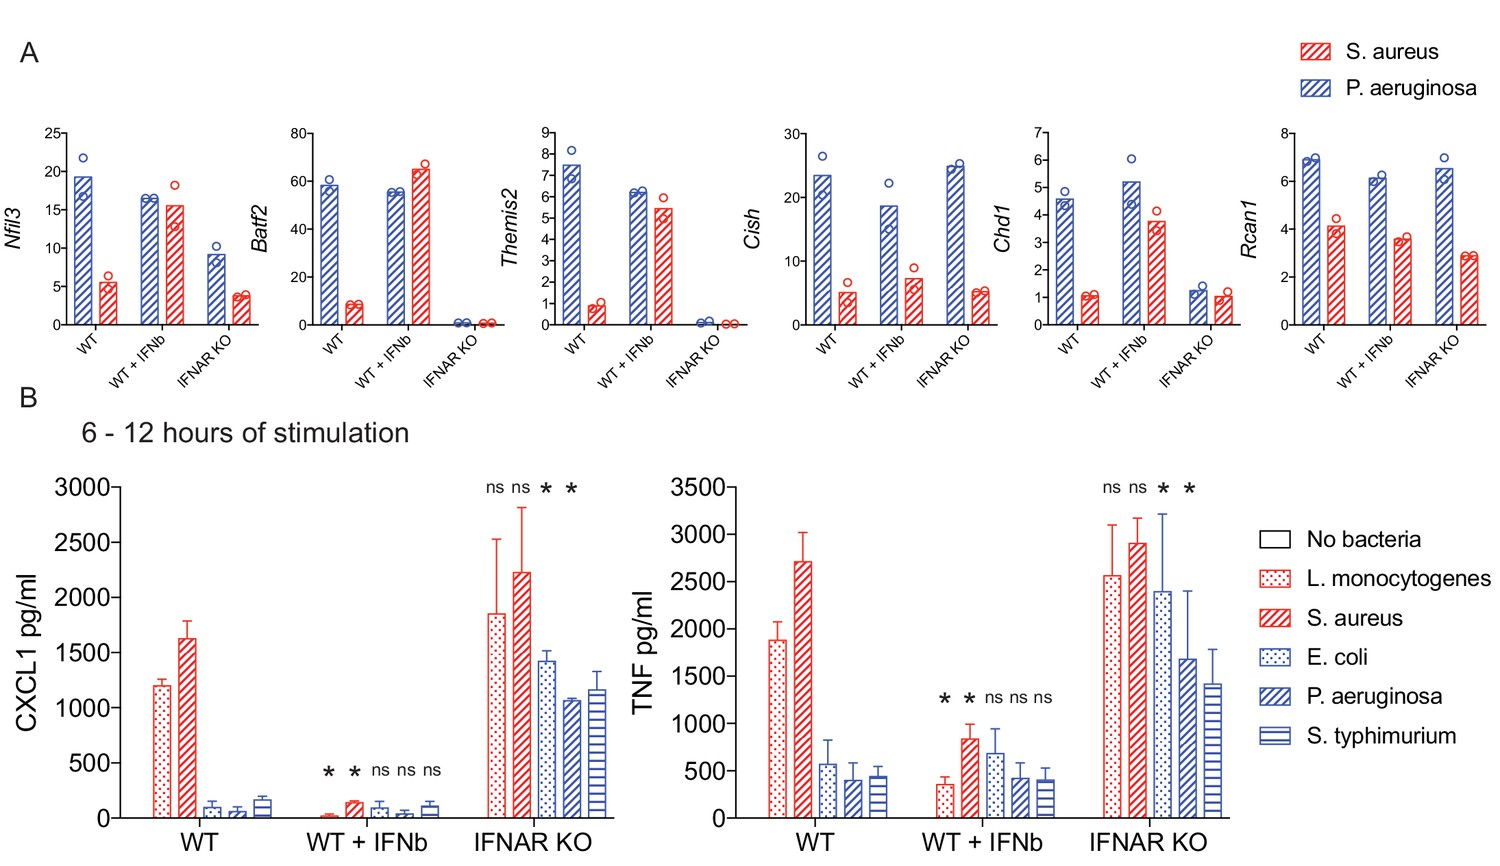
IFN-mediated negative feedback supports bacteria class-specific responses.
WT or IFNAR KO BMDM were stimulated with heat-killed bacteria, with the addition of IFN-β after one hour of stimulation, where indicated. (A) Induced gene expression was measured by qPCR and fold change was calculated compared to unstimulated BMDM. Data are shown for the timepoint of maximum WT expression over a 6 hr time course: 2 hr Nfil3, 4 hr Batf2, 4 hr Themis2, 2 hr Cish, 4 hr Chd1, and 2 hr Rcan1. Data shown are from two independent experiments. (B) After 6 hr of stimulation, supernatants were removed and replaced with fresh medium for a subsequent 6 hr of stimulation. The 6–12 hr supernatants were analyzed by cytometric bead array. Cytokine data are pooled from four independent experiments (n = 4, n = 3, and n = 3 for WT, WT + IFN-β, and IFNAR KO, respectively). Stars represent statistical significance based on ordinary two-way ANOVA, comparing WT + IFN-β or IFNAR KO treatment groups to WT for each respective bacterial stimulation (*p≤0.05).
Figure 6 with 4 supplements
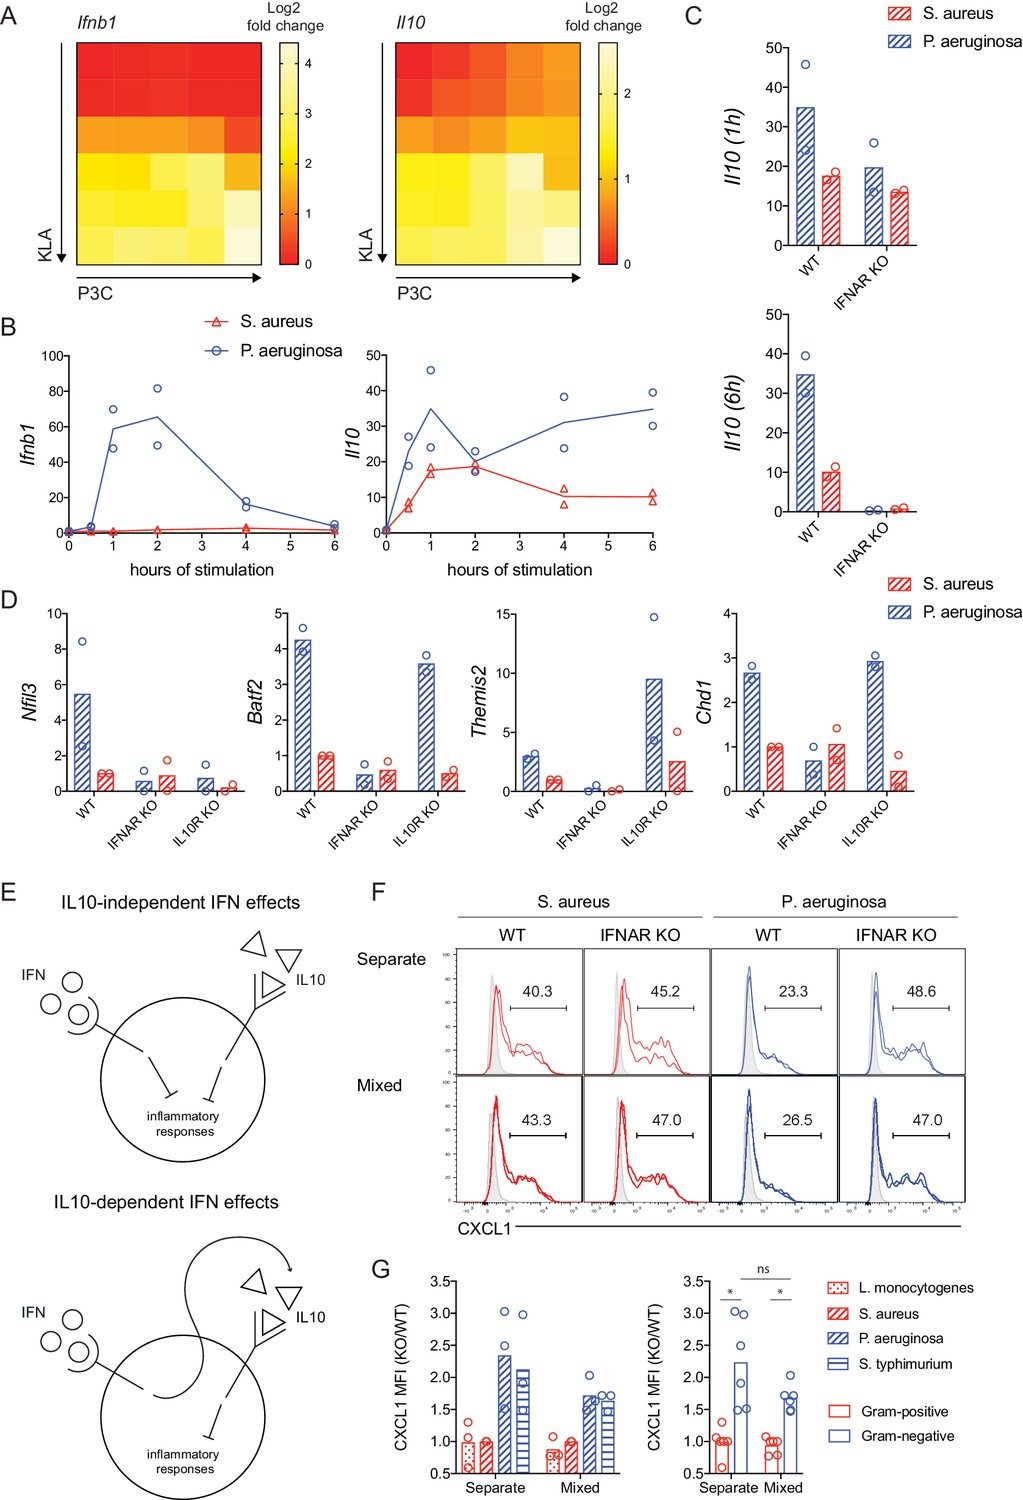
IFN regulates inflammatory responses independent of IL-10 production.
(A) TLR-induced expression of Ifnb1 and Il10 at 2 hr, analyzed from microarray data described in Figure 1. (B–D) WT, IFNAR KO, or IL10R KO BMDM were stimulated with heat-killed S. aureus or P. aeruginosa, gene expression was measured by qPCR, and fold change was calculated compared to unstimulated BMDM. Data shown represent experimental replicates. In D, the time of maximum expression is plotted (2 hr Nfil3, 4 hr Batf2, 4 hr Themis2, and 4 hr Chd1) and the experimental replicates were normalized with respect to WT S. aureus. (E) Models of IFN and IL10 mediated anti-inflammatory function. (F, G). WT (CD45.1+) and IFNAR KO (CD45.1-) BMDM were stimulated with the indicated heat-killed bacteria, separately or in mixed BMDM cultures (1:1 of WT:KO). BFA was added for the final 3 hr of an 8 hr stimulation. (F) Representative flow cytometry histograms from replicate wells are shown with average frequencies. Shaded histograms represent unstimulated BMDM of the indicated genotype and culture type. (G) CXCL1 quantification as a KO/WT ratio was normalized to WT cells stimulated with S. aureus and pooled from three independent experiments. The same data are shown for individual bacterial species or pooled between bacterial class, with stars representing statistical significance based on ordinary one-way ANOVA (*p≤0.05).
Figure 6—figure supplement 1
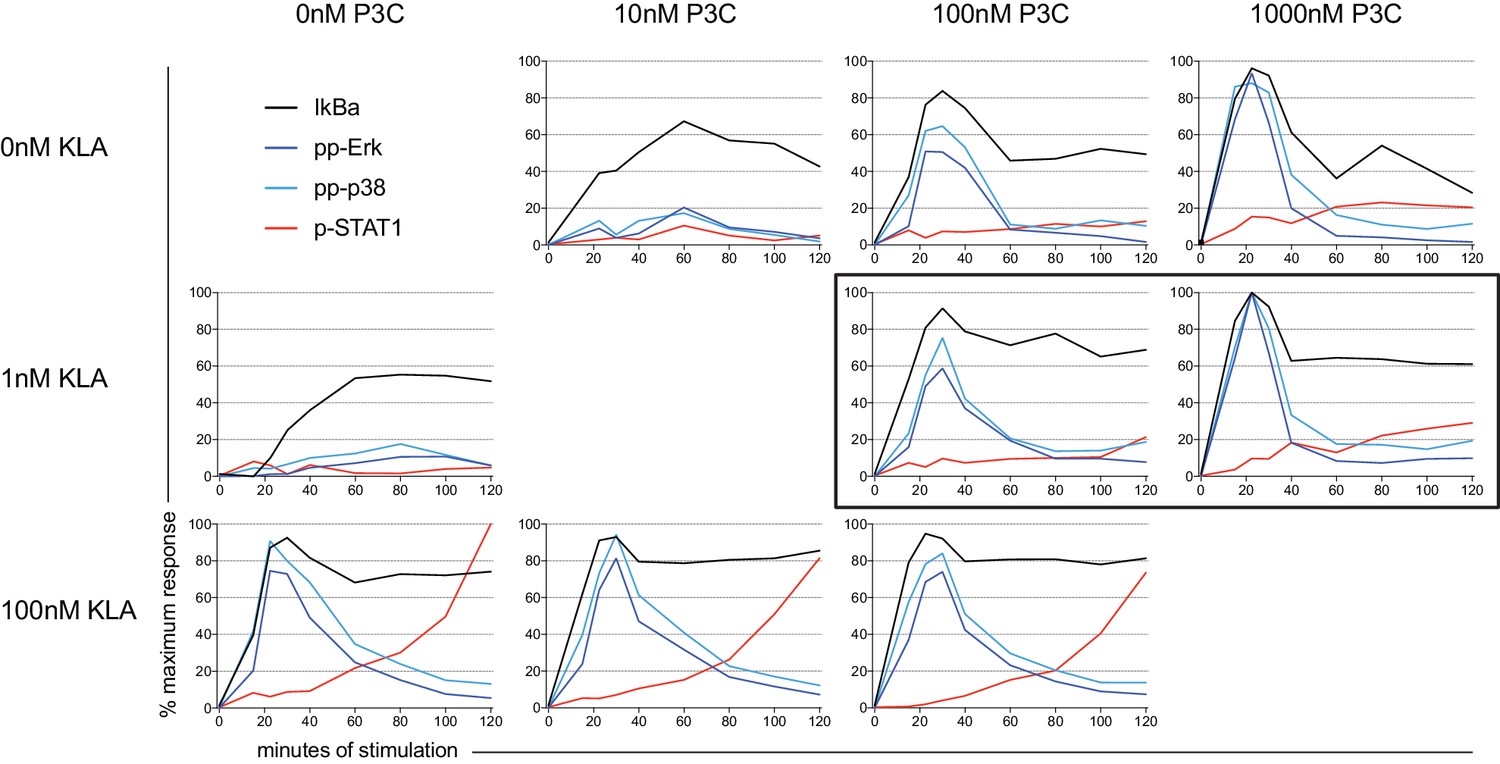
Signaling kinetics of dual-ligand stimulation.
BMDM were stimulated with varying concentrations of KLA and P3C. Phospho-flow showing phosphorylation of Erk, p38, and STAT1, or degradation of IkBα. STAT1 phosphorylation is only seen at high KLA concentrations (lower panels), while other molecules are activated by multiple doses of KLA and/or P3C. Hotspot conditions are highlighted by the black rectangle. Data shown as % of maximum response.
Figure 6—figure supplement 2
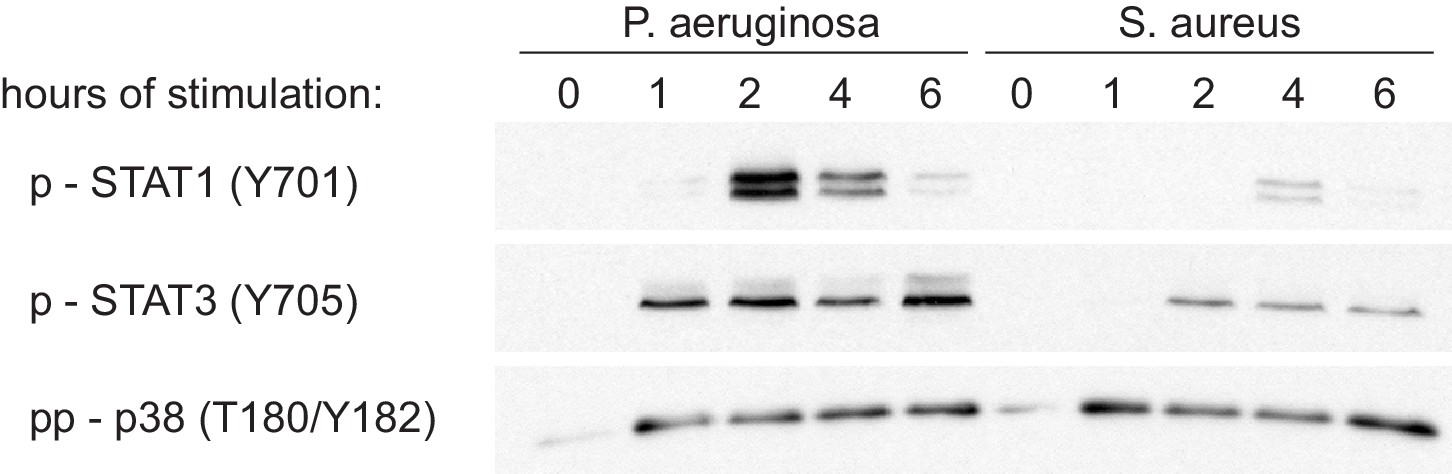
STAT activation upon stimulation with heat-killed bacteria.
Western blots show strong phosphorylation of STAT1 and STAT3 upon stimulation with P. aeruginosa but not S. aureus, especially at early timepoints. Blots are representative of three experiments.
Figure 6—figure supplement 3
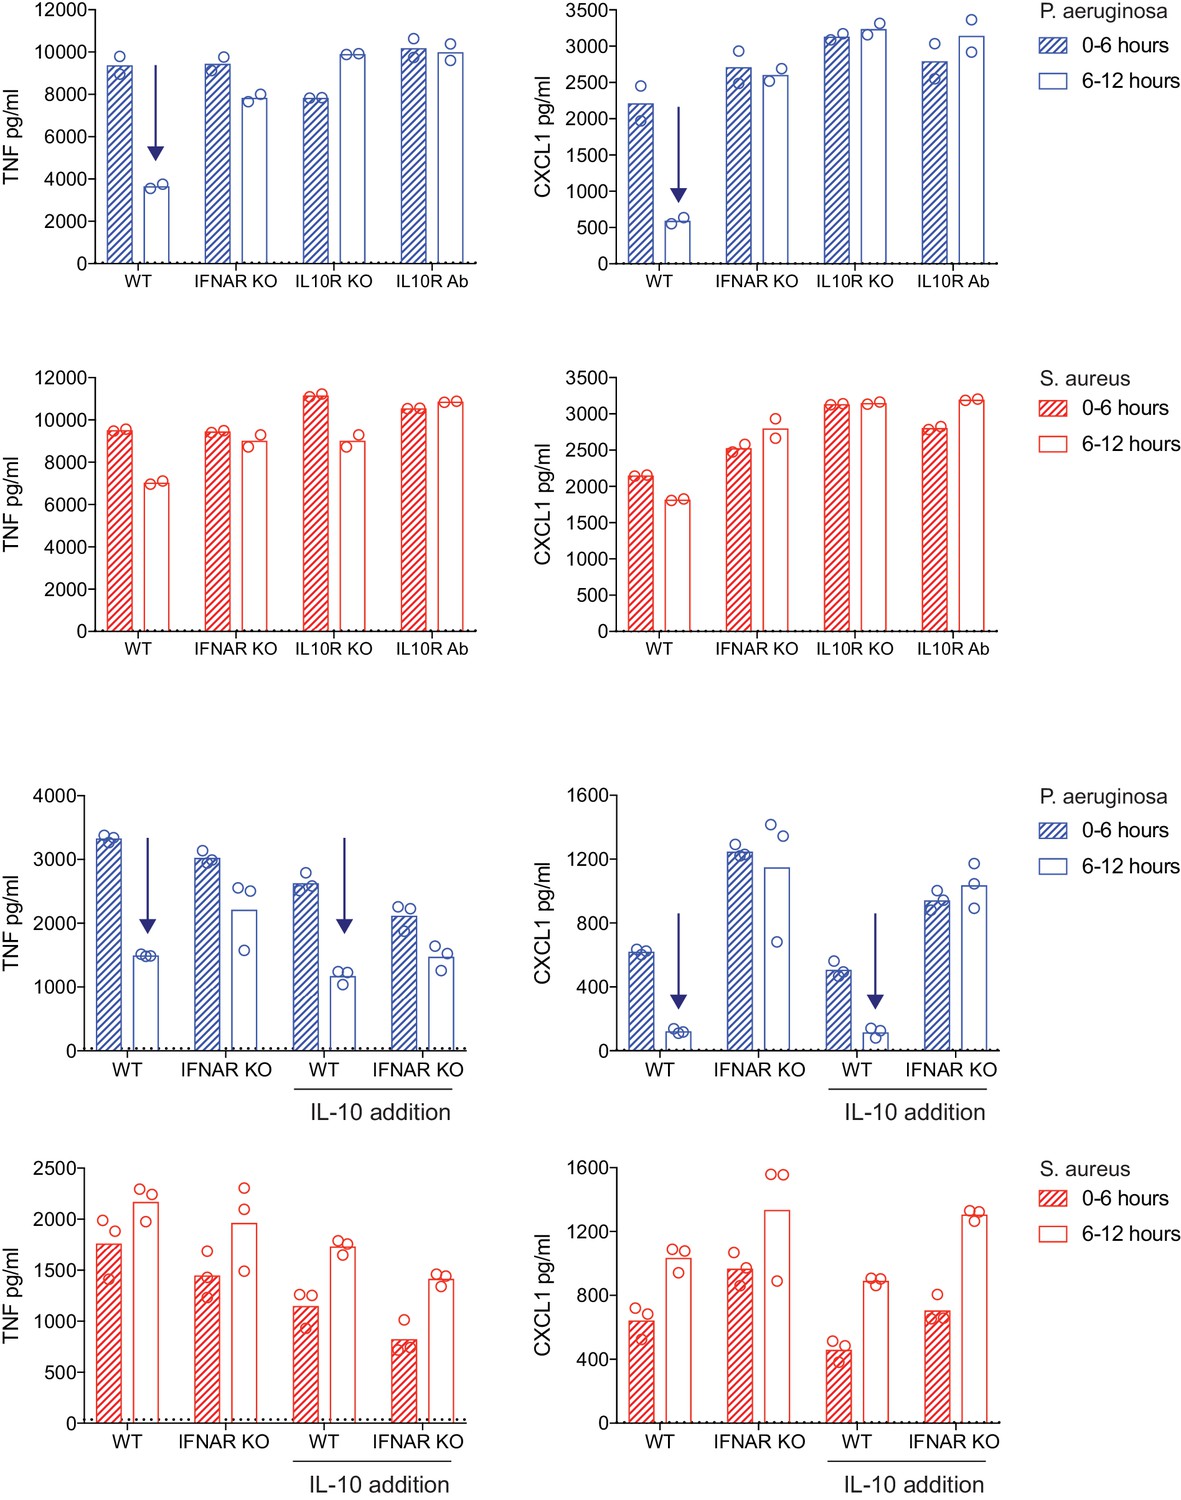
The impact of IL10 deficiency or addition on TNF and CXCL1 shutdown.
WT, Ifnar1-/-, and Il10rb-/- BMDM were stimulated with heat-killed P. aeruginosa or S. aureus, as indicated. After 6 hr of stimulation, supernatants were removed (0–6 hr) and replaced with fresh medium for a subsequent 6 hr of stimulation (6–12 hr). TNF and CXCL1 were quantified using cytometric bead array. Blocking antibody to IL-10R (10 µg/mL; 30 min pre-stimulation) or recombinant IL-10 (1 ng/mL, 2 hr post-stimulation) was added to select conditions, where indicated. Arrows are to guide the eye to shutdown from the early to late timepoint. The mean values for unstimulated WT BMDM (0–6 hr) are shown as dotted lines. In some cases, these controls are not visible because they are below the level of detection (a zero value). Data points represent replicate wells and results are representative of two independent experiments.
Figure 6—figure supplement 4
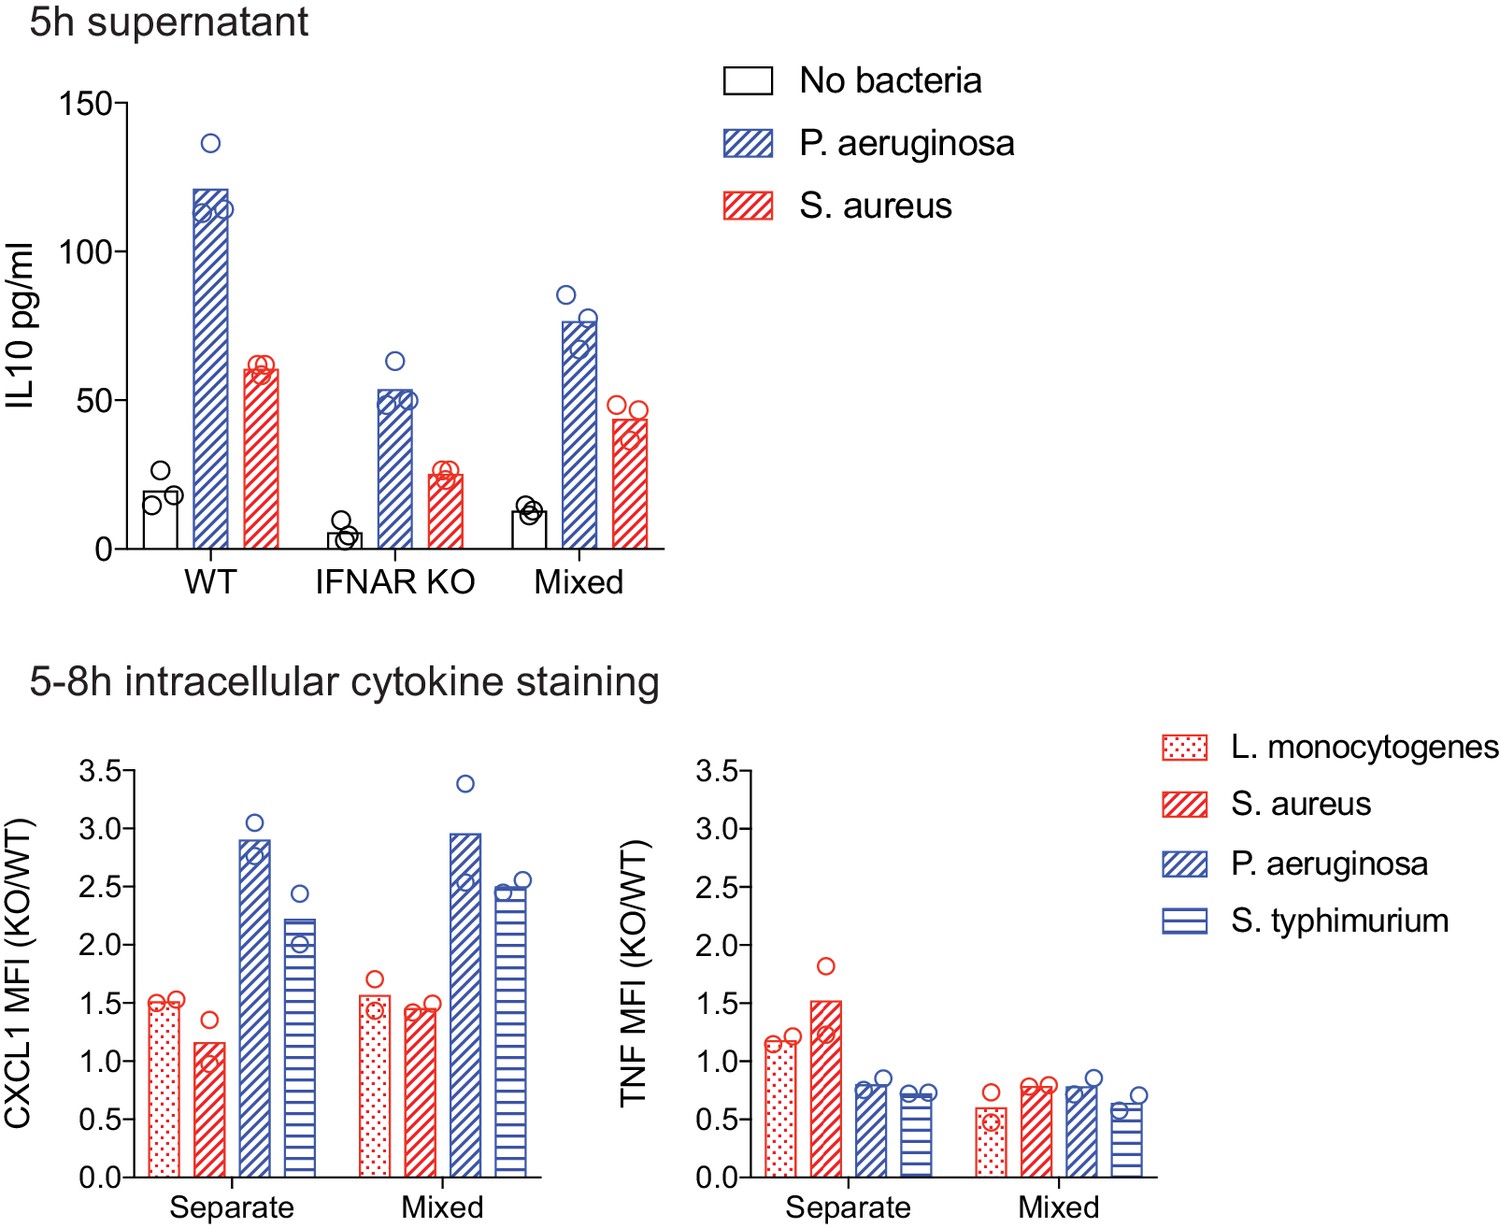
Characterization of mixed WT and Ifnar1-/- BMDM cultures.
As in Figure 6F and G, WT and IFNAR KO BMDM were stimulated with the indicated heat-killed bacteria, separately or in mixed BMDM cultures (1:1 of WT:KO). After 5 hr of stimulation, either supernatants were collected for IL-10 quantification by cytometric bead array (above) or BFA was added for the final 3 hr of an 8 hr stimulation (below). CXCL1 and TNF were quantified by intracellular cytokine staining and flow cytometry and the MFI is shown as a KO/WT ratio. Data points represent replicate wells and results are representative of two or more independent experiments. .
Figure 7 with 1 supplement
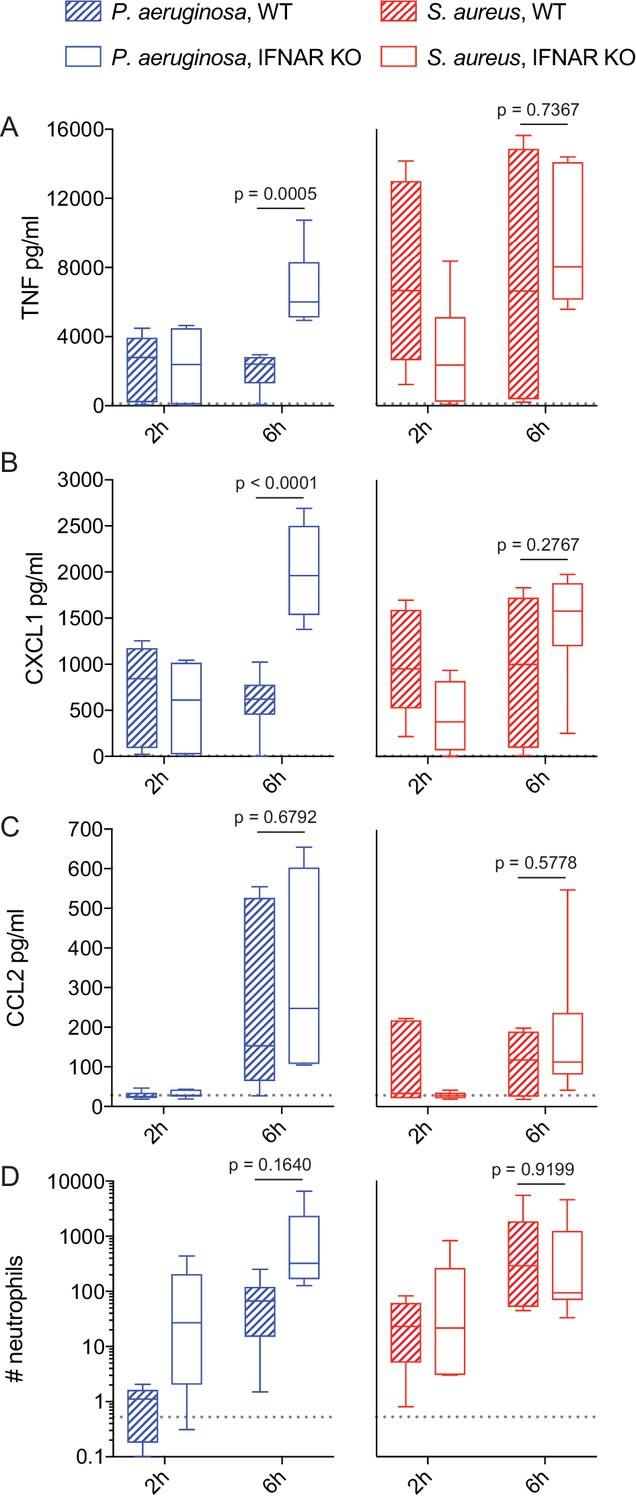
IFN-mediated negative feedback shapes in vivo inflammatory responses in a pathogen-specific manner.
WT or Ifnar1-/- littermate mice were infected intranasally with 5 × 10⁷ CFU of P. aeruginosa or S. aureus, as indicated. At 2 and 6 hr after infection, mice were sacrificed and BAL was collected for quantification of cytokines by CBA (A-C) and neutrophils by flow cytometry (D). Data are pooled from two independent experiments, with a total of 6 mice per experimental group. Neutrophil numbers were normalized to the mean of WT P. aeruginosa infected mice for each independent experiment. The mean values for PBS treated control mice are shown as dotted lines.
Figure 7—figure supplement 1
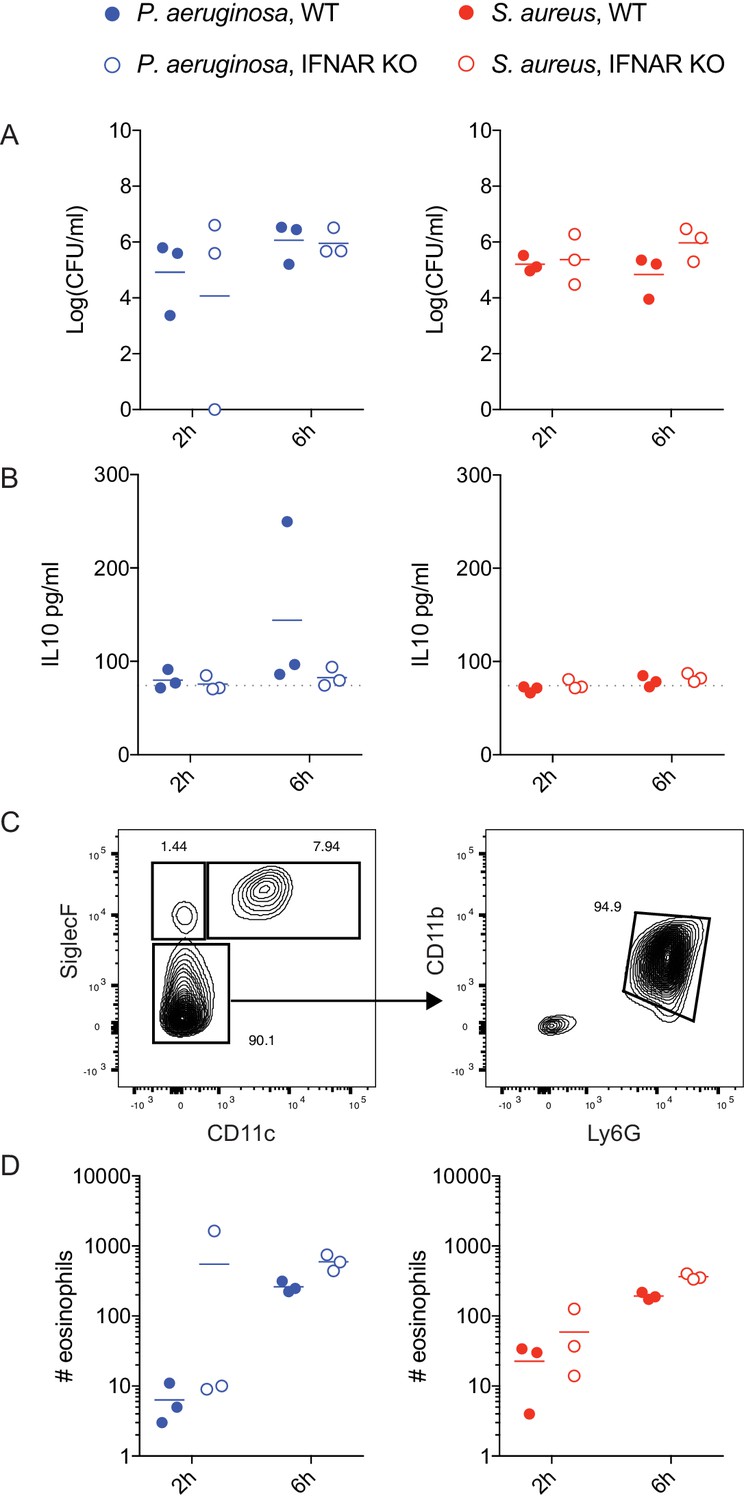
Lung infection with P. aeruginosa and S. aureus.
WT or Ifnar1-/- littermate mice were infected intranasally with 5 × 10⁷ CFU of P. aeruginosa or S. aureus, and mice were sacrificed at 2- and 6 hr post-infection. CFU were determined by plating dilutions of homogenized whole lungs. IL-10 was quantified from BAL using CBA. Representative flow cytometry gating shows CD11b+Ly6G+ neutrophils shown in Figure 7D and SiglecF+CD11c- eosinophils shown below. Data are shown for one of two experiments; IL-10 was not detected above baseline in the other experiment.
Tables
Key resources table
| Reagent type (species) or resource | Designation | Source or reference | Identifiers | Additional information |
|---|---|---|---|---|
| Biological sample | Kdo2-Lipid A Di[3-deoxy-D- manno- octulosonyl]-lipid A (ammonium salt) | Avanti Polar Lipids, Inc | 699500 | |
| Biological sample | Pam3CSK4 Synthetic triacylated lipopeptide | InvivoGen | Tlrl-pms | |
| Sequence-based reagent | Ambion Silencer Select siRNA library | ThermoFisher Scientific | AM81810 | |
| Commercial assay, kit | Lipofectamine RNAiMAX transfection reagent | ThermoFisher Scientific | 13778030 | |
| Strain, strain background (Pseudomonas aeruginosa) | PA01 | ATCC | BAA-47 | |
| Strain, strain background (Salmonella enterica enterica serovar Typhimurium) | 14028 | ATCC | 14028 | |
| Strain, strain background (E. coli) | K12 MG1655 | ATCC | 700926 | |
| Strain, strain background (Stapylococcus aureus) | FDA209 | ATCC | 6538P | |
| Strain, strain background (Listeria monocytogenes ∆actA) | DPL1942 | (Brundage et al., 1993) | Deletion mutant for gene actA | |
| Strain, strain background (Mus musculus) | C57BL/6J | Jackson Laboratory | 000664 | |
| Strain, strain background (Mus musculus) | B6.129S2-Ifnar1tm1Agt/Mmjax | Jackson Laboratory | 32045-JAX | Knockout mutant for gene Ifnar1 |
| Strain, strain background (Mus musculus) | B6.129S2-Il10rbtm1Agt/J | Jackson Laboratory | 005027 | Knockout mutant for gene Il10rb |
| Antibody | Rat anti-mouse IL10R monoclonal | Biolegend | 112709 | Blocked with 10 µg/mL |
| Recombinant protein | Mouse IL-10 | Peprotech | 210–10 |
Additional files
-
Transparent reporting form
- https://doi.org/10.7554/eLife.46836.020
Download links
A two-part list of links to download the article, or parts of the article, in various formats.
Downloads (link to download the article as PDF)
Open citations (links to open the citations from this article in various online reference manager services)
Cite this article (links to download the citations from this article in formats compatible with various reference manager tools)
IFN-mediated negative feedback supports bacteria class-specific macrophage inflammatory responses
eLife 8:e46836.
https://doi.org/10.7554/eLife.46836


