Brain tumours repurpose endogenous neuron to microglia signalling mechanisms to promote their own proliferation
- University of Edinburgh, United Kingdom
Figures
Figure 1 with 5 supplements
Microglia show increased interactions with AKT1 expressing cells compared to control cells.
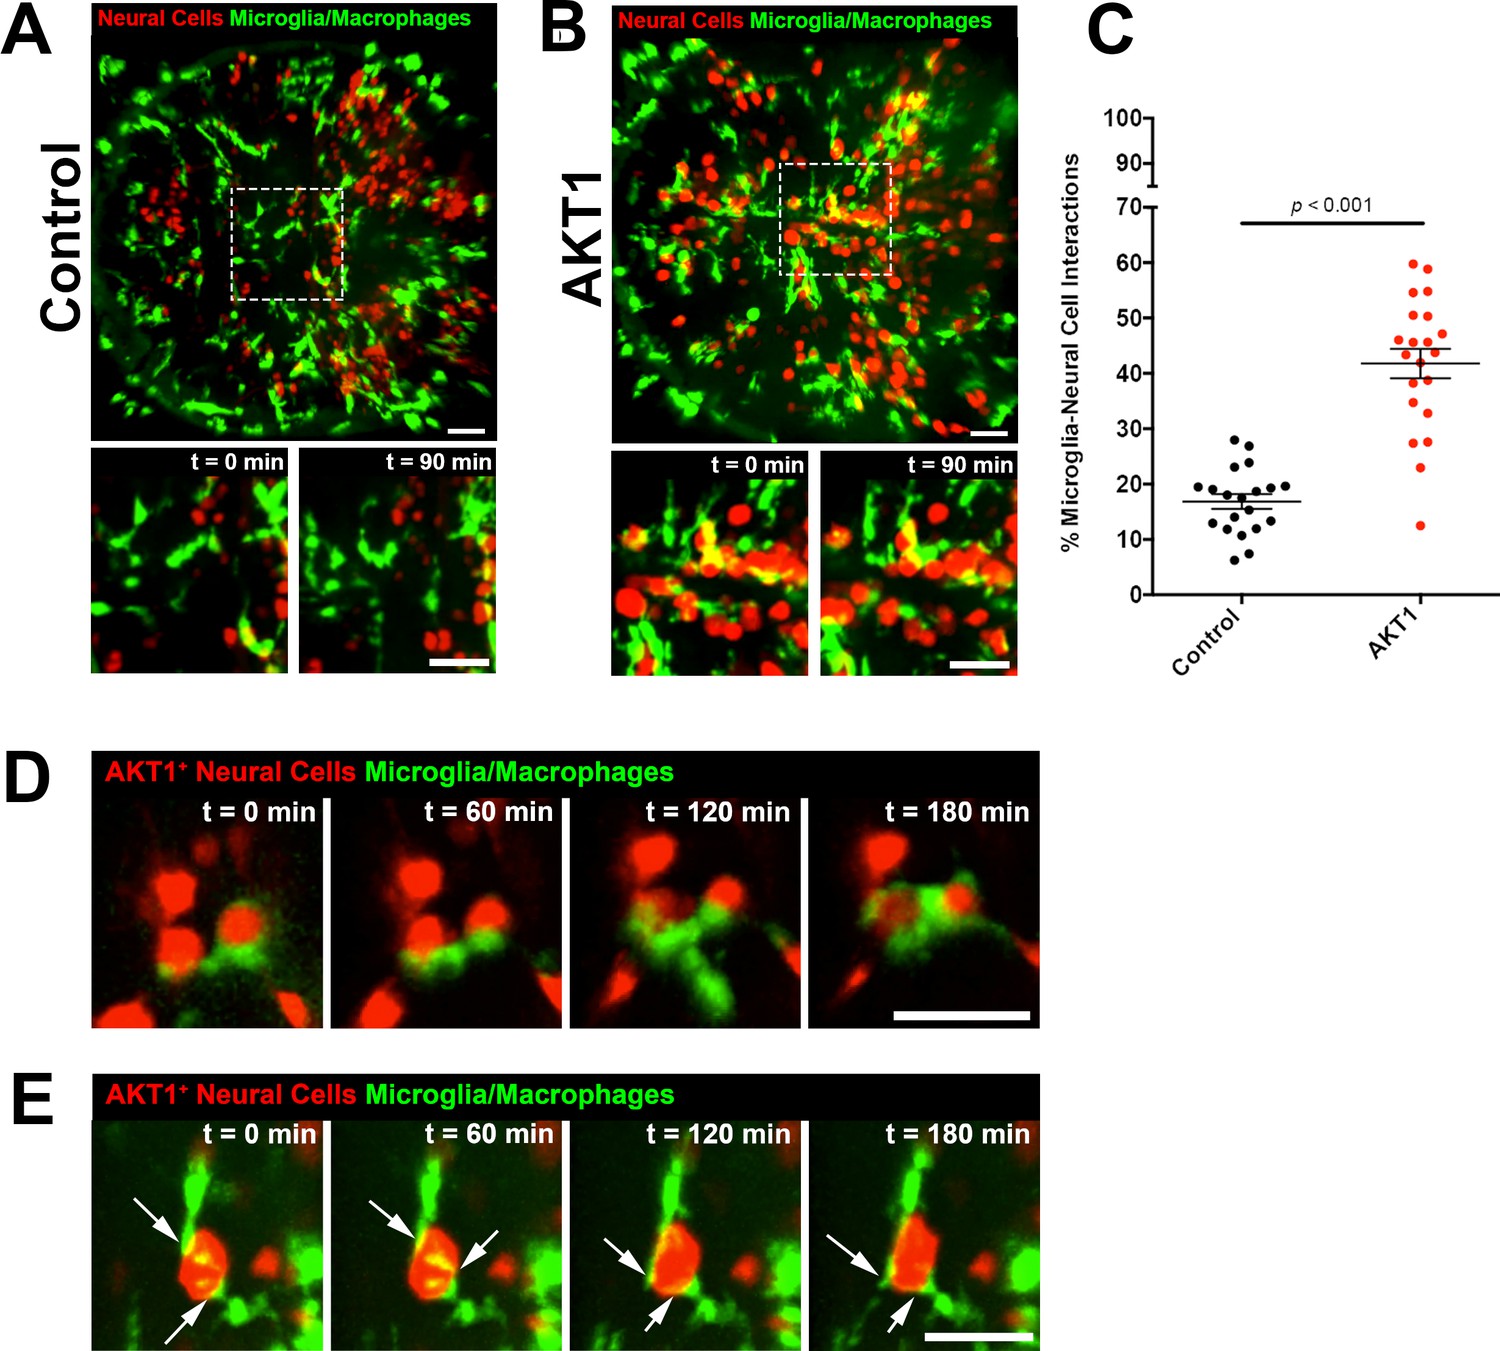
In vivo time-lapse imaging was performed using the mpeg1:EGFP transgenic line to observe microglia behaviour towards control cells and AKT1 cells. (A) In controls, microglia were observed to behave physiologically. Cells adopted the typical ramified morphology constantly sending out branched processes to survey the microenvironment (see also Figure 1—video 1). (B) Following AKT1 overexpression, microglia were observed to directly interact with AKT1+ cells (see also Figure 1—video 2). (C) Quantification of the percentage of microglia interacting with control and AKT1 positive cells (control: 16.86 ± 1.33%, n = 20; AKT1: 41.79 ± 2.65%, n = 21). Specific microglia interactions with AKT1+ cells include (D) the wrapping of cell bodies around the oncogenic cells (see also Figure 1—video 3), as well as (E) two microglial cells making direct contacts with AKT1+ via their extended processes (white arrows) (see also Figure 1—video 4). Representative images at five dpf are shown. Images were captured using an Andor spinning disk confocal microscope with a 20x/0.75 objective. Image acquisition was carried out over a duration of 180 min (3 hr). Scale bars represent 30 µm. Error bars represent mean ± SEM.
-
Figure 1—source data 1
Quantfications of microglial interactions with control and AKT1+ cells.
- https://doi.org/10.7554/eLife.46912.004
Figure 1—figure supplement 1
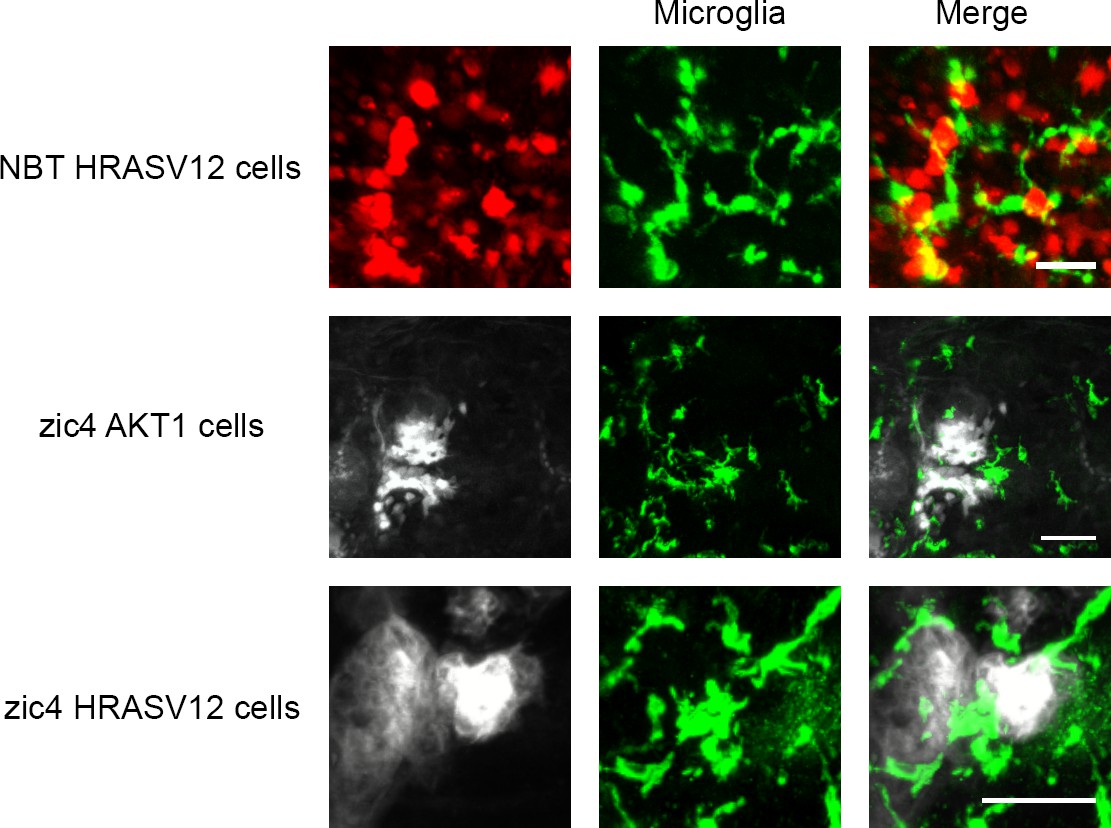
Microglial responses to oncogenic cells.
Microglia were seen to directly interact with NBT cells and zic4 cells undergoing oncogenic transformation caused by AKT1 and HRAV12. Microglia were visualised using the mpeg1:EGFP line in NBT-HRASV12 and zic4-AKT1 larvae and visualised using the 4C4 antibody in the zic4-HRASV12 larvae. Representative images at six dpf are shown. Images were captured using an Andor spinning disk confocal microscope with a 20x/0.75 objective and a Zeiss LSM 710 confocal microscope with a 20x/0.8 objective. Scale bars represent 40 µm for NBT HRASV12 larvae and 50 µm for zic4 larvae.
Figure 1—video 1
Microglia responses to control RFP neural cells (REF to Figure 1).
In vivo time-series showing representative microglia (green) behaviour in the presence of control neural cells (red). Images were acquired every 2 min over a duration of 180 min (3 hr) using an Andor spinning disk confocal microscope with a 20x/0.75 objective. Scale bar represents 30 µm.
Figure 1—video 2
Microglia display close interactions with AKT1 expressing cells (REF to Figure 1).
In vivo time-series showing representative microglia (green) behaviour in the presence of AKT1 positive cells (red). In comparison to controls, the microglia were observed to keep in close contact with the AKT1 expressing cells over long periods of time. Images were acquired every 2 min over a duration of 180 min (3 hr) using an Andor spinning disk confocal microscope with a 20x/0.75 objective. Scale bar represents 30 µm.
Figure 1—video 3
Microglia display close interactions with AKT1 expressing cells (REF to Figure 1).
In vivo time-series showing representative microglia (green) behaviour in the presence of isolated AKT1 positive cells (red). Microglia were observed to contact different oncogenic cells and to flatten their surfaces and wrap their cell bodies around the oncogenic cells over long periods of time. Images were acquired every 2 min over a duration of 180 min (3 hr) using an Andor spinning disk confocal microscope with a 20x/0.75 objective. Scale bar represents 5 µm.
Figure 1—video 4
Different microglia interact with the same isolated AKT1 expressing cell (REF to Figure 1).
In vivo time-series showing representative microglia (green) behaviour in the presence of isolated AKT1-positive cells (red). Different microglia were observed to make direct contacts with the same oncogenic cell via their extended processes over long periods of time. Images were acquired every 2 min over a duration of 180 min (3 hr) using an Andor spinning disk confocal microscope with a 20x/0.75 objective. Scale bar represents 10 µm.
Figure 2 with 2 supplements
AKT1 expressing cells have increased levels of intracellular Ca2+.
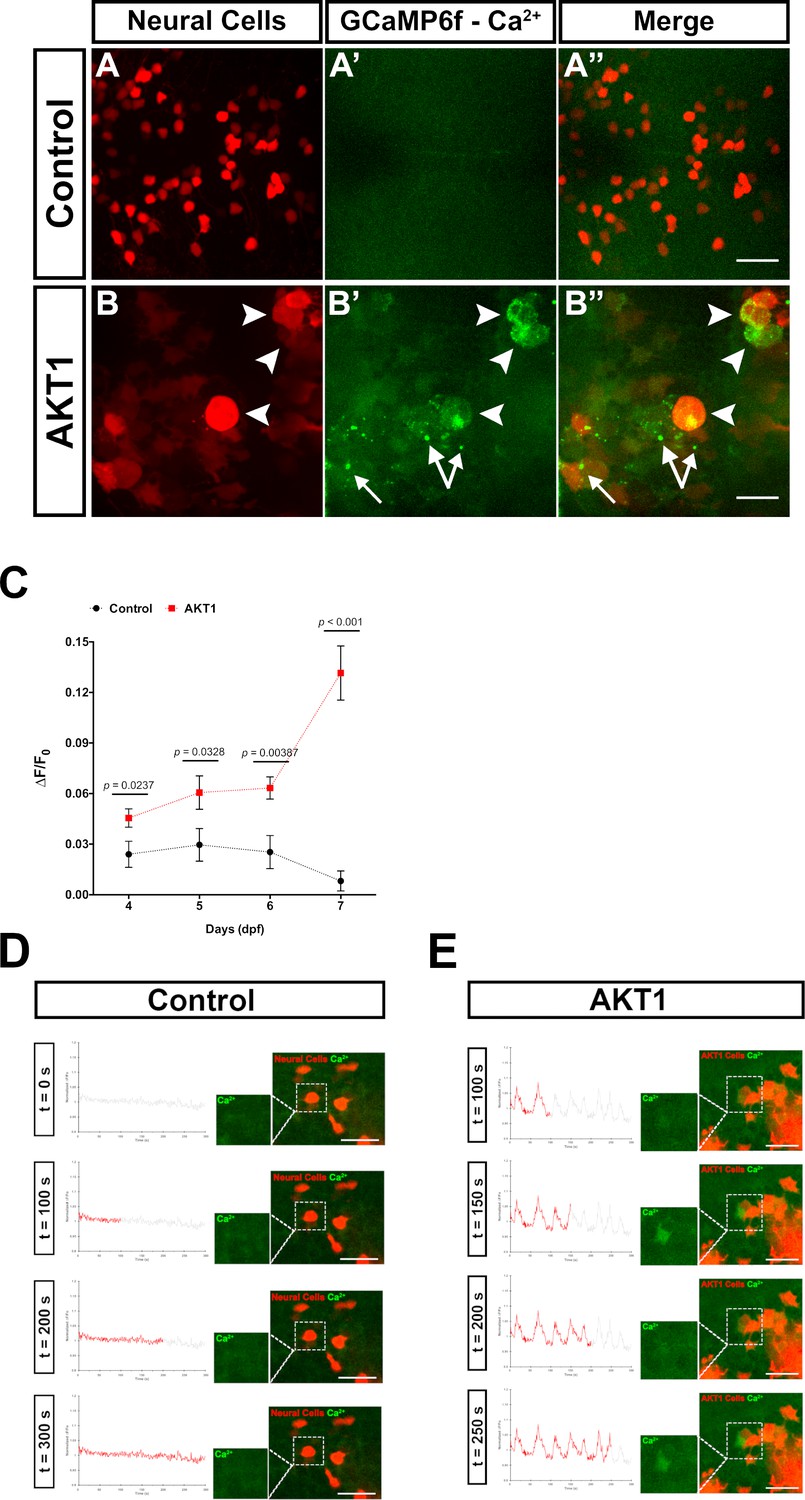
The β-actin:GCaMP6f transgenic line was used to monitor and measure in vivo calcium (Ca2+) levels in control and AKT1+ cells. (A-A’) Control neural cells showed a low, homogenous basal level of intracellular Ca2+. (B-B’) AKT1+ cells showed cell specific increase in intracellular Ca2+ levels (white arrowheads). (C) Quantification of the mean relative fluorescence intensity change (∆F/F0) of control and AKT1+ cells at 4 dpf, 5 dpf, 6 dpf, and 7 dpf. Significant differences were observed between control and AKT1 expressing larvae at all four time points. (Control – 4 dpf: 0.0240 ± 0.0078, n = 22; 5 dpf: 0.0296 ± 0.0097, n = 19; 6 dpf: 0.0253 ± 0.0098, n = 25; 7 dpf: 0.00815 ± 0.0059, n = 25). (AKT1 – 4 dpf: 0.0455 ± 0.0055, n = 29; 5 dpf: 0.0606 ± 0.0099, n = 22; 6 dpf: 0.0633 ± 0.0066, n = 20; 7 dpf: 0.132 ± 0.016, n = 32). Representative images of larvae at 8 dpf are shown. (D)(D) + (E) To monitor changes in Ca2+ levels over time, samples were imaged over 5 min (300 s) with a capture rate of 1 frame/s. The data has been normalised and represented as a function of ∆F/F0 plotted against time. (D) Calcium activity in control cells showed no changes over time (n = 35 larvae analysed) (see also Figure 2—video 1). (E) AKT1 expressing cells were found to temporally regulate calcium activity, through up- and down-regulation of Ca2+ levels (n = 35 larvae analysed) (see also Figure 2—video 2). Images were captured using an Andor spinning disk confocal microscope with a 20x/0.75 objective. Scale bars represent 20 µm. Error bars represent mean ± SEM.
-
Figure 2—source data 1
Quantifications of GCaMP6F fluorescence in control and AKT1+ cells.
- https://doi.org/10.7554/eLife.46912.010
Figure 2—video 1
Control cells show minor changes in intracellular Ca2+levels over time (REF to Figure 2).
The Tg(b-actin:GCaMP6f) transgenic line was used to monitor and measure in vivo calcium (Ca2+) activities in control RFP cells. Samples were imaged over 5 min (300 s) with a capture rate of 1 frame/s using an Andor spinning disk confocal microscope with a 20x/0.75 objective. The data has been normalised and represented as a function of ∆F/F0 plotted against time.
Figure 2—video 2
AKT1 cells dynamically regulate their intracellular Ca2+levels over time (REF to Figure 2).
The Tg(b-actin:GCaMP6f) transgenic line was used to monitor and measure in vivo calcium (Ca2+) activities in AKT1 cells. Samples were imaged over 5 min (300 s) with a capture rate of 1 frame/s using an Andor spinning disk confocal microscope with a 20x/0.75 objective. The data has been normalised and represented as a function of ∆F/F0 plotted against time.
Figure 3

Microglia directly respond to increased levels of intracellular Ca2+ in AKT1+ cells.
Microglia were observed to display various different responses towards AKT1 positive cells with upregulated Ca2+ levels. One type of interaction was the prolonged cell-to-cell contact between the microglial cell and the AKT1 expressing cell (A-D, arrows). In addition, microglia were observed to extend processes towards AKT1 cells with increased calcium activities (A-H, arrowheads). Representative images at five dpf are shown. Images were captured using an Andor spinning disk confocal microscope with a 20x/0.75 objective. Scale bars represent 20 μm.
Figure 4 with 1 supplement
Ca2+-ATP-P2ry12 signalling stimulates microglial interactions with AKT1 cells.
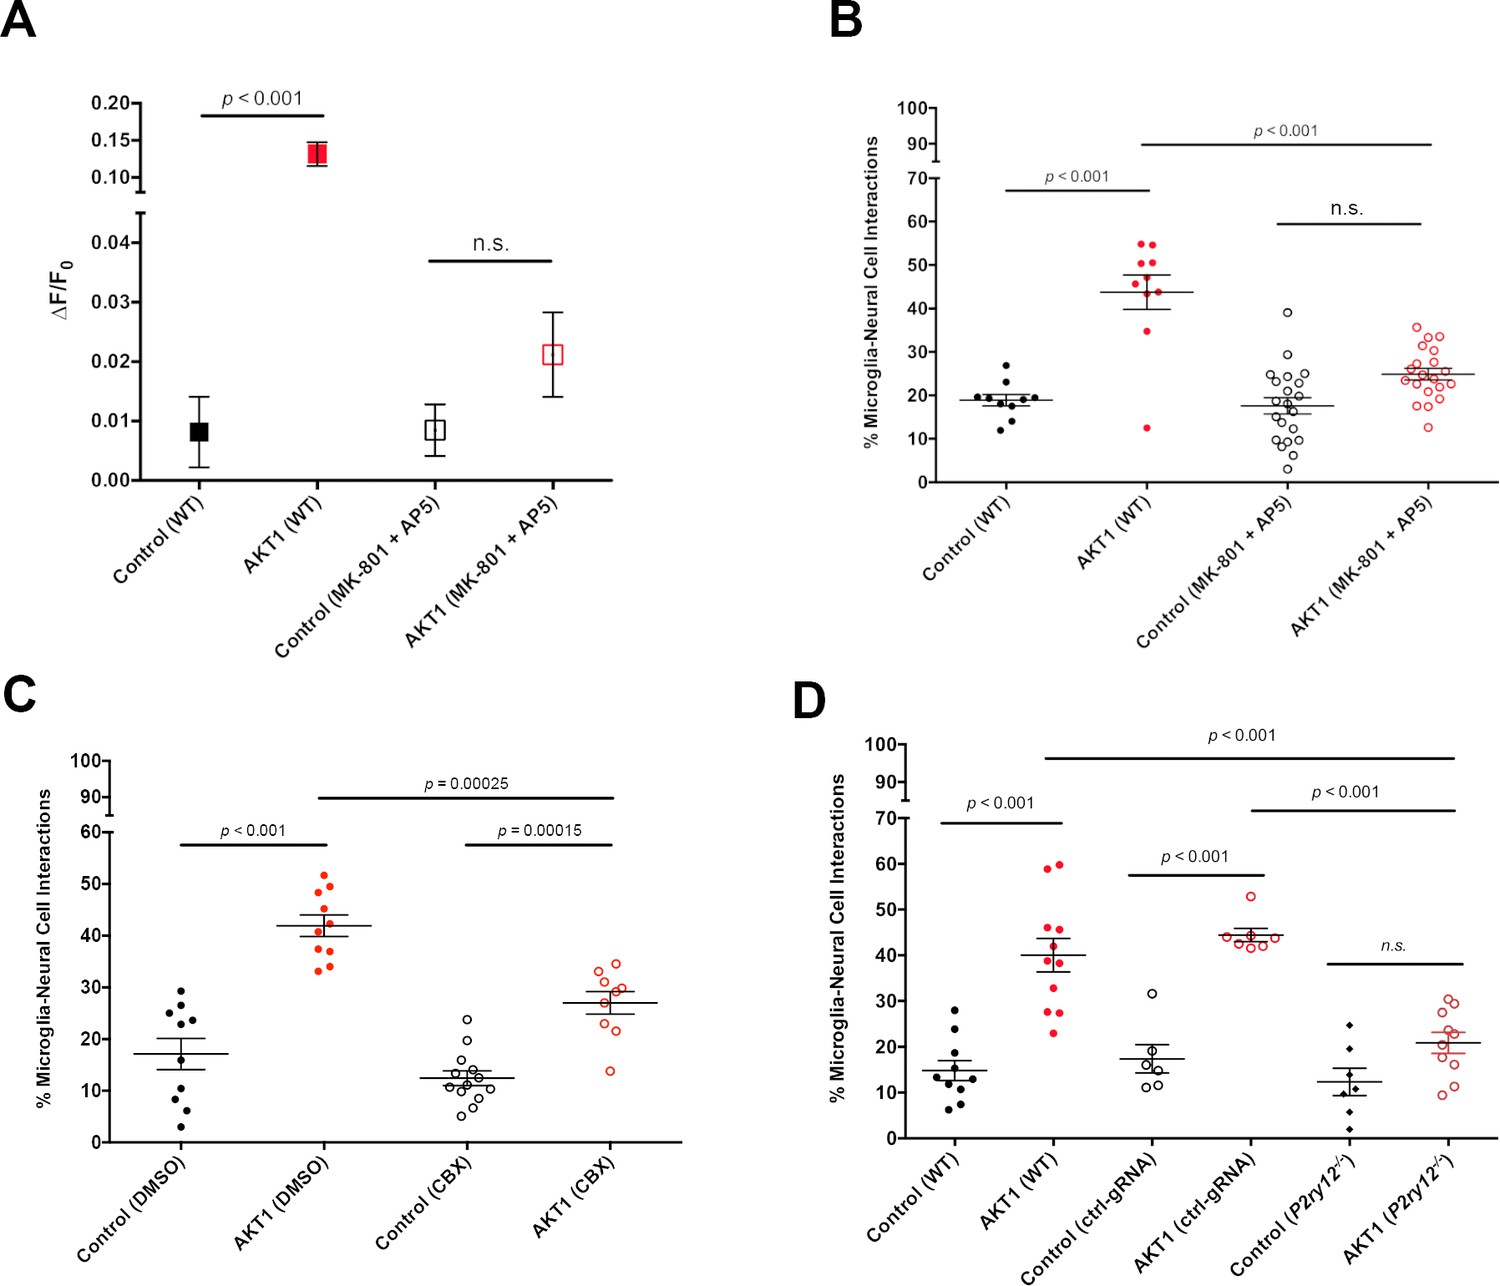
The β-actin:GCaMP6f transgenic line was used to monitor and measure in vivo calcium (Ca2+) levels in control and AKT1 expressing cells. The mpeg1:EGFP transgenic line was used to quantify microglial interactions with control and AKT1 cells. (A) Treating larvae with MK801 and MK5 to inhibit NMDA receptor signalling led to a significant reduction of Ca2+ levels in treated AKT1 cells compared to untreated AKT1 cells. Quantification of the mean relative fluorescence intensity (∆F/F0) of Ca2+ levels in control and in AKT1 expressing cells is shown (control (WT): 0.0081 ± 0.006, n = 25; AKT1 (WT): 0.1316 ± 0.016, n = 32; control (MK801 +MK5): 0.0085 ± 0.004, n = 16; AKT1 (MK801 +MK5): 0.0211 ± 0.007, n = 16). (B) The percentage of microglial cells interacting with AKT1 cells was significantly reduced in larvae treated with MK801 and MK5 compared to untreated larvae. (Control (WT): 18.89 ± 1.32, n = 10; AKT1 (WT): 43.75 ± 3.95, n = 10; Control (MK801 +MK5): 17.59 ± 1.89, n = 21; AKT1 (MK801 +MK5): 24.94 ± 1.36, n = 20). (C) The percentage of microglial cells interacting with AKT1 cells was significantly reduced in larvae treated with CBX compared to untreated larvae (Control (DMSO): 17.11 ± 3.02%, n = 10; AKT1 (DMSO): 41.92 ± 2.09%, n = 10; Control (CBX): 12.42 ± 1.42%, n = 13; AKT1 (CBX): 26.99 ± 2.19%, n = 9).(D) The percentage of microglial cells interacting with AKT1 cells was significantly reduced in p2ry12 crispant larvae compared to WT larvae (Control (WT): 14.82 ± 2.19%, n = 10; AKT1 (WT): 40.01 ± 3.66%, n = 11; Control (ctrl-gRNA): 17.38 ± 3.09%, n = 6; AKT1 (ctrl-gRNA): 44.42 ± 1.46%, n = 7; Control (p2ry12-/-): 12.33 ± 2.97%, n = 7; AKT1 (p2ry12-/-): 20.88 ± 2.29%, n = 10).
-
Figure 4—source data 1
Quantfications of microglial interactions with control and AKT1+ cells upon interference with Ca2+ - ATP -P2ry12 signalling..
- https://doi.org/10.7554/eLife.46912.016
Figure 4—figure supplement 1
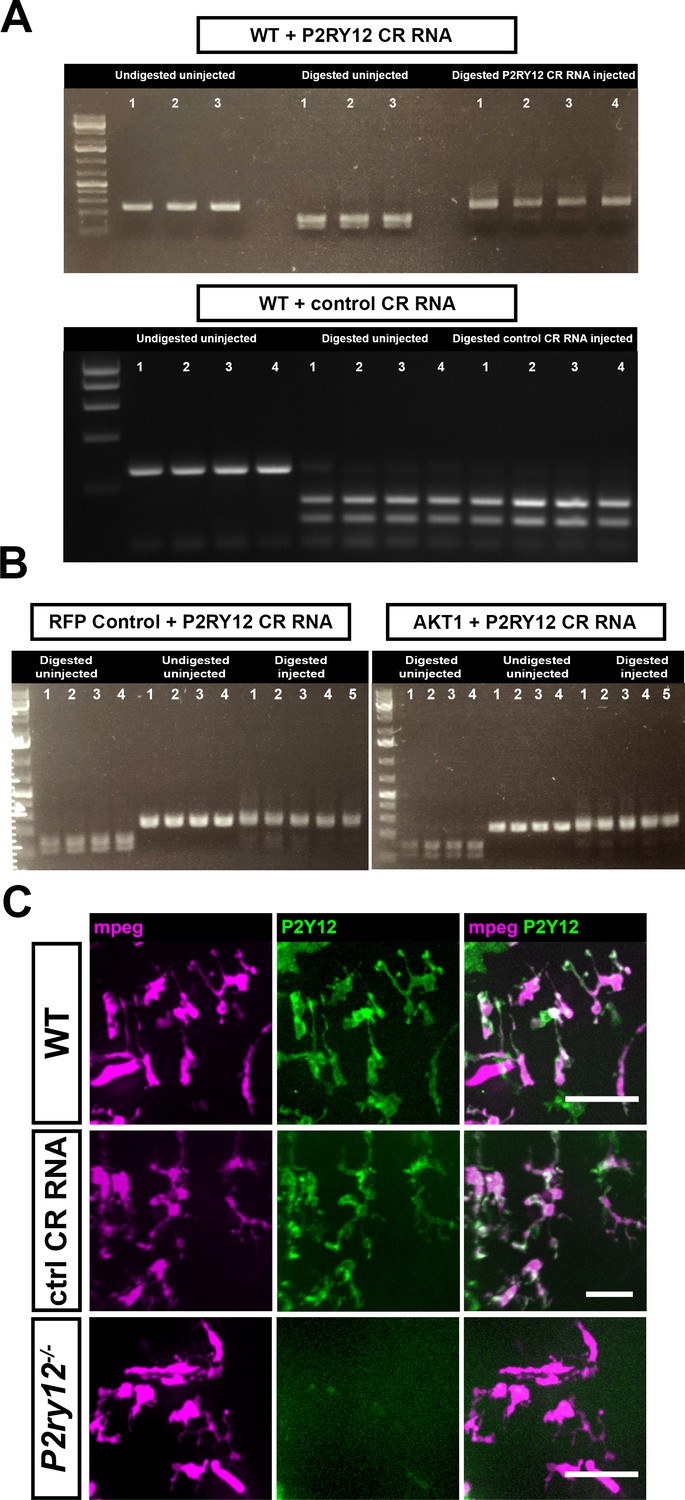
CRISPR/Cas9-mediated mutation of the p2ry12 gene.
Acute mutation of the p2ry12 gene was mediated through the injection of Cas9 and the p2ry12 guide RNA into one-cell stage embryos. (A) Restriction fragment length polymorphism (RFLP) analysis was carried out on single embryos to confirm the efficiency of the guide RNA in mutating the p2ry12 gene. Injection of a control guide did not mutate the p2ry12 locus (lower picture). (B) Injection of Cas9 and the p2ry12 guide RNA into experimental controls (RFP only) and AKT1-induced samples caused efficient mutation of the p2ry12 gene. (C) The Tg(mpeg1:mCherry; p2ry12:p2ry12-GFP) double transgenic fish was utilized to facilitate in vivo observations of P2ry12 knockout. Macrophages and microglia express mCherry under the mpeg1 promoter while microglia express in addition P2ry12-GFP under the control of the p2ry12 promoter. The injection of Cas9 and the control guide RNA did neither impact on mCherry expression nor on P2ry12-GFP expression. Upon injection of Cas9 and the p2ry12 guide RNA, expression of P2ry12-GFP was effectively abolished. Representative images at 5 dpf are shown. Images were captured using an Andor spinning disk confocal microscope with a 20x/0.75 objective. Scale bars represent 20 µm.
Figure 5
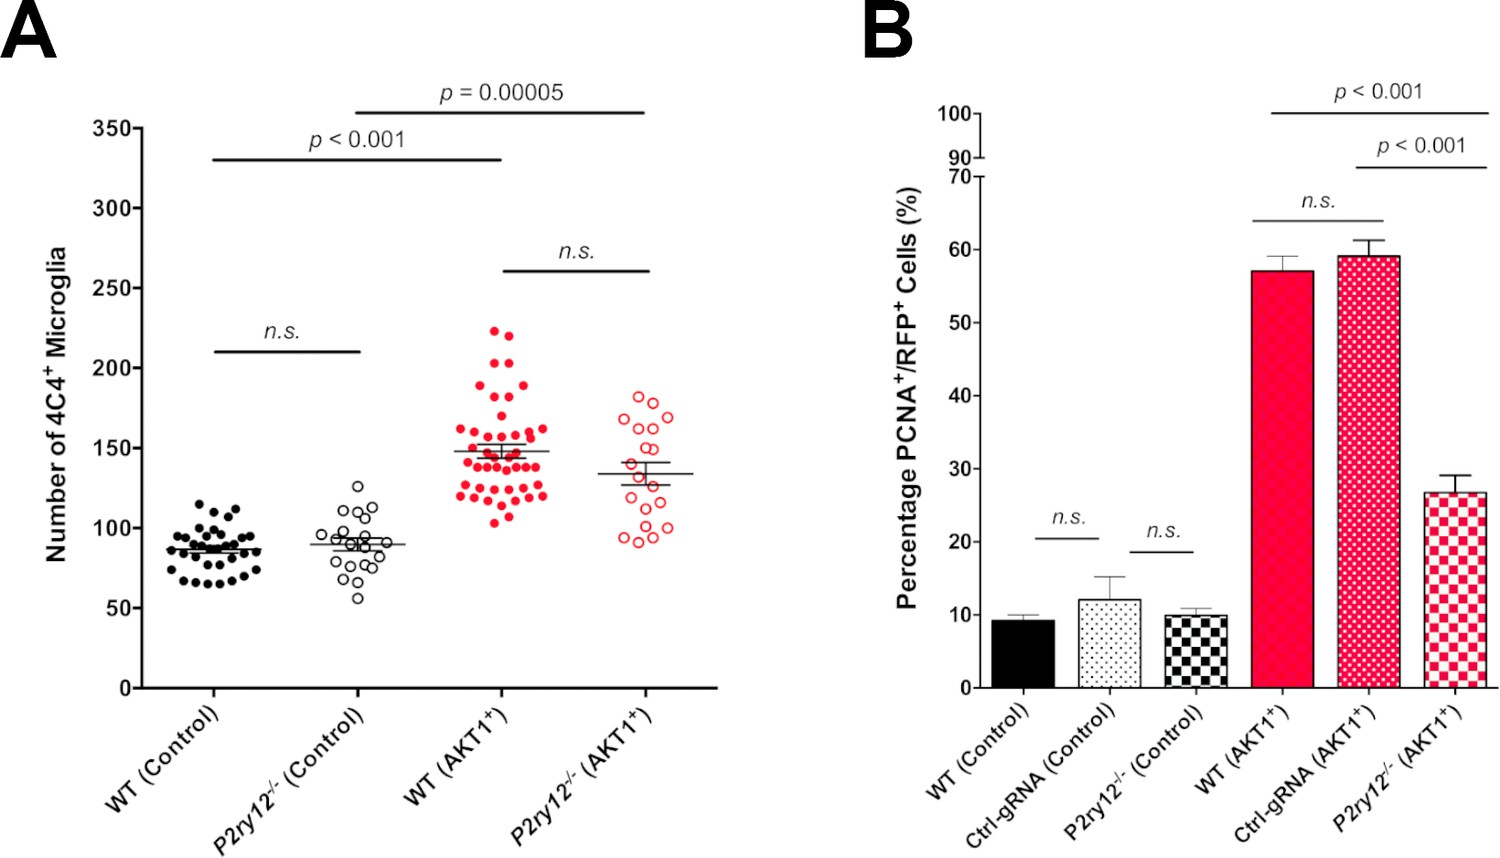
P2RY12-mediated microglial interactions stimulate AKT1 cell proliferation.
CRISPR/Cas9-mediated knockout of the P2y12 receptor had no impact on microglia numbers but led to significantly reduced proliferation rates of AKT1+ cells. (A) Quantification of the number of microglia in control larvae and upon AKT1 overexpression in WT and p2ry12 crispant zebrafish (Control – WT: 86.71 ± 2.34, n = 34; p2ry12-/-: 89.8 ± 3.99, n = 20) (AKT1 – WT: 148 ± 4.38, n = 45; p2ry12-/-: 133.9 ± 7.07, n = 19). (B) Quantification of the level of proliferation of RFP-expressing cells in control larvae and upon AKT1 overexpression in WT, ctrl-gRNA and p2ry12 crispant zebrafish (Control – WT: 9.25 ± 0.75%, n = 13; ctrl-gRNA: 12.07 ± 3.16%, n = 11; P2ry12-/-: 9.92 ± 0.97%, n = 20) (AKT1 – WT: 57.1 ± 2.03%, n = 17; ctrl-gRNA: 59.12 ± 2.18%, n = 12; P2ry12-/-: 26.8 ± 2.37%, n = 19). Error bars represent mean ± SEM.
-
Figure 5—source data 1
Quantifications of microglial numbers and proliferation of neural cells in P2ry12 crispants and controls.
- https://doi.org/10.7554/eLife.46912.018
Tables
Key resources table
| Reagent type (species) or resource | Designation | Source or reference | Identifiers | Additional information |
|---|---|---|---|---|
| Antibody | anti-4C4 (mouse monoclonal) | Becker Lab, University of Edinburgh | (1:50) | |
| Antibody | anti-PCNA (rabbit polyclonal) | abcam | abcam: ab18197; RRID:AB_2160346 | (1:300) |
| Antibody | Alexa 488- or 647 secondaries | Life Technologies | Life Technologies: A11001 (RRID:AB_138404), A21235 (RRID:AB_141693), A11008 (RRID:AB_143165), A21244 (RRID:AB_141663) | (1:200) |
| Chemical compound, drug | Carbenoxolone (CBX) | Sigma-Aldrich | Sigma-Aldrich: C 4790 | 50 µM, 1% DMSO |
| Chemical compound, drug | MK-801 | Sigma-Aldrich | Sigma-Aldrich: M107 | 100 µM |
| Chemical compound, drug | AP5 | Sigma-Aldrich | Sigma-Aldrich: A5282 | 10 µM |
| Gene (Homo sapiens) | AKT1 | NA | ENSG00000142208 | |
| Gene (Homo sapiens) | HRASV12 | NA | ENSG00000174775 | |
| Recombinant DNA reagent | lexOP-AKT1-RFP (plasmid) | Chia et al., 2018 | lexOP:AKT1-lexOP:tagRFP | Gateway vector: pDEST |
| Recombinant DNA reagent | lexOP-HRASV12-RFP (plasmid) | this paper | lexOP:HRASV12-lexOP:tagRFP | Gateway vector: pDEST |
| Recombinant DNA reagent | UAS-AKT1-BFP (plasmid) | this paper | UAS:AKT1:UAS:BFP | Gateway vector: pDEST |
| Recombinant DNA reagent | UAS-eGFP-HRASV12 (plasmid) | PMID: 27935819 | UAS:EGFP-HRASV12 | Gateway vector: pDEST |
| Recombinant DNA reagent | lexOP-tagRFP (plasmid) | Chia et al., 2018 | lexOP:tagRFP-pA | Gateway vector: pDEST |
| Strain, strain background (D. rerio) | zic:Gal4 | Distel et al., 2009 | Et(zic4:GAL4TA4,UAS:mCherry)hmz5, ZDB-ETCONSTRCT-110214–1 | |
| Strain, strain background (D. rerio) | b-actin:GCaMP6f | Herzog et al., 2019 | Tg(b-actin:GCaMP6f) | |
| Strain, strain background (D. rerio) | mpeg1:EGFP | Ellett et al., 2011 | Tg(mpeg1:EGFP)gl22, RRID:ZIRC_ZL9940 | |
| Strain, strain background (D. rerio) | mpeg1:mCherry | Ellett et al., 2011 | Tg(mpeg1:mCherry)gl23, RRID:ZIRC_ZL9939 | |
| Strain, strain background (D. rerio) | NBT:∆lexPR-lexOP-pA | Chia et al., 2018 | Tg(XIa.Tubb:LEXPR)Ed7, ZDB-ALT-180108–4 | |
| Strain, strain background (D. rerio) | p2ry12:p2ry12-GFP | Sieger et al., 2012 | TgBAC(p2ry12:p2ry12-GFP), RRID:ZFIN_ZDB-ALT-121109-2 | |
| Software, algorithm | Imaris 8.0.2 | Bitplane | RRID:SCR_007370 | |
| Chemical compound, drug | TracrRNA | Merck | Merck: TRACRRNA05N | |
| Chemical compound, drug | guide RNA | Merck | Merck: custom made | |
| Peptide, recombinant protein | Cas9 nuclease | NEB | NEB: M0386M |
Additional files
-
Transparent reporting form
- https://doi.org/10.7554/eLife.46912.019
Download links
A two-part list of links to download the article, or parts of the article, in various formats.
Downloads (link to download the article as PDF)
Open citations (links to open the citations from this article in various online reference manager services)
Cite this article (links to download the citations from this article in formats compatible with various reference manager tools)
Brain tumours repurpose endogenous neuron to microglia signalling mechanisms to promote their own proliferation
eLife 8:e46912.
https://doi.org/10.7554/eLife.46912


