Statistical context dictates the relationship between feedback-related EEG signals and learning
- Brown University, United States
- Freie Universität Berlin, Germany
- Max Planck Institute for Human Development, Germany
- International Max Planck Research School on the Life Course (LIFE), Germany
Figures
Figure 1
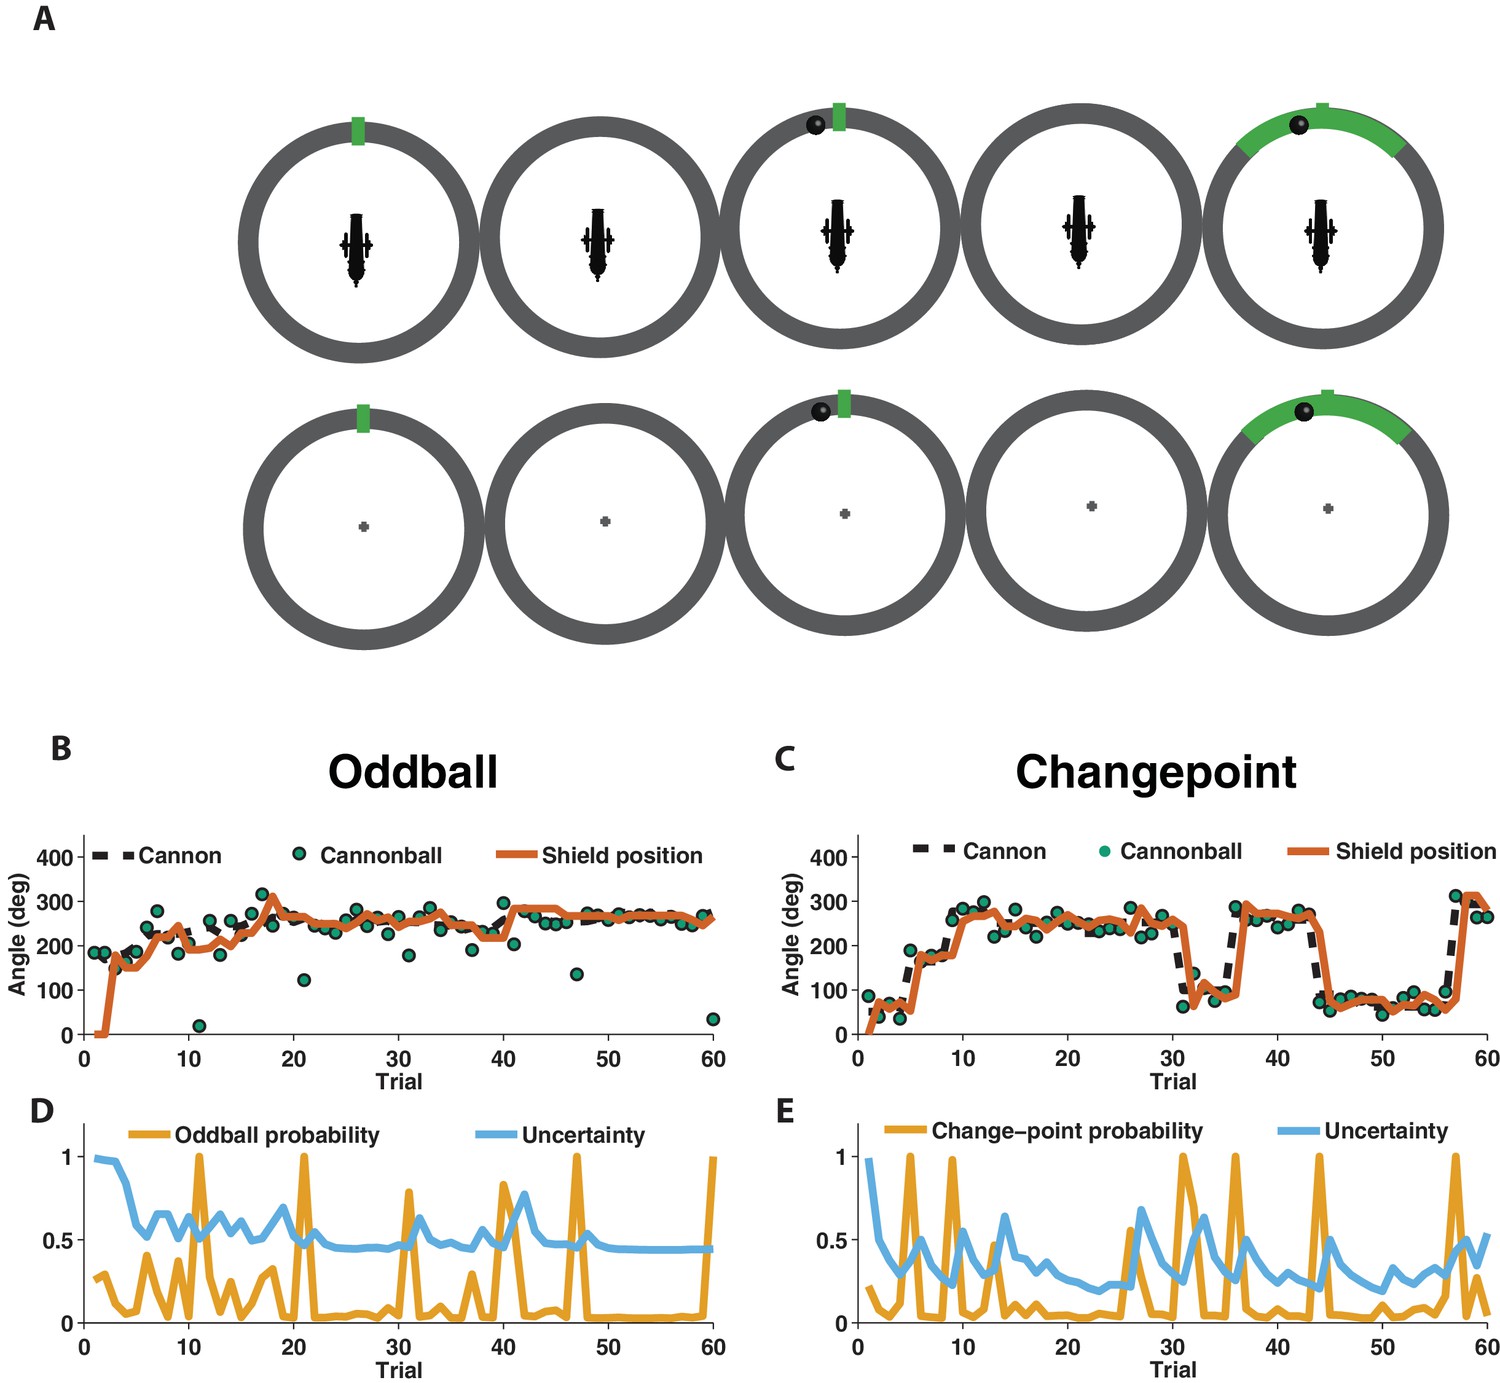
Measuring learning in different statistical contexts with a predictive inference task.
(A) Participants were trained to place the center of a shield (green tick; prediction phase [left]) at the aim location of a cannon (training task [top]) in order to block a cannonball shot from it (outcome phase [top middle]) with a shield that varied in size from trial to trial and was revealed at the end of the trial (shield phase [top right]). After training, participants were asked to complete the same task, but without a visual depiction of the cannon, which required them to infer the aim of the cannon based on the sequence of previously observed cannonballs (test task [bottom]). (B) In oddball blocks, cannon aim (dotted black line) followed a random walk and cannonball locations were typically drawn from a Von Mises distribution centered on the true cannon aim (green points), but were occasionally drawn from a uniform distribution across the entire circle (oddball trials). Participants placed their shield on each trial (brown line) providing information about their inference about the cannon aim. (C) In changepoint blocks, cannon aim was stationary for most trials but was occasionally resampled uniformly from possible angles (changepoint) and cannonball locations were always drawn from a Von Mises distribution centered on the true cannon aim (green points). (D and E) Optimal inference could be approximated in both generative environments by tracking and adjusting learning according to relative uncertainty and the probability of an unlikely event (oddball or changepoint).
Figure 2 with 1 supplement
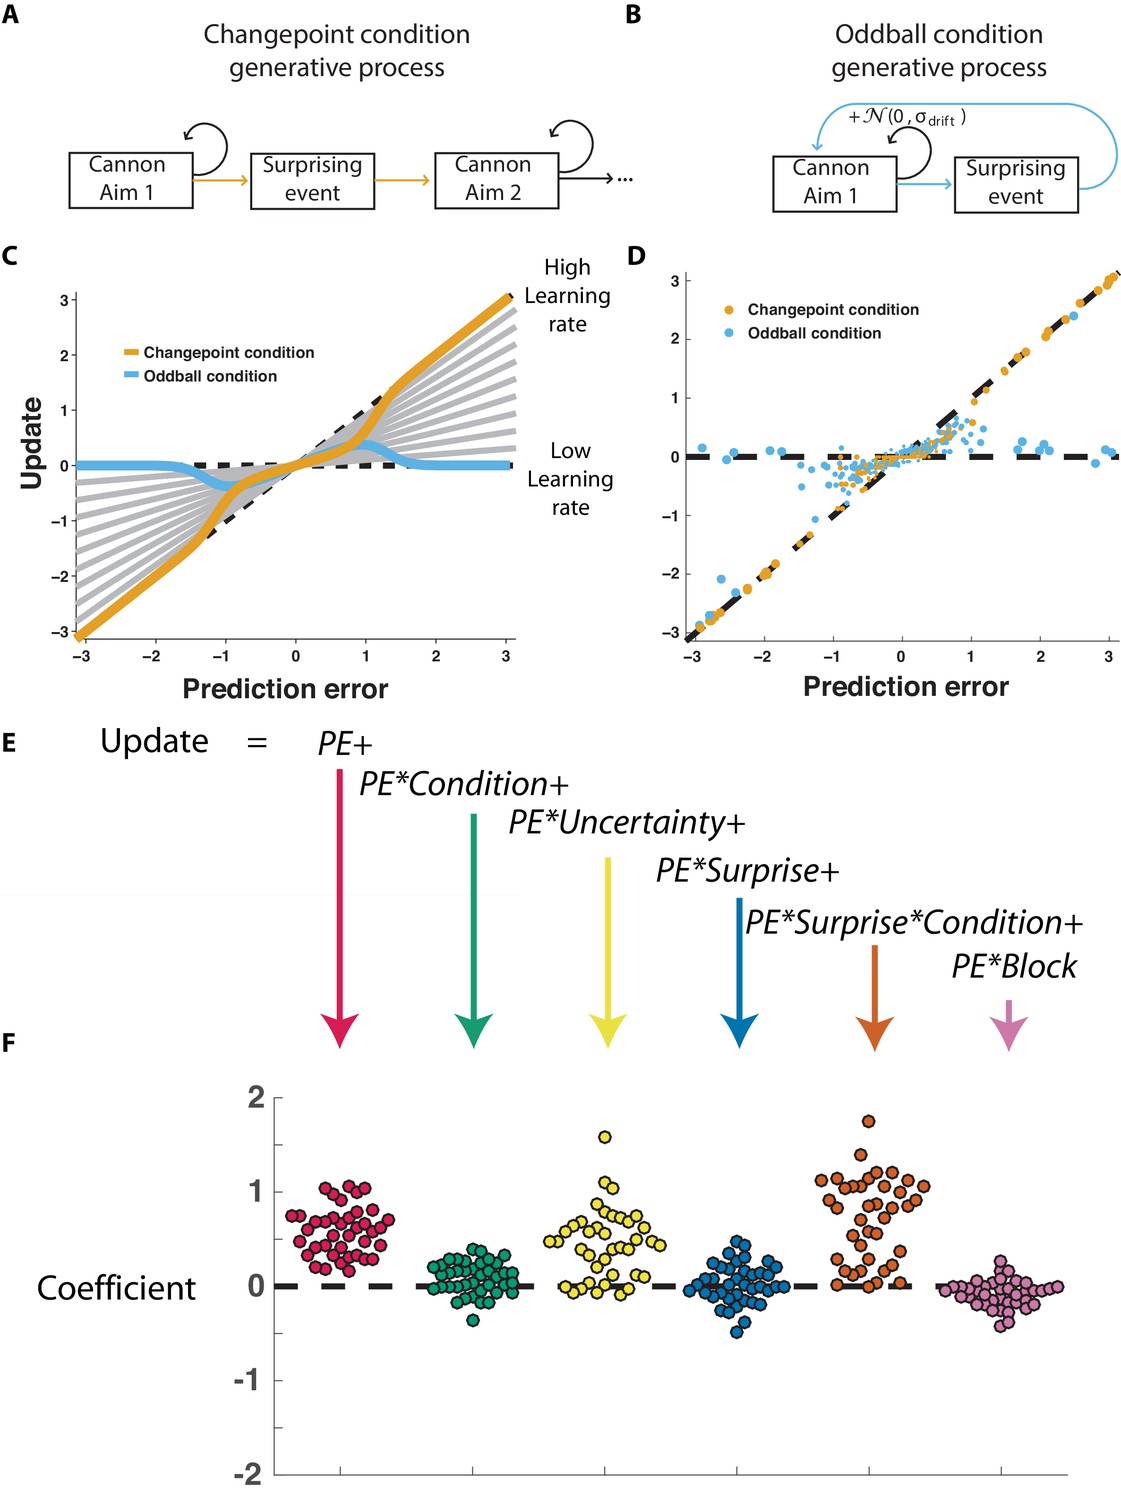
Participants scale learning according to surprise differently in changepoint and oddball contexts as would be expected for normative learning rate adjustment.
(A) In the changepoint condition, surprising events (changepoints) signaled a transition in the aim of the cannon whereas (B) in the oddball condition, surprising events (oddballs) were unrelated to the process through which the aim of the cannon transitioned. (C) Learning rate in the cannon task can be described by the slope of the relationship between prediction error (signed distance between cannonball and shield; abscissa) and update (signed change in shield position after observing new cannonball location; ordinate). Fixed learning rate updating corresponds to a line in this space whose slope is uniform across prediction errors and reflects the learning rate (gray lines). In contrast, normative learning dictates that the slope should decrease for extreme prediction errors in the oddball condition (blue) but increase for extreme prediction errors in the changepoint condition (orange). (D) Prediction error (abscissa) and update (ordinate) for each trial (points) in each condition (designated by color) completed by a single example participant. Size of points is inversely related to density of data for improved visualization. (E) Trial updates for each subject were fit with a regression model that included prediction errors (to measure fixed learning rate) as well as several interaction terms to assess how learning depended on various factors. (F) Coefficients from regression model fit to individual subjects (points) revealed an overall tendency to update toward recent cannonball locations (red, t = 14.4, dof = 38, p=10−17), and a tendency to do so more in the changepoint condition (green, t = 3.1, dof = 38, p=0.003), when uncertain (yellow, t = 7.5, dof = 38, p=4×10⁻⁹), and on trials where the cannonball was not blocked by the shield (pink, t = −3.4, dof = 38, p=0.001). The model revealed that there was no consistent effect of surprise on learning across both conditions (blue, t = 0.8, dof = 38, p=0.43), but that there was a strong interaction between surprise and condition (orange, t = 9.9, dof = 38, p=4×10⁻¹²) whereby surprise tended to increase learning in the changepoint condition but decrease learning in the oddball condition.
Figure 2—figure supplement 1
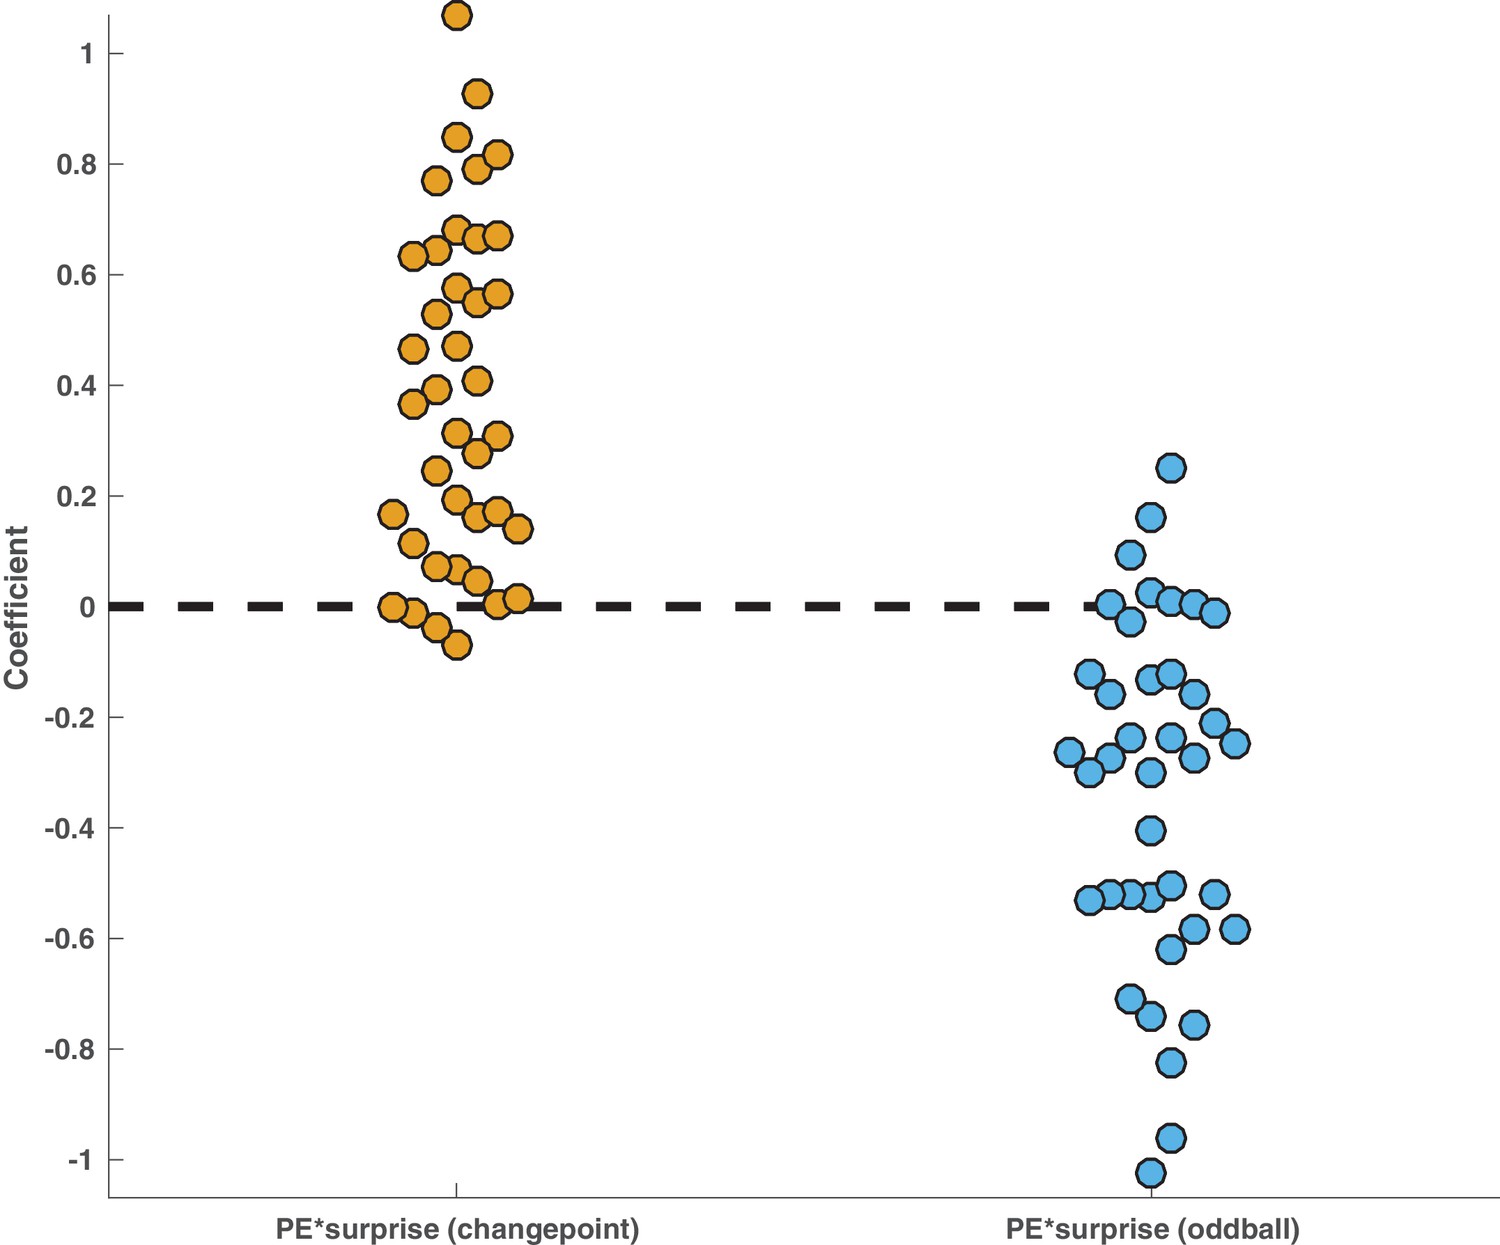
Behavioral interaction was driven by positive effects of surprise on learning in the changepoint condition and negative effects of surprise on learning in the oddball condition.
Model described in Figure 2E was altered such that PE*Surprise and PE*Surprise*Condition terms were replaced with two terms that separately modeled the effect of surprise on updating behavior in the changepoint condition (left, yellow) and in the oddball condition (right, blue). Points reflect maximum likelihood coefficient values estimated for individual subjects. Mean effect across participants was positive in the changepoint condition (mean/SEM beta = 0.38/0.05, t = 7.7, dof = 38, p=2×10e-9) and negative in the oddball condition (mean/SEM beta = −0.33/0.05, t = −6.6, dof = 38, p=8×10e-8).
Figure 3 with 2 supplements
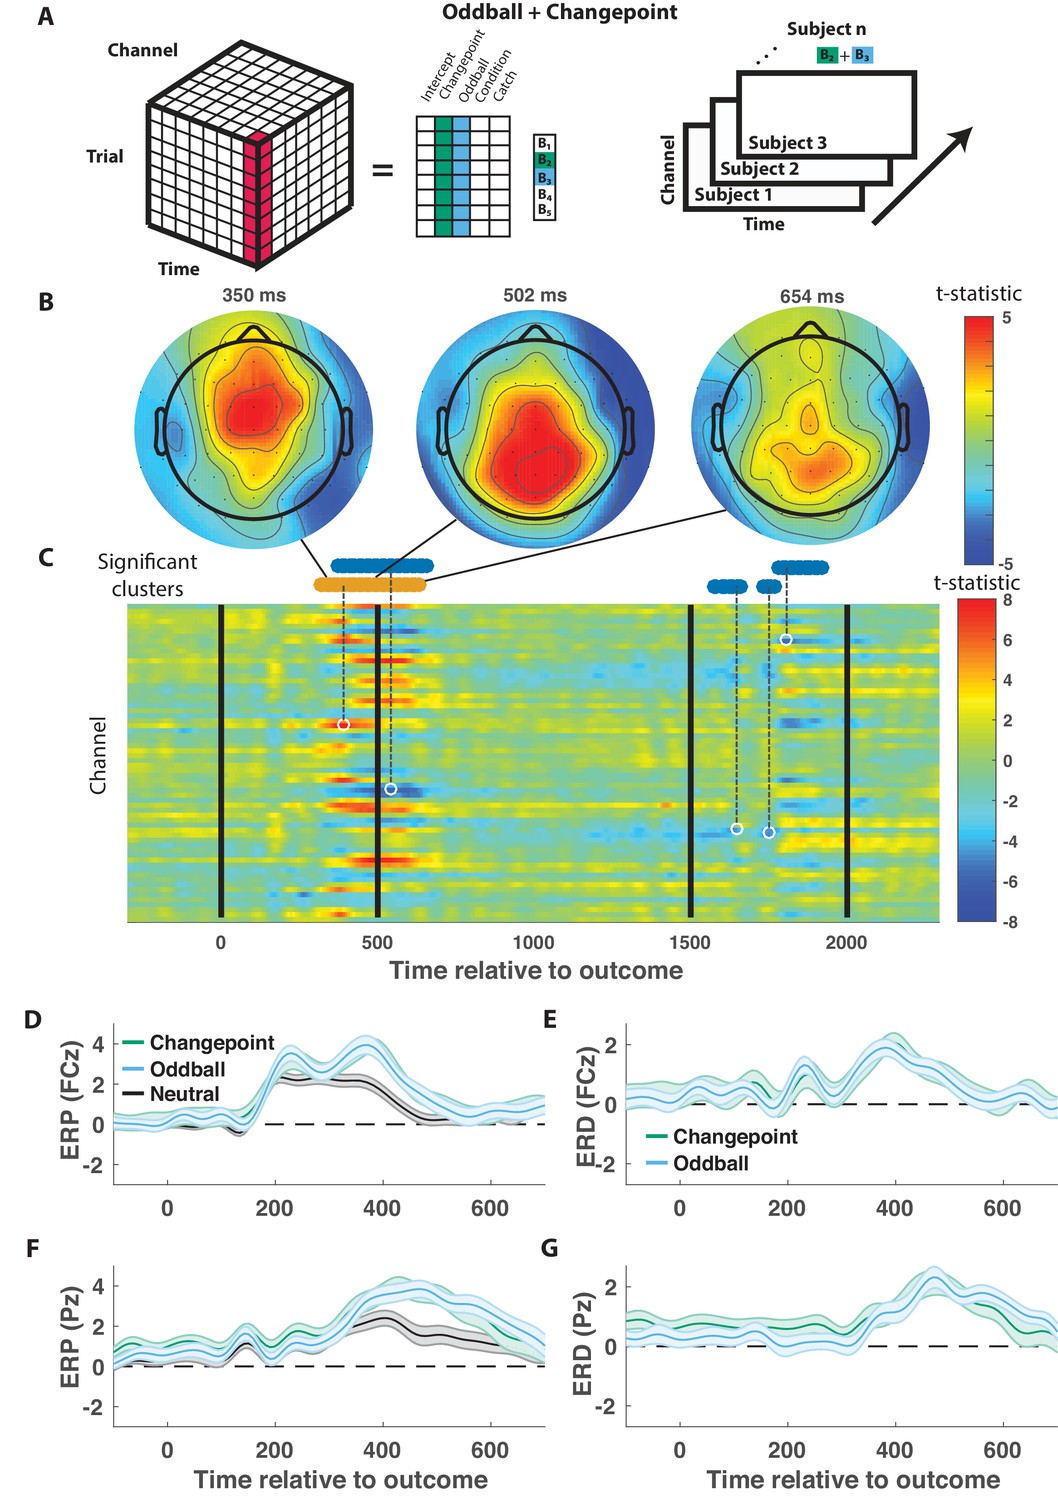
Outcome-locked central positivity reflects surprise irrespective of context.
(A) Trial-series of EEG data for a given electrode and timepoint was regressed onto an explanatory matrix that contained separate binary regressors for changepoint and oddball trials (left). A t-statistic map was created for each electrode and time point on the surprise coefficient contrast (right). (B and C) T-statistic map for surprise contrast across time (abscissa; C) and channel (ordinate; C) along with corresponding topoplots (B). The time course of spatiotemporal clusters that survived multiple comparisons correction via permutation testing is depicted above heat plot (orange indicates positive cluster, blue indicates negative). The time and channel corresponding to the maximum absolute t-statistic for each such cluster are depicted with a white circle and connected to their respective cluster with a dashed line (C). (D and F) Mean/SEM (line/shading) event related potentials (ERP, microvolts) sorted by trial type (orange = changepoint, blue = oddball, black = other trials) for frontocentral (D; FZc) and central posterior (F; Pz) electrodes. (E and G) Mean/SEM (line/shading) event related difference (ERD) waveforms computed by subtracting the ERP for ‘neutral’ trials (eg. trials where outcome emerged from the expected generative process) from the average ERP for changepoint and oddball trials at frontocentral (E; FZc) and central posterior (G; Pz) electrodes.
Figure 3—figure supplement 1
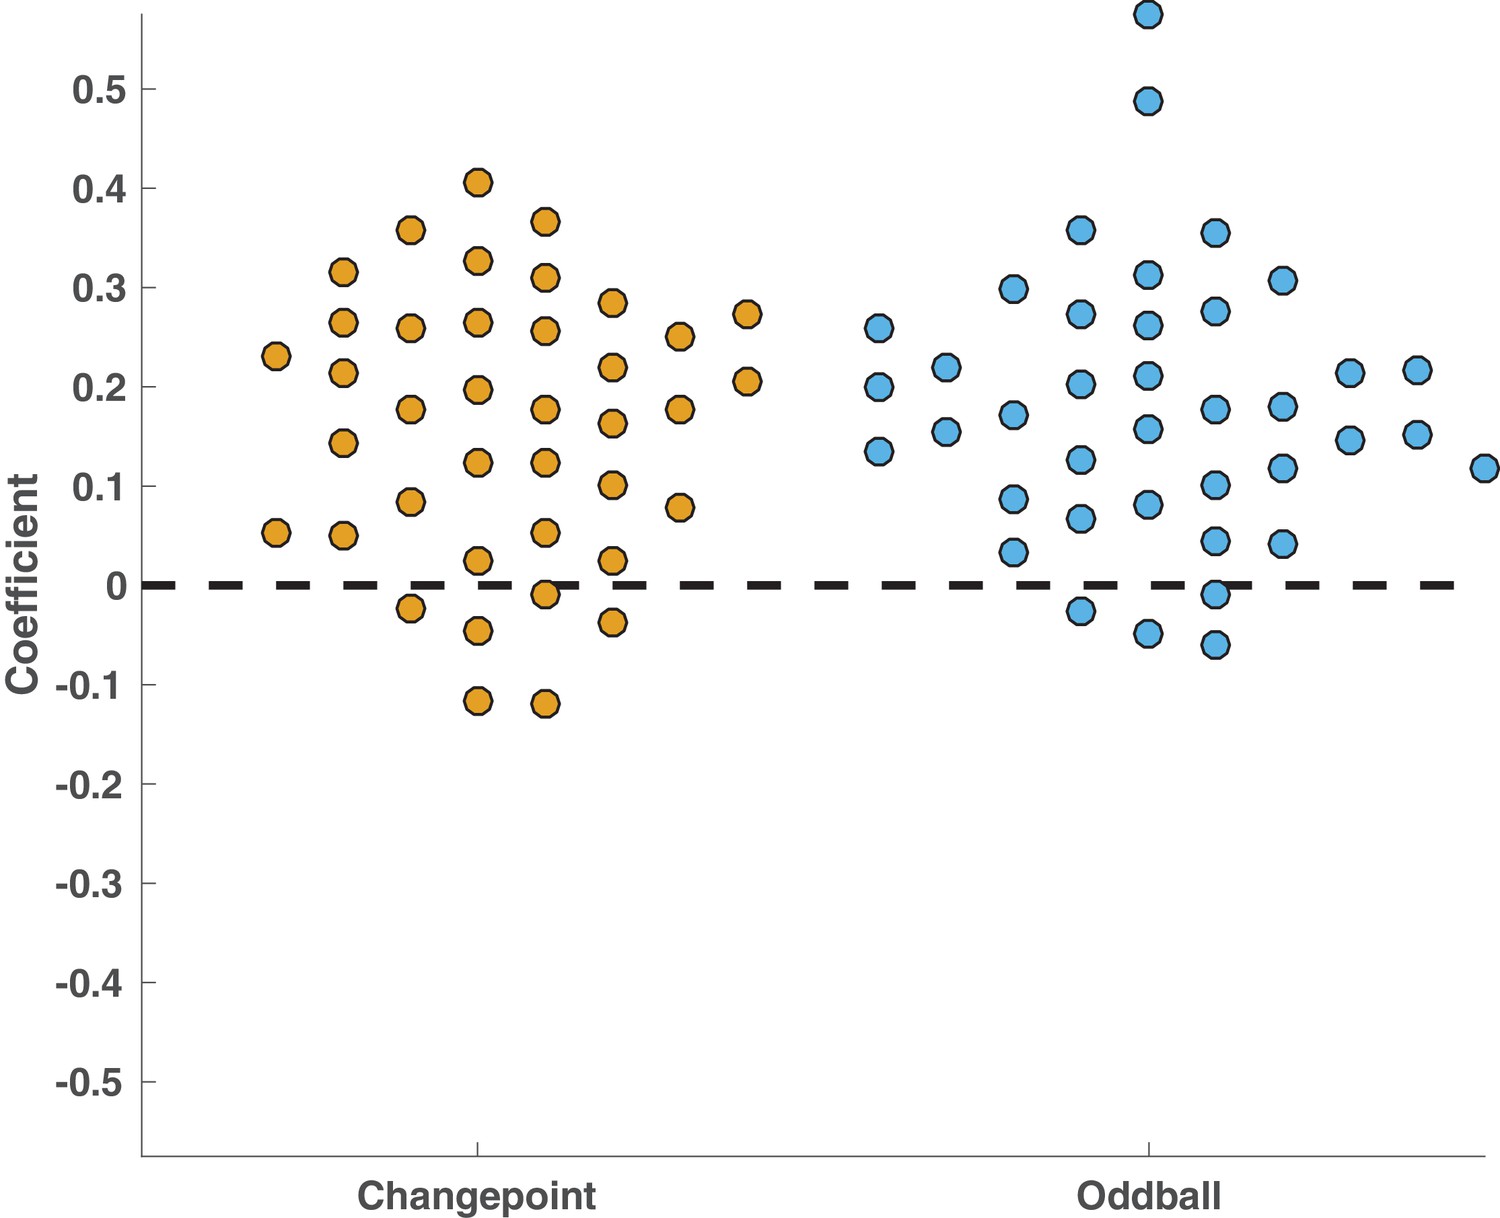
P300 spatiotemporal cluster reflected surprise in both changepoint and oddball conditions.
Raw regression coefficients computed per subject (points) averaged across electrode/timepoints for P300 component. Within these clusters, both changepoint (yellow) and oddball (blue) coefficients were consistently positive across subjects and similar in magnitude for the two conditions (Both t-statistics > 7, both p values < 10e-8).
Figure 3—figure supplement 2
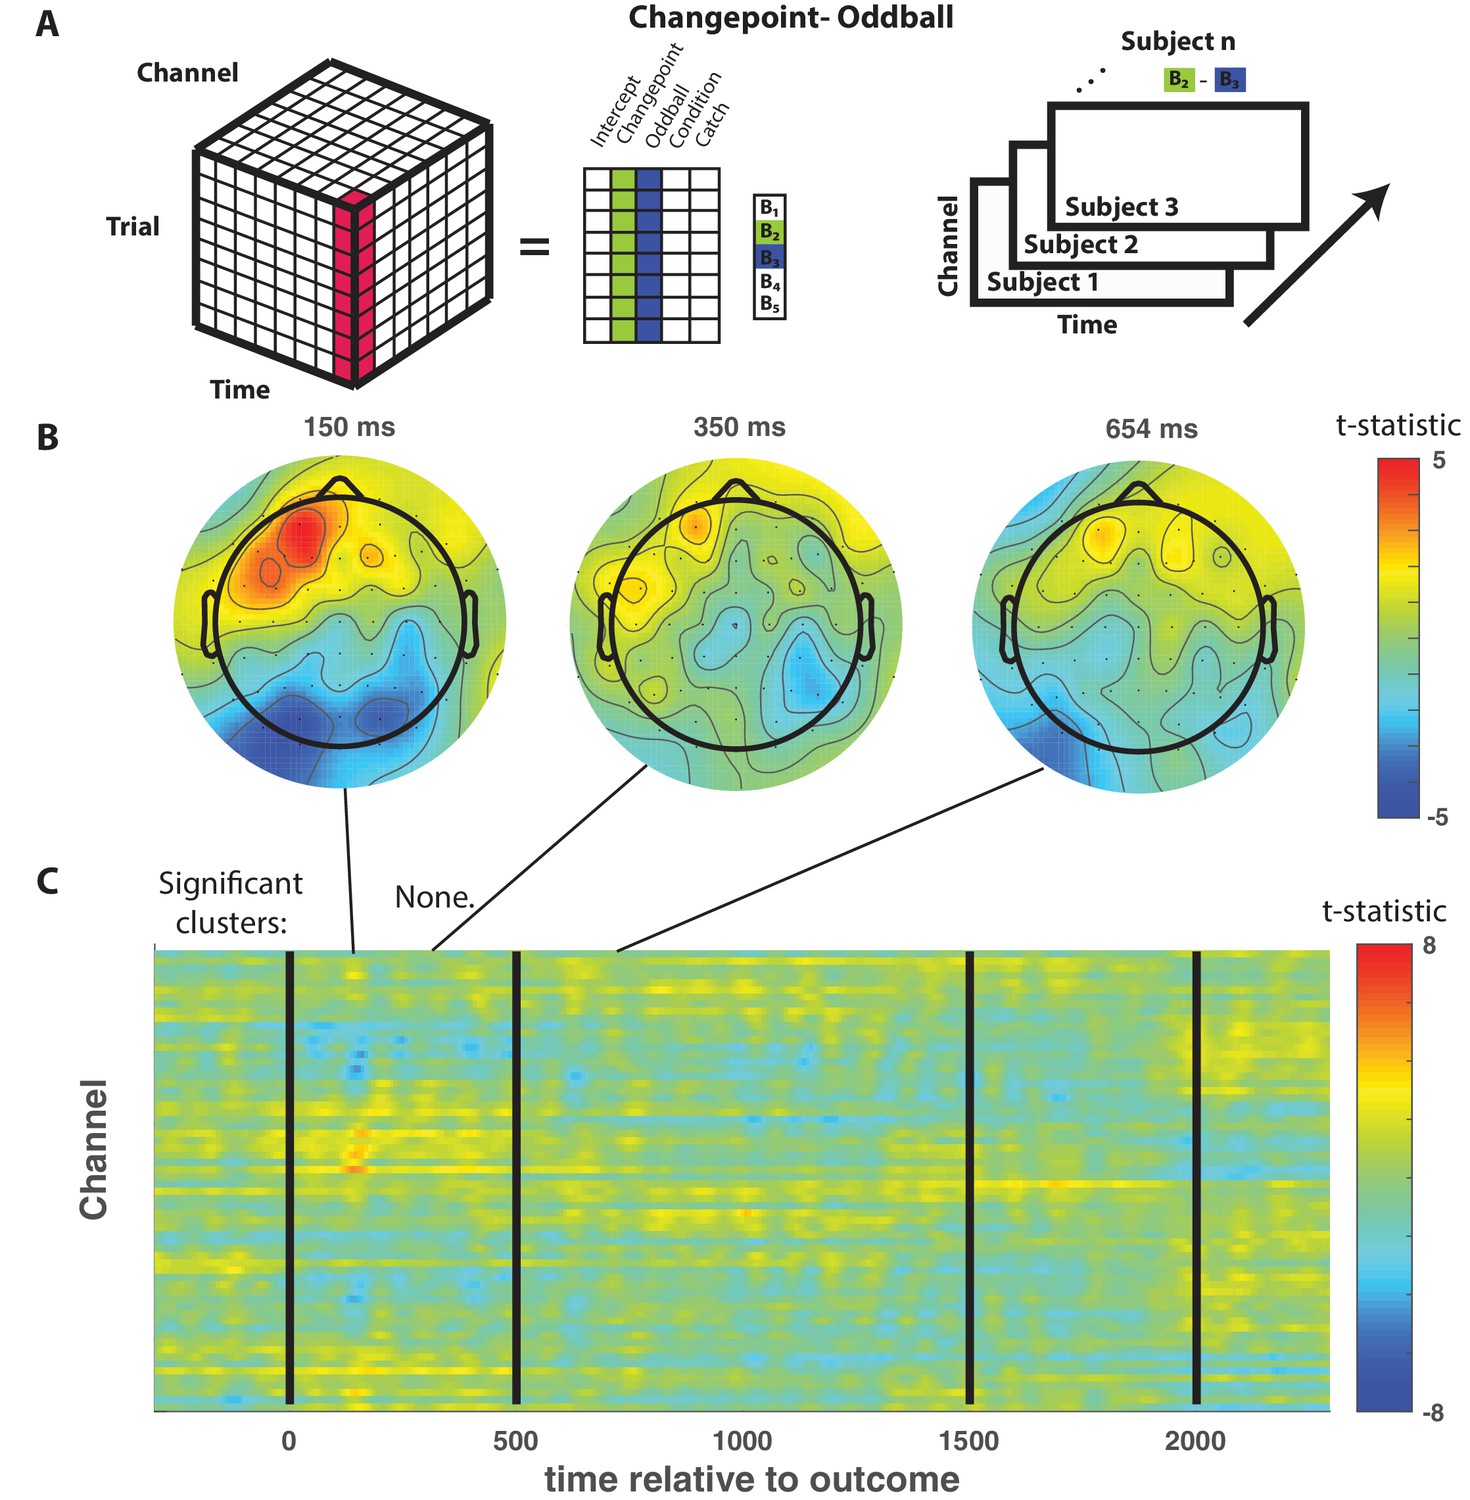
The difference between changepoint and oddball events was not reflected by any event related EEG signal.
(A) Trial-series of EEG data for a given electrode and timepoint was regressed onto an explanatory matrix that contained separate binary regressors for changepoint and oddball trials (left). A t-statistic map was created for each electrode and time point on the learning contrast (right). (B and C) T-statistic map for learning contrast across time (abscissa; C) and channel (ordinate; C) along with corresponding topoplots (B). No spatiotemporal clusters survived multiple comparisons correction via permutation testing.
Figure 4 with 1 supplement
Central positivity predicts learning in opposite directions for changepoint and oddball contexts.
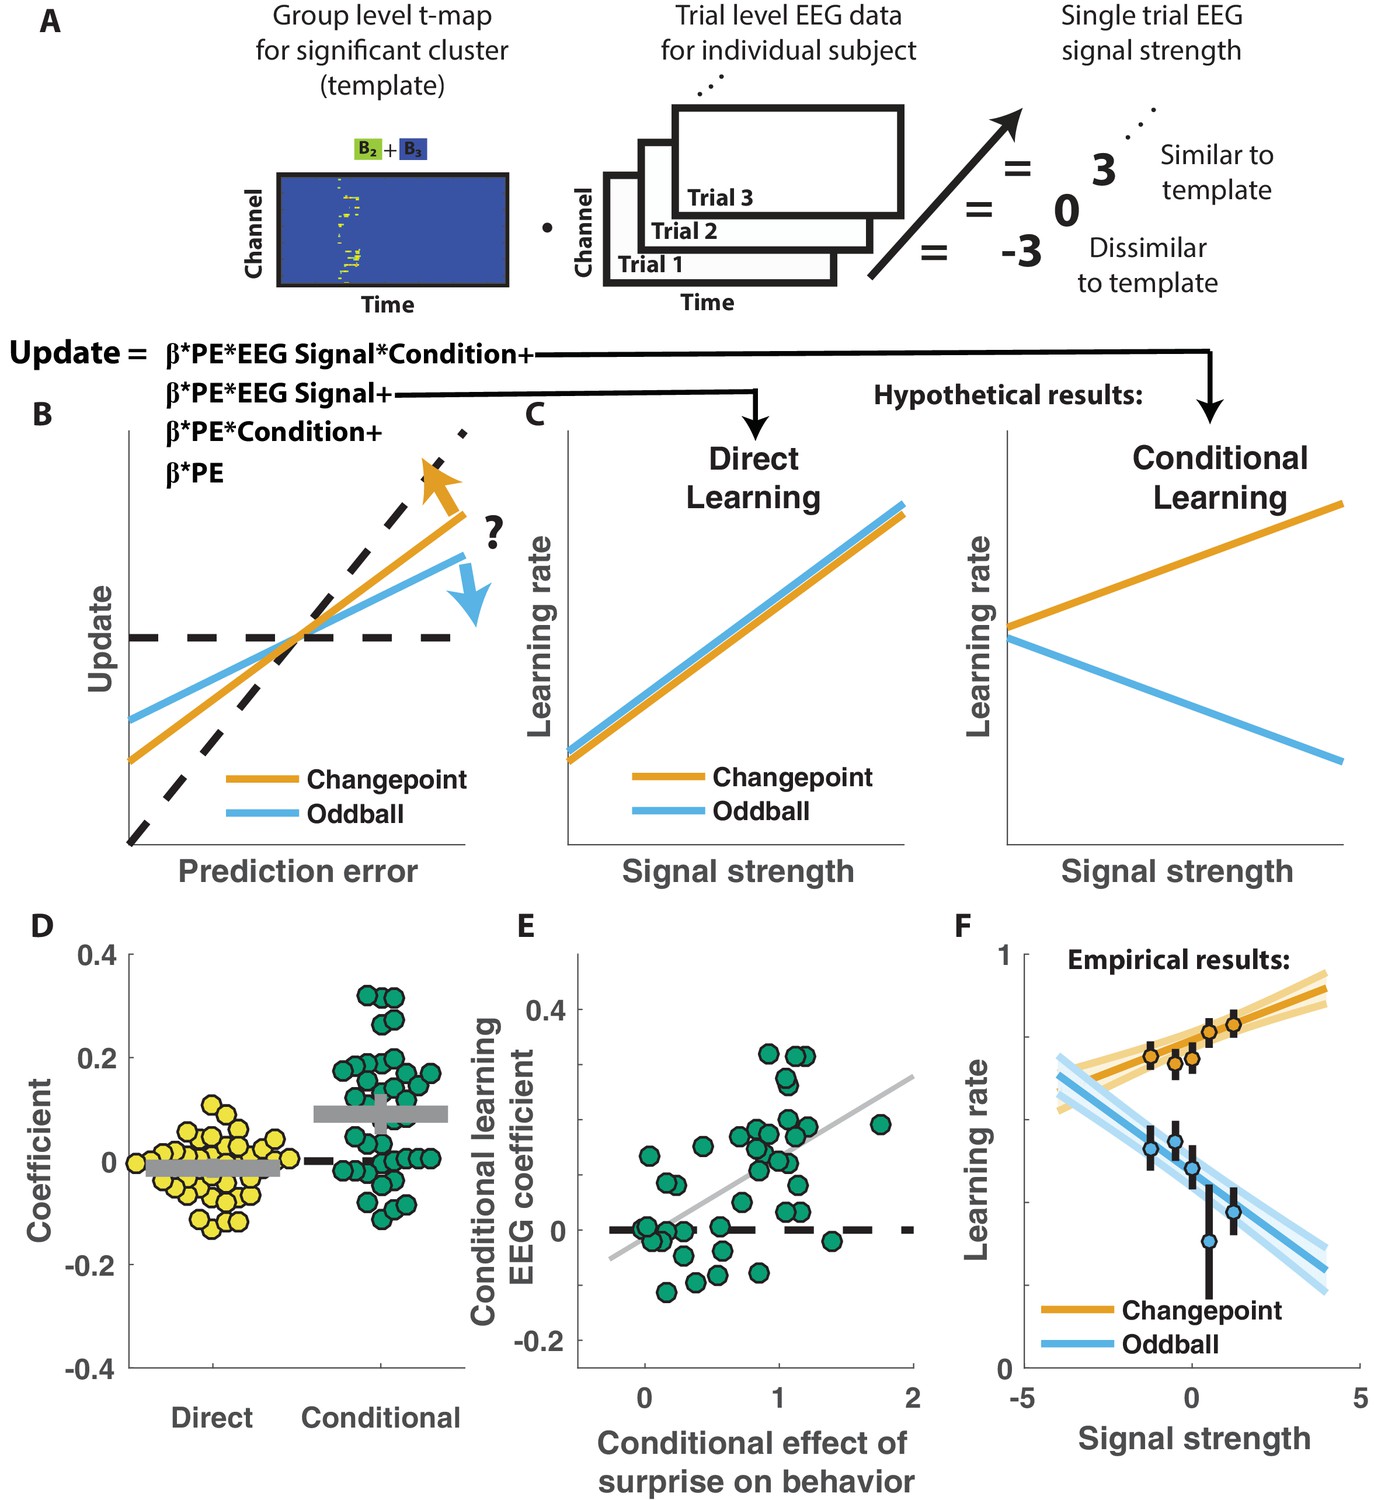
(A) T-maps corresponding to significant spatiotemporal clusters were used as templates to estimate trial-by-trial signal strength. (B) Single trial updates for each participant were fit with a regression model that included additional terms to describe 1) the degree to which learning was increased on trials in which the EEG signal was stronger (PE times EEG signal) as would be expected for a canonical learning signal and 2) the degree to which learning was conditionally modulated by the EEG signal (PE times condition times EEG signal) as would be expected for a surprise signal that influenced downstream learning computations. (C) Hypothetically, the learning rate (slope of the relationship between updates and prediction errors) might increase for stronger EEG signals (left) which would be captured by the PE times EEG direct learning regressor. Alternatively, the learning rate may increase for stronger EEG signals in the changepoint condition and decrease for stronger EEG signals in the oddball condition, as measured by the conditional learning regressor. (D) Individual participant coefficients (points) revealed no significant main effect of P300 signals on direct learning (yellow), but a strong positive interaction (conditional learning) effect (green), indicating that the signals were differentially predictive of learning in the changepoint and oddball conditions. (E) Individual differences in the degree to which P300 signals conditionally predicted learning (ordinate) were related to differences in the degree to which those participants conditionally modulated updating according to surprise (abscissa, same as orange points in Figure 2F). Participants who conditionally adjusted their treatment of surprising information the most (right most points) had P300 signals that had stronger conditional relationships to their updating behavior (upper points). (F) Learning rates predicted by the regression model (ordinate) increased as a function of P300 signal strength (abscissa) in the changepoint condition (orange) but decreased as a function of signal strength in the oddball condition (blue). Regression model predictions line up well with learning rates estimated for five bins of P300 signal strength across the two conditions (points/lines reflect mean/SEM learning rate estimated across participants for each bin).
Figure 4—figure supplement 1
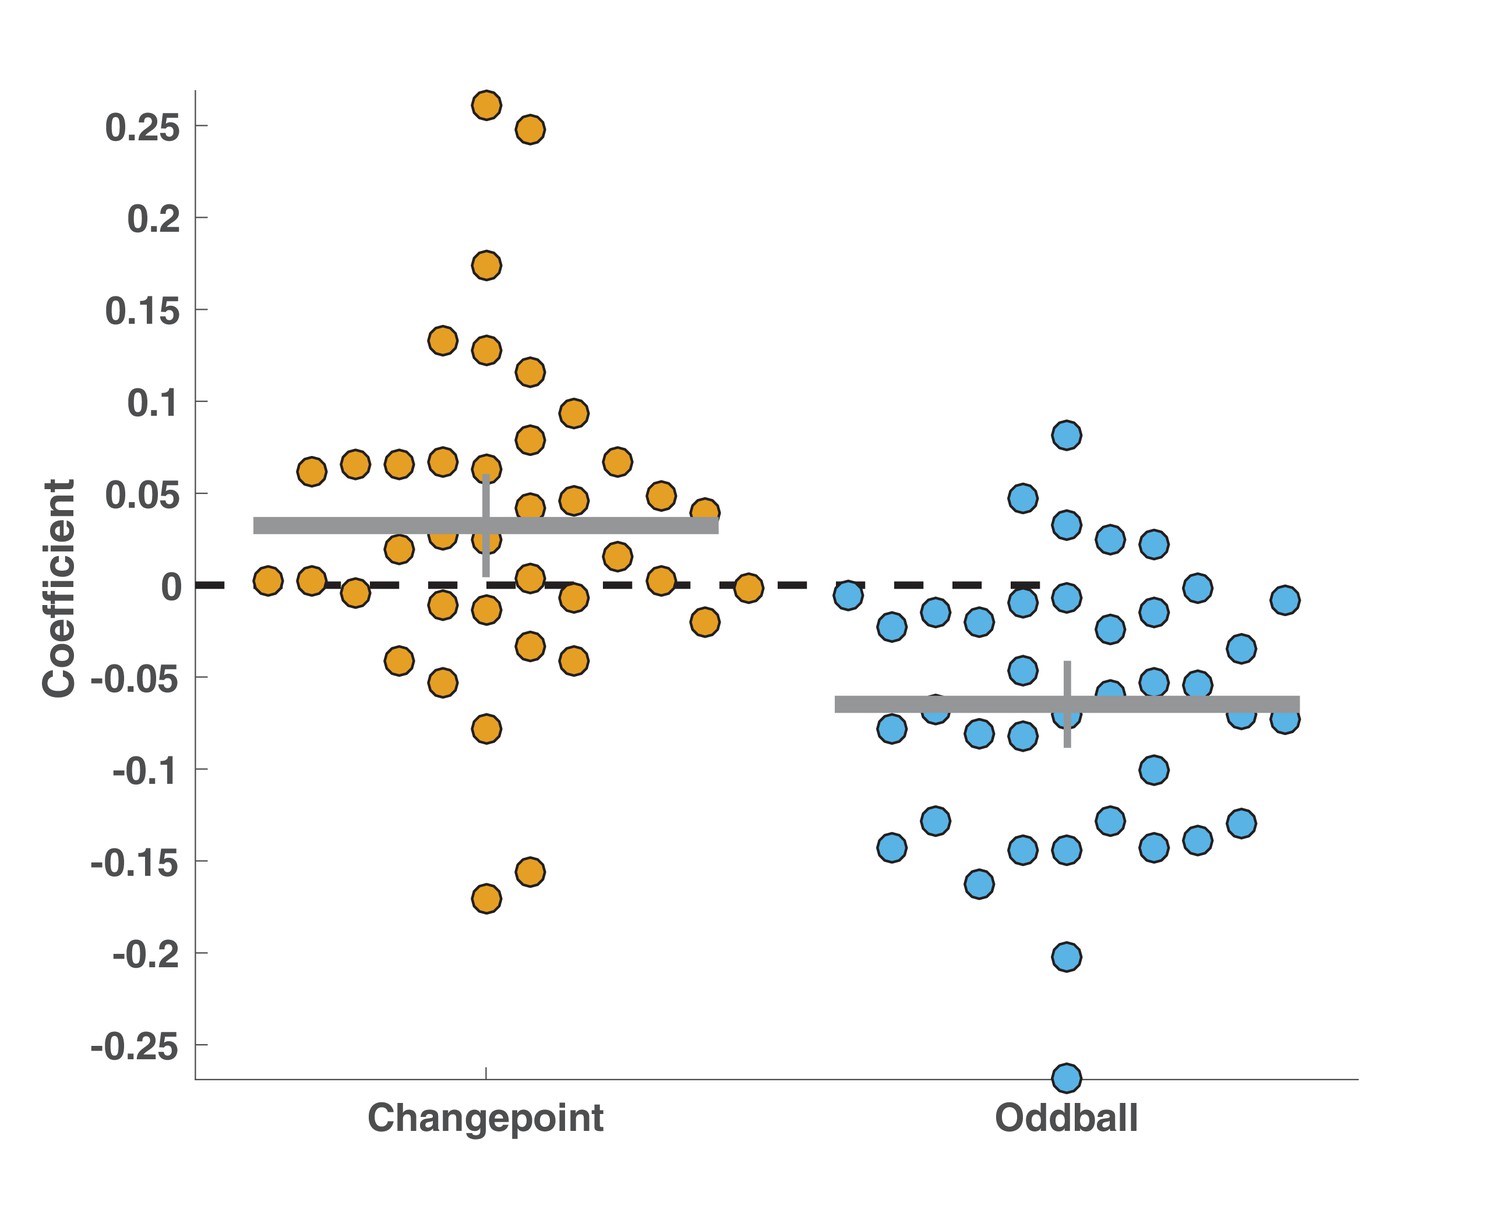
Conditional learning effect was driven by positive effects of EEG signals on learning in the changepoint condition and negative effects of EEG signals on learning in the oddball condition.
Points reflect best-fitting coefficients for individual subjects in an alternative model of update behavior that included separate PE*EEG signal terms for the two different task conditions. Bar and whiskers reflect mean and 95% confidence intervals. Coefficients tended to be positive across participants for the changepoint condition (mean/SEM beta = 0.03/0.01, t = 2.3, dof = 37, p=0.02) and negative across participants for the oddball condition (mean/SEM beta = −0.06/0.01, t = −5.5, dof = 37, p=2.4×10e-6).
Figure 5
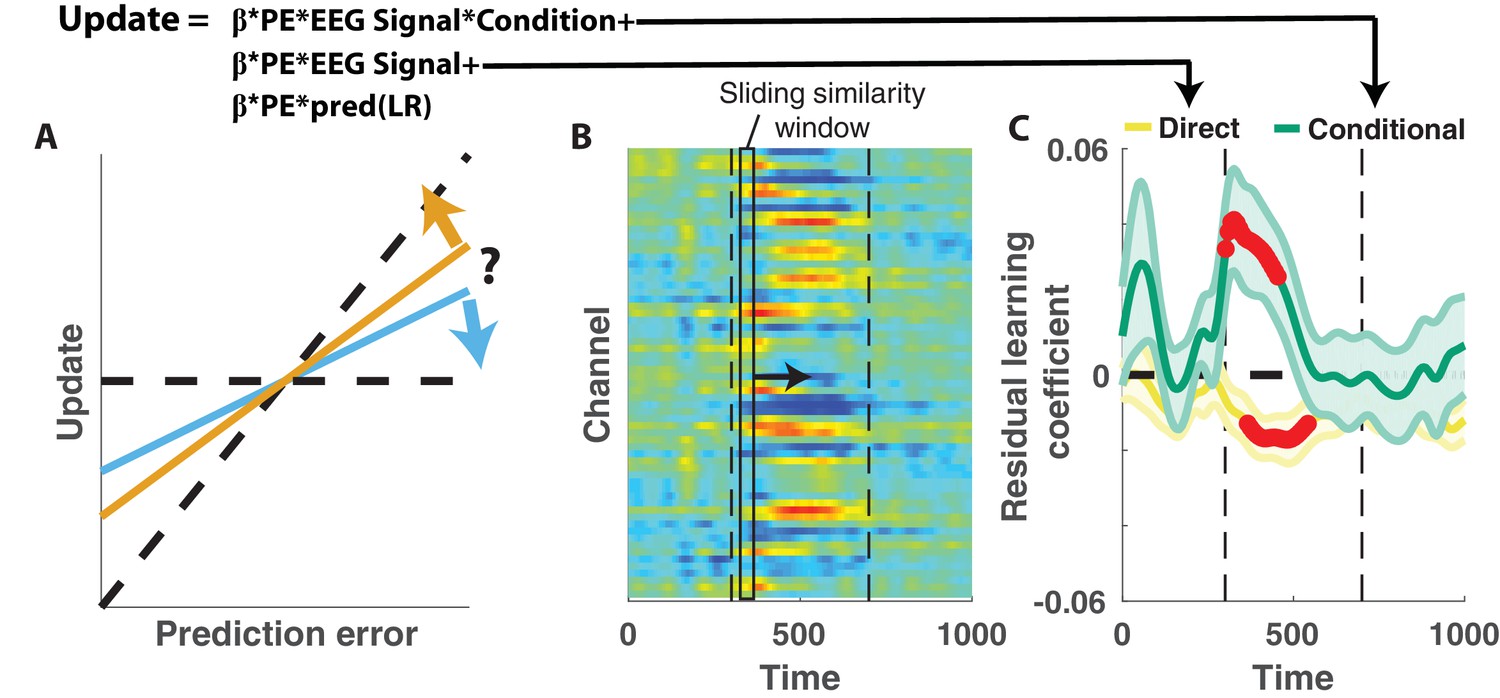
Central positivity explains trial-to-trial learning behavior that could not be otherwise captured through behavioral modeling.
(A) Single trial updates for each participant were fit with a regression model that included the best estimates of learning rate provided by our behavioral regression model (β times PE times pred(LR)) as well as additional terms to describe the degree to which learning was increased on trials in which an EEG signal was present or the degree to which learning was contextually modulated by the EEG signal. (B) Regression was performed using EEG signal strength computed in 40 ms sliding windows following the time of the outcome. EEG signal strength within a given sliding window for a given trial was computed as the dot product of the baseline corrected ERPs within the window (depicted by rectangle) and the unthresholded t-statistic map for the Changepoint plus Oddball contrast (depicted in heatmap). This measure allowed us to examine how the relationship between P300 and behavior evolved over the time course of the P300 signal [300–700 ms, marked with vertical dotted lines]. (C) Direct learning (ordinate; yellow) and conditional learning (ordinate; green) coefficients for EEG terms in the regression model are plotted across time (abscissa). Lines/shading reflect mean/SEM coefficients and red points reflect periods over which coefficient values deviated significantly from zero (permutation test on cluster mass: cluster mass/p value = 61.8/0.01 for direct learning and 52.8/0.01 for conditional learning coefficients respectively).
Appendix 1—figure 1

Graphical generative model for changepoint (left) and oddball (right) task conditions.
Subscripts denote time, colored arrows depict the causal influence of an unlikely event (oddball or changepoint) on current and future outcomes. Note that changepoints (left) affect both current and future outcomes (yellow arrows) whereas oddballs (right) only affect current outcomes (blue arrow).
Appendix 1—figure 2

Optimal and approximate inference through message passing algorithms.
Exact parametric solutions to inference in the changepoint (left) and oddball (right) are possible for a given event history (e.g., S is known at all timesteps). Exact solutions can be approximated by adding an additional step to the full message passing algorithm, in which the mixture distribution (composed of the S = 0 and S = 1 node) is approximated with a Gaussian distribution (yellow stripes) by matching the first two moments of the distributions (Nassar et al., 2012).
Author response image 1

Robustness check on exclusion crierion value.
Top: proportion of good epochs for each participant. Middle/bottom: analysis results for different exclusion criteria. Lines/shading reflect mean/SEM conditional learning coefficients in the base model (middle) and the model that included predictions for our best behavioral model (bottom). Early (yellow) and late (green) clusters are plotted for all possible exclusion criterion values (abscissa) and significance of t-test on the average of the two clusters is indicated by pink points (blue points indicate lack of significance).
Additional files
-
Transparent reporting form
- https://doi.org/10.7554/eLife.46975.011
Download links
A two-part list of links to download the article, or parts of the article, in various formats.
Downloads (link to download the article as PDF)
Open citations (links to open the citations from this article in various online reference manager services)
Cite this article (links to download the citations from this article in formats compatible with various reference manager tools)
Statistical context dictates the relationship between feedback-related EEG signals and learning
eLife 8:e46975.
https://doi.org/10.7554/eLife.46975


