Evidence for DNA-mediated nuclear compartmentalization distinct from phase separation
- University of California, Berkeley, United States
- University of British Columbia, Canada
- Howard Hughes Medical Institute, University of California, Berkeley, United States
Figures
Figure 1 with 3 supplements
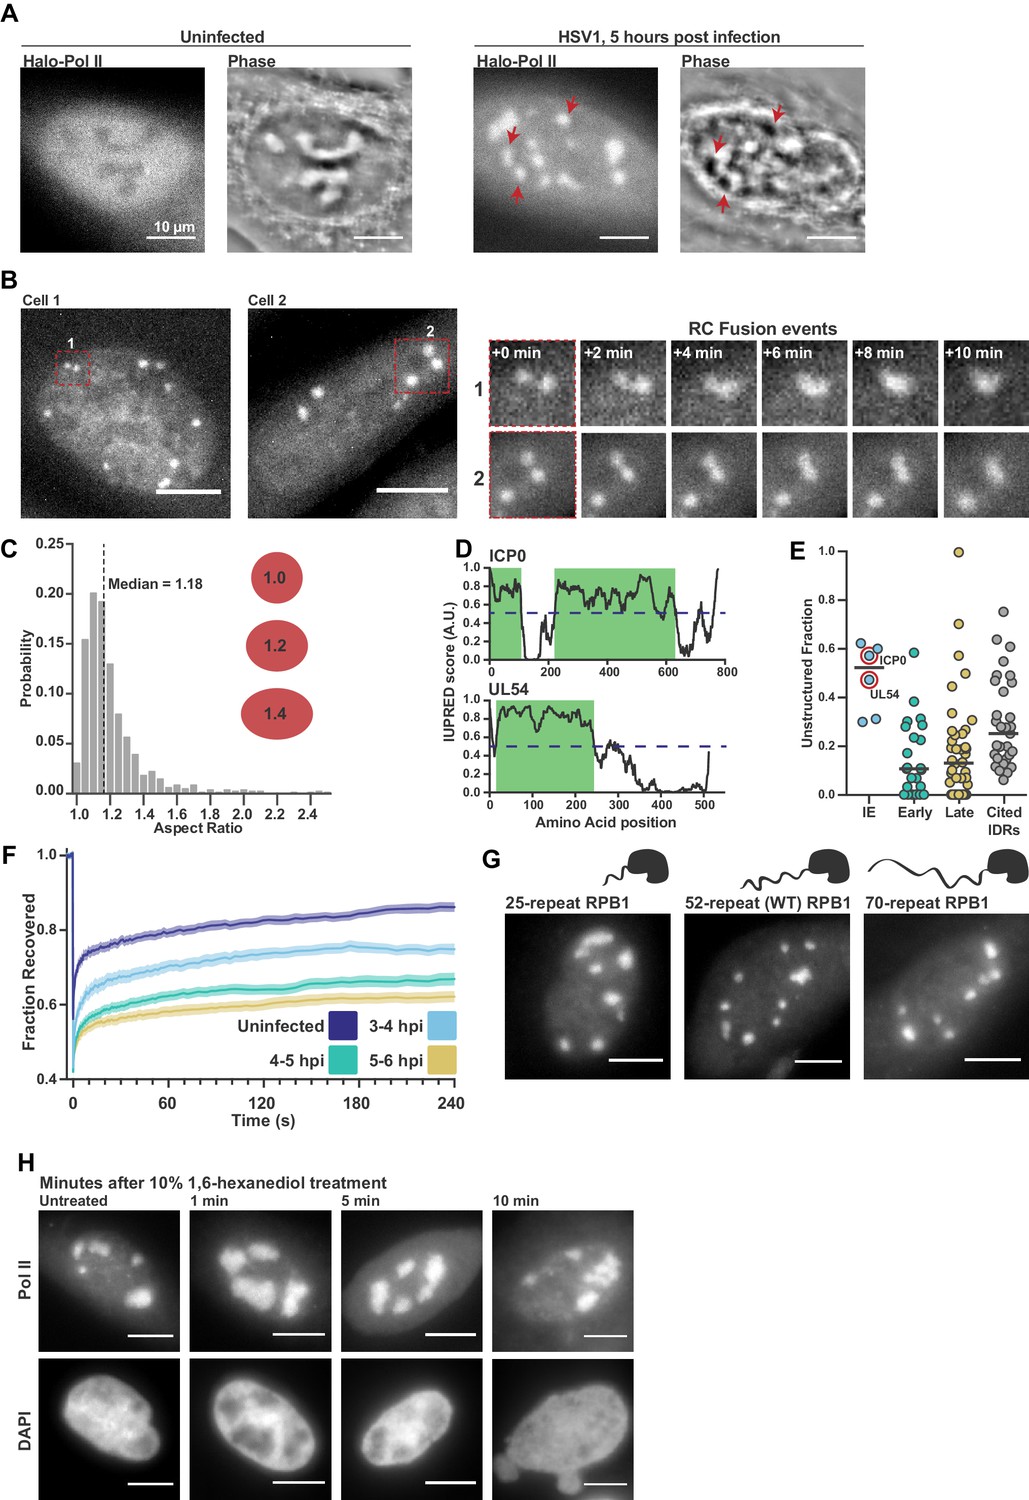
Pol II recruitment to Replication Compartments exhibits hallmarks of liquid-liquid demixing.
(A) Representative fluorescence and phase images in uninfected and infected cells. RCs shows a different phase value compared with the surrounding nucleoplasm. Red arrows show matched examples of RCs in the two channels. (B) Time-lapse images of Pol II recruitment to RCs. Zoom in shows RC fusion events. See also Figure 1—video 1 and 2. (C) Aspect ratios (max diameter/min diameter) of RCs from 817 RCs in 134 cells, 3 to 6 hpi. Red ellipses provided a guide to the eye of different aspect ratios. (D) IUPred scores for two Immediate Early viral proteins, ICP0 and UL54, as a function of residue position. Green boxes are predicted IDRs. (E) The fraction of each protein in the viral proteome that is unstructured, separated by kinetic class. HSV1 proteins are compared to a curated list of proteins containing IDRs known to drive phase separation (Cited IDRs). (F) FRAP curves of Pol II in RCs from 3 to 4 hpi, 4–5 hpi, and 5–6 hpi (n = 24, 33, and 33), compared with uninfected cells (n = 31). Shown is the mean flanked by SEM. (G) Infected HaloTag-RPB1 cell lines with a C-terminal domain containing different numbers of heptad repeats. (H) Pol II localization 1, 5 and 10 min after 10% 1,6-hexanediol treatment. All scale bars are 10 µm. Source data for of the list of IDRs in the HSV genome as well as previously cited IDRs can be found in Figure 1—source datas 1 and 2, respectively.
-
Figure 1—source data 1
List of putative IDRs in the HSV1 genome identified by IUPred.
Each protein listed was analyzed as described in the Materials and methods section, and regions with an IUPred score of greater than 0.55 were recorded.
- https://doi.org/10.7554/eLife.47098.004
-
Figure 1—source data 2
List of proteins reported to undergo phase separation.
Gene name, organism of origin, size, and the fraction of the protein that scores as an IDR according to the analysis described in the Materials and methods section. References and the citation within and provided.
- https://doi.org/10.7554/eLife.47098.005
Figure 1—figure supplement 1

FET family IDRs are not recruited to RCs.
(A) Western blot of whole cell extracts of U2OS cells transfected with Halo-NLS, Halo-EWS(LC), Halo-FUS(LC), and Halo-Taf15(LC). (B–E) Two representative SNAPtag-Pol II cells expressing Halo-NLS (B), and the HaloTag fused to the IDRs from EWS (C), FUS (D), and Taf15 (E) (Chong et al., 2018). Cells were fixed 5 hr post infection. The Taf15 IDR has strong enough homotypic interactions to form puncta in nuclei (red arrows), but no IDR was enriched in RCs. All scale bars are 10 µm.
Figure 1—video 1
Time lapse movie of HaloTag-Pol II after HSV1 infection.
Cells were identified three hpi, and followed until they moved out of the focal plane.
Figure 1—video 2
Time lapse movie of HaloTag-Pol II after HSV1 infection.
https://doi.org/10.7554/eLife.47098.007
Figure 2 with 5 supplements
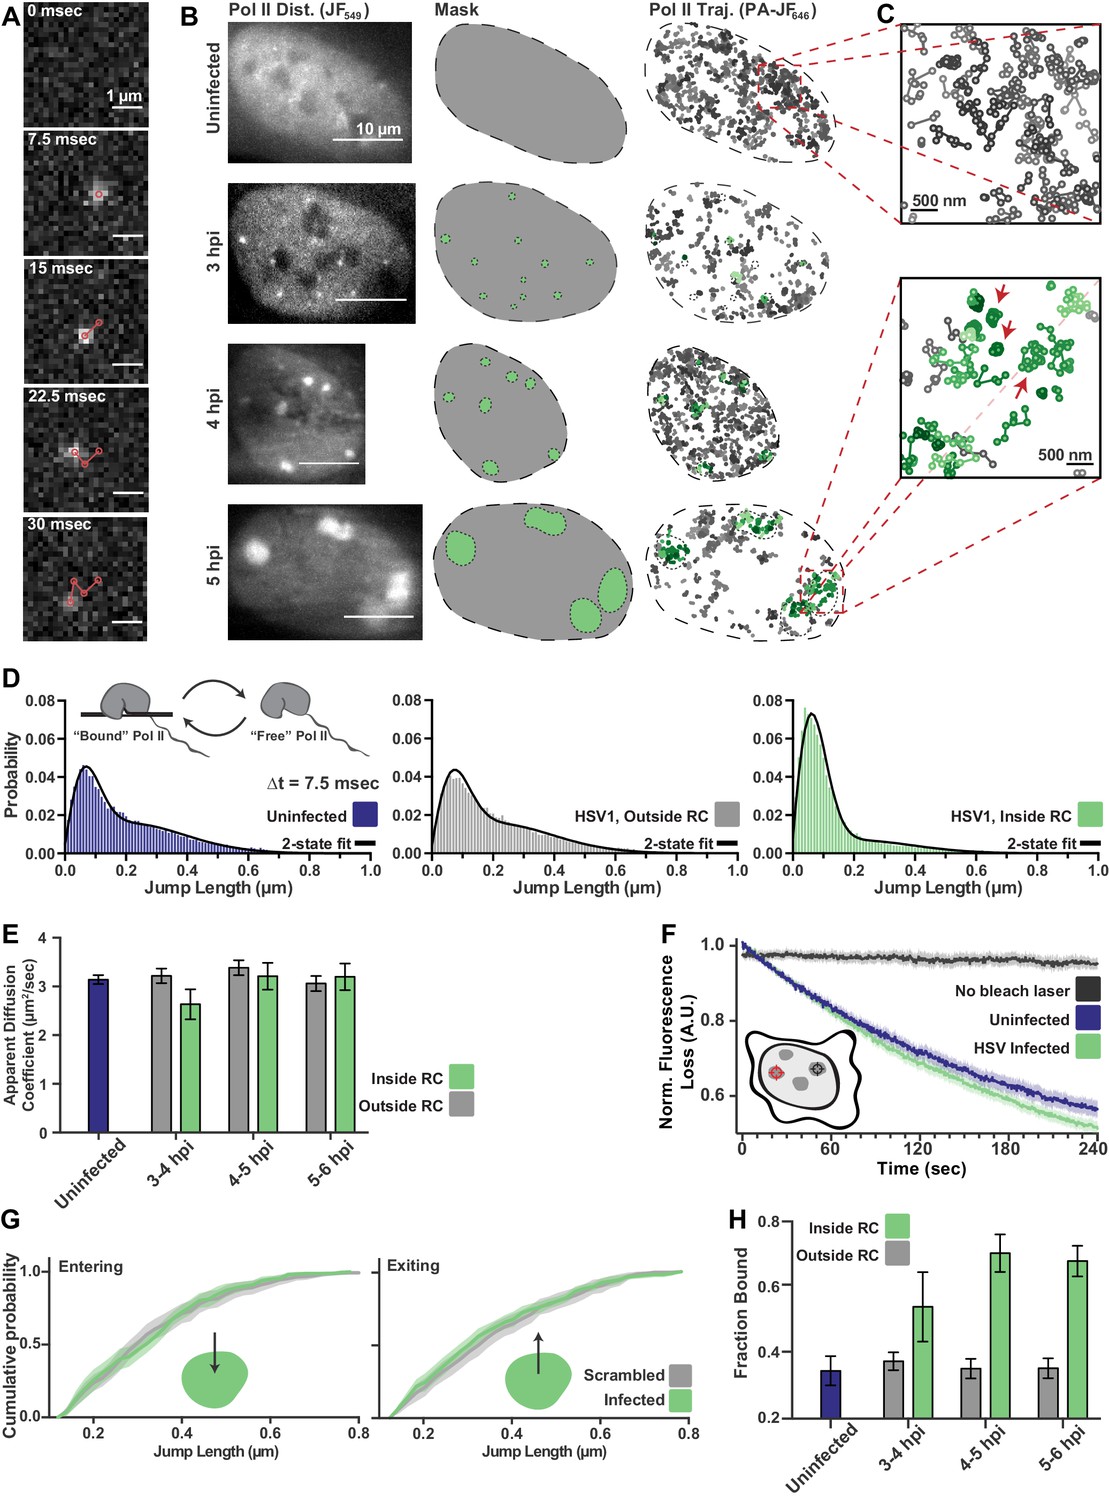
spaSPT of Pol II in infected cells shows no change in diffusion but an increase in binding.
(A) Example frames from spaSTP localization and tracking. Scale bar is 1 µm. (B) spaSPT experiments in infected cells at different times post infection. RCs are identified using Pol II fluorescence and used to make masks for sorting trajectories (green inside RCs; gray outside). (C) Zoom-in of trajectories in infected and uninfected cells. Red arrows show examples of traces with restricted movement. (D) Jump length distributions between consecutive frames of spaSPT trajectories. Histograms pooled from uninfected cells (n = 27), or HSV1 infected cells between 4 and 6 hpi (n = 96). Each distribution is fit with a two-state model. Inset shows depiction of two-state model where Pol II can either be freely diffusing or DNA-bound. (E) Mean apparent diffusion coefficient from the two-state fit in (D). Error bars are the standard deviation of the mean, calculated as described in Materials and methods. (F) FLIP curves comparing the rate of fluorescence loss after photobleaching Pol II in uninfected and HSV1 infected cells. Schematic shows location of bleaching laser (red crosshairs) and the region measured (black crosshairs). (G) Cumulative distribution function of the mean flanked by the SEM for jump lengths of molecules entering (left) or exiting (right) RCs. The distribution for HSV1-infected cells is compared to the distribution of jump lengths when RC annotations have been shuffled randomly. (H) Mean fraction of bound molecules from the two-state fit in (D). Error bars are the standard deviation of the mean, calculated as described in Materials and methods.
Figure 2—figure supplement 1
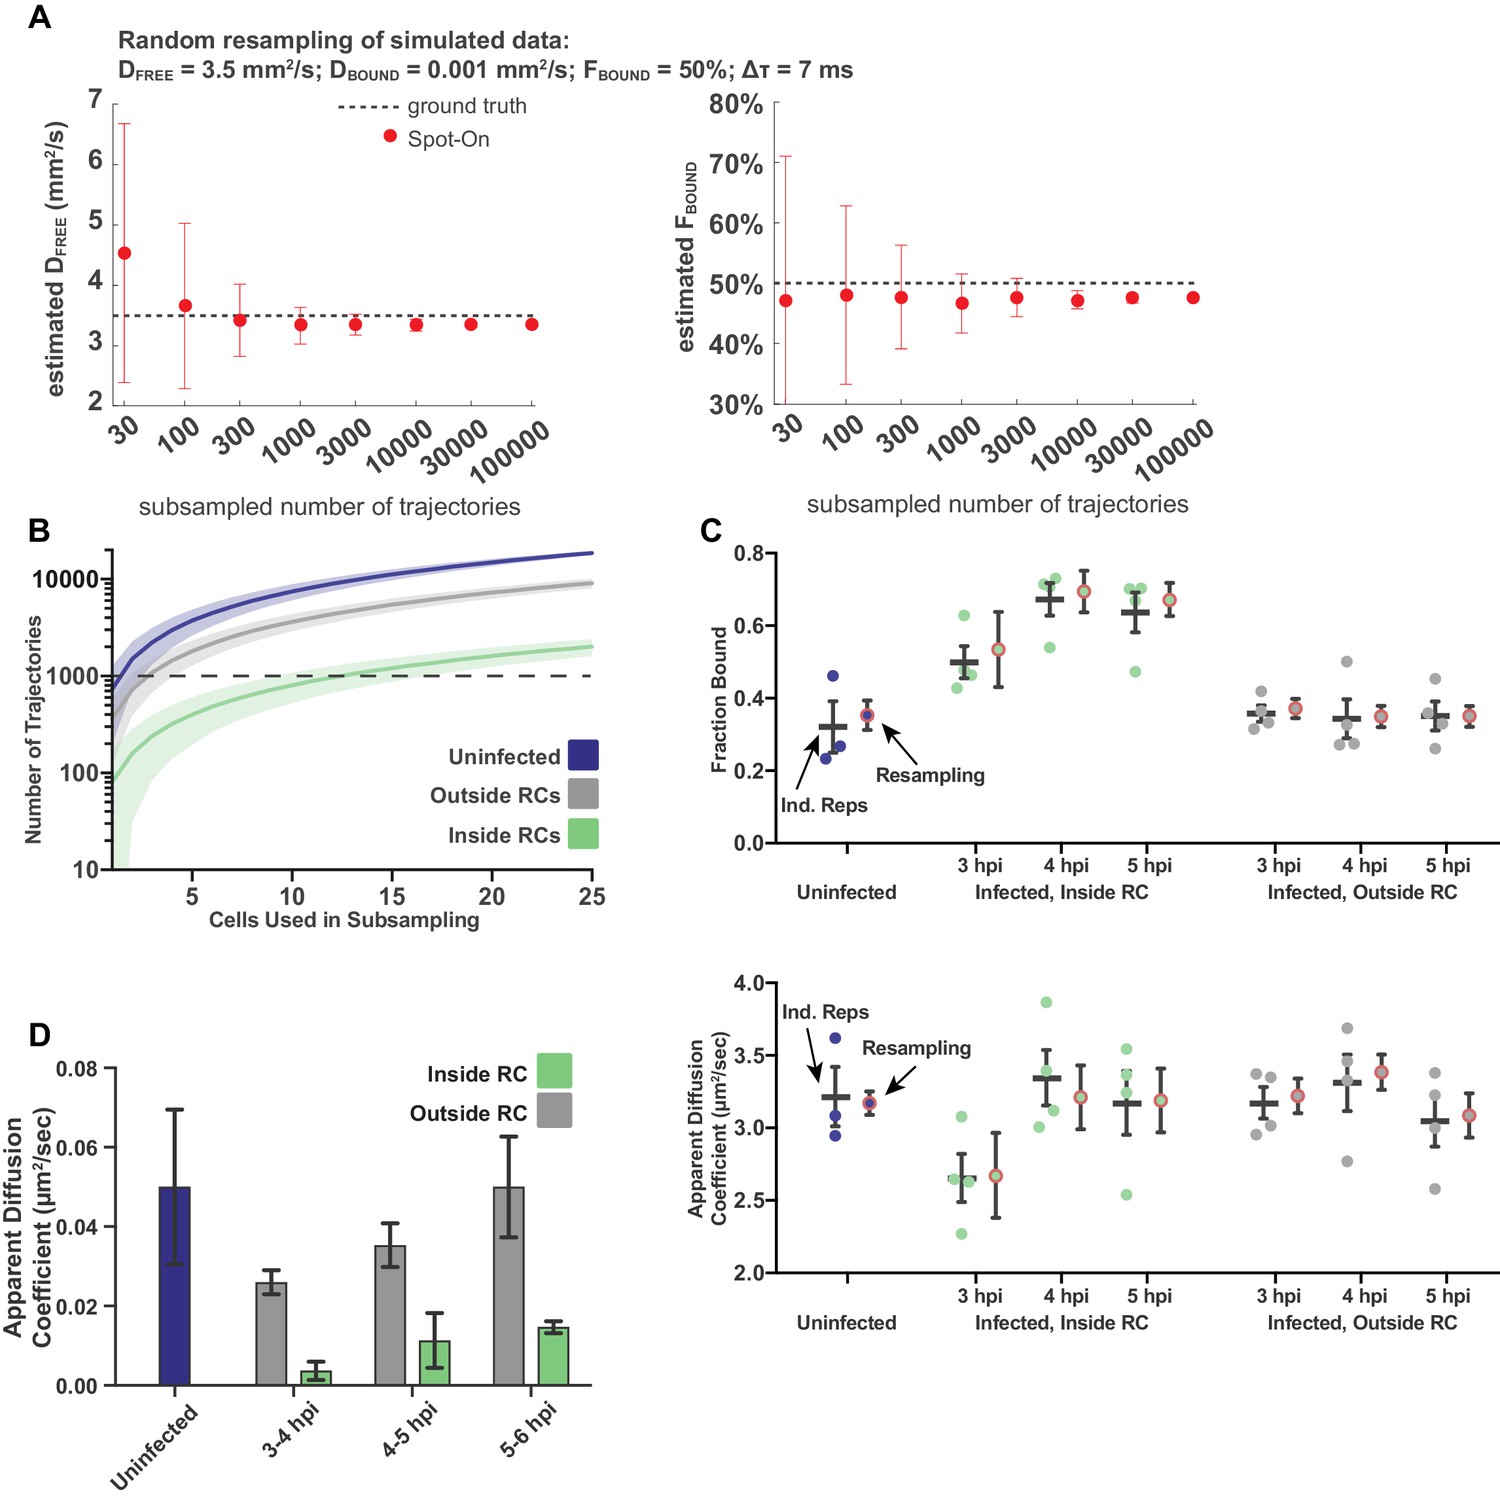
Sampling statistics and quality measurements of spaSPT.
(A) Measurements of the goodness of fit for Spot-On as a function of the number of trajectories sampled, using Monte Carlo simulation. Data taken from simulations performed in Hansen (2018). (B) The number of trajectories in the data set for uninfected and infected cells as a function of the number of cells randomly sampled from the data set. Plot shows the mean flanked by the standard deviation. Dashed line demarcates 1000 trajectories. (C) Comparison of treating data as biological replicates versus using random subsampling. For each condition, the left bar shows the mean and SEM from at least three biological replicates, whereas the right shows the mean and standard deviation of the mean calculated from 100 resampling iterations. Either approach gives values within measurement error of each other. (D) Mean diffusion coefficient of the Bound population determined through two-state model fitting for uninfected cells, and for cells at different times post infection, both inside and outside of RCs. In all data sets, the calculated diffusion coefficient is well below the upper bound set for the fitting, consistent with diffusion coefficients of chromatin (Hansen et al., 2018). Error bars are the standard deviation of the mean, calculated from 100 iterations of randomly subsampling 15 cells without replacement and fitting with the model.
Figure 2—figure supplement 2
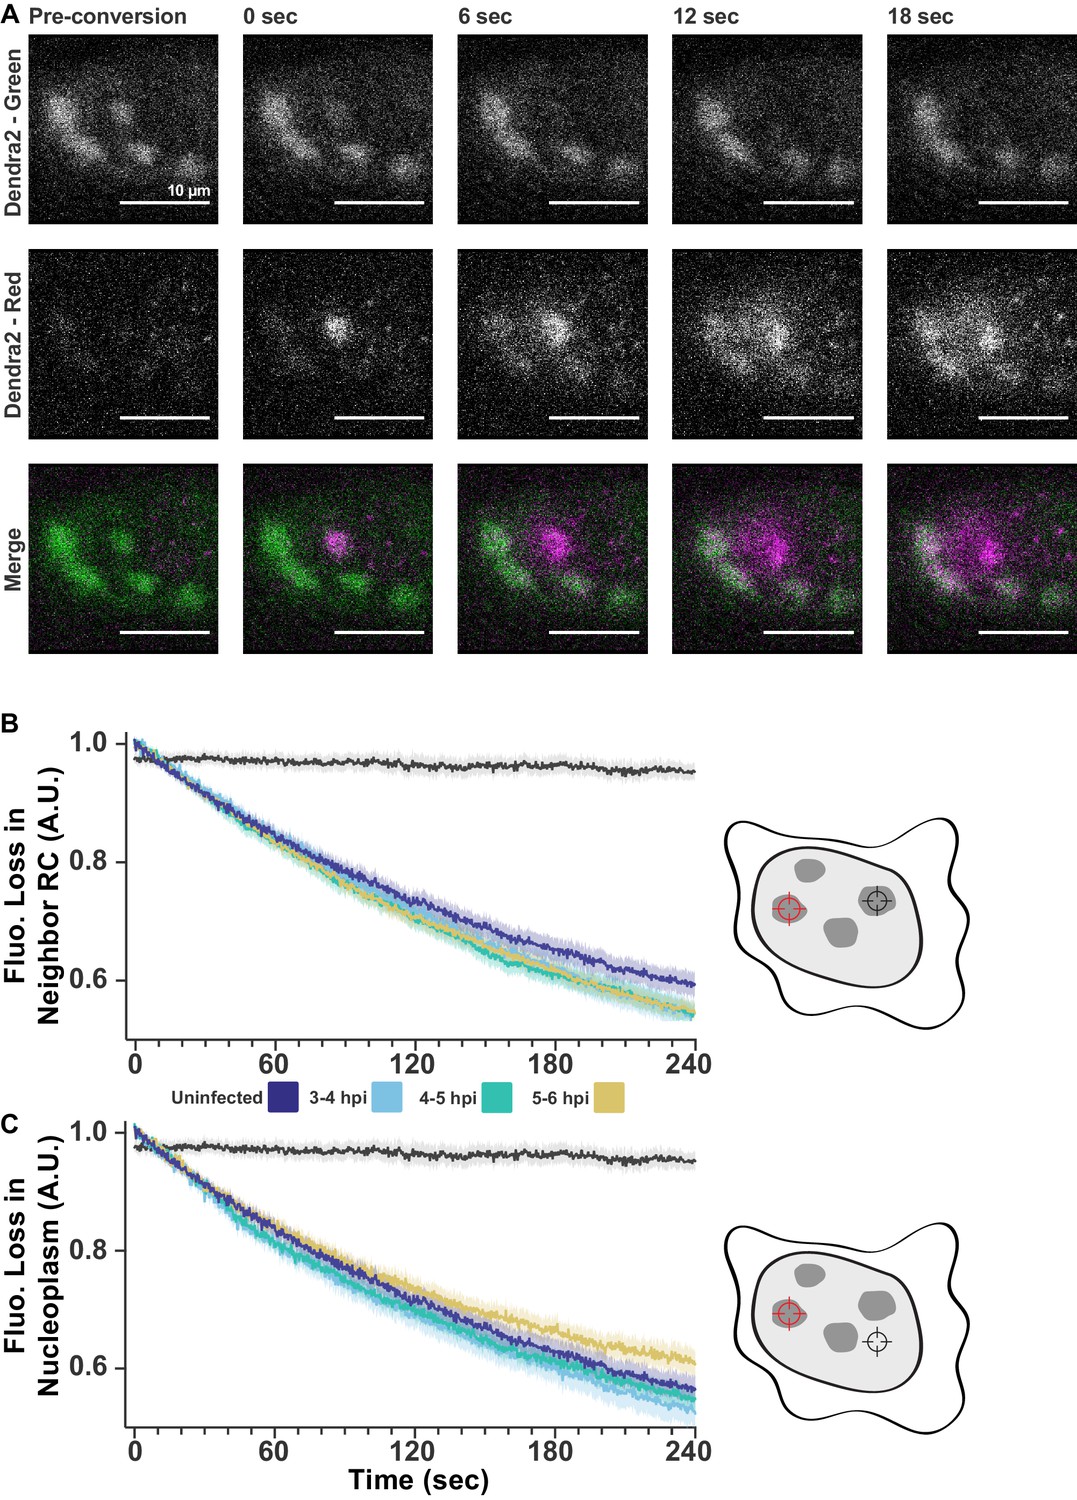
FLIP shows exchange within and between RCs.
(A) Dendra2 photoconversion shows Pol II exchanges with nucleoplasm. Cells stable expressing Dendra2-Pol II were infected with HSV1. Fluorescence was monitored in both the green channel (pre-conversion), and red channel (post-conversion). A 1 µm spot of 405 nm light was used to convert one RC from green to red, alternating between photoconversion and frame acquisition. All scale bars are 10 µm. (B) FLIP measurements as in Figure 2F, except separated by time post infection. All times after infection show the same decay coefficients. (C) FLIP measurements of the loss of fluorescence in the nucleoplasm outside of RCs. All times after infection show similar decay coefficients.
Figure 2—figure supplement 3
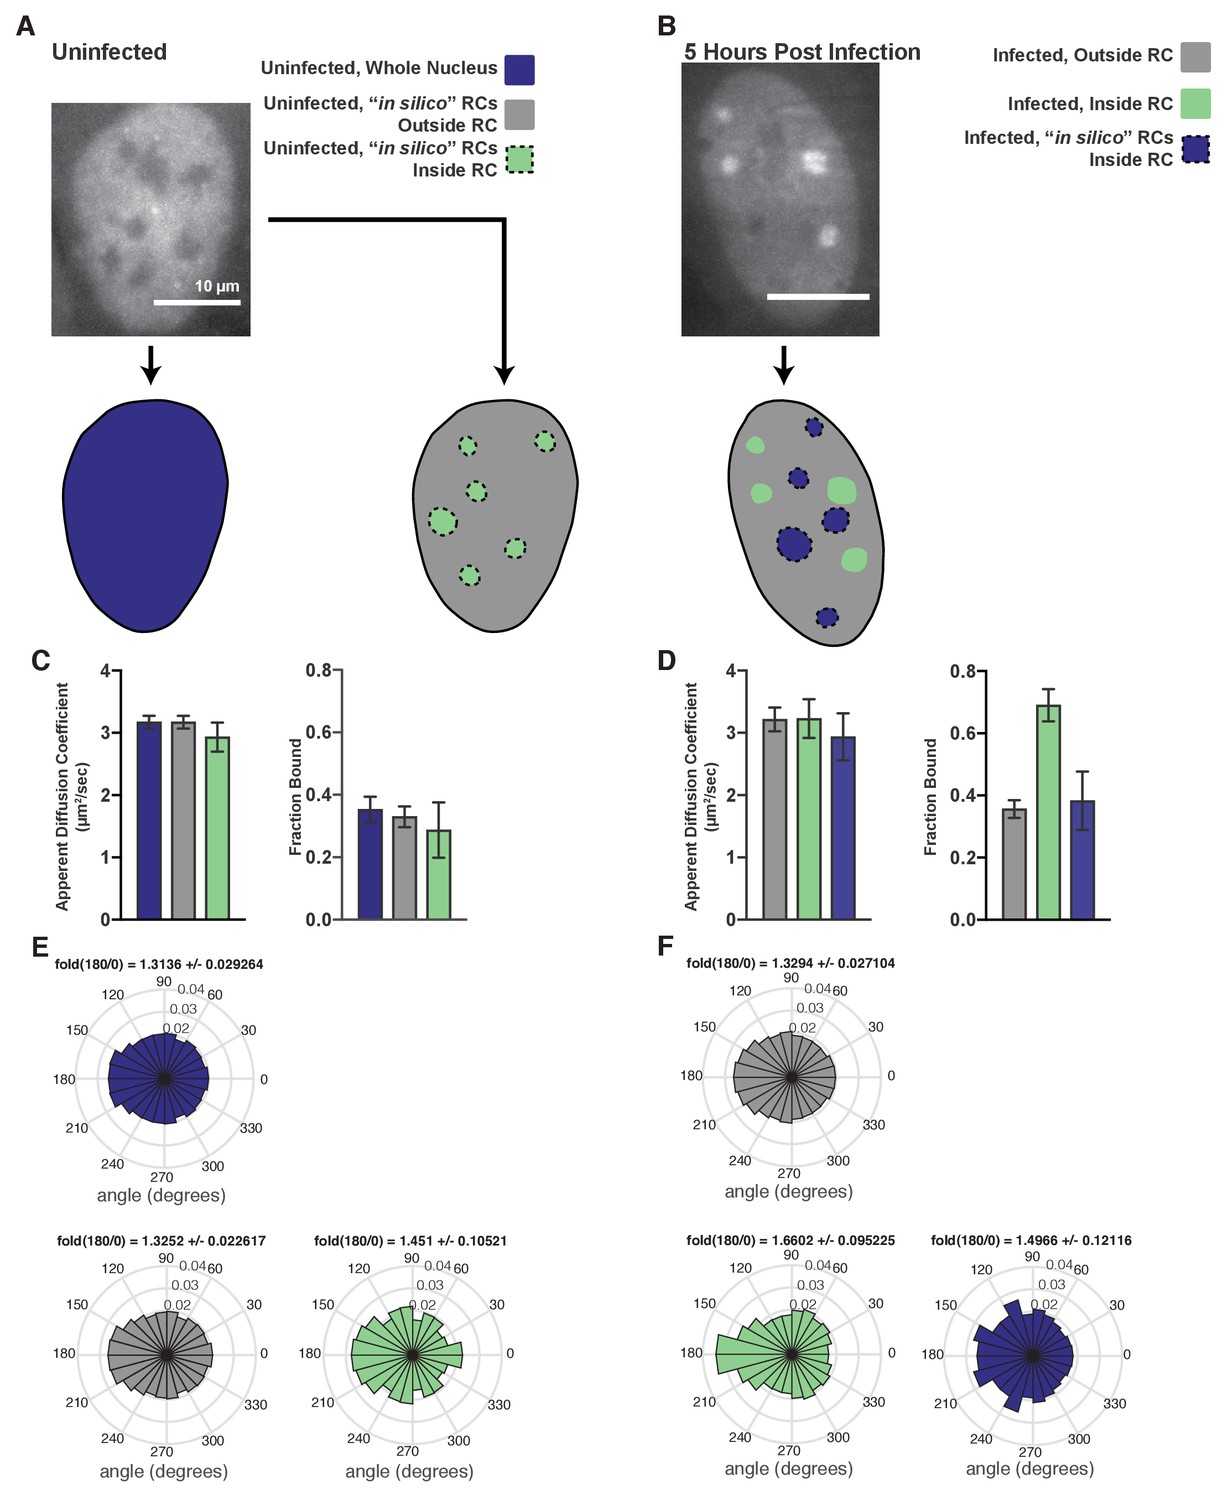
Comparison of bona fide RCs with RCs generated in silico.
(A) Example workflow for uninfected cells, where either just the nucleus was masked (left), or the nucleus was masked and RC-sized annotations were randomly placed inside the nucleus (right). (B) Example workflow for HSV1-infected cells, where both the correct annotations based on the widefield image and randomly shuffled RCs were generated for all measured cells. (C) Spot-on measurements of trajectories after inside/outside classification in uninfected cells. In silico shuffling of RC positions has very little effect on either the measured apparent diffusion coefficient or the fraction bound. Error bars are the standard deviation of the mean, calculated from 100 iterations of randomly subsampling 15 cells without replacement and fitting with the model. (D) Similar to (C), but for infected cells. Real RCs show an increase in fraction bound, whereas in silico shuffled compartments show no difference with trajectories outside RCs. (E) Angular distributions of Pol II trajectories in the regions marked in (A) Fold(180/0) is the mean plus/minus the standard deviation, calculated from 100 iterations of randomly subsampling 15 cells without replacement and fitting with the model. (F) Angular distributions of Poll II trajectories in the regions marked in (B). Fold(180/0) is the mean plus/minus the standard deviation, calculated from 100 iterations of randomly subsampling 15 cells without replacement and fitting with the model. All scale bars are 10 µm.
Figure 2—video 1
Example of SPT data from an uninfected cell.
Example 500 frames, played at 1/10th normal speed, from SPT data collected for the cells shown in Figure 2B from an uninfected cell (Figure 2—video 1) and a cell infected for 4 hr (Figure 2—video 2). Examples were taken from data sets with relatively high densities of localizations per frame to illustrate tracking and sorting into compartments, but in general the localization density was kept much lower, at approximately 0.5 localizations per frame.
Figure 2—video 2
Example of SPT data from a cell 4 hpi.
https://doi.org/10.7554/eLife.47098.013
Figure 3 with 1 supplement
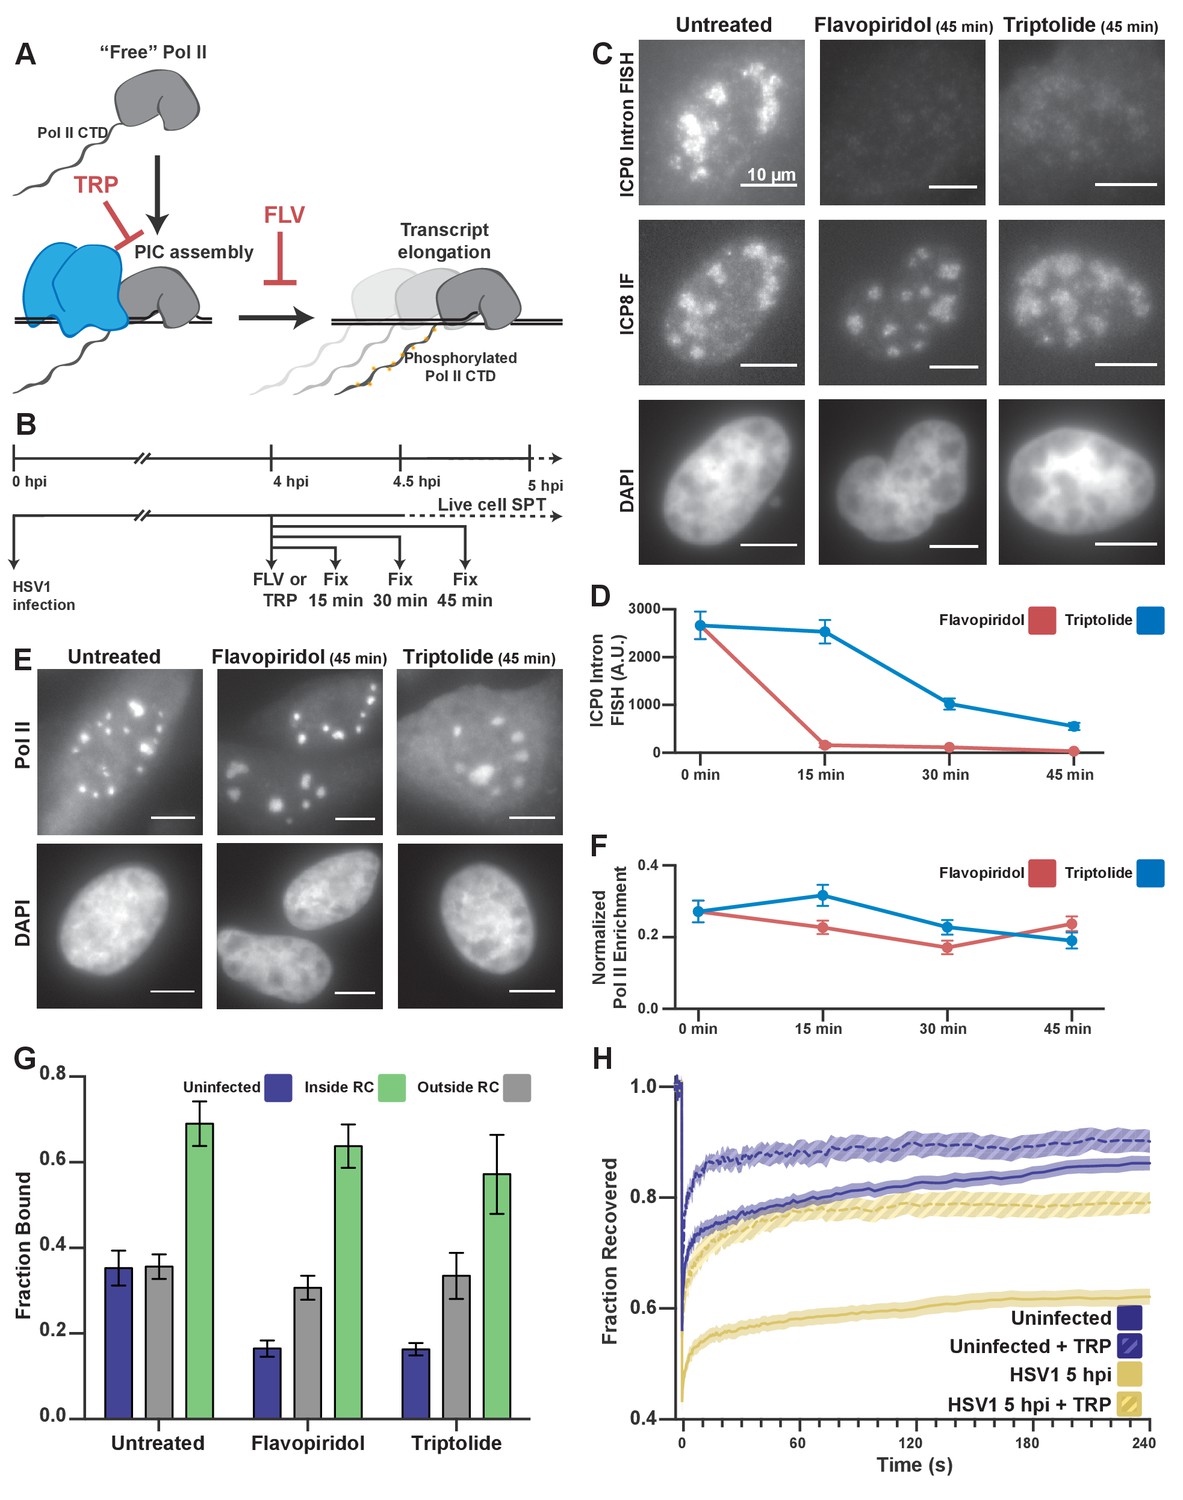
Pol II recruitment to RCs occurs independent of active transcription.
(A) Schematic of Pol II-mediated transcription inhibition. (B) Schematic of the experiment regimen for imaging infected cells after transcription inhibition. (C) RNA FISH against the ICP0 intron to measure nascent transcription after Flavopiridol or Triptolide treatment. ICP8 marks viral RCs. (D) Quantification of the ICP0 intron signal in untreated cells (n = 170 RCs) those treated with TRP(n = 192, 171, 191 RCs, respectively) and FLV(n = 158, 238, 153 RCs, respectively). Error bars are standard error of the mean. (E) Halo-Pol II distribution after 45 min of Triptolide or Flavopiridol treatment. All scale bars are 10 µm. F) Quantification of the total fraction of Pol II recruited to RCs in untreated cells (n = 29) with TRP(n = 33, 24, 33, respectively) and FLV(n = 36, 24, 38, respectively). Error bars represent standard error of the mean. (G) Mean fraction bound measured from spaSPT of Halo-Pol II, after transcription inhibition. Error bars are the standard deviation of the mean, calculated as described in STAR methods. (H) FRAP recovery curves of Pol II with (hashed) and without (solid) Triptolide treatment, for uninfected cells (n = 31, nine respectively) and cells infected with HSV1, 5hpi (n = 32, 12 respectively).
Figure 3—figure supplement 1
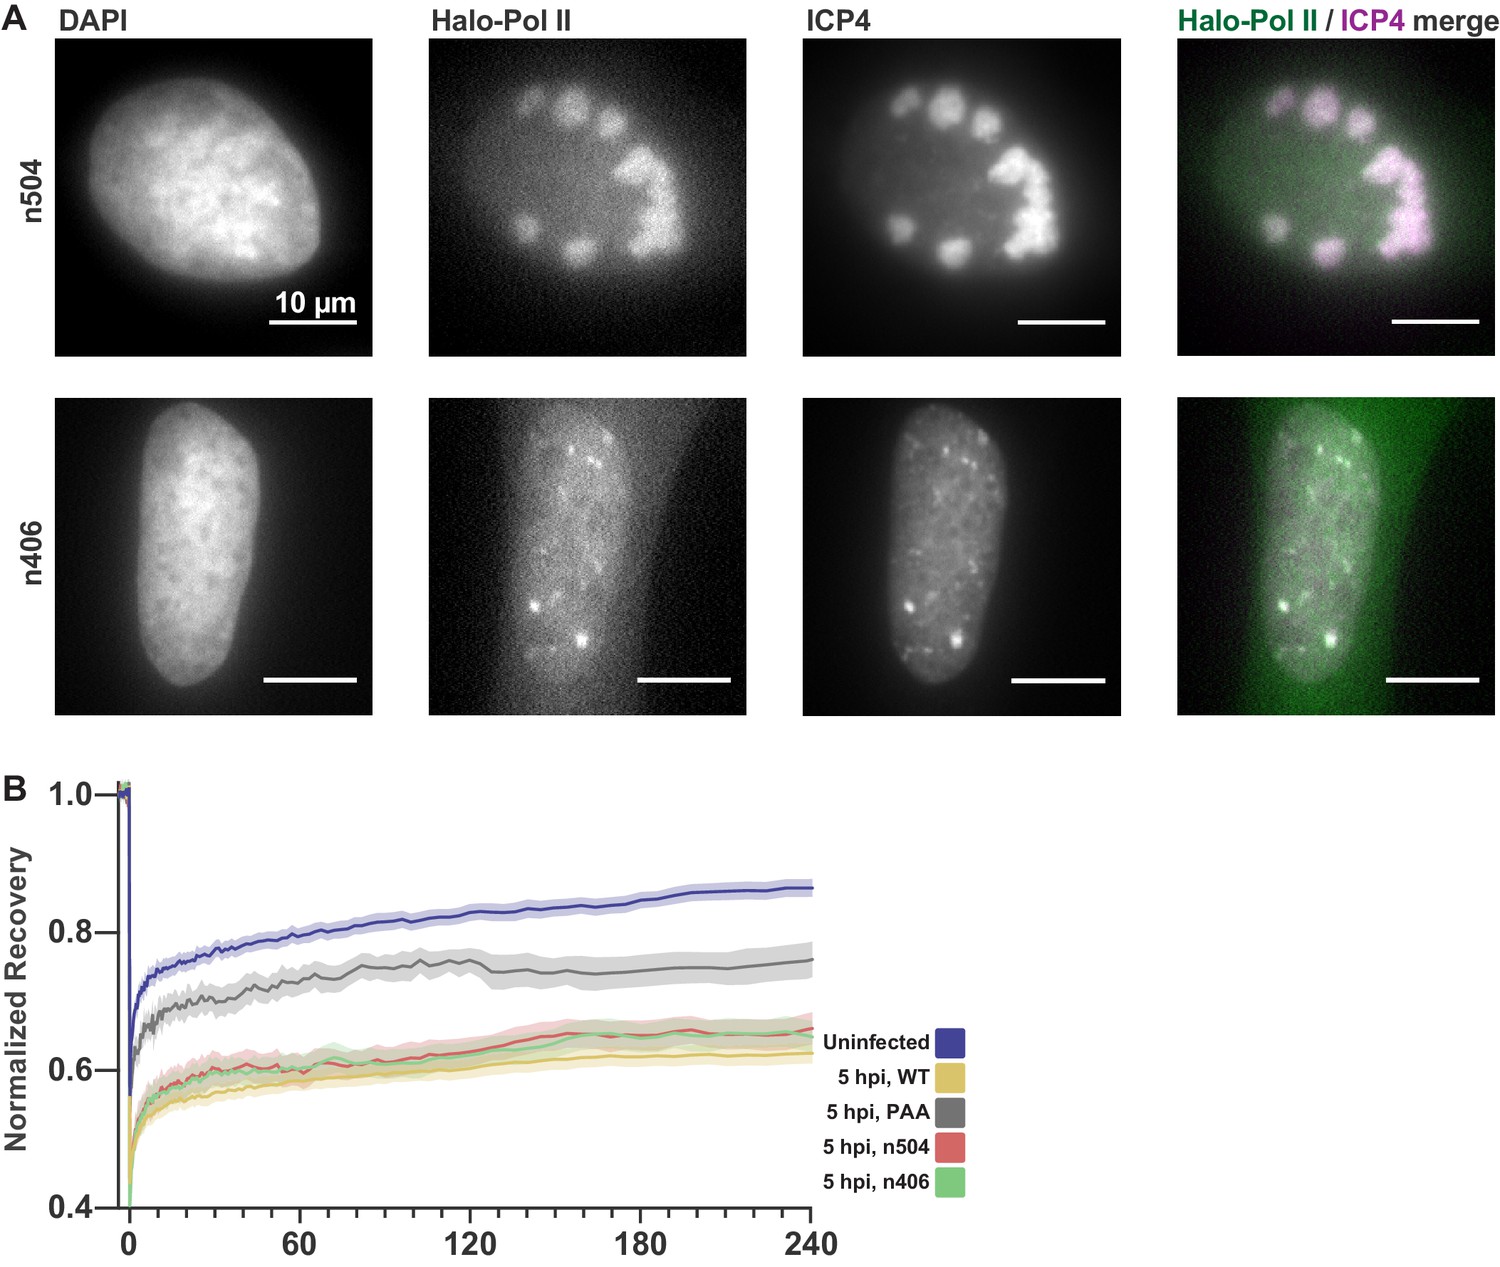
HSV1 mutants affect neither Pol II recruitment nor binding dynamics.
Related to Figures 2 and 3. (A) n504 and n406 mutants containing nonsense mutations in the UL54 gene causing premature termination of the ICP27 protein. Representative fluorescence images of HaloTag-Pol II cells infected with either mutants. Immunofluorescence against ICP4 marks viral RCs. Both virus mutants accumulate Pol II in RCs. (B) FRAP measurements of n504 and n406 mutants at 5 hpi, plotted with the uninfected and WT-infected cells from Figure 1F, and WT-infected cells treated with 300 µg/mL PAA to inhibit viral genome replication. Curves show the mean flanked by the SEM (n504 n = 10 cells, n406 n = 10 cells, WT n = 33 cells, WT PAA n = 8, Uninfected n = 31 cells).
Figure 4 with 1 supplement

ATAC-seq reveals HSV1 DNA is much more accessible than chromatin.
(A) Schematic of the Oligopaint targets for DNA FISH. Separate probe sets target regions in the Unique Long (UL) arm and the Unique Short (US) arm. B) Representative images of DNA FISH of cells four hpi, infected in the presence (PAA, left) or absence (4hpi, right) of the replication inhibitor PAA. Pixel intensity values are the same for the two images. Scale bars are 10 µm. (C) Fluorescence intensity of DNA FISH signal in RCs after infection. 5–95% intervals are shown, with inner quartiles and median. Data are normalized to the median intensity value of PAA-treated infected cells. Medians: PAA = 1.0, 3 hpi = 0.8, 4 hpi = 4.8, 5 hpi = 31.1, 6 hpi = 47.0. (D) Mean fraction bound for Pol II in infected cells with and without PAA. Error bars are the standard deviation of the mean, calculated as described in Materials and methods. (E) H2B-Halo cells show histone H2B is not incorporated into RCs. Innumofluorescence against ICP4 marks RCs. (F) Fragment length distribution of ATAC-seq data for cells 4 hpi. Lengths corresponding to intra-nucleosomal DNA (50–100 bp) and mononucleosomal DNA (180–250 bp) are marked as a reference. (G) ATAC-seq read density plotted across HSV1 genomic coordinates. (H) ATAC-seq analysis of intra-nucleosomal DNA (50–100 bp) and mononucleosomal DNA (180–250 bp). Global analysis of all human Pol II-transcribed genes, centered at the transcription start site (TSS). (I) The same analysis as in (G), but centered at the TSS of HSV1 genes.
Figure 4—figure supplement 1
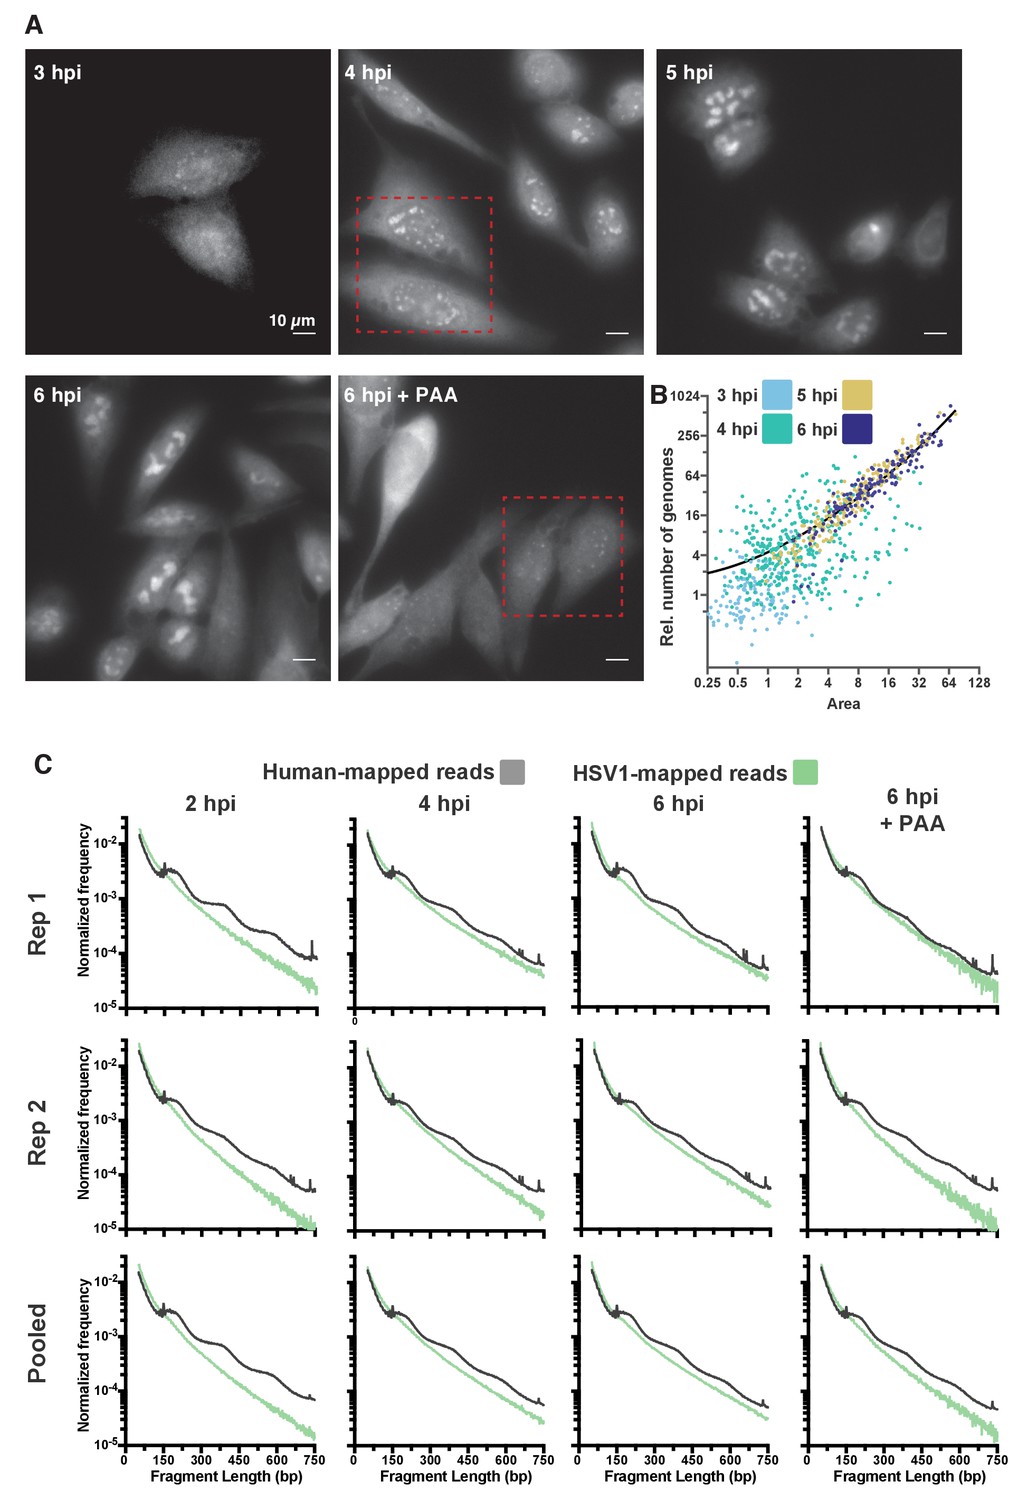
Quantification of DNA content and chromatin state in HSV1 RCs.
(A) Representative full fields of view from DNA FISH hybridization. Dashed red boxes indicate the regions displayed in Figure 4B. (B) Dot plot showing the individual RC values from Figure 4C; normalized to the median of cells infected in the presence of PAA. Medians are indicated by a solid line (PAA = 1, 3 hpi = 0.83, 4 hpi = 4.77, 5 hpi = 31.13, 6 hpi = 46.95). (C) Fragment length distributions of all conditions tested after HSV1 infection, for two individual replicates as well as for the pooled data. The green line indicates the lengths of fragments mapping to the viral genome, the gray line indicates lengths of fragments mapping to the human genome. All data are normalized to the total number of mapped reads to the respective genome, per condition.
Figure 5
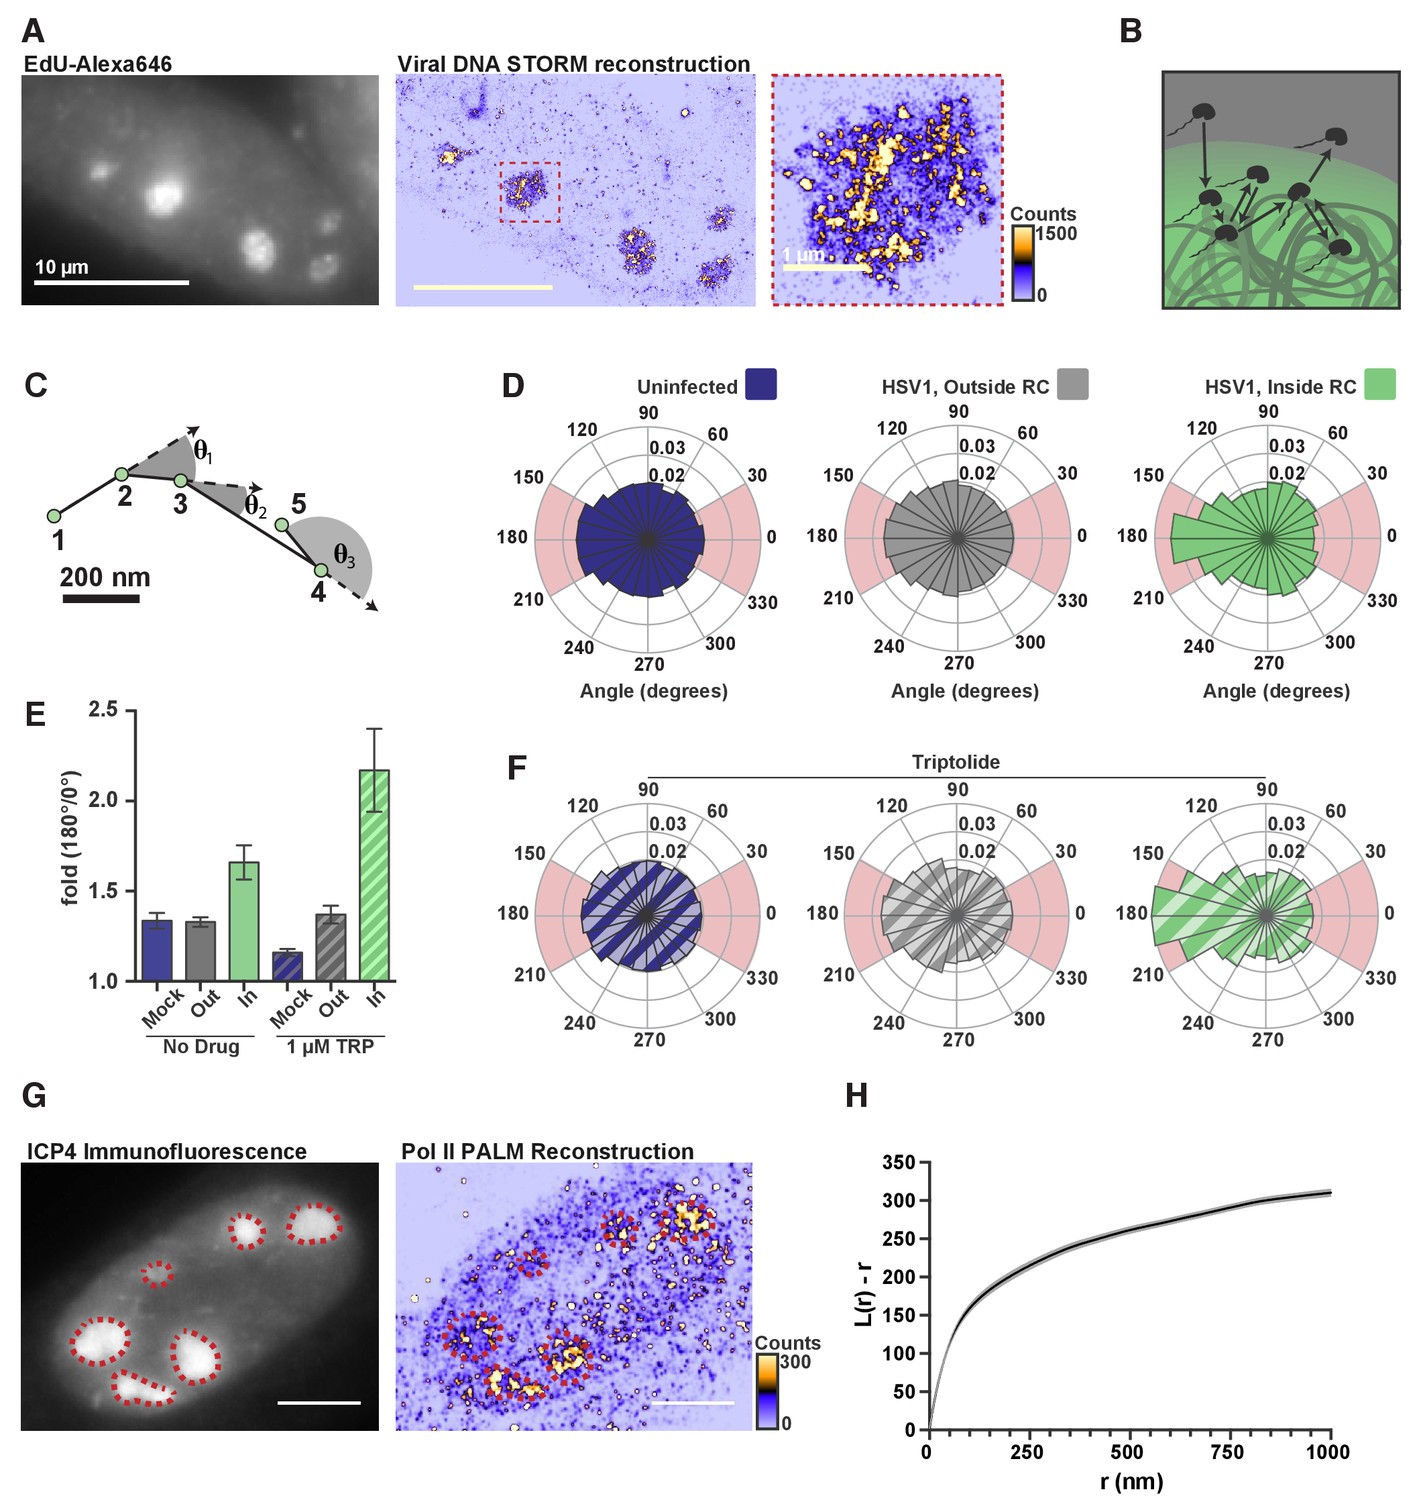
DNA-binding alters Pol II exploration of RCs.
(A) STORM image of fluorescently labeled HSV1 DNA. Zoom-in shows one RC, and the heatmap shows the number of fluorophore localizations in each rendered pixel. (B) Schematic of Pol II exploring an RC and randomly sampling the viral DNA. (C) Example spaSPT trace, marking the angles between consecutive steps. (D) Angular distribution histograms extracted from Halo-Pol II in uninfected cells, and HSV1 infected cells 4–6 hpi, inside and outside of RCs. (E) Quantification of the relative probability of moving backward compared to forward (180°±30°/0°±30°). Error bars are the standard deviation of the mean, calculated as described in Materials and methods. (F) Same as in (D), except that cells were treated with Triptolide at least 30 min prior to imaging. Quantification of this data is also show in (E). (G) Representative PALM image of Halo-Pol II. ICP4 marks viral RCs. Heatmap corresponds to the number of detections per rendered pixel. (H) L-modified Ripley Curve (L(r)-r) for Halo-Pol II inside of RCs in cells five hpi (n = 13 cells). Graph shows the mean flanked by the SEM. All scale bars are 10 µm. Also see Figure 2—figure supplement 3E and F.
Figure 6 with 1 supplement
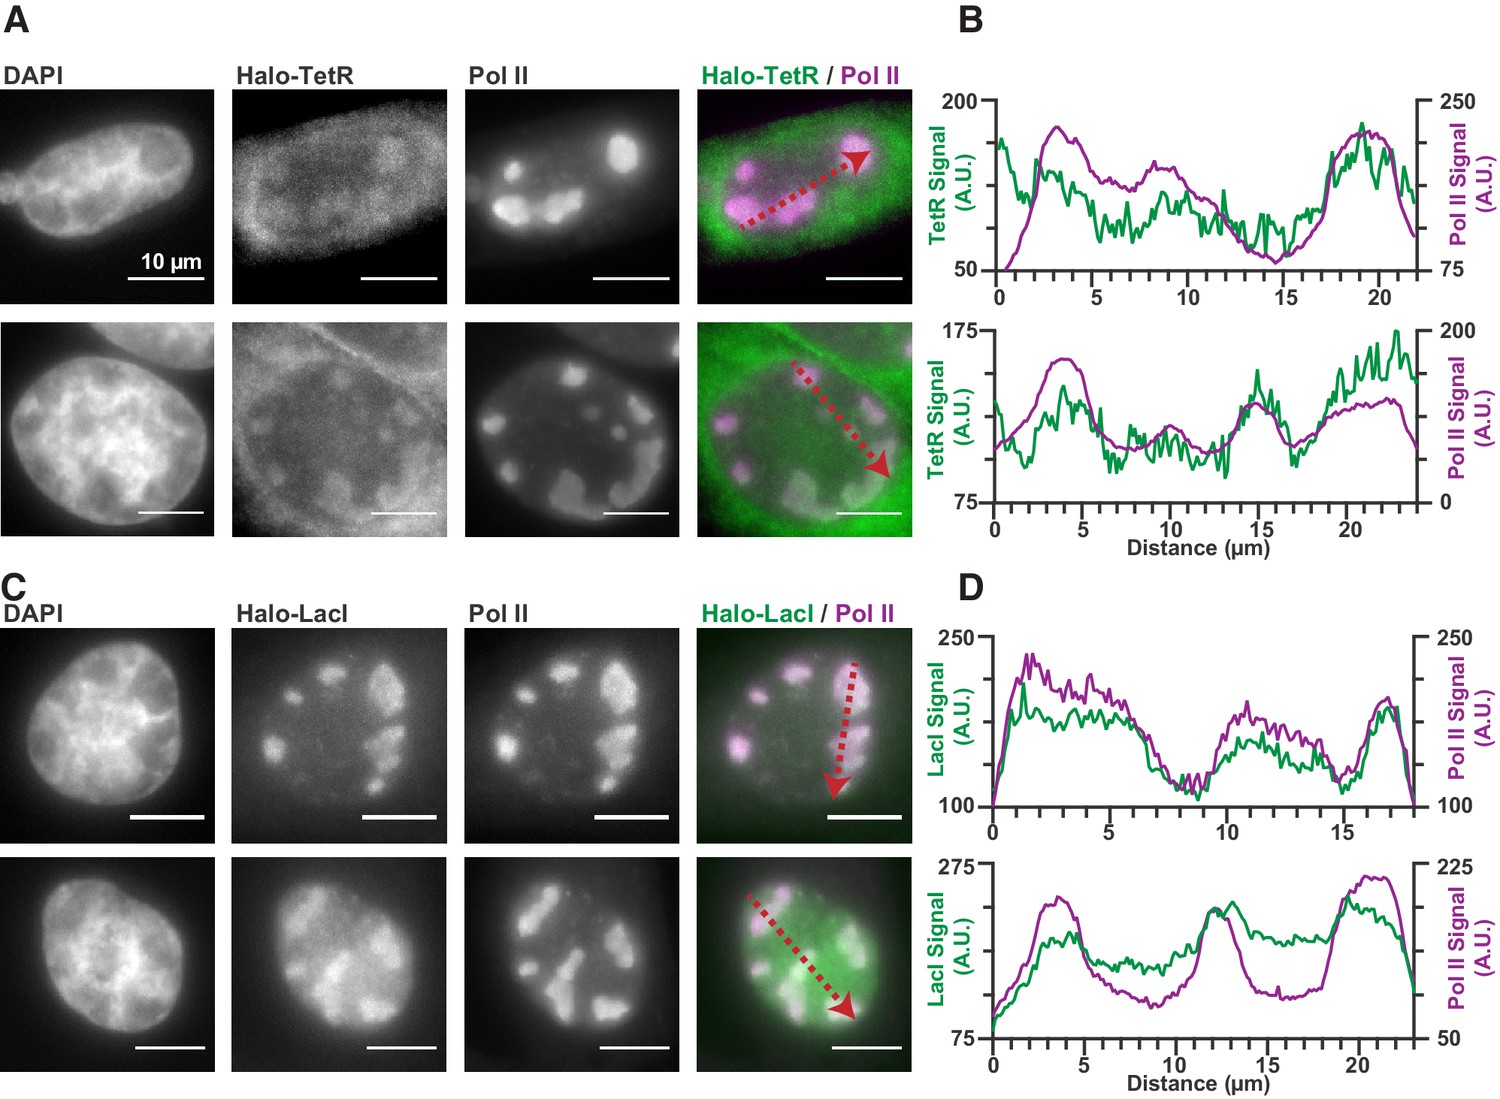
Nonspecific DNA binding drives accumulation of other factors in RCs.
(A and C) Two representative cells from SNAPtag-RPB1 cells expressing TetR-Halo (A) and LacI-Halo (C), showing that both bacterial transcription factors are enriched in RCs. (B and D) Pixel line scans of images in (A) and (C). Red arrows give the direction of the x-axis. Left y-axis is the intensity of TetR-Halo or LacI-Halo fluorescence, right y-axis is the intensity of SNAPtag--Pol II fluorescence. All scale bars are 10 µm. Also see Figure 1—figure supplement 1.
Figure 6—figure supplement 1
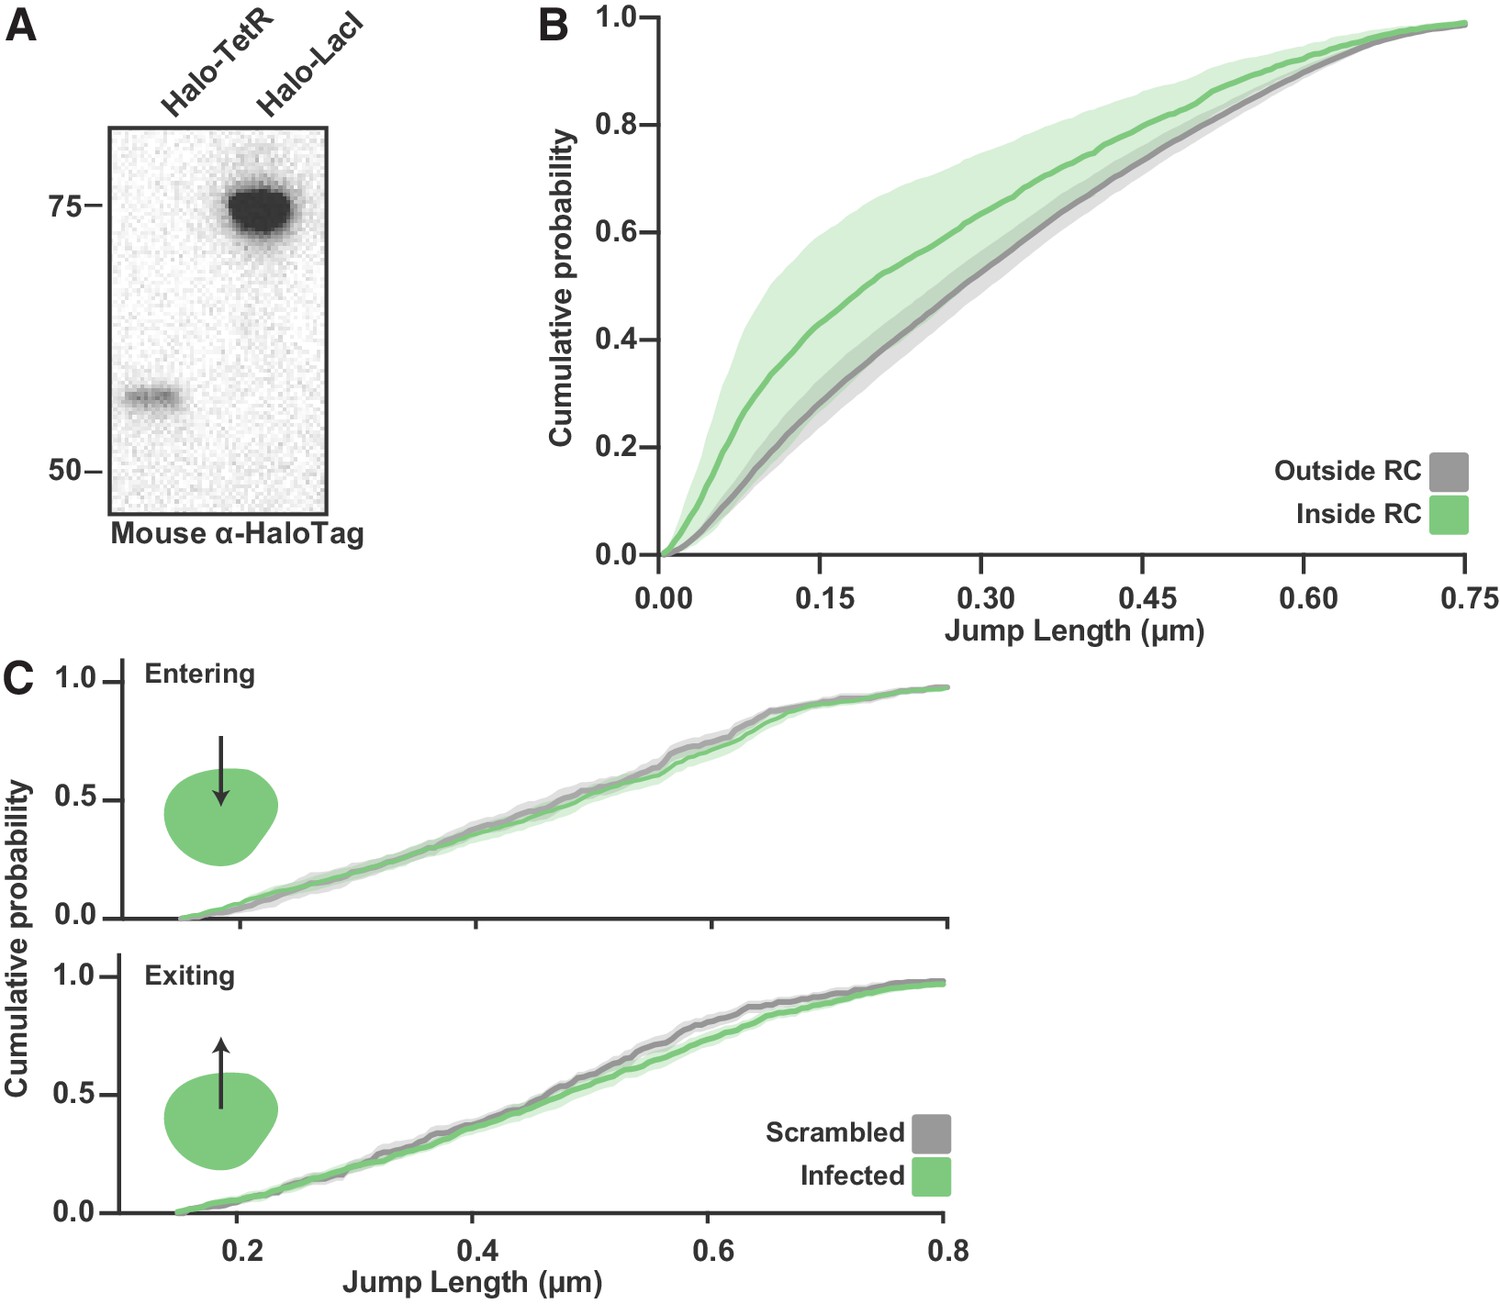
SPT of Halo-TetR in infected cells.
(A) Anti-HaloTag western blot from SNAPtag-Pol II cells expressing Halo-TetR and Halo-LacI. (B) CDF of Halo-TetR displacements inside and outside RCs. Curve shows the mean flanked by the standard deviation as calculated by random resampling (see Materials and methods). SPT data for TetR-Halo were not well fit by the two state model in Spot-On; however, a qualitative assessment can be made from the CDF curves. The shift to the short displacements inside of RCs is a strong indication of an increase in binding events. (C) CDF of displacements from spaSPT for Halo-TetR entering (top) or exiting (bottom) RCs. Data for jumps in and out of RCs is compared to jumps in cells where the annotations have been randomly shuffled. Curve shows the mean flanked by the standard deviation as calculated by random resampling (see Materials and methods).
Figure 7
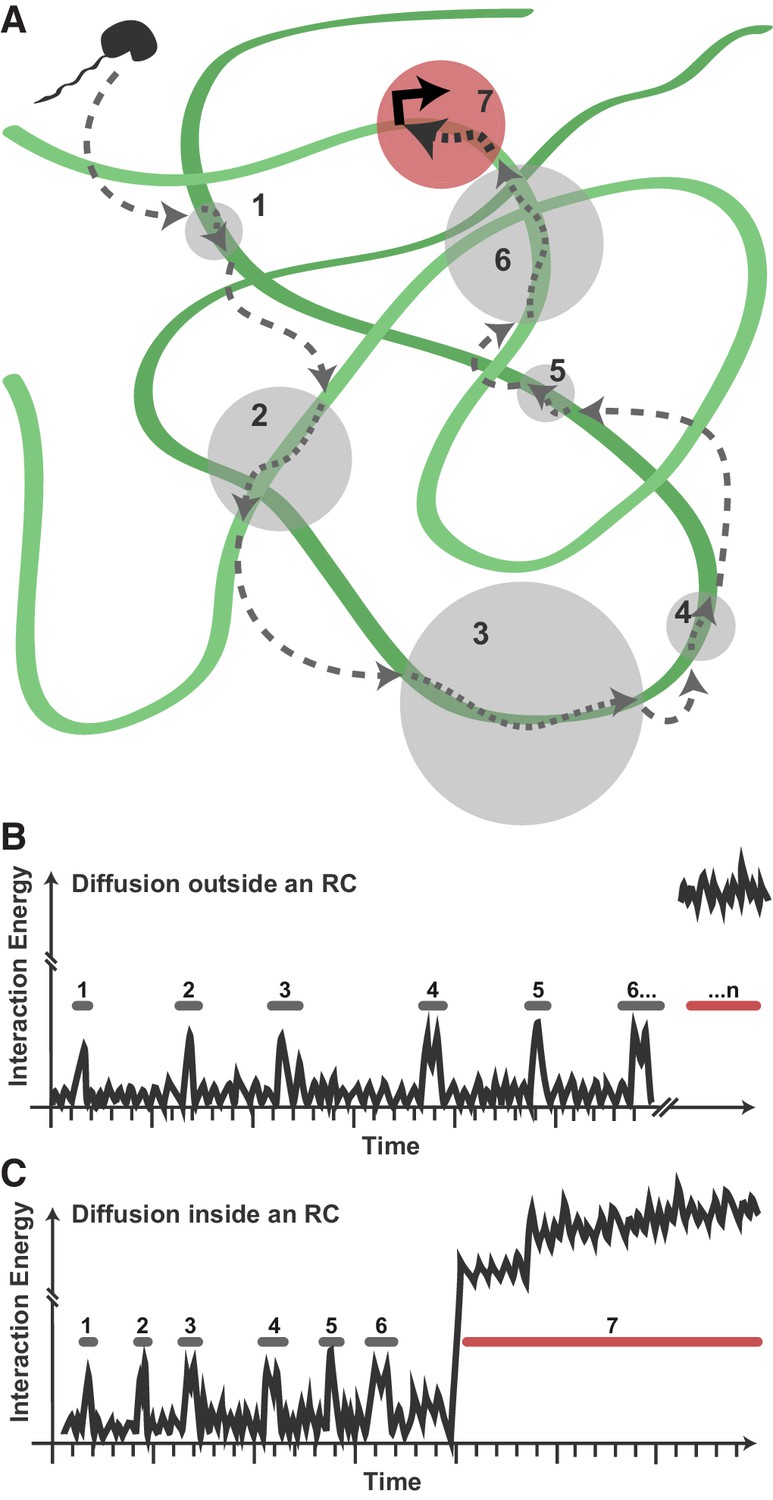
Model for Pol II exploration of RCs.
(A) A Pol II molecule encounters the accessible viral DNA multiple times along one potential route to eventually bind at a promoter. 3D diffusion through the RC is interrupted by binding interactions with the viral DNA (gray circles). (B) Hypothetical comparison of nuclear exploration outside RCs as a function of time and binding energy. A DNA-binding protein in the chromatinized nucleus will encounter nucleosome-free DNA sporadically, making multiple low-affinity interactions before eventually finding a high-affinity site. (C) Inside an RC, the high DNA accessibility might shorten the length of 3D excursions before a DNA-binding protein encounters another region of viral DNA in a low-affinity, nonspecific interaction. This, in turn, may reduce the distance a molecule might diffuse before its next binding event, and increases both the chances of that molecule remaining in close proximity and the chances that it will find a high binding energy interaction.
Author response image 1
Tables
Table 1
Quantitative measurements of HSV1 DNA inside of RCs.
Related to Figure 4. Using the values obtained through DNA FISH and ATAC-seq, we can make estimates of the copy number, concentrations, and relative enrichment of the viral DNA compared to the host. All values are calculated based on measurements of cells 6 hpi.
| Table 1 | Genome Size (bp) | Genome Copy number‡ | Total DNA (bp) | Percent of Total DNA‡ | Concentration (bp/μm3 )§ | ATAC-seq read percentage¶ | Fold enrichment over expected** |
|---|---|---|---|---|---|---|---|
| Host Genome* | 3.2 × 10⁹ | 2 | 6.4 × 10⁹ | 99.8 (±0.2) | 9.4 (±1.6) x106 | 75.8 (±10.4) | 0.8 (±0.1) |
| Viral DNA | 1.5 × 10⁵ | 82 (±105) | 1.3 (±1.6) x107 | 0.2 (±0.2) | 3.9 (±5.8) x104 | 24.2 (±10.4) | 130 (±170) |
| Rel. Diff.† | 2.1 × 10⁴ | 513 (±658) | 240 (±369) |
-
All values are the Mean (±S.D.).
*. Assuming karyotypically normal human cell; †. relative difference = Human/HSV1; ‡. Under experimental conditions of MOI = 1; §. Concentration assuming nucleus volume taken from Monier et al. (2000); ¶. based on total reads mapped from each organism, n = 3; ** Fold enrichment = ATAC seq read percentage/Percent of Total DNA.
Key resources table
| Reagent type (species) or resource | Designation | Source or reference | Identifiers | Additional information |
|---|---|---|---|---|
| Cell line (Homo sapiens) | Halo-TAF15 | This paper | U2OS SNAPtag-RPB1, HaloTag-TAF15 | U2OS (15 y/o female osteosarcoma, RRID: CVCL_0042) expressing HaloTag-RPB1(N792D) selected for using alpha-amanitin, further expressing HaloTag-TAF15 (AA 2–205)-NLS and selected for with Hygromycin |
| Cell line (Homo sapiens) | H2B-SNAP-Halo | Hansen et al., 2018 | U2OS Histone H2B-SNAPtag-HaloTag | U2OS (15 y/o female osteosarcoma, RRID: CVCL_0042) expressing Histone H2B-SNAPtag-HaloTag and maintained in selection with G418 |
| Cell line (Cercopithecus aethiops) | Vero | ATCC | ATCC CCL-81; RRID:CVCL_0059 | |
| Cell line (Cercopithecus aethiops) | V27 | Rice and Knipe, 1990 | V27 | Vero cells stable expressing ICP27 under selection of G418. A generous gift from Septhen Rice. |
| Sequence-based reagent | Common DNA FISH forward primer: 5’-GACACGTGATCCGCGATACGATGAAAGCGCGACGTCAGGTCGGCC-3’ | Integrated DNA Technologies | N/A | |
| Sequence-based reagent | Common DNA FISH forward primer: 5’-GACACGTGATCCGCGATACGATGAAAGCGCGACGTCAGGTCGGCC-3’ | Integrated DNA Technologies | N/A | |
| Sequence-based reagent | Common DNA FISH reverse primer: 5’- CTCGCTAATACGACTCACTATAGCCGGCTCCAGCGG −3’ | Integrated DNA Technologies | N/A | |
| Sequence-based reagent | Alexa Fluor 647-labeled RT primer: 5’- TCGCGCTTTCATCGTATCGCGGATCACGTGTC-Alexa647-3’ | Integrated DNA Technologies | N/A | |
| Sequence-based reagent | Alexa Fluor 555-labeled RT primer: 5’- TCGCGCTTTCATCGTATCGCGGATCACGTGTC-Alexa555-3’ | Integrated DNA Technologies | N/A | |
| Recombinant DNA reagent | pSNAP-RPB1(N792D) (plasmid) | This paper | RPB1 carrying N792D mutation for alpha-amanitin resistence inserted downstream of SNAPtag with the TEV protease sequence as a linker reagion. | |
| Recombinant DNA reagent | pHalo-TetR (plasmid) | This paper | The Tet repressor inserted downstream of HaloTag with the TEV proease site as a short linker. | |
| Recombinant DNA reagent | pHalo-LacI (plasmid) | This paper | The Lac repressor inserted downstream of HaloTag with the TEV proease site as a short linker and a single SV40 NLS at the c-terminus. | |
| Recombinant DNA reagent | pHaloTag-3xNLS (plasmid) | Hansen et al., 2017 | ||
| Recombinant DNA reagent | pHalo-TEV-EWS LC-NLS (plasmid) | Chong et al., 2018 | ||
| Recombinant DNA reagent | pHalo-TEV-FUS LC-NLS (plasmid) | Chong et al., 2018 | ||
| Recombinant DNA reagent | pHalo-TEV-Taf15 LC-NLS (plasmid) | Chong et al., 2018 | ||
| Software, algorithm | Custom implementation of Spot-On and graphical analysis | Hansen et al., 2018; this paper | Spot-On | The source code is freely available at https://gitlab.com/dmcswiggen/mcswiggen_et_al_2019 |
| Software, algorithm | Matlab versions2014b, 2017a | Mathworks | 2014b, 2017a | |
| Software, algorithm | IUPred 2A | Dosztányi et al., 2005a; Dosztányi et al., 2005b | IUPred | This tool is available at: https://iupred2a.elte.hu/download |
| Software, algorithm | Bowtie2 | Langmead and Salzberg, 2012 | Bowtie | This tool is availabe at:http://bowtie-bio. sourceforge.net/bowtie2/index.shtml |
| Software, algorithm | SamTools | Li et al., 2009 | SamTools | This tool is available at: http://samtools.sourceforge.net |
| Software, algorithm | deepTools2 | Li et al., 2009 | deepTools | This tool is available at: https://deeptools.readthedocs.io/en/develop/ |
| Software, algorithm | Integrative Genomics Viewer 2.4.4 | Robinson et al., 2011 | IGV | This tool is available at: https://software.broadinstitute.org/software/igv/ReleaseNotes/2.4.x |
| Software, algorithm | R version 3.5.1 | R project | R | |
| Software, algorithm | ADS R package | Pélissier and Goreaud, 2015 | ADS R package | This tool is available at:https://cran.r-project.org/web/packages/ads/index.html |
| Software, algorithm | vbSPT | Persson et al., 2013 | vbSPT | This tool is available at http://vbspt.sourceforge.net |
| Software, algorithm | Adobe Illustrator CC2017 | Adobe Inc | ||
| Software, algorithm | Prism 7 | GraphPad |
Additional files
-
Supplementary file 1
Fluorescent oligonucleotide sequences for RNA fluorescence in situ hybridization.
- https://doi.org/10.7554/eLife.47098.023
-
Supplementary file 2
DNA oligonucleotide sequences for oligopaint.
- https://doi.org/10.7554/eLife.47098.024
-
Transparent reporting form
- https://doi.org/10.7554/eLife.47098.025
Download links
A two-part list of links to download the article, or parts of the article, in various formats.
Downloads (link to download the article as PDF)
Open citations (links to open the citations from this article in various online reference manager services)
Cite this article (links to download the citations from this article in formats compatible with various reference manager tools)
Evidence for DNA-mediated nuclear compartmentalization distinct from phase separation
eLife 8:e47098.
https://doi.org/10.7554/eLife.47098


