Cocaine-induced endocannabinoid signaling mediated by sigma-1 receptors and extracellular vesicle secretion
- National Institute on Drug Abuse, National Institutes of Health, United States
- Vanderbilt University Medical Center, Vanderbilt University, United States
- University of Maryland School of Medicine, United States
Figures
Figure 1 with 1 supplement
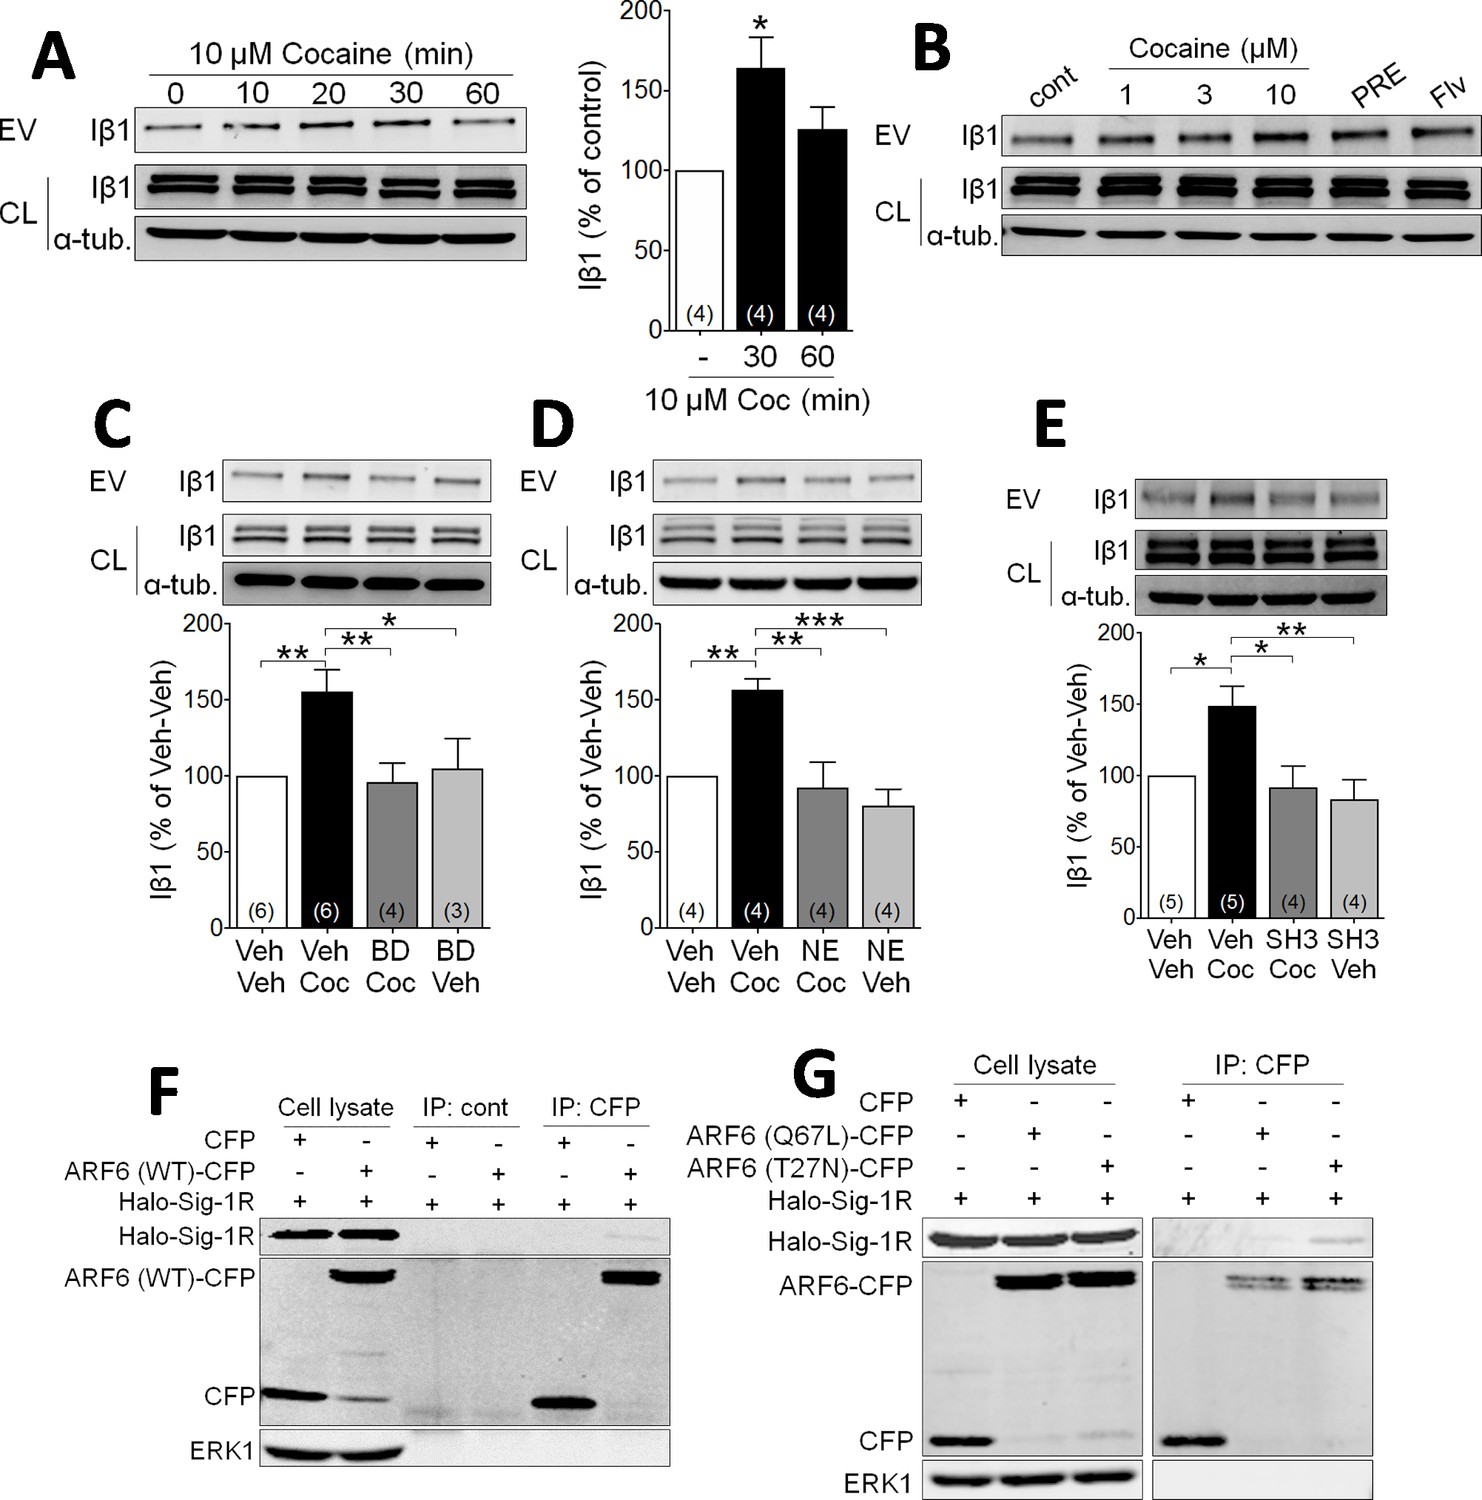
Cocaine stimulates EV release via Sig-1R and ARF6 signaling in NG108 Cells.
(A) Effect of cocaine (10 µM) on integrin β1 (Iβ1) concentration in EV-rich fractions of NG-108 cells at several time points. Western blots also show relative amounts of Iβ1 in cell lysates (CL), and α-tubulin protein (α-tub.) as a control. Bar graph showing the relative change in Iβ1 at 30 and 60 min after cocaine treatment (mean ± S.E.M, F2,9 = 5.7, p=0.026, one-way ANOVA, *=p < 0.05 compared to control, Dunnett’s multiple comparison test). The number of replications of the experiment at left is shown in parentheses for each group in the bar graph. (B) Concentration-dependent effect of cocaine, and effects of the Sig-1R agonists, PRE084 (PRE, 1 µM), and Fluvoxamine (Flv, 10 µM) on Iβ1 concentration in the NG-108 cell culture media, 30 min after treatments (n = 1). (C–D) Sig-1R antagonists prevent cocaine-induced EV release in NG-108 cells. BD1063 (BD, 1 µM) or NE100 (NE, 1 µM) were applied to NG-108 cell cultures 10 min before cocaine treatment (C: means ± S.E.M, F3,15 = 6.2, p=0.006, one-way ANOVA, *=p < 0.05, **=p < 0.01, Dunnett’s multiple comparison test; D: means ± S.E.M, F3,12 = 10.4, p=0.001, one-way ANOVA, *=p < 0.05, **=p < 0.01, ***=p < 0.001, Dunnett’s multiple comparison test). (E) Inhibition of ARF-6 activation by the GEF inhibitor, SH3 (10 µM) blocks the increase in EV release caused by cocaine in NG-108 cells. Cocaine (10 µM) was applied for 30 min, beginning 10 min after SH3 application (n = 4; means ± S.E.M, F3,14 = 6.5, p=0.005, one-way ANOVA, *=p < 0.05, **=p < 0.01, Dunnett’s multiple comparison test). (F) Immunoprecipitation of the Sig-1R/ARF6 complex. Halo-Sig-1R was co-transfected with either cyan-fluorescent protein (CFP) and ARF6 (WT)-CFP into NG108 cells (n = 1). (G) Sig-1R prefers ARF6 inactive form. Halo-Sig-1R was co-transfected with CFP, ARF6 (Q67L: mimicking ARF6-GTP)-CFP, or ARF6 (T27N: mimicking ARF6-GDP)-CFP into NG108 cells and co-immunoprecipitation studies performed (n = 1). The number of replications of each experiment is shown in parentheses for each group in the bar graphs. See Source data 1 for values used in statistical analyses. Figure 1—figure supplement 1 shows that Sig-1R knockdown alters cocaine effects on EV release as well as the identification of the ARF6 binding site in NG108 cells.
Figure 1—figure supplement 1
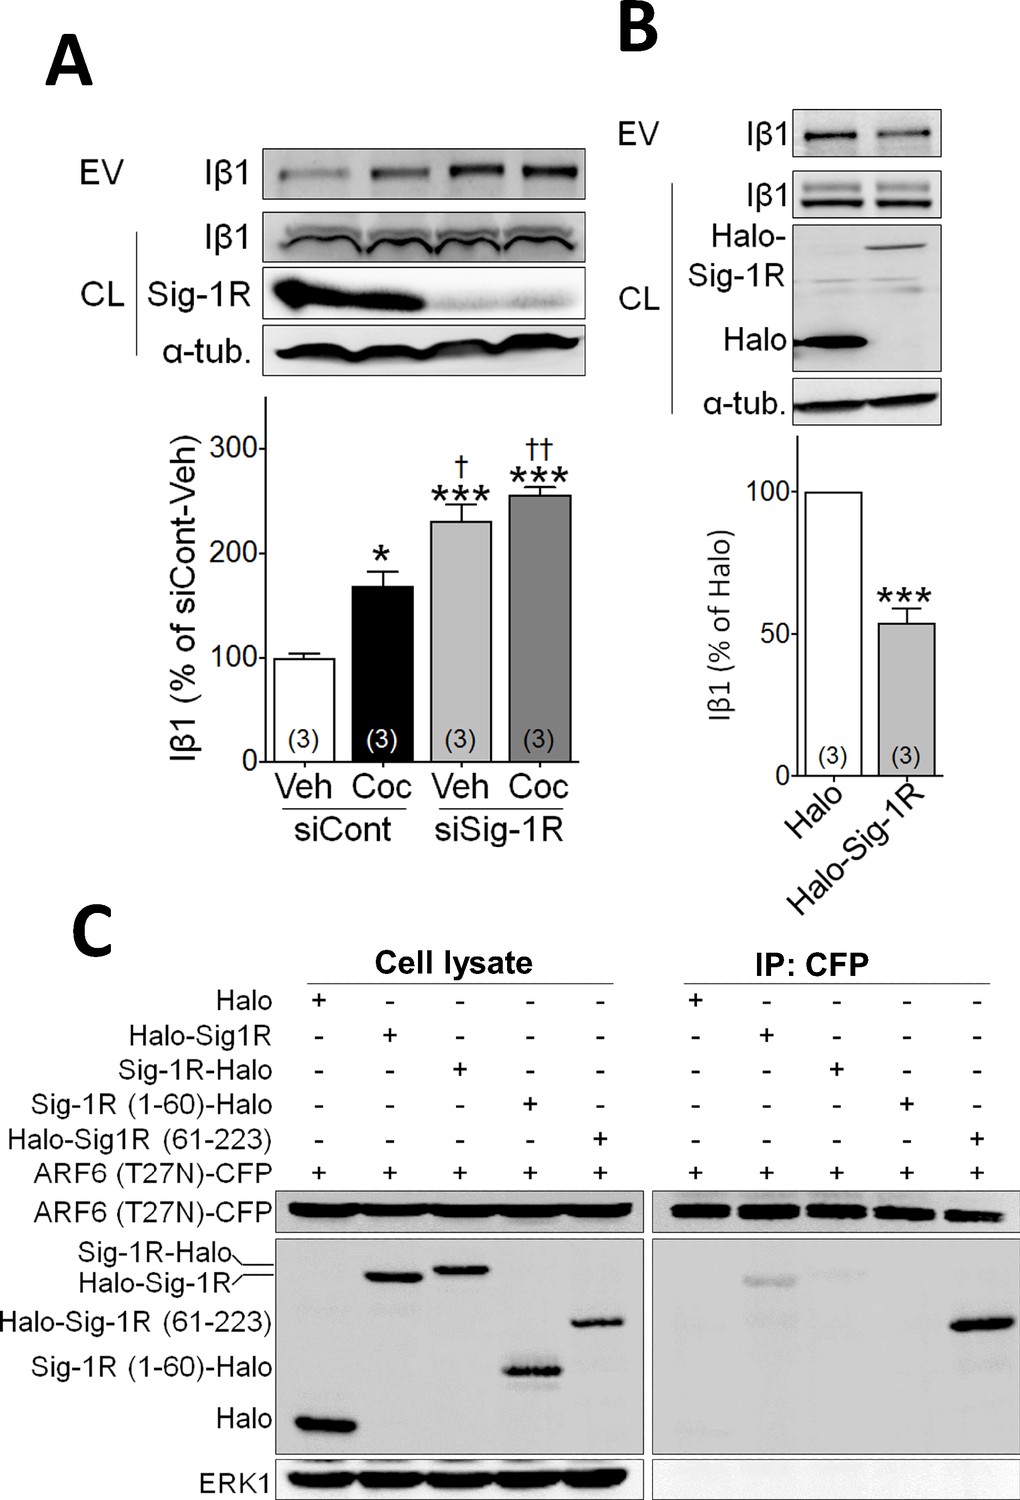
Sig-1R knockdown alters cocaine effects on EV release and identification of the ARF6 binding site in NG108 cells.
(A) Effect of knockdown with siRNA (siRNa caused a 49 ± 12% reduction in Sig-1R expression(p<0.0001, unpaired t-test) on EV release in NG-108 cells (A: means ± S.E.M, F3,8 = 40.19, p<0.0001, one-way ANOVA, *=p < 0.05, ***=p < 0.001 compared with siCont-veh group, †=p < 0.05, ††=p < 0.01 compared with siCont-coc group, Tukey’s multiple comparison test; F: means ± S.E.M, n = 3). (B) Overexpression of the Halo-tagged-Sig-1R reduces EV release (***=p < 0.001, unpaired t-test). (C) ARF6 binds c-terminus of Sig-1R. ARF6 (T27N)-CFP was co-transfected with Halo, Halo-Sig-1R, Sig-1R-Halo, Sig-1R (1-60)-Halo or Halo-Sig-1R (61-223) in NG108 cells. See Source data 1 for values used in statistical analyses.
Figure 2 with 1 supplement

Effect of cocaine on EV secretion in mouse midbrain.
(A) Representative western blots of different sucrose fractions (F1–F6) of EVs isolated from mouse midbrain, showing the markers tyrosine hydroxylase (TH), Iβ1 (Inte. β1), ARF6, Alix, and Flotillin-1. The mitochondrial marker (cytochrome-c: Cyto.-c) was also used as a control, and is western blots from total brain lysates (BL) are also shown (2–3 replicates). (B) Representative western blots from tEVs obtained from midbrain (M), cortex (C), and hippocampus (H) (two replicates). (C) The size distribution of tEVs in mouse midbrain, as measured by NanoSight particle tracking (n = 3 replicates). (D) Proteinase K (PK) treatment of EV preparations from mouse midbrain, with, and without Triton-X (TX) included (two replicates). (E) Effect of cocaine (15 mg/kg, i.p.) on EV markers in preparations from WT mouse midbrain at several 30- and 60 min time points. Bar graphs of the experiments described in E (mean ± S.E.M; TH: F2,12 = 7.3, p=0.0084, one-way ANOVA, *=p < 0.05 compared with naive, Dunnett’s multiple comparison test; Iβ1: F2,9 = 15.2, p=0.001, one-way ANOVA, **=p < 0.01 compared with naive, Dunnett’s multiple comparison test; ARF6: F2,9 = 2.5, p=0.14, one-way ANOVA). (F) Effect of the Sig-1R antagonist (BD1063: BD, 10 mg/kg, s.c.) on cocaine-evoked tEV release in WT mouse midbrain, 30 min after the in vivo cocaine injection. The Bar graphs shows mean effects from these experiments (mean ± S.E.M, TH: F3,12 = 14.2, p=0.0003, one-way ANOVA, **=p < 0.01, ***=p < 0.001, Dunnett’s multiple comparison test; Iβ1: F3,12 = 16.3, p=0.0002, one-way ANOVA, **=p < 0.01, ***=p < 0.001, Dunnett’s multiple comparison test; ARF6: F3,12 = 1.5, p=0.26, n.s., not significant one-way ANOVA). (G) The effect of cocaine on tEV release is absent in Sig-1R knock out mouse midbrain, 30 min after in vivo cocaine injection. The Bar graph shows the means from this experiment (n.s., not significant, unpaired t-test). The number of replications of each experiment is shown in parentheses for each group in the bar graphs. Details All statistical comparisons. See Source data 1 for values used in statistical analyses. Figure 3—figure supplement 1 shows specificity of the Sig-1R antibody. Figure 2—figure supplement 1 shows the protocol for isolation of EVs from mouse midbrain.
Figure 2—figure supplement 1
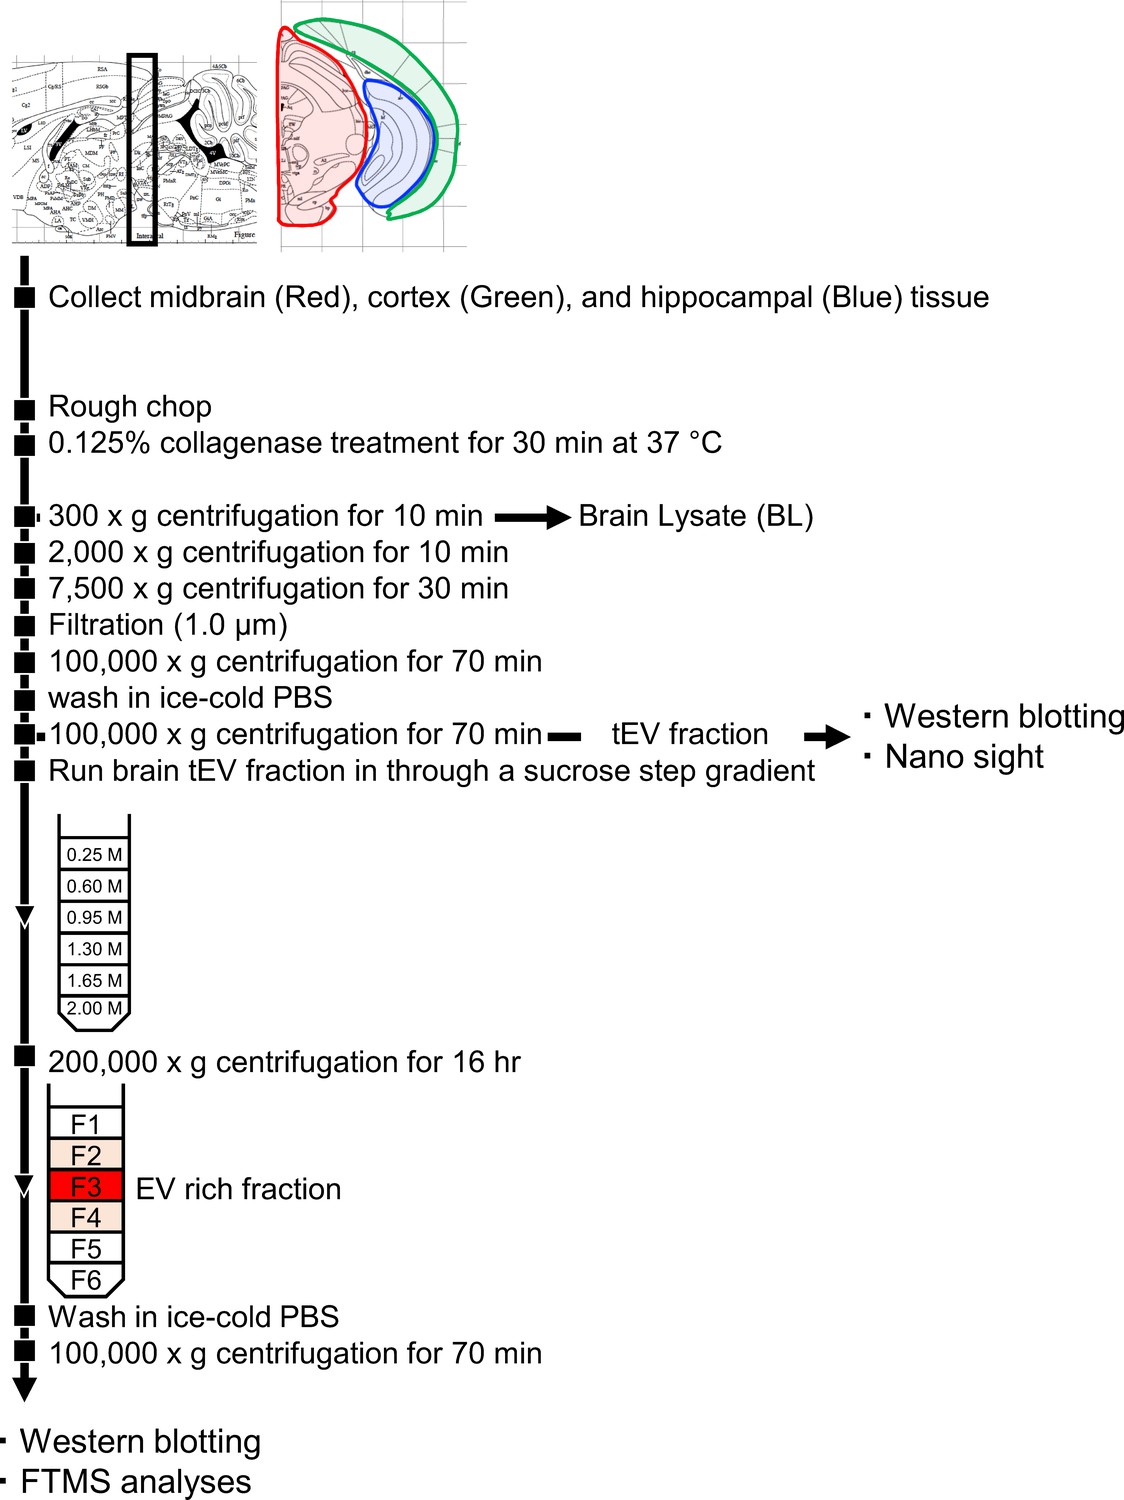
Brain EV Isolation Experimental Flow Chart.
The steps of the experimental procedure designed to isolate and purify brain EVs from mouse brain.
Figure 3 with 1 supplement
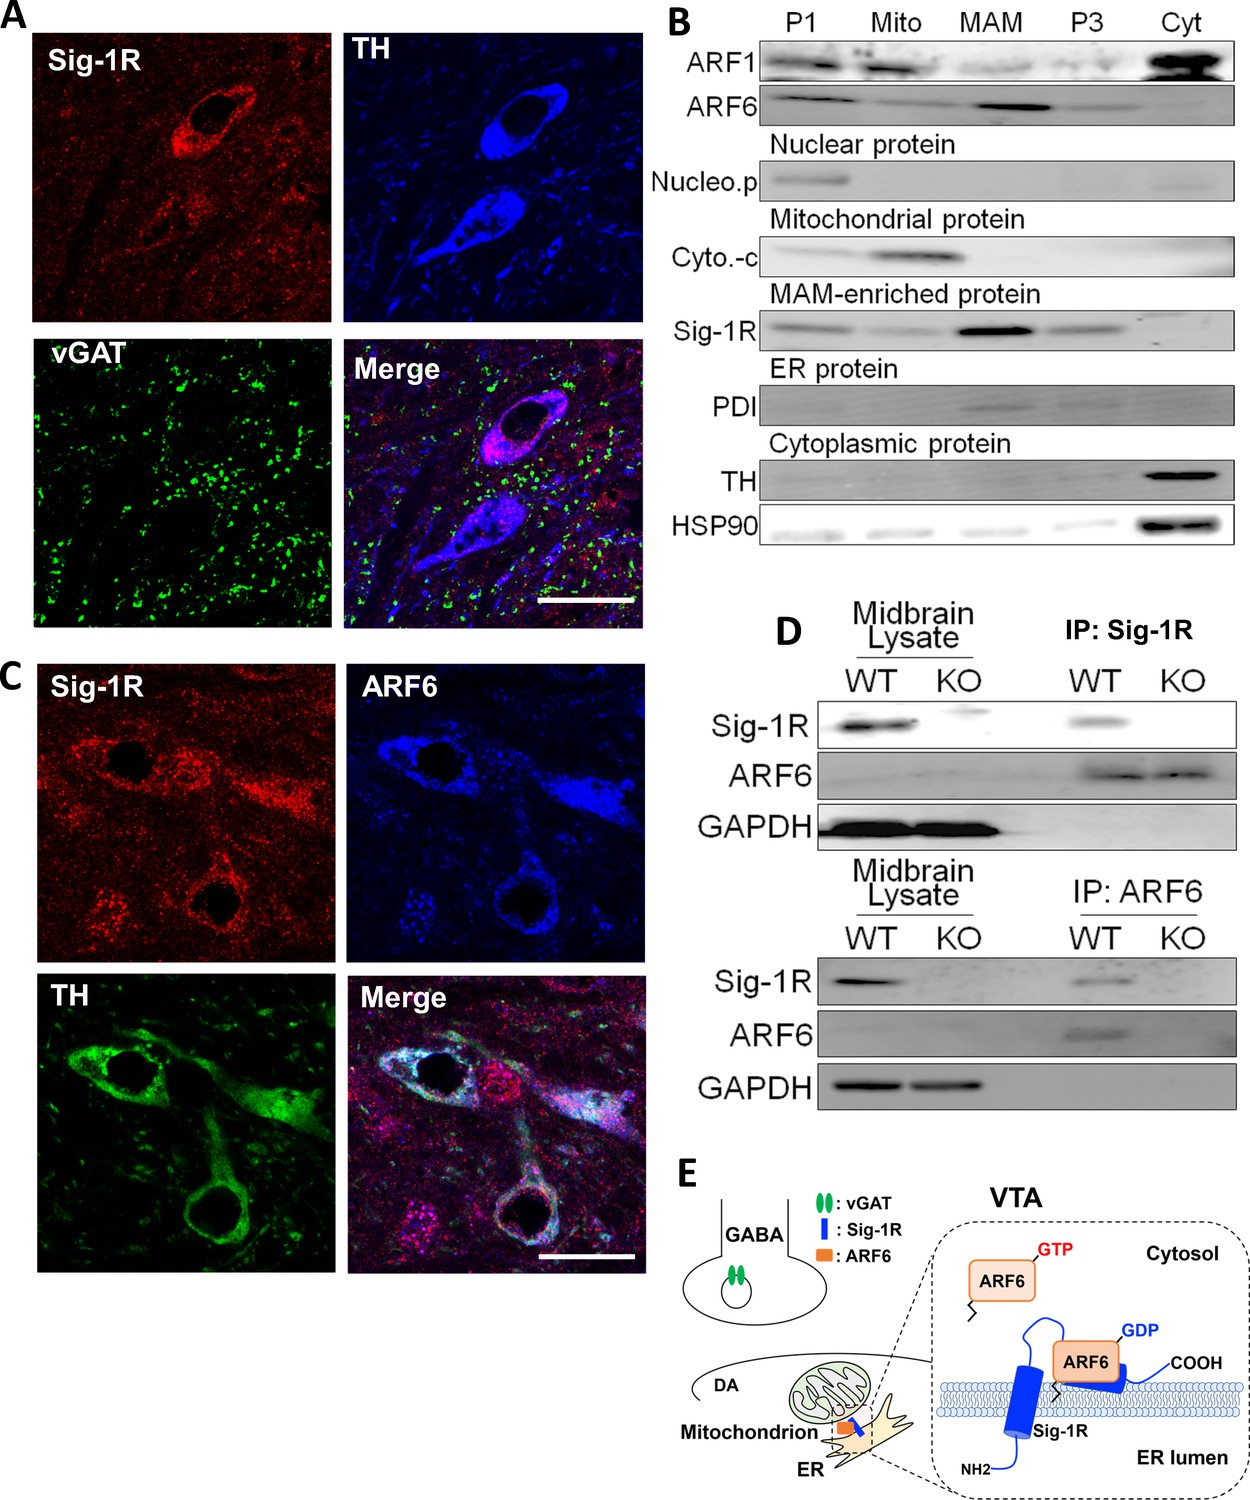
The Sig-1R interacts with ARF6 at the MAM in mouse midbrain.
(A) Confocal microscopy shows Sig-1R fluorescence immunostaining (Red) in association with either TH (Blue)-, or vGAT (Green)-positive neurons in the wildtype mouse VTA. Scale bar = 50 µm. (B) The subcellular distribution of proteins in wildtype mouse midbrain (P1: nuclear fraction; Mito: mitochondrial fraction; P3: microsomal fraction, containing plasma membrane and ER; Cyt: cytosolic fraction; NucleoP: nucleoporin p62; Cyto-c: cytochrome-c; TH: tyrosine hydroxylase; HSP90: heat-shock protein 90). (C) Confocal microscopic images showing co-localization of fluorescence immunostaining of the Sig-1R (Red) and ARF6 (Blue) in TH (Green)-positive neurons in the wildtype mouse VTA (scale bar = 20 µm). (D) Immunoprecipitation (IP) of the Sig-1R/ARF6 complex. Brain lysates were prepared from wildtype or Sig-1R KO mouse midbrain, immunoprecipitated with anti-ARF6 antibody, and then probed with anti-Sig1R, ARF6, and GAPDH antibody. (E) Schematic drawing of the interaction between Sig1R and ARF6 in mouse midbrain. Each experiment was replicated twice. Figure 3—figure supplement 1 shows the absence of Sig-1R immunofluorescence in the Sig-1R knockout mouse brain. Also see Figure 8—figure supplement 1 for proposed interaction between the Sig-1R and ARF6.
Figure 3—figure supplement 1
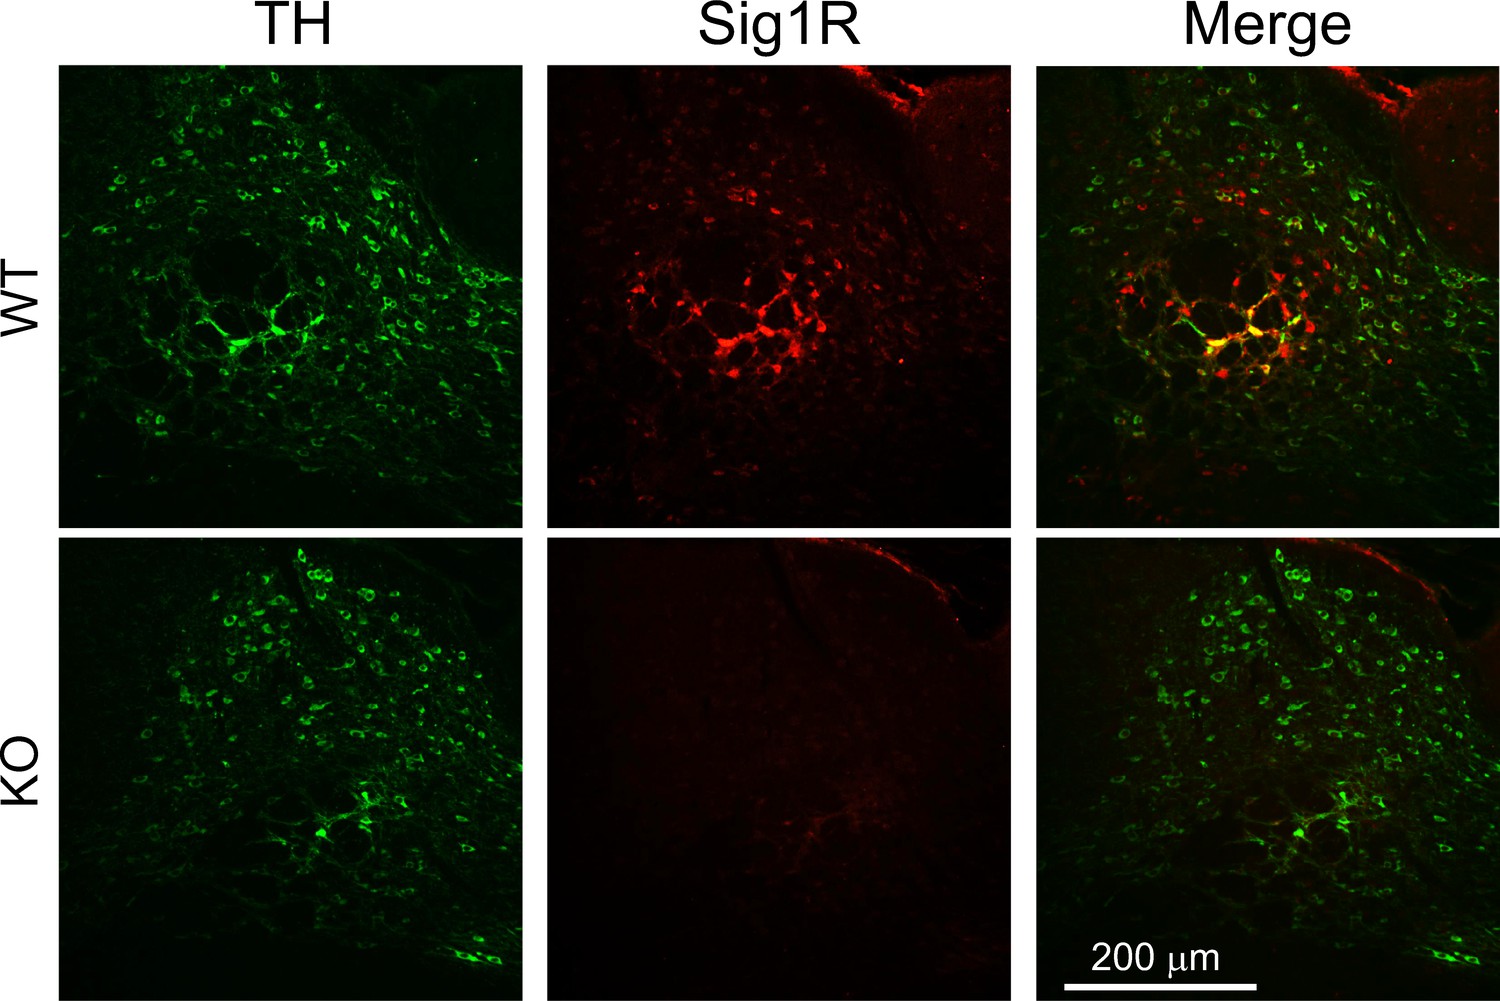
Absence of Sig-1R immunofluorescence in Sig-1R knockout mouse brain.
Immunofluorescence shows co-localization of tyrosine hydroxylase and Sig-1R signals in wildtype (WT) mouse ventral midbrain (top panels), and absence of Sig-1R signal in the Sig-1R knockout (KO) mouse tissue (bottom panels; n = 2 replications).
Figure 4
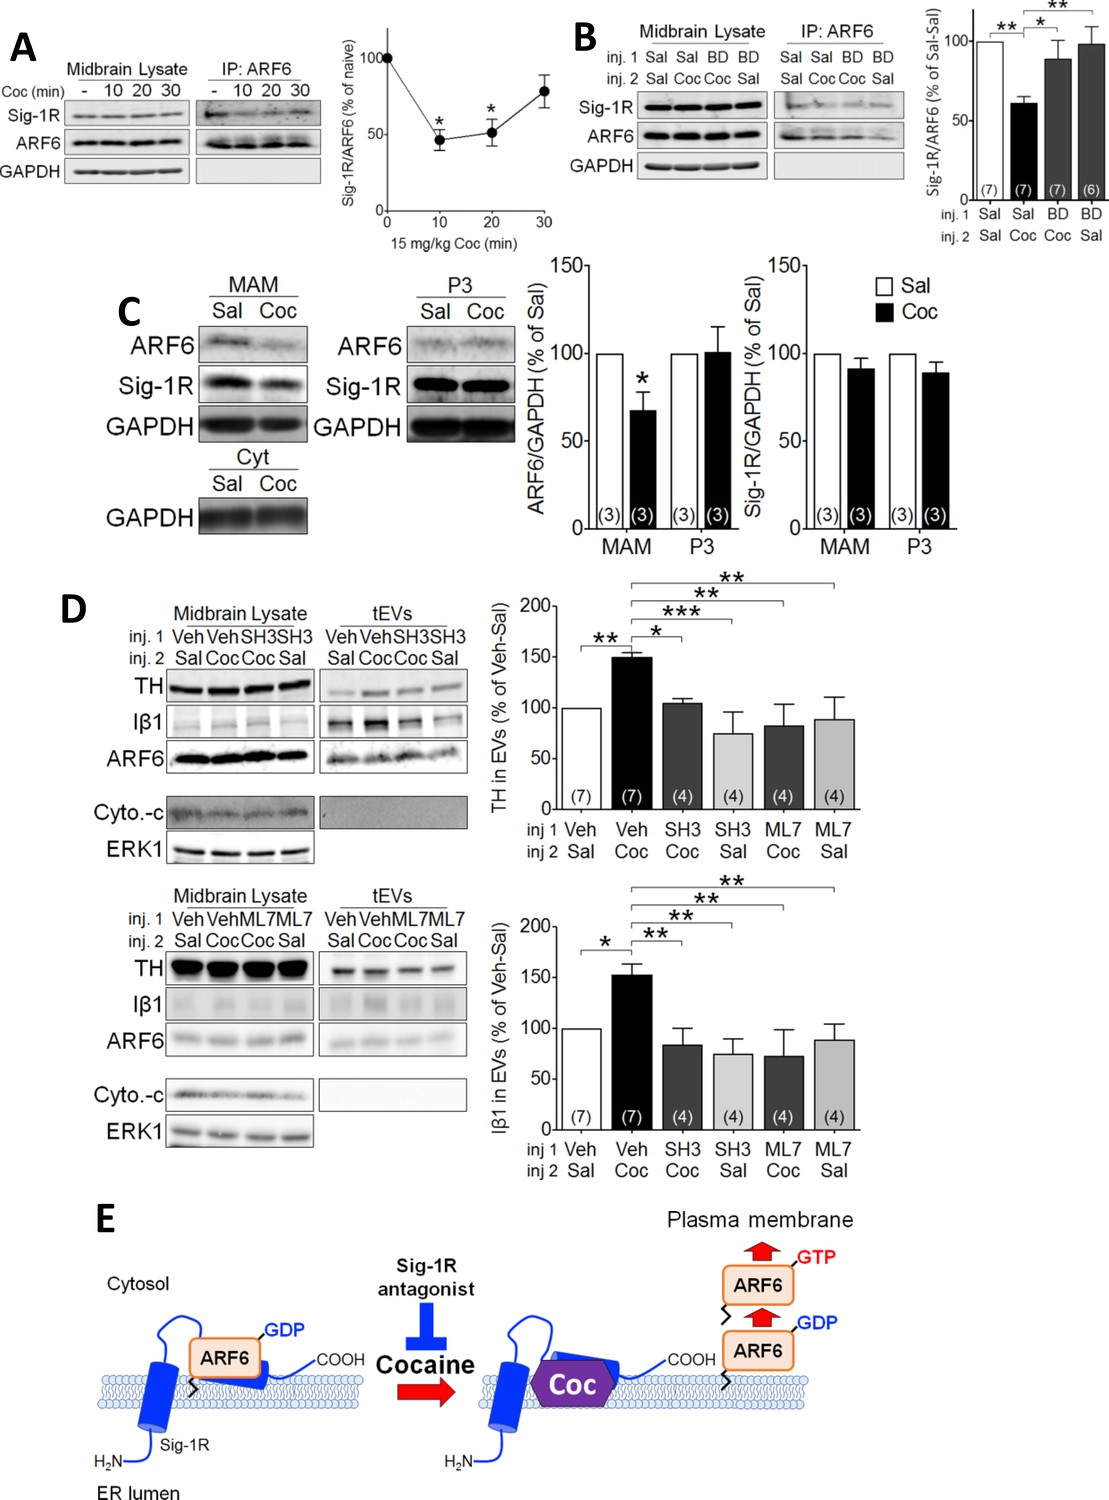
Cocaine causes translocation of ARF6 via its dissociation from the Sig-1R in mouse midbrain.
(A) Western blots showing that cocaine reduces the interaction between ARF6 and the Sig-1R in a time-dependent manner in mouse midbrain. The graph shows mean (± s.e.m.) of co-IP of ARF6 and Sig-1R, before, and 10, 20 and 30 min after in vivo cocaine injection (n = 4; (F3,12 = 4.3, p=0.028, one-way ANOVA, *=p < 0.05 compared with naive, Dunnett’s multiple comparison test). *p<0.05, **p<0.01; one-way ANOVA followed by Dunnett post-hoc test). (B) Effect of the Sig-1R antagonist BD1063 (BD, 10 mg/kg, s.c.) on the dissociation of the ARF6-Sig-1R complex in mouse midbrain, 10 min after i.p. cocaine injection. BD1063 was injected 20 min before cocaine. The bar graph represent mean ± s.e.m. (n = 7; F3,23 = 5.3, p=0.006, one-way ANOVA, *=p < 0.05, **=p < 0.01, Dunnett’s multiple comparison test (C) Western blots showing the effect of cocaine versus saline injection on ARF6 concentration associated with the MAM, or P3 in mouse midbrain at 10 min post-i.p. injection. Bar graphs show mean (± S.E.M., n = 3) expression of ARF6 or Sig-1R as a proportion of GAPDH protein in MAM or P3 preparations, for all conditions, expressed as the percent response observed following saline injection (*=p < 0.001, unpaired t-test). (D) Western blots showing the effect of the ARF6 GEF inhibitor (SecinH3: SH3, 10 µmol/kg, s.c.) or the MLCK inhibitor, ML7 (2 µM, s.c.) on cocaine-evoked EV marker release in mouse midbrain, 30 min after i.p. cocaine or saline injection. SH3, ML7, or vehicle was injected 20 min prior to cocaine or saline injection. ERK1 is used as a control protein. The bar graphs represent the mean (± S.E.M) concentration of TH or Iβ1 expressed as a percentage of the level seen following vehicle-saline control injections(n = 4–7, TH: F3,12 = 7.9, p=0.004, one-way ANOVA, *=p < 0.05, **=p < 0.01, Dunnett’s multiple comparison test; Iβ1: F3,12 = 7.0, p=0.006, one-way ANOVA, *=p < 0.05, **=p < 0.01, Dunnett’s multiple comparison test). (E) Schematic illustrating of the effect of cocaine on the Sig1R-ARF6 interaction in mouse midbrain. See Source data 1 for values used in statistical analyses. Also see Figure 8—figure supplement 1 for proposed interaction between the Sig-1R and ARF6 and cocaine.
Figure 5 with 1 supplement
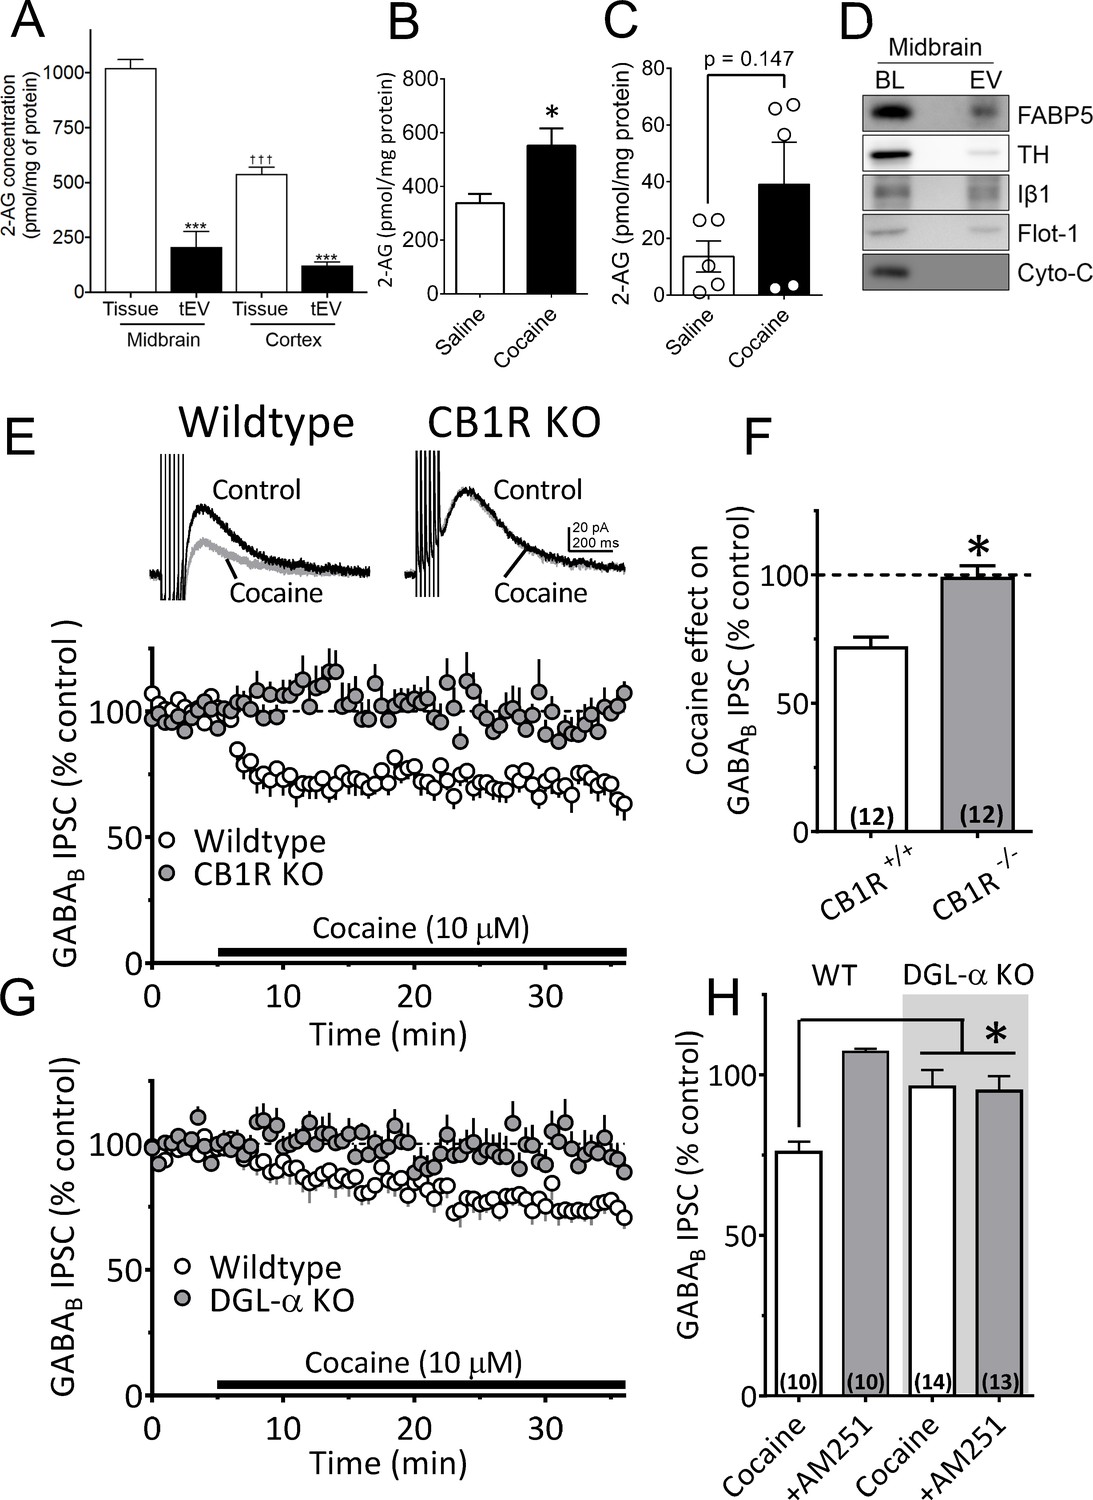
Cocaine-stimulation of 2-AG accumulation in midbrain tEVs and brain slices.
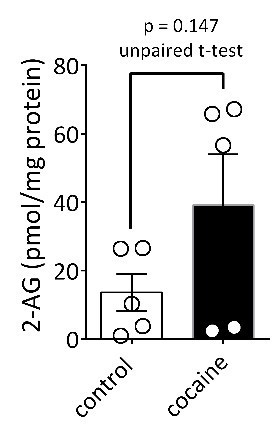
(A) Levels of 2-AG measured in midbrain and cortex tissue homogenates and in tEVs from these same brain regions using Fourier transform mass spectrometry (FTMS; F3,8 = 86.92, p<0.0001; Tukey’s posthoc test, ***=p < 0.05, †††=p < 0.05, tissue midbrain vs. cortex, n = 3). (B) Comparison of the concentration of 2-AG in midbrain homogenates from mice injected with saline or cocaine 15 min prior to dissection (mean ± S.E.M.; *=p < 0.05, unpaired Student’s t-test, n = 3). (C) Levels of 2-AG measured using FTMS in fr3 containing tEVs isolated from mouse midbrain 15 min after in vivo injection with saline or 10 mg/kg cocaine. Each point represents data pooled from three mice (t8 = 1.61, p=0.147, unpaired Student’s t-test; n = 15 mice per group). (D) Western blots detecting fatty acid binding protein-5 (FABP5), TH, Iβ1, Flot-1 and Cyto-C in either whole brain lysate (BL) or in the EV fraction (fr3) obtained via sequential centrifugation and sucrose-gradient separation. Note that all EV marker proteins are detected in the BL preparation and that FABP5 is also found in this EV fraction. (E) Cocaine stimulates 2-AG inhibition of GABA release onto VTA DA neurons in vitro. Cocaine application inhibits GABAB-receptor-mediated synaptic IPSCs in DA neurons from wildtype mice, but not in CB1R knockout (KO) mice. (F) Mean inhibition by cocaine of IPSCs in wildtype and CB1R-KO mice (p=0.0004, unpaired t-test). (G) The inhibition of IPSCs by cocaine is absent in mice lacking the gene (Dagla) encoding the 2-AG synthetic enzyme, DGL-α, in DA neurons. (H) Mean effects of cocaine on IPSCs in the presence and absence of the CB1R antagonist/inverse agonist (AM251, 4 µM) in wildtype and DGL-α-KO mice. Note the reversal of the cocaine inhibition by AM251 in wildtype DA neurons, the absence of inhibition of IPSCs by cocaine, and lack of effect of AM251 in the neurons from DGL-α-KO mice (F3, 40 = 8.3, p=0.0002, one-way ANOVA, p=0.009, Tukey’s multiple comparison post-hoc test). Figure 5—figure supplement 1 shows that blockade of CB1Rs or 2-AG synthesis also prevents inhibition of IPSCs by cocaine. See Source data 1 for values used in statistical analyses.
Figure 5—figure supplement 1
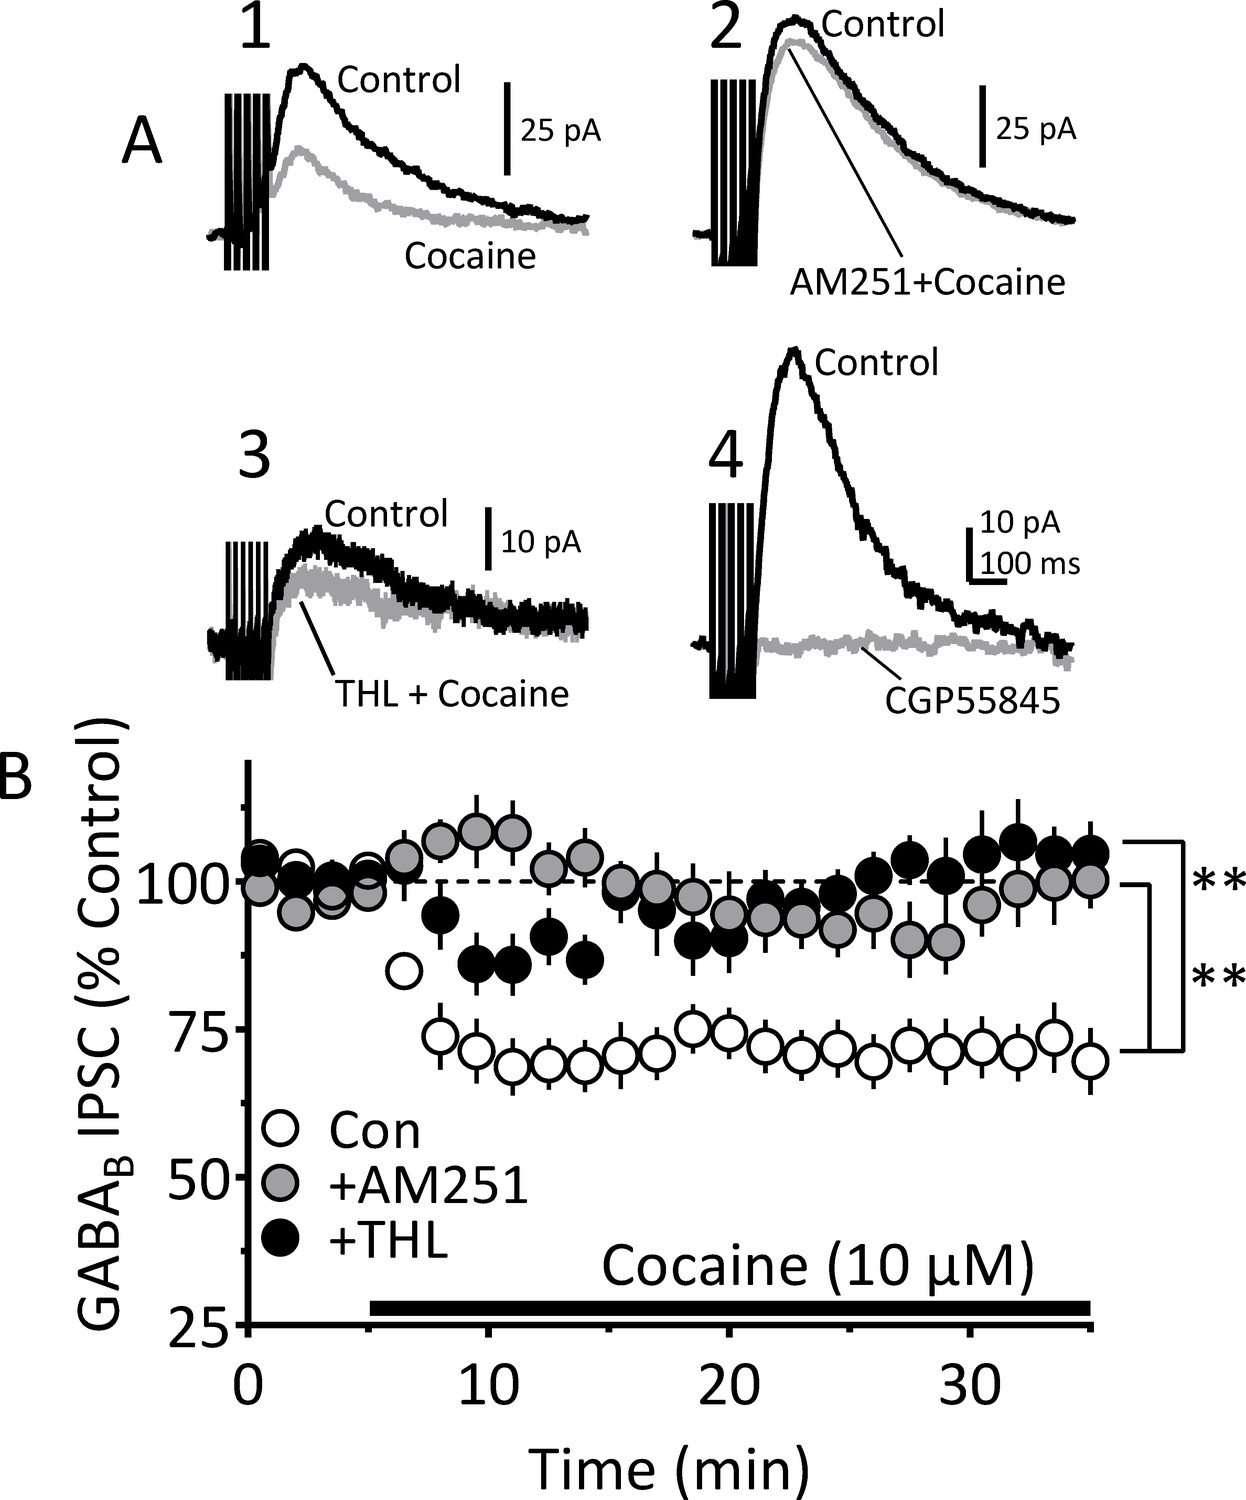
Blockade of CB1Rs or 2-AG synthesis prevents inhibition of IPSCs by cocaine.
Electrophysiological recordings of GABAB receptor IPSCs evoked by a five pulse/50 Hz electrical stimulus in VTA DA neurons. (A) Mean waveforms showing GABAB IPSCs obtained from four different VTA DA neurons in four separate experiments. (A1) Shows a control GABAB IPSC mean waveform (black line), collected during the first 5 min of recording, and that recorded 20 min after beginning cocaine (10 µM) application (gray line). (A2) Mean representative waveforms showing a control GABAB IPSC (black) and the relative lack of inhibition by cocaine following pretreatment with AM251 (2 µM; gray line). (A3) Mean waveforms showing a control IPSC (black) and the relative lack of inhibition by cocaine following pretreatment with the DGLα inhibitor THL (2 µM; gray line), which prevents 2-AG synthesis. (A4) Mean waveforms showing complete blockade of the IPSC by the selective GABAB receptor antagonist CGP55845 (10 µM). (B) Mean time course showing the effect of cocaine on GABAB IPSCs under control conditions (Con; 11 cells/7 mice), and in separate groups of cells pretreated with AM251 (10 cells/ 6 mice) or THL (13 cell/ 7 mice) for 20 min before cocaine. Either AM251 or THL significantly prevented GABAB IPSC inhibition by cocaine (2-way, repeated measures ANOVA time x treatment interaction, F144, 2232 = 2.70, p<0.0001; Sidak’s post-hoc test, **=p < 0.0001, compared to control). See Source data 1 for values used in statistical analyses.
Figure 6 with 1 supplement
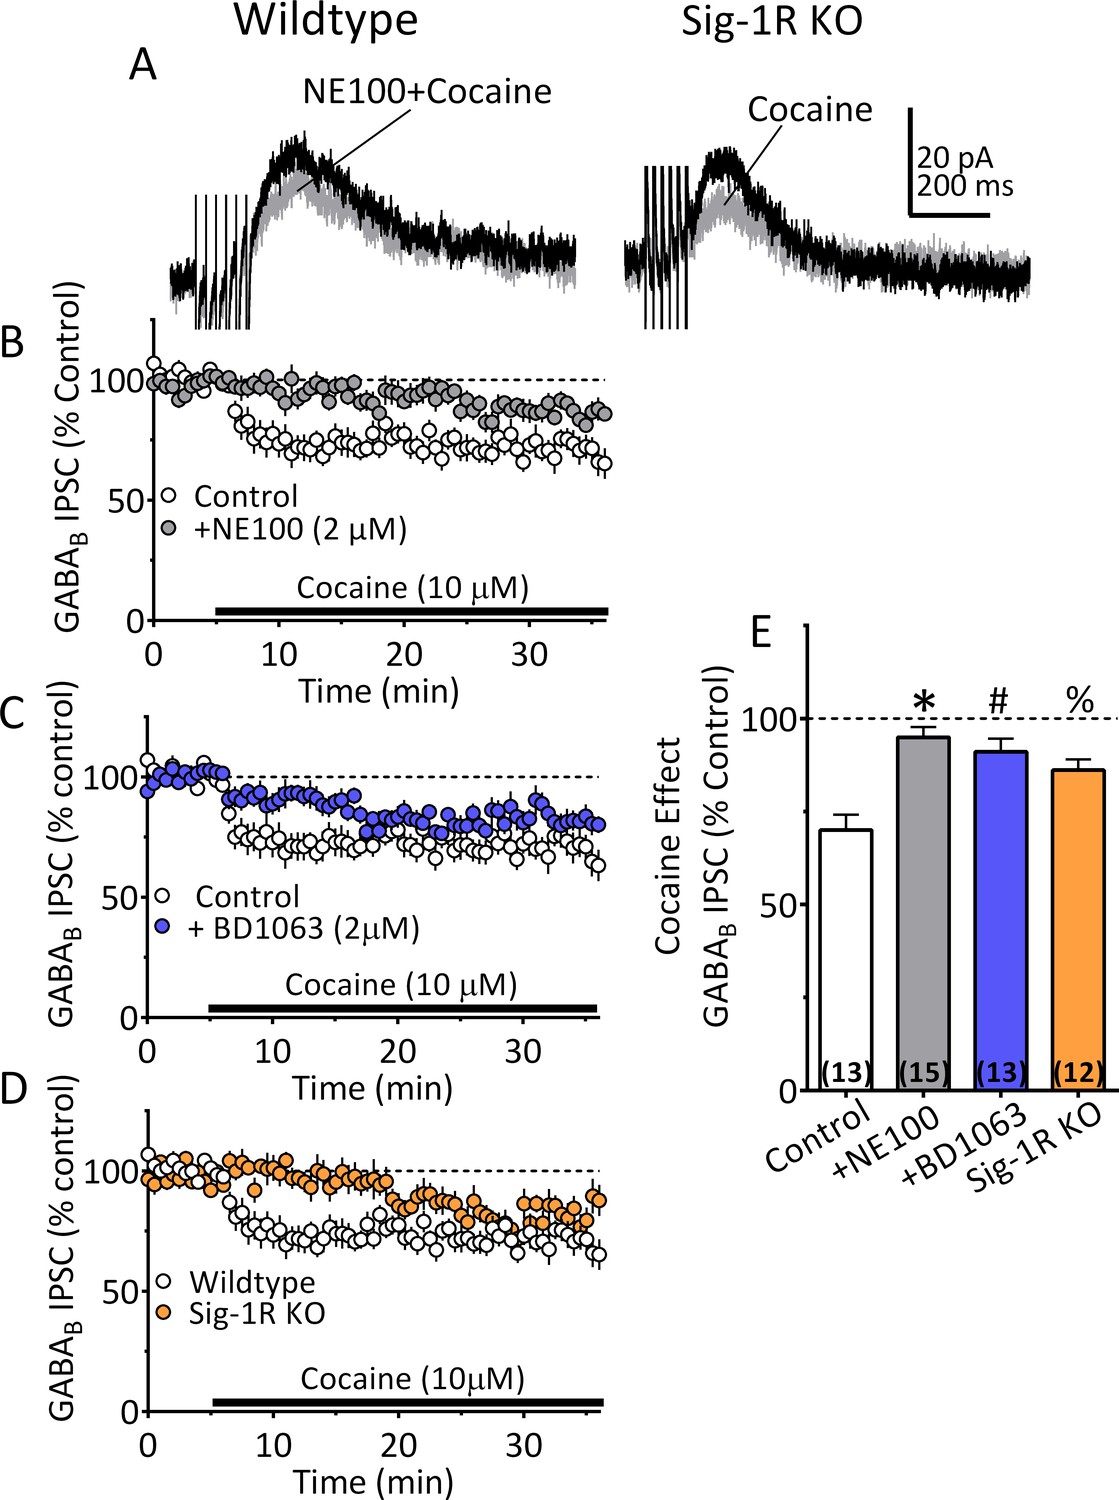
Inhibition of IPSCs by cocaine in VTA DA neurons depends upon Sig-1Rs.
(A) Mean waveforms showing the effect of cocaine (10 µM) on GABAB IPSCs in a DA neuron from a wildtype mouse during application of the Sig-1R antagonist NE100 (2 µM, left), or in a cell from a Sig-1R KO mouse (right). (B) Mean time-course showing effect of cocaine on IPSCs in absence (Control) and presence of NE100 in wildtype mice. (C) Mean time-course showing effect of cocaine on IPSCs in absence (Control) and presence of BD1063 (2 µM) in wildtype mice. (D) Time-course of cocaine effects in wildtype and Sig-1R KO mice. (E) Summary of Data shown in A-D. The inhibition of IPSCs by cocaine was significantly reduced by NE100 or BD1063 in wildtype mice and was significantly smaller in Sig-1R KO mice (F3,49 = 10.90, one-way ANOVA, p<0.0001; *=p < 0.0001, #=p = 0.0002, %=p = 0.005, Dunnett’s multiple comparisons post-hoc test. Figure 6—figure supplement 1 shows that antagonism or knockout of the Sig-1R does not change CB1R function in mouse VTA DA neurons. See Source data 1 for values used in statistical analyses.
Figure 6—figure supplement 1
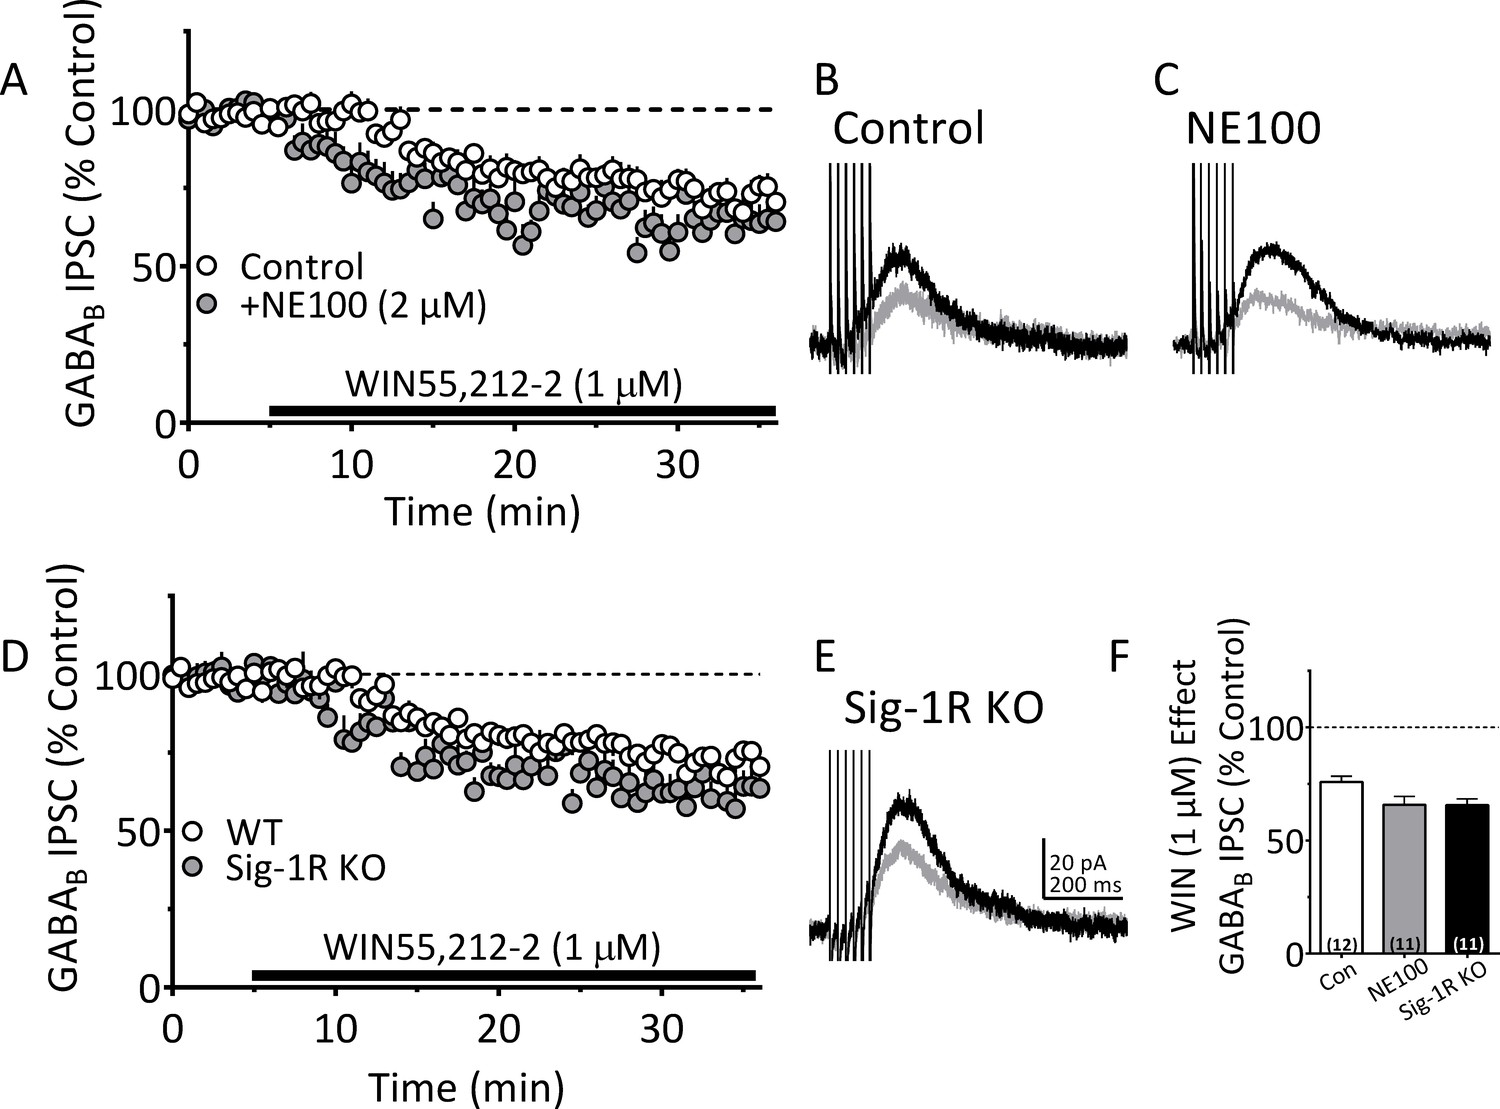
Antagonism or knockout of the Sig-1R does not reduce CB1R function in mouse VTA DA neurons.
(A) Mean time-course of the effect of the CB1R agonist WIN55,212–2 (WIN; 1 µM) on electrically-evoked GABAB receptor-mediated IPSCs in the absence (Control, n = 12 neurons), or presence of the Sig-1R antagonist NE100 (2 µM; n = 11 neurons). (B) and (C) Averaged GABAB IPSCs collected before WIN application (black lines), or during WIN application (gray lines) in absence or presence of NE100. (D) Mean time-course of the effect of WIN on IPSCs in DA neurons from wildtype (WT, n = 12 neurons) or Sig-1R knockout mice (n = 11 neurons). (E) Averaged IPSCs collected before WIN (black line), or during WIN application (gray) in a neuron from a Sig-1R KO mouse. (F) Summary of the effect of WIN on IPSCs in experiments described in A-E, one-way ANOVA, F2,31 = 3.84, p=0.032, Tukey’s posthoc test, Control vs. NE100 p=0.062, Control vs. Sig1-KO, p=057. Scale bar in E applies to B and C as well. See Source data 1 for values used in statistical analyses.
Figure 7 with 1 supplement
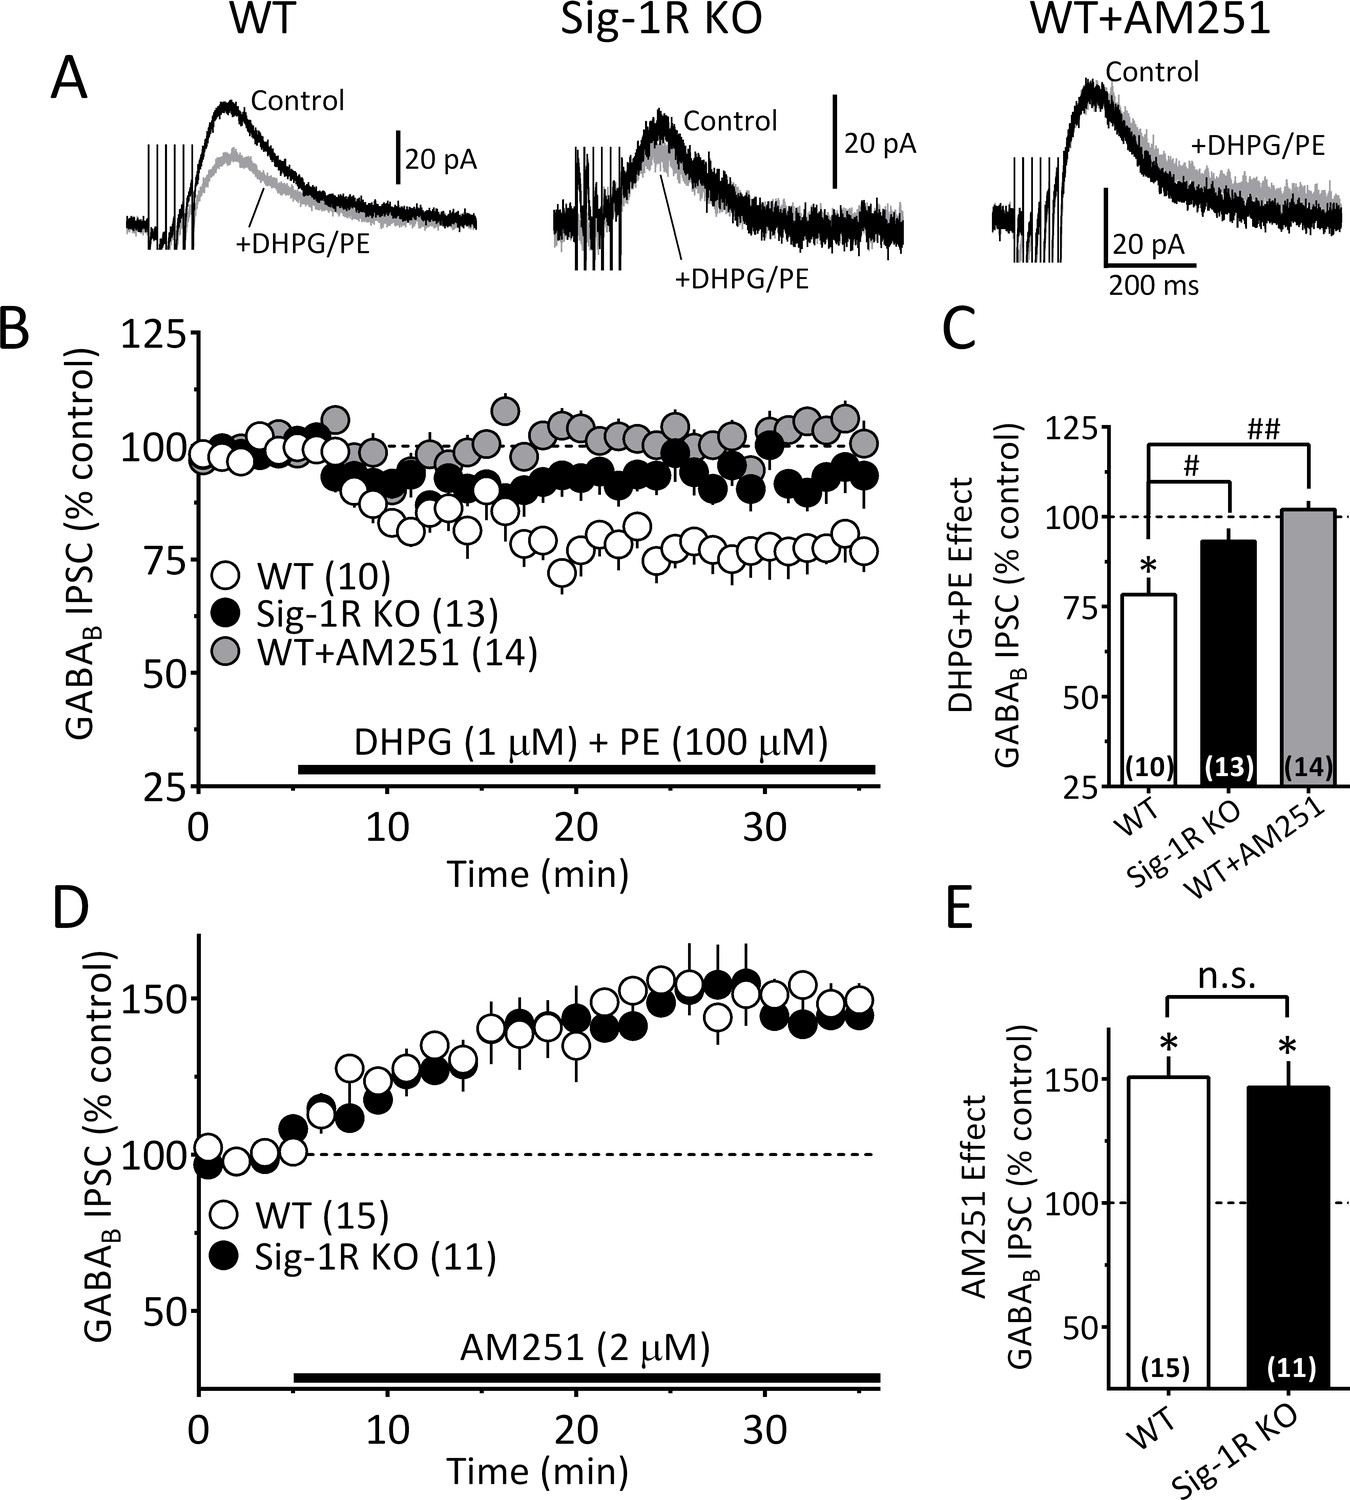
The Sig-1R is necessary for GPCR-induced but not tonic 2-AG release in the mouse VTA.
(A) Mean GABAB IPSC waveforms collected during baseline (control, black line) and during co-application of DHPG and PE (gray line), in DA neurons from wildtype (WT, left), and Sig-1R knockout (KO, center) mice. Also shown is the effect of DHPG+PE in a representative neuron from a WT mouse following preincubation with AM251 (right). (B) Mean time courses of the effects of DHPG+PE in DA neurons from WT, sig-1R KO mice, and WT mice that had been pre-treated with AM251. The effect of DHPG+PE was significant (one-way repeated measures ANOVA, F1.5, 110 = 133, p<0.0001), and this was significantly reduced in the Sig-1R KO, and by AM251 (Tukey’s post hoc test p<0.0001). (C) Bar graph of data from the last 5 min of application of DGPG+PE as shown in B. The inhibition of IPSCs by DHPG+PE was significant (t9 = 4.5, *=p = 0.0014, and the this was significantly reduced in the Sig-1R KO and AM251 groups (F2,34 = 11.0, p=0.0002, one-way ANOVA; ##=p < 0.0001; #=p = 0.0013, Dunnett’s posthoc test, the number of cells in each condition is indicated in parentheses). (D) Mean time course showing tonic inhibition of GABAB IPSCs by endogenous 2-AG, as revealed by antagonist of CB1Rs with AM251 in neurons from wildtype (WT) and Sig-1R KO mice (n = 15 and 11, respectively). (E) Bar graph of the change in IPSC amplitude during the last 5 min of AM251 application for data shown in D. AM251 caused a significant increase in mean IPSC amplitude in both groups (two-tailed unpaired t-test; **=p < 0.0001, *=p = 0.001), but there was no significant difference in this effect between groups (n.s. = not significant, two-tailed unpaired t-test, p=0.76). These data show that Sig-1Rs are necessary for the GPCR-induced 2-AG release caused by DHPG+PE (A–C), but not for tonic non-GPCR-dependent 2-AG release (D–E), and they suggest that DGLα function is not impaired in Sig-1R KO mice. Figure 7—figure supplement 1 shows kinetic differences between 2-AG function elicited by DHPG+PE and cocaine in the mouse VTA. See Source data 1 for values used in statistical analyses.
Figure 7—figure supplement 1
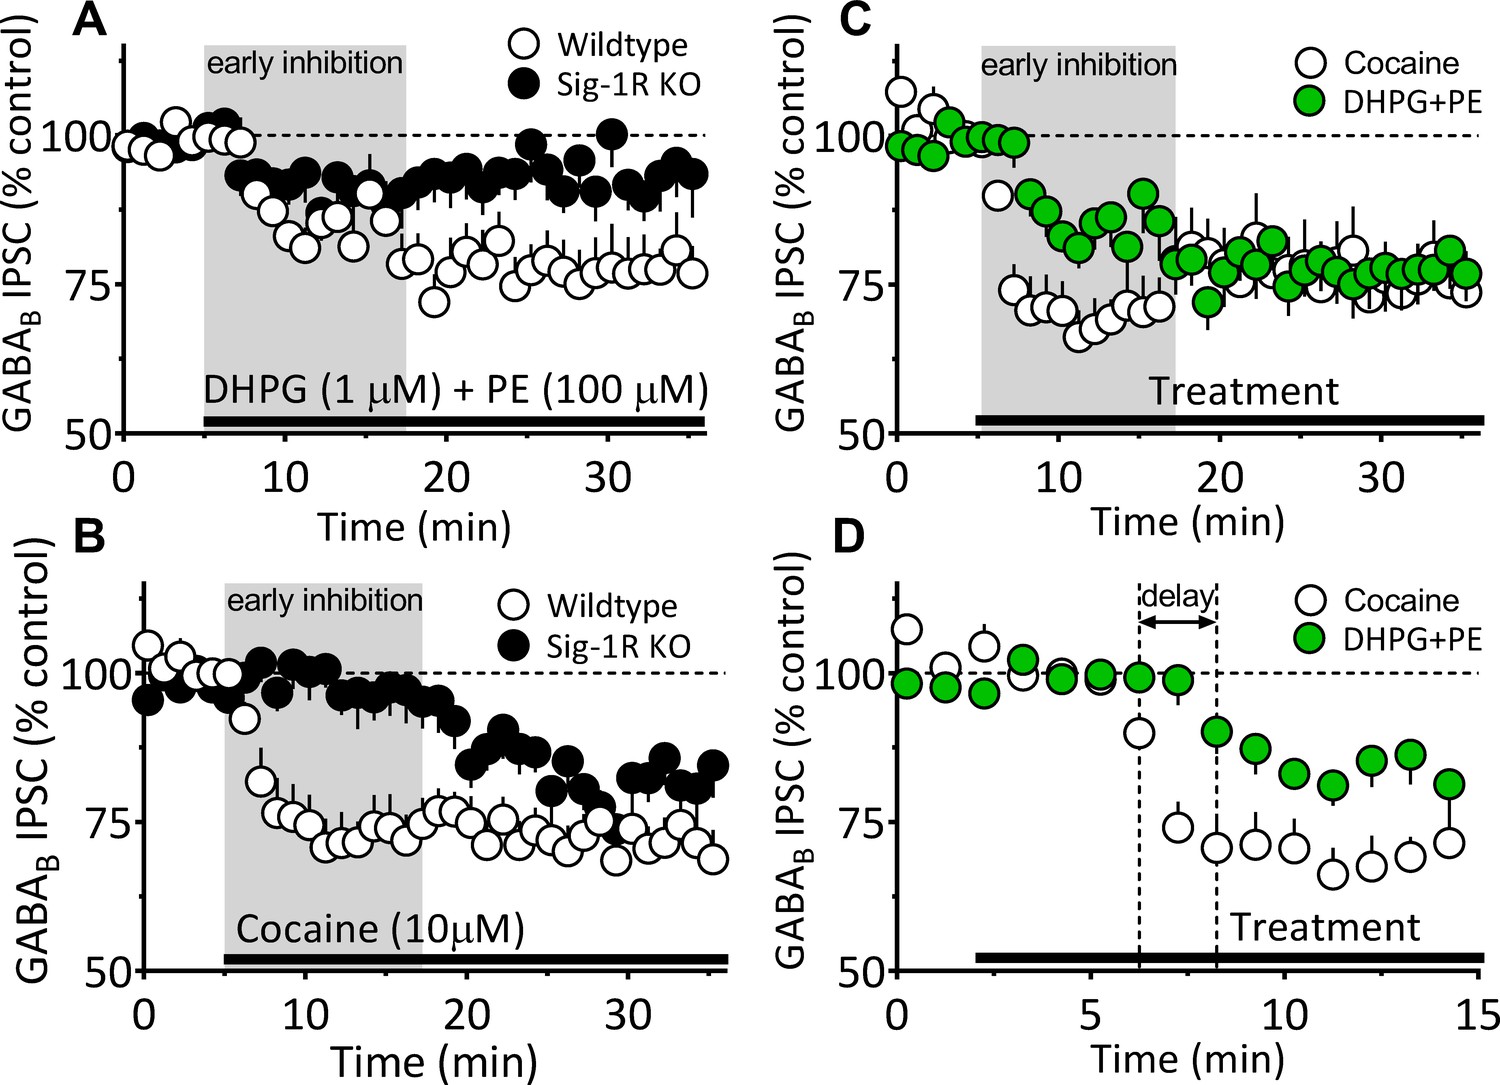
Differences between 2-AG function elicited by DHPG+PE and cocaine in the mouse VTA.
(A–B) Replotting of time course data from Figure 7B and Figure 6B showing inhibition of IPSCs in VTA DA neurons by either DHPG+PE (A) or cocaine (B) in wildtype or Sig-1R KO mice. The period defining the faster, early inhibition that is more prominent with cocaine than with DHPG+PE is illustrated with the gray background in panels A–C. (C) Data from panels A and B showing only responses of wildtype neurons to either cocaine or DHPG+PE illustrating the difference in early inhibition. (D) Data from C plotted on an expanded time scale to illustrate the faster onset of the effect of cocaine on IPSCs, compared to that of DHPG+PE. These comparisons show that the inhibition of IPSCs produced by DHPG+PE is delayed (horizontal arrow) and smaller during the early phase of inhibition compared to cocaine.
Figure 8 with 1 supplement
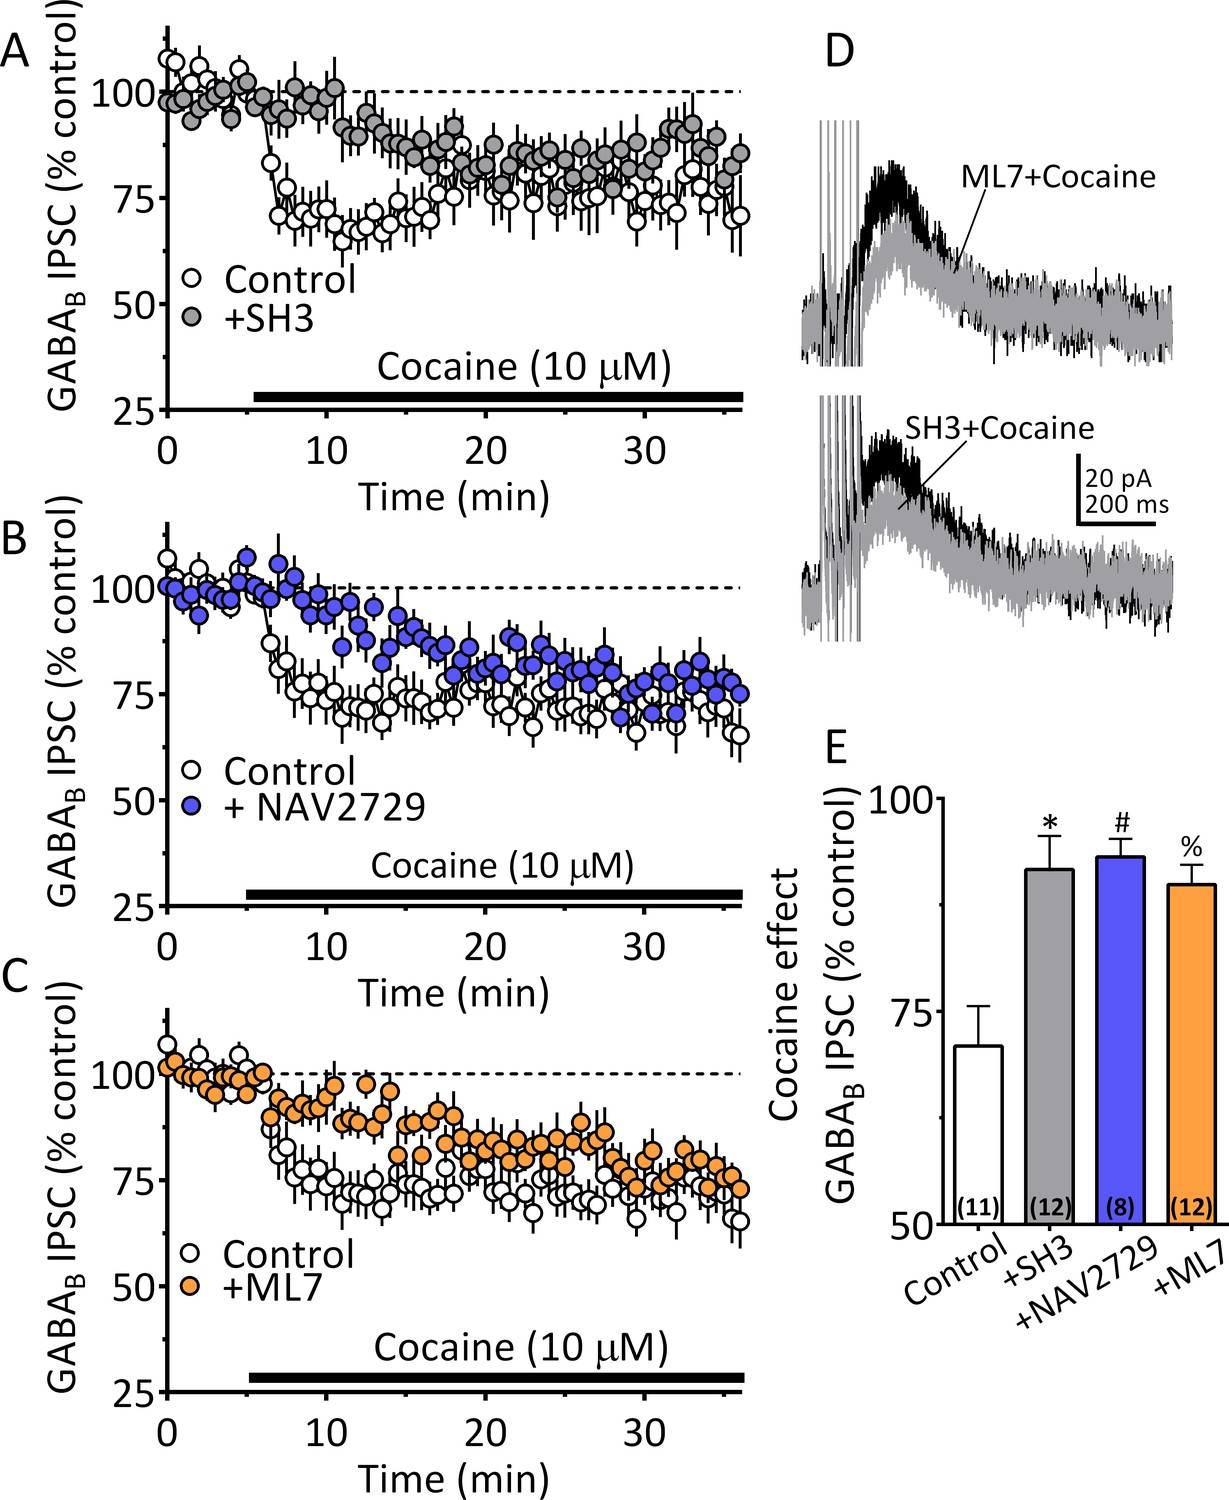
Cocaine stimulated 2-AG inhibition of GABA release is blocked by ARF6 inhibitors or myosin-light chain kinase (MLCK) inhibition.
(A) Mean time-course of the effect of cocaine on GABAB IPSCs under control conditions, and during incubation with the ARF6 GEF inhibitor SH3 (10 µM). (B) Mean time-course of the effect of cocaine on the GABAB IPSCs under control conditions and during incubation with direct ARF6 inhibitor NAV2729 (10 µM). (C) Mean time-course of the effect of cocaine on the GABAB IPSCs under control conditions and during incubation with the MLCK inhibitor ML7 (2 µM). (D) Mean waveforms of GABAB receptor-mediated IPSCs after addition of cocaine in cells preincubated with ML7 or SH3. (E) Summary of data with ML7, SH3, and NAV2729, shown in A-C. The effect of cocaine is significantly reduced by SH3, NAV2729, and ML7 (F3,39 = 8.7, p=0.0002, one-way ANOVA, **=p < 0.001, Dunnett’s multiple comparison test, *=p = 0.0003, #=p = 0.0005, %=p = 0.001; n for each condition shown in parentheses). Figure 8—figure supplement 1 shows our model of the proposed mechanisms underlying the cocaine-regulated synthesis and release of 2-AG in VTA DA neurons and the involvement of EVs and Sig1R-ARF6 signaling pathway See Source data 1 for values used in statistical analyses.
Figure 8—figure supplement 1
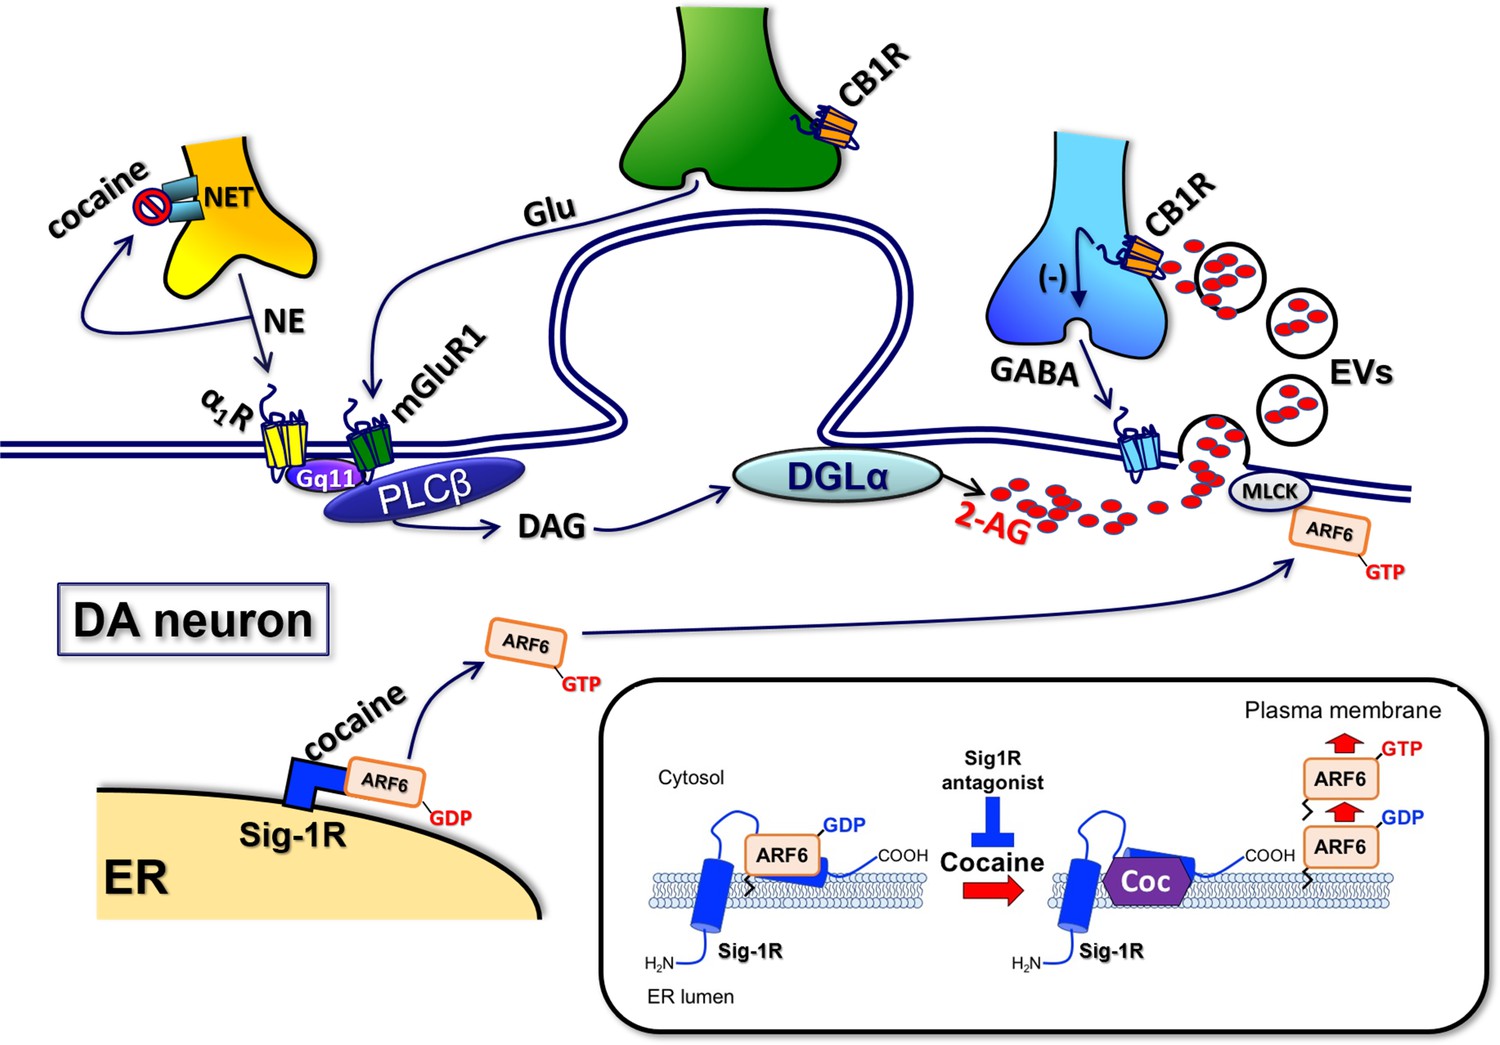
Proposed mechanisms underlying the cocaine-regulated synthesis and release of 2-AG in VTA.
DA neurons and the involvement of EVs and Sig1R-ARF6 signaling pathway. As shown previously (Wang et al., 2015), cocaine stimulates the synthesis of 2-AG via promotion of the activation of α1-noradrenergic receptors following inhibition of the norepinephrine transporter (NET). 2-AG synthesis is also facilitated by activation of type-1 metabotropic glutamate receptors (mGluR1) activated by endogenous glutamate released during electrical stimulation of VTA tissue (Wang et al., 2015). These Gq11-coupled GPCRs activate phospholipase-Cβ (PLCβ) to form diacylglycerol (DAG) from membrane phospholipids. DAG is then converted to 2-AG via the enzyme diacylglycerol lipase-α (DGLα) and then packaged into EVs. Cocaine also activates the Sig-1R, causing dissociation of a Sig-1R-ARF6-GDP complex at the endoplasmic reticulum (ER) in mouse VTA DA neurons. This free ARF6 is activated by a SecinH3-sensitive GEF, and then translocated to the plasma membrane where it interacts with myosin light-chain kinase (MLCK). MLCK then interacts with cytoskeletal elements to evoke fusion of the 2-AG containing-EVs with the plasma membrane and permit 2-AG release into extracellular space. This 2-AG then activates CB1Rs located on GABA axon terminals to inhibit GABA release onto postsynaptic GABAB receptors leading to 2-AG-mediated disinhibition of DA neurons.
Author response image 1
Tables
Key resources table
| Reagent type | Designation | Source or reference | Identifiers | Additional information |
|---|---|---|---|---|
| Mouse: M. musculus (C57BL/6J) | C57BL/6J; wildtype, WT | Charles River Laboratories | Strain Code: 027 | |
| Mouse: M. musculus (C57BL/6J) | sigma1r; Sigma1 receptor: Sig-1R; Sig-1R KO, knockout | https://doi.org/10.1073/pnas.1518894112 | ||
| Mouse: M. musculus (C57BL/6J) | Dagla fl/fl x Slc6a3-Cre +/-; floxed DGL-α x DATCre heterozygote; DGL-α x DATCre; DGL-α KO, knockout | Dagla fl/fl, a gift from Sachin Patel; Dagla fl/fl x Slc6a3-Cre + /- breeders a gift from Daniel P. Covey | ||
| Mouse: M. musculus (C57BL/6J) | CNR1; CB1R; CB1R -/-; CB1R KO; knockout | https://doi.org/10.1073/pnas.96.10.5780 | ||
| Cell Line (M. musculus) | Mouse neuroblastoma x Rat glioma: NG108-15 cells; NG108 cells | ATCC | HB-12317 | |
| Antibody | Mouse monoclonal (mcl) anti-alpha-tubulin | Sigma-Aldrich | Cat#: T5168 | Western Blot (WB); Dilution (1:10,000) |
| Antibody | Rabbit polyclonal (plcl) anti-Alix | Sigma-Aldrich | Cat#: SAB4200476 | WB (1:1,000) |
| Antibody | Mouse monoclonal (mcl) anti-ARF6 | Santa Cruz Biotechnology | Cat#: sc-7971 | Immunohistochemistry (IHC); (1:100), Immunoprecipitation (IP), 1 µg |
| Antibody | Rabbit plcl anti-ARF1 | Thermo Fisher Scientific | Cat#: PA1-127 | WB (1:1,000) |
| Antibody | Rabbit plcl anti-ARF6 | Cell Signaling Technology | Cat#: 3546 | WB (1:1,000) |
| Antibody | Mouse mcl anti-Cytochrome c | BD Biosciences | Cat#: 556433 | WB (1:1,000) |
| Antibody | Rabbit plcl anti-ERK1 | Santa Cruz Biotechnology | Cat#: sc-94 | WB (1:500) |
| Antibody | Rabbit mcl anti-FABP5 (D1A7T) | Cell Signaling Technology | Cat#: 39926 | WB (1:1,000) |
| Antibody | Rabbit plcl anti-Flotillin-1 | Santa Cruz Biotechnology | Cat#: sc-25506 | WB (1:1,000) |
| Antibody | Rabbit mcl anti-GAPDH (D16H11) | Cell Signaling Technology | Cat#: 5174 | WB (1:2000) |
| Antibody | Mouse mcl anti-GFP | Clonetech | Cat#: 632381 | WB (1:10,000) |
| Antibody | Rabbit plcl anti-GFP | Clonetech | Cat#: 632592 | IP (1 µg) |
| Antibody | Mouse mcl anti-Halo | Promega Corporation | Cat#: G9211 | WB (1:10,000) |
| Antibody | Mouse mcl anti-HSP90 | Enzo Life Sciences | Cat#: ADI-SPA-830 | WB (1:1,000) |
| Antibody | Mouse mcl anti-Integrin β1 | Thermo Fisher Scientific | Cat#: MA5-17103 | WB (1:1,000) |
| Antibody | Mouse mcl anti-Nucleoporin p62 | BD Biosciences | Cat#: 610498 | WB (1:1,000) |
| Antibody | Rabbit mcl anti-PDI | Cell Signaling Technology | Cat#: 3501 | WB (1:1,000) |
| Antibody | Rabbit anti-Sigma-1 receptor serum | A gift from Arnold Ruoho | N/A | IHC (1:1,000) |
| Antibody | Rabbit anti-Sigma-1 receptor serum #5460 | In house | N/A | WB (1:1,000) |
| Antibody | Mouse anti-sigma-1 receptor B-5 mcl | Santa Cruz Biotechnology | Cat#: Sc-137075 | IP (1 µg) |
| Antibody | Mouse mcl anti-Tyrosine hydroxylase | Millipore Corporation | Cat#: MAB318 | IHC (1:1,000), WB (1:2,000) |
| Antibody | Rabbit plcl anti-Tyrosine hydroxylase | Millipore Corporation | Cat#: AB152 | IHC (1:1,000) |
| Antibody | Chicken plcl anti-Tyrosine hydroxylase | Aves Labs | Cat#: TH | IHC (1:1,000) |
| Antibody | Mouse mcl anti-tsg 101 | Santa Cruz Biotechnology | Cat#: Sc-7964 | WB (1:500) |
| Antibody | Chicken plcl anti-vGAT | Synaptic Systems | Cat#: 131 006 | IHC (1:500) |
| Antibody | IRDye 680RD goat anti-mouse IgG | LI-COR Biosciences | Cat#: 925–68070 | WB (1:10,000) |
| Antibody | IRDye 800CW goat anti-mouse IgG | LI-COR Biosciences | Cat#: 925–32210 | WB (1:10,000) |
| Antibody | IRDye 680RD goat anti-rabbit IgG | LI-COR Biosciences | Cat#: 925–68071 | WB (1:10,000) |
| Antibody | IRDye 800CW goat anti-rabbit IgG | LI-COR Biosciences | Cat#: 925–32211 | WB (1:10,000) |
| Antibody | Alexa Fluor 405 goat anti-mouse IgG | Thermo Fisher Sci. | Cat#: A-31553 | IHC (1:500) |
| Antibody | Alexa Fluor 488 anti-chicken IgY | Thermo Fisher Sci. | Cat#: A-11039 | IHC (1:500) |
| Antibody | Alexa Fluor 568 anti-rabbit IgG | Thermo Fisher Sci. | Cat#: A-11036 | IHC (1:500) |
| Recombinant DNA reagent | pcDNA3-CFP | A gift from Doug Golenbock | Addgene Plasmid # 13030 | |
| Recombinant DNA reagent | pARF6 (WT)-CFP | A gift from Joel Swanson; https://doi.org/10.1371/journal.pbio.0040162 | Addgene Plasmid # 11382 | |
| Recombinant DNA reagent | pARF6 (Q67L)-CFP | A gift from Joel Swanson; https://doi.org/10.1371/journal.pbio.0040162 | Addgene Plasmid # 11387 | |
| Recombinant DNA reagent | pARF6 (T27N)-CFP | A gift from Joel Swanson; https://doi.org/10.1371/journal.pbio.0040162 | Addgene Plasmid # 11386 | |
| Recombinant DNA reagent | pHTC HaloTag | Promega | Cat#: G7711 | |
| Recombinant DNA reagent | pHTN HaloTag | Promega | Cat#: G7721 | |
| Recombinant DNA reagent | Halo-Sig1R | This paper | N/A | contact for resource: Dr. Tsung-Ping Su; TSU@intra.nida.nih.gov |
| Recombinant DNA reagent | Sig1R-Halo | This paper | N/A | contact for resource: Dr. Tsung-Ping Su; TSU@intra.nida.nih.gov |
| Recombinant DNA reagent | Sig1R (1-60)-Halo | This paper | N/A | contact for resource: Dr. Tsung-Ping Su; TSU@intra.nida.nih.gov |
| Recombinant DNA reagent | Halo-Sig1R (61-223) | This paper | N/A | contact for resource: Dr. Tsung-Ping Su; TSU@intra.nida.nih.gov |
| Commercial assay or kit | NanoSight Particle Analysis | System Biosciences | Cat#: CSNANO100A-1 | |
| Commercial assay or kit | Dynabeads Protein G | Thermo Fisher Scientific | Cat#: 10009D | |
| Commercial assay or kit | PolyJet In Vitro DNA Transfection | Signagen Laboratories | Cat#: SL100688 | |
| Commercial assay or kit | Micro BCA Protein Assay Kit | Thermo Fisher Scientific | Cat#: 23235 | |
| Chemical compound, drug | Cocaine hydrochloride | NIDA Drug Supply | N/A | https://d14rmgtrwzf5a.cloudfront.net/sites/default/files/ndspcat24thedmarch2015.pdf |
| Chemical compound, drug | BD 1063 dihydrochloride | Tocris Bioscience | Cat#: 0883; CAS: 206996-13-6 | |
| Chemical compound, drug | SecinH3 | Tocris Bioscience | Cat#: 2849; CAS: 853625-60-2 | |
| Chemical compound, drug | AM251 | Tocris Bioscience | Cat#: 1117; CAS: 183232-66-8 | |
| Chemical compound, drug | CGP55845 hydrochloride | Tocris Bioscience | Cat#: 1248; CAS: 149184-22-5 | |
| Chemical compound, drug | Hanks' Balanced Salt Solution | Thermo Fisher Scientific | Cat#: 14175095 | |
| Chemical compound, drug | Neurobasal Medium | Thermo Fisher Scientific | Cat#: 21103049 | |
| Chemical compound, drug | Collagenase | Thermo Fisher Scientific | Cat#: 17100017 | |
| Chemical compound, drug | Protease Inhibitor Cocktail | Sigma-Aldrich | Cat#: P8340 | |
| Chemical compound, drug | Blotting-grade blocker | Bio-Rad Laboratories | Cat#: 1706404 | |
| Chemical compound, drug | Bovine serum albumin | Sigma-Aldrich | Cat#: A2153 | |
| Chemical compound, drug | Percoll | GE Healthcare Life Sci. | Cat#: 17-0891-02 | |
| Chemical compound, drug | Dulbecco's Modified Eagle Medium | Thermo Fisher Scientific | Cat#: 11965092 | |
| Chemical compound, drug | Fetalgro Bovine Growth Serum | RMBIO | Cat#: FGR-BBT | |
| Chemical compound, drug | HAT Supplement (50X) | Thermo Fisher Scientific | Cat#: 21060017 | |
| Chemical compound, drug | Penicillin-Streptomycin (10,000 U/mL) | Thermo Fisher Scientific | Cat#: 15140122 | |
| Chemical compound, drug | Lauryl maltose neopentyl glycol | Anatrace | Cat#: NG310 | |
| Chemical compound, drug | two x Laemmli Sample Buffer | Bio-Rad Laboratories | Cat#: 1610737 | |
| Chemical compound, drug | Nonidet P-40 | Sigma-Aldrich | Cat#: I3021 | |
| Chemical compound, drug | Phenylmethanesulfonyl fluoride | Sigma-Aldrich | Cat#: P7626 | |
| Chemical compound, drug | NAV2729 | Tocris Bioscience | Cat#: 5986; CAS: 419547-11-8 | |
| Chemical compound, drug | ML seven hydrochloride | Tocris Bioscience | Cat#: 4310; CAS: 110448-33-4 | |
| Chemical compound, drug | NE100 | Tocris Bioscience | Cat#: 3313; CAS: 149409-57-4 | |
| Software, algorithm | ||||
| GraphPad Prism 7 | GraphPad Software, San Diego, CA | |||
| Image Studio Lite | L LI-COR Biosciences, Lincoln, Nebraska | |||
| WINLTP 2.30 | WinLTP Ltd., Bristol, U.K. | https://www.winltp.com/ | ||
| G-Power 3.1.9.4 | https://doi.org/10.3758/BF03193146 | http://www.psychologie.hhu.de/arbeitsgruppen/allgemeine-psychologie-und-arbeitspsychologie/gpower.html |
Additional files
-
Source data 1
Statistical Data.
- https://doi.org/10.7554/eLife.47209.018
-
Transparent reporting form
- https://doi.org/10.7554/eLife.47209.019
Download links
A two-part list of links to download the article, or parts of the article, in various formats.
Downloads (link to download the article as PDF)
Open citations (links to open the citations from this article in various online reference manager services)
Cite this article (links to download the citations from this article in formats compatible with various reference manager tools)
Cocaine-induced endocannabinoid signaling mediated by sigma-1 receptors and extracellular vesicle secretion
eLife 8:e47209.
https://doi.org/10.7554/eLife.47209


