Sex-specific transcriptomic responses to changes in the nutritional environment
- University College London, United Kingdom
- Monash University, Australia
Figures
Figure 1 with 4 supplements
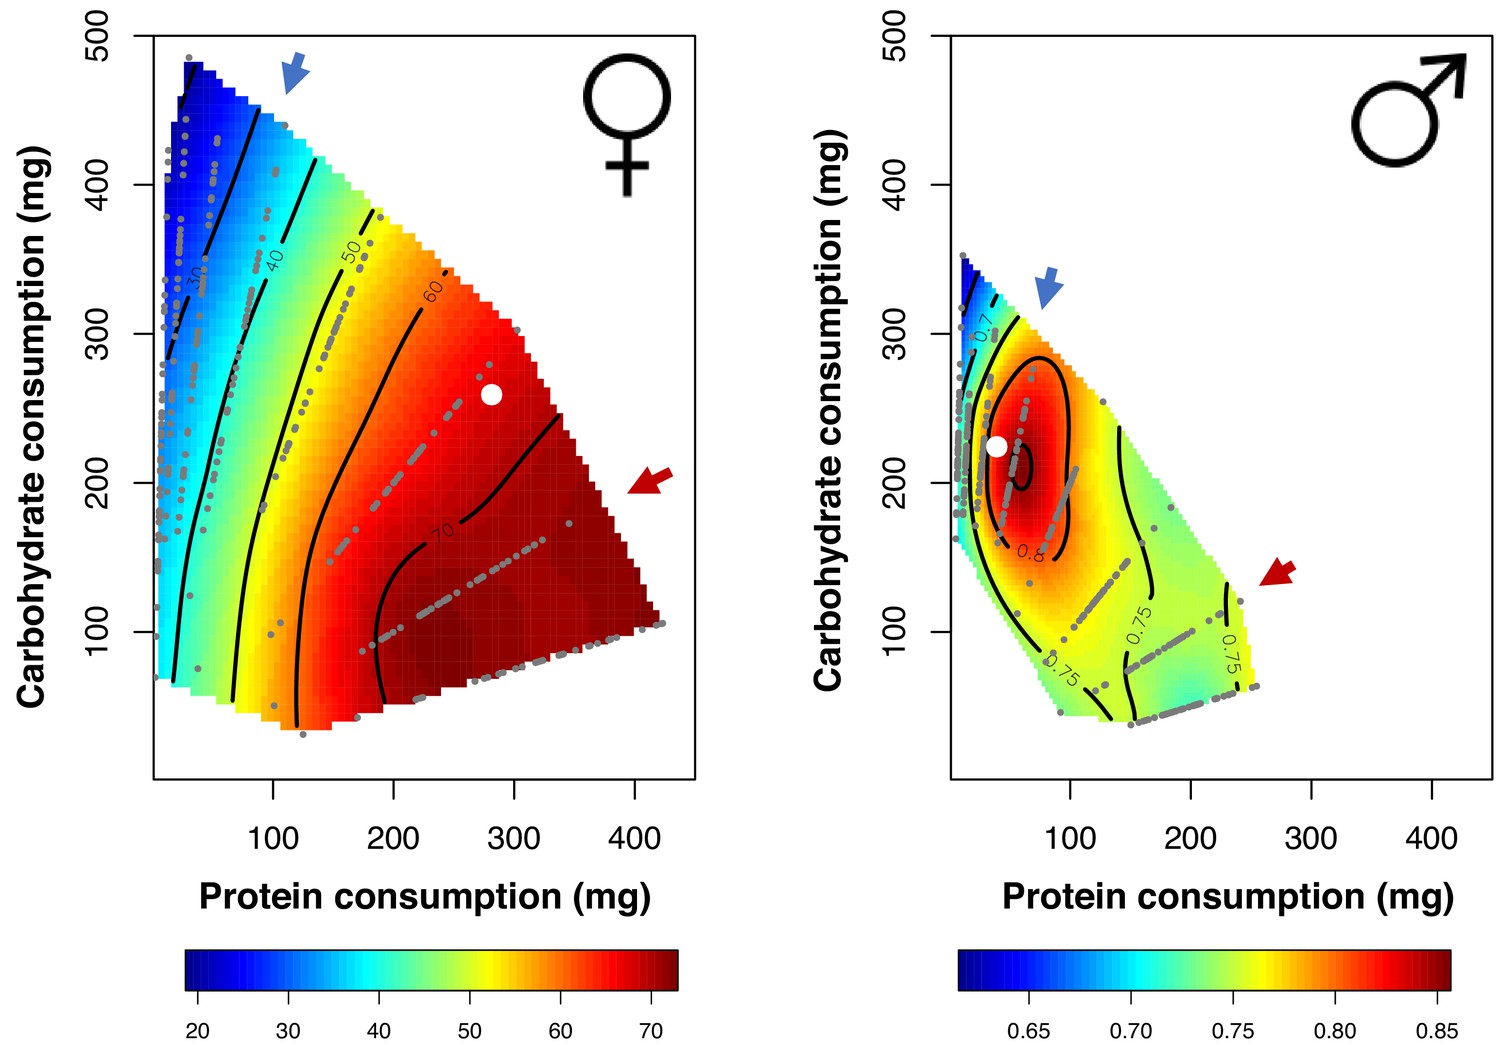
Nutritional landscapes for female (left) and male (right) fitness in the LHM population.
Small grey dots represent the dietary coordinates of individual fitness measures. Dietary choices for each sex are also plotted (white dot). The red arrow denotes the female optimal nutritional rail (P:C = 2:1), whereas the blue arrow is the male optimal nutritional rail (P:C = 1:4). For each nutritional rail we samples 120 flies of each sex.
Figure 1—figure supplement 1
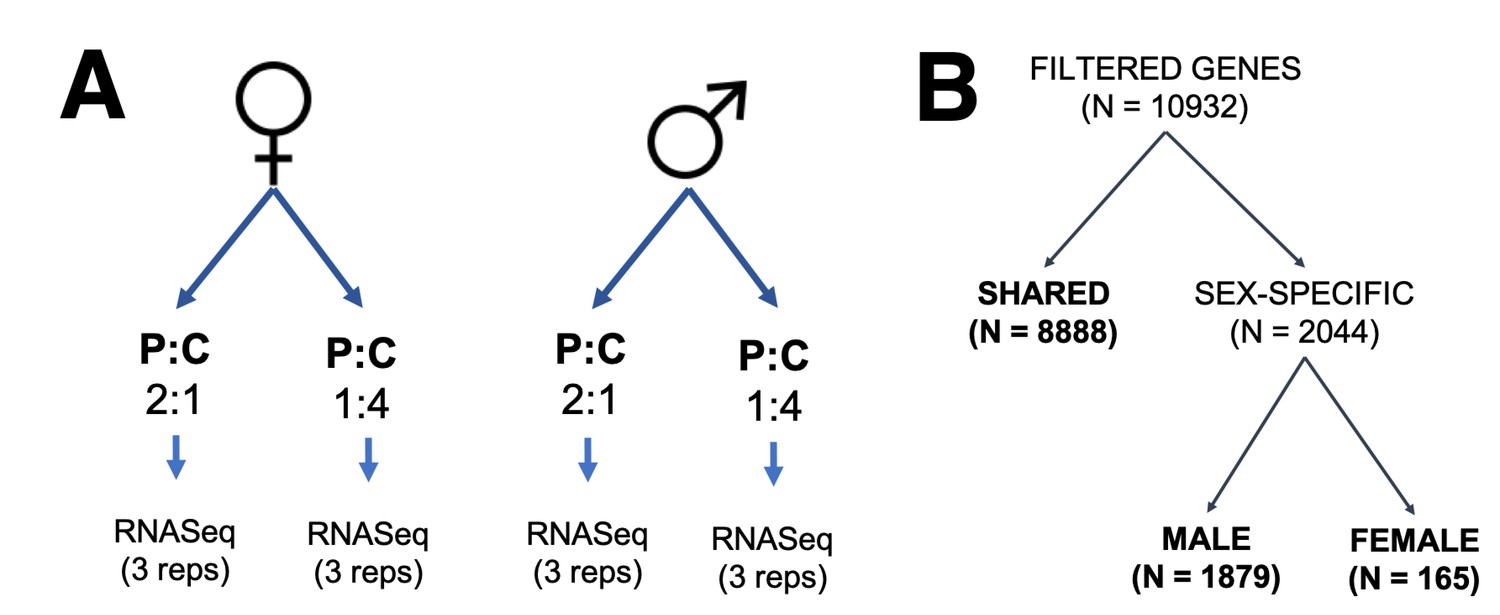
Experimental design for transcriptomic experiment.
(A) Set-up for the transcriptomic experiment. (B) Experimental design for data analyses. Gene sets were split into three categories: those expressed in both sexes (shared) and those expressed in one sex only (sex-specific), further separated in those that are male-specific and female-specific in expression.
Figure 1—figure supplement 2

Total liquid diet consumption.
Data for females is shown in red on the left and data for males in blue on the right. Diet composition ranges from A = high protein (P:C = 4:1) to H = high carbohydrate (P:C = 1:32).
Figure 1—figure supplement 3
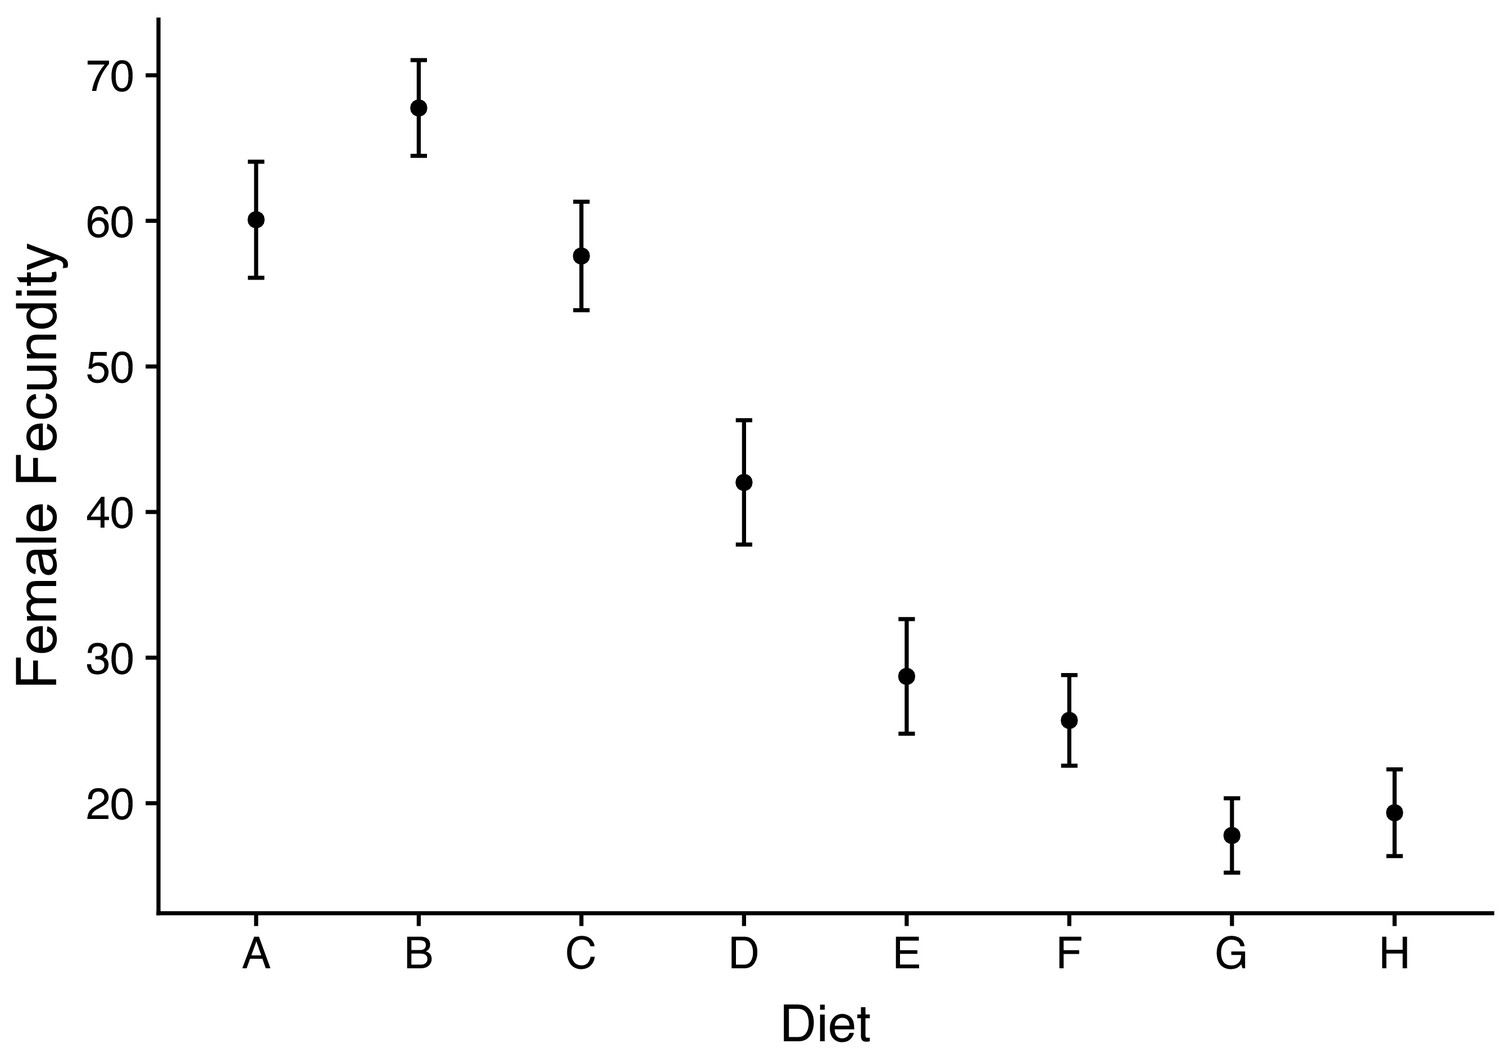
Female fecundity (number of eggs laid) across dietary treatments.
Diet composition ranges from A = high protein (P:C = 4:1) to H = high carbohydrate (P:C = 1:32).
Figure 1—figure supplement 4
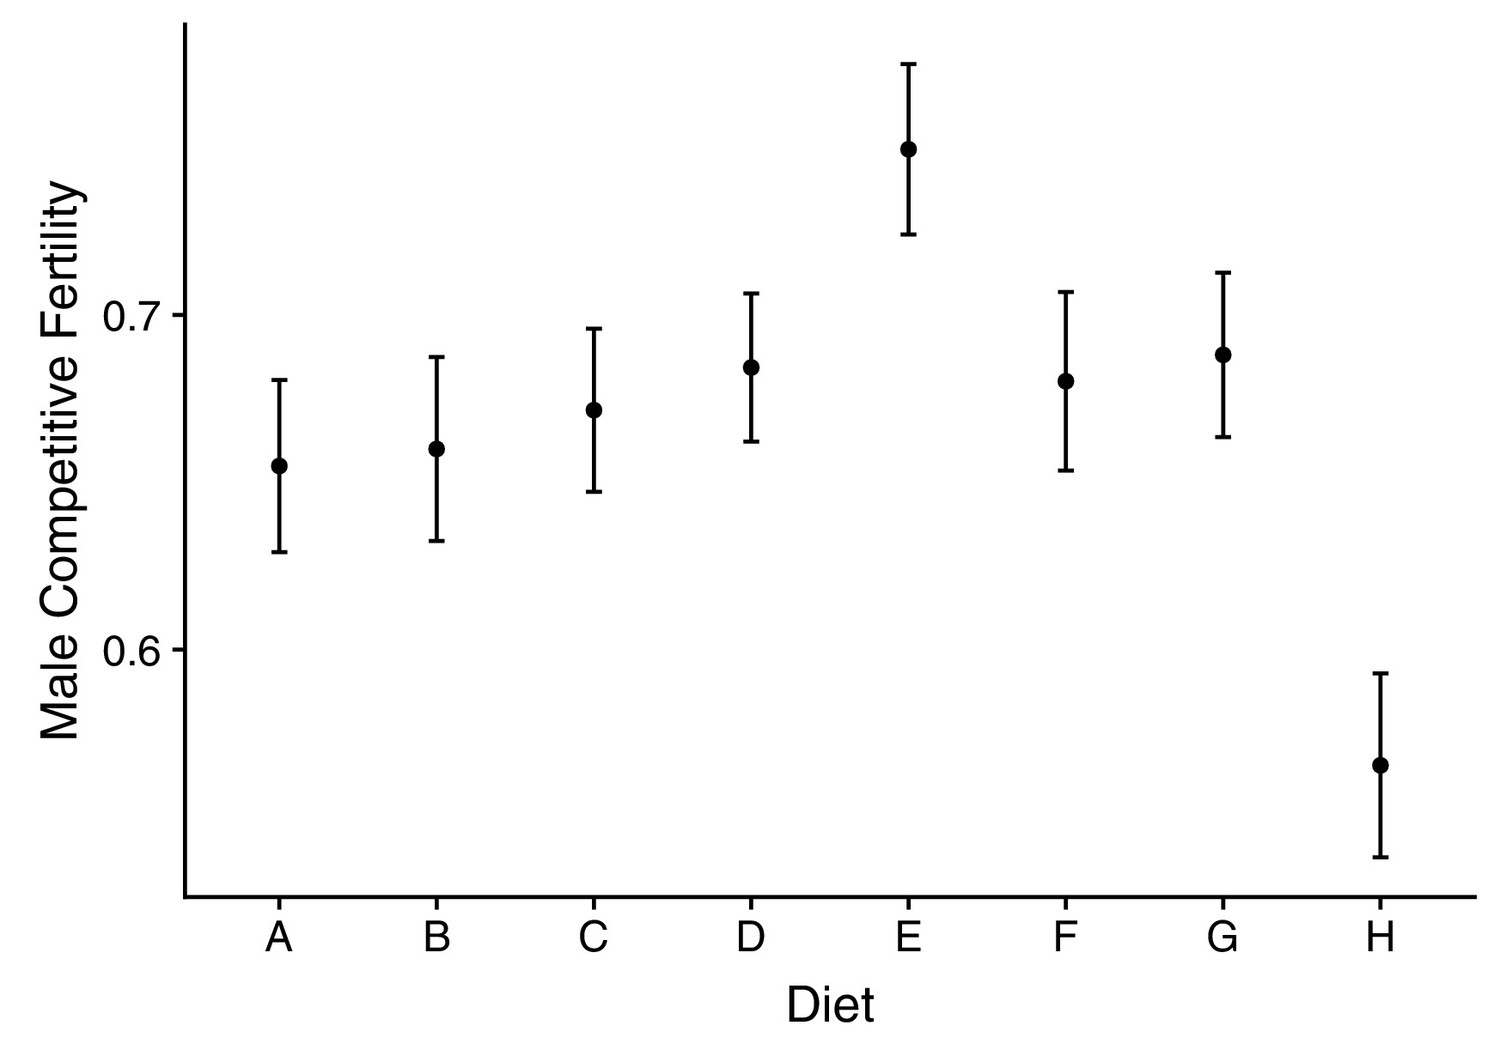
Male competitive fertility across dietary treatments.
Diet composition ranges from A = high protein (P:C = 4:1) to H = high carbohydrate (P:C = 1:32).
Figure 2 with 2 supplements
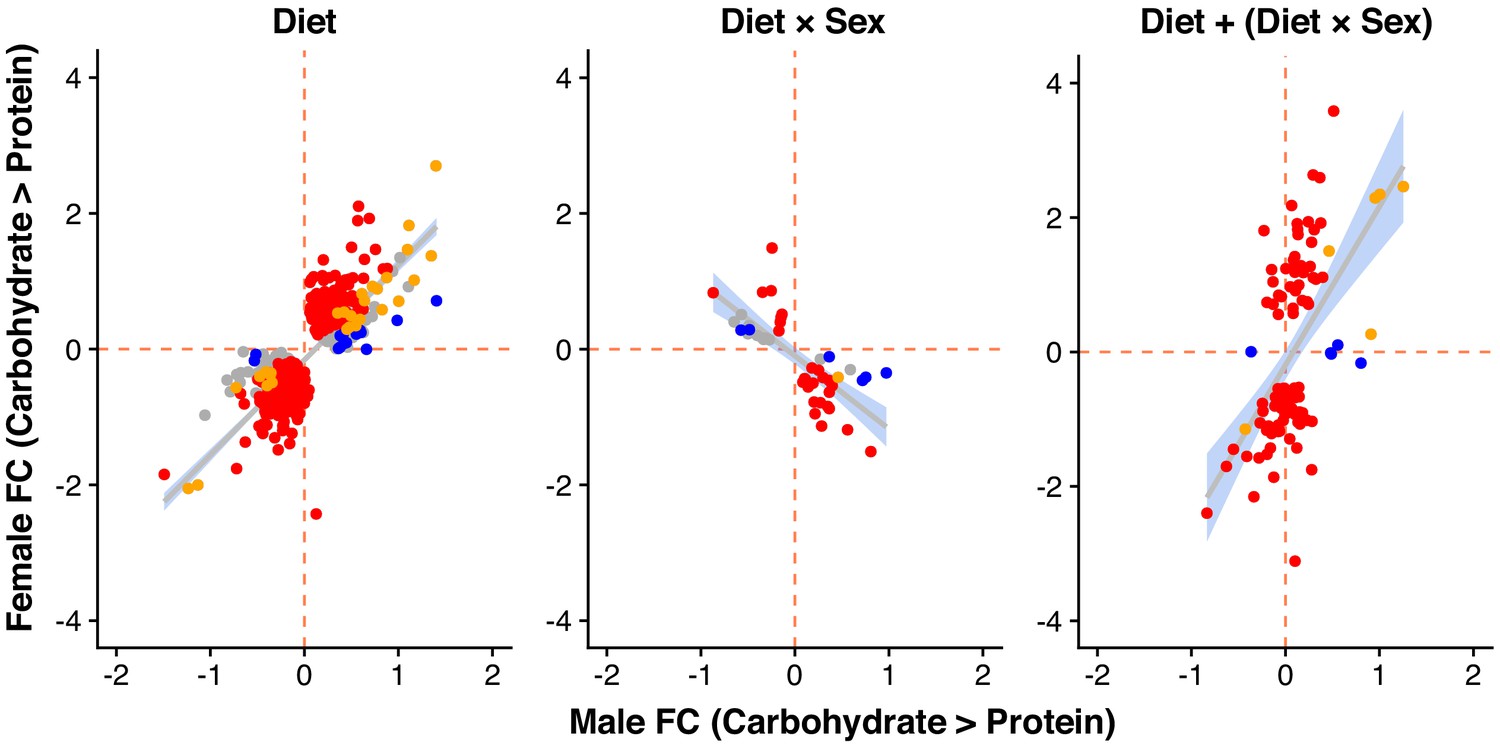
Male and female expression responses (log2-fold change) for genes classified as showing only a diet effect (Diet), only a diet-by-sex interaction (Diet × Sex) or both (Diet + Diet × Sex).
Expression changes are measured from the carbohydrate- to protein-rich diet. Colours represent genes with significant differential expression (at 5% FDR) only in females (red), only in males (blue), in both sexes (yellow) or in neither sex (grey).
Figure 2—figure supplement 1
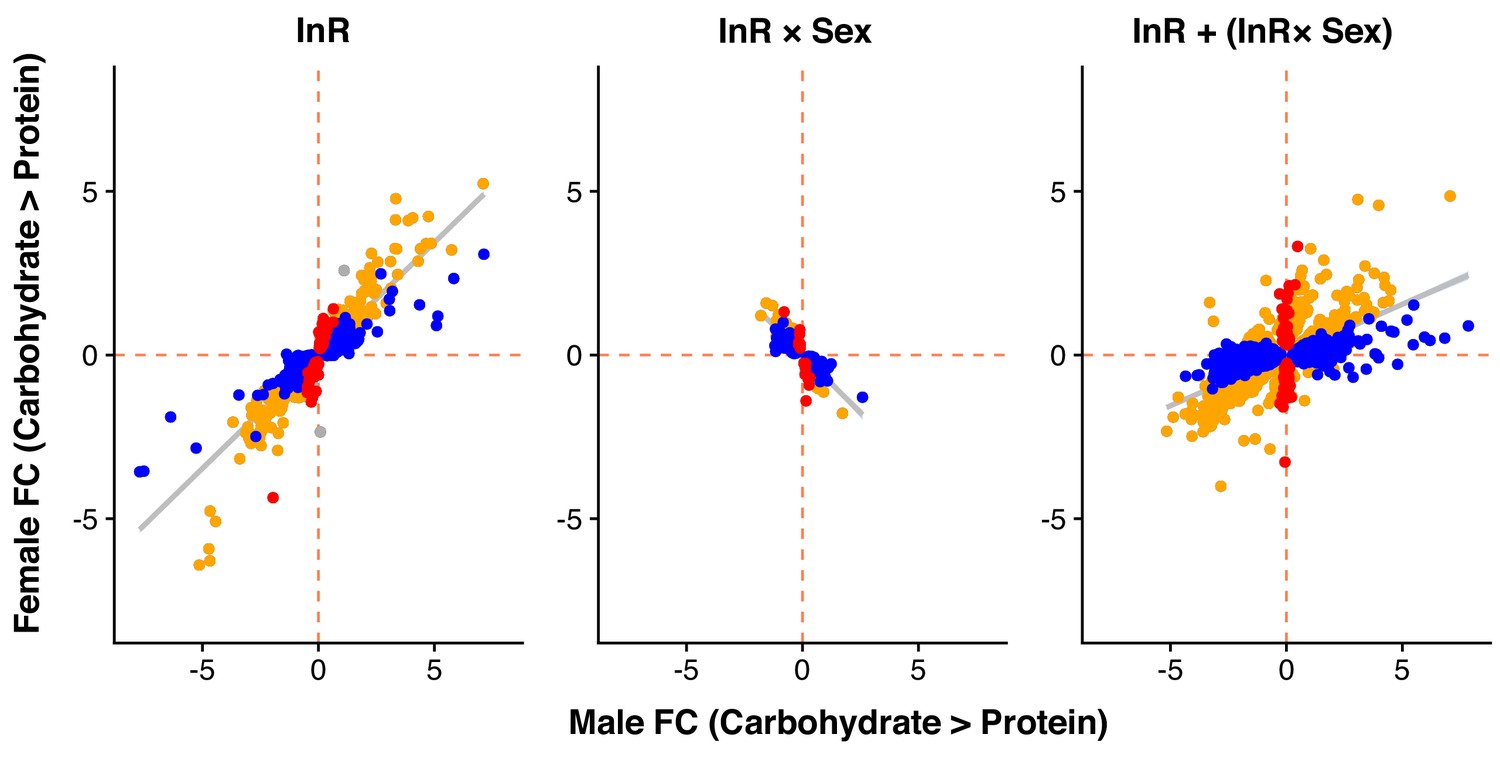
Male and female expression responses (log2-fold change) for genes classified as showing only a diet effect (Diet), only a InR-by-sex interaction (InR ×Sex) or both (InR + InR ×Sex) in the re-analysis of the Graze et al. (2018) dataset.
Expression changes are measured from carbohydrate- to protein-rich diet. Colours represent genes with significant differential expression (at 5% FDR) only in females (red), only in males (blue), in both sexes (yellow) or in neither sex (grey).
Figure 2—figure supplement 2
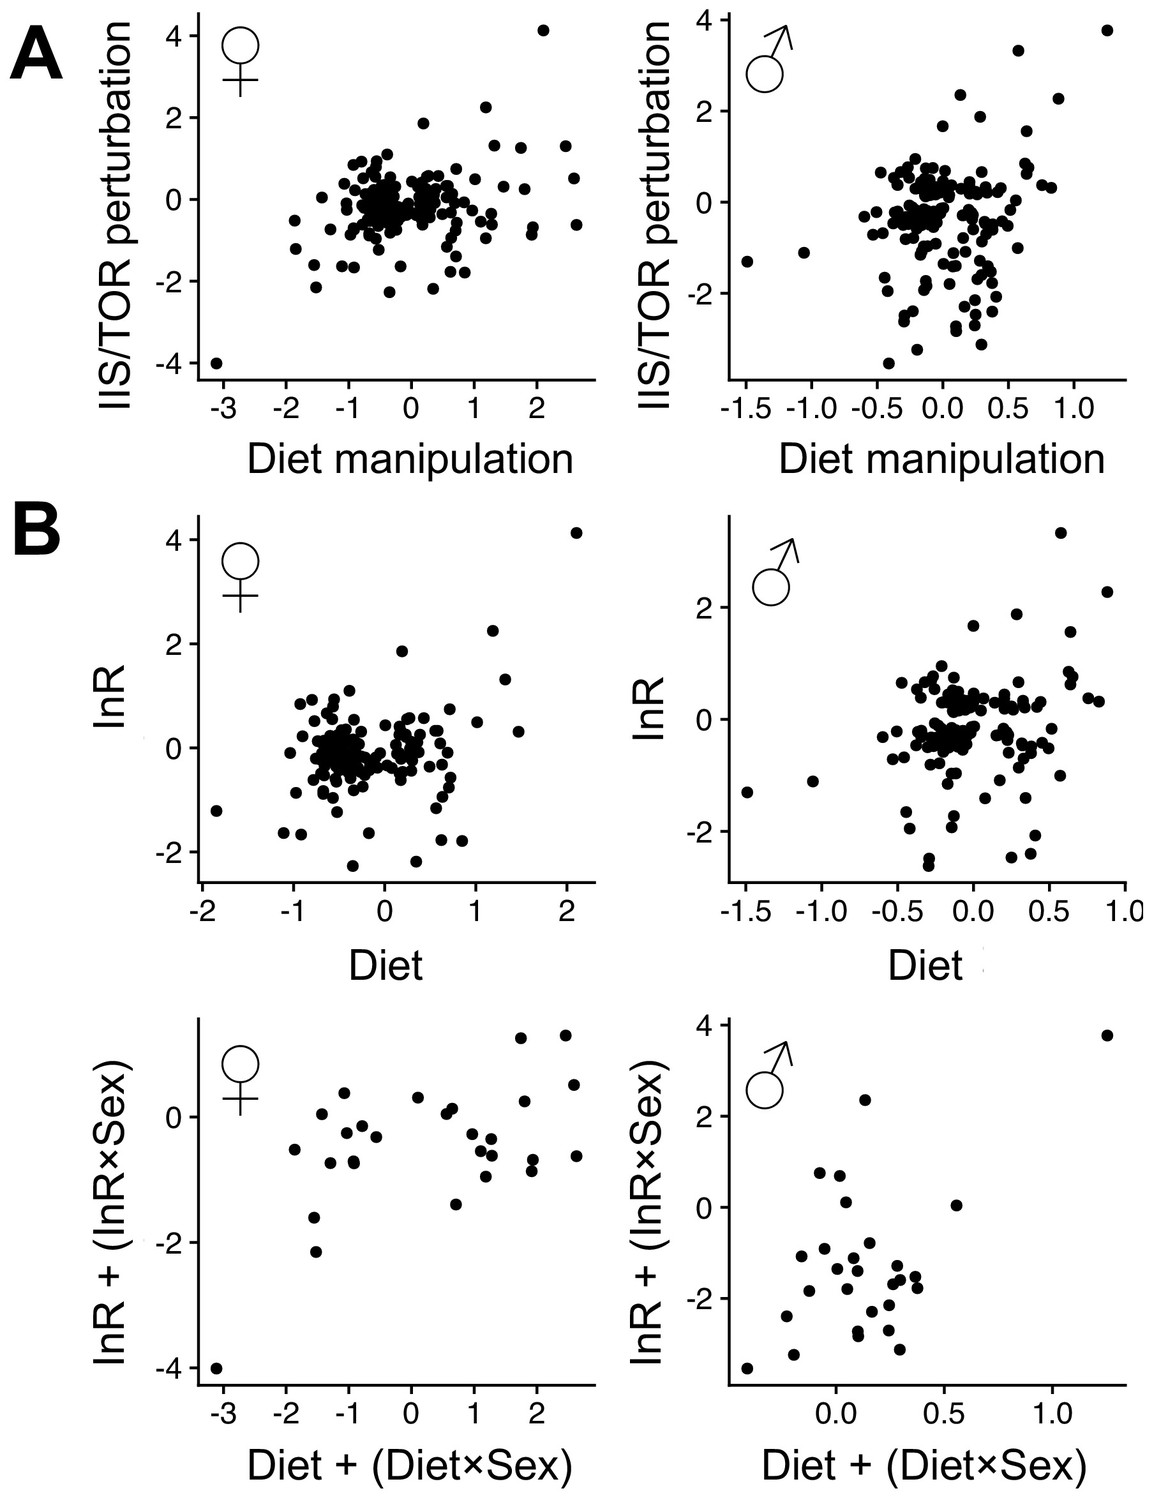
Female (left) and male (right) expression responses (log2-fold change) in response to IIS/TOR perturbation (Graze et al., 2018 dataset) and diet manipulation.
Panel (A) shows genes that with significant responses in both experiments (at 5% FDR, N = 489). IIS/TOR and diet fold changes are significantly positively correlated in both sexes (Pearson's moment correlations, females: r = 0.32, p<0.001, males: r = 0.20, p=0.006). Panel (B) shows genes that fall in coinciding response classes (top: 'InR' and 'D', N = 160; bottom: 'InR+ InR ×Sex' and 'D+D × Sex', N = 28, see Supplementary file 1 - Table 5). Fold changes are significantly positively correlated in all cases ('InR' and 'D' – females: r = 0.28, p<0.001, males: r = 0.26, p<0.001; 'InR+ InR ×Sex' and 'D+D × Sex' – females: r = 0.54, p=0.003, males: r = 0.52, p=0.005).
Figure 3
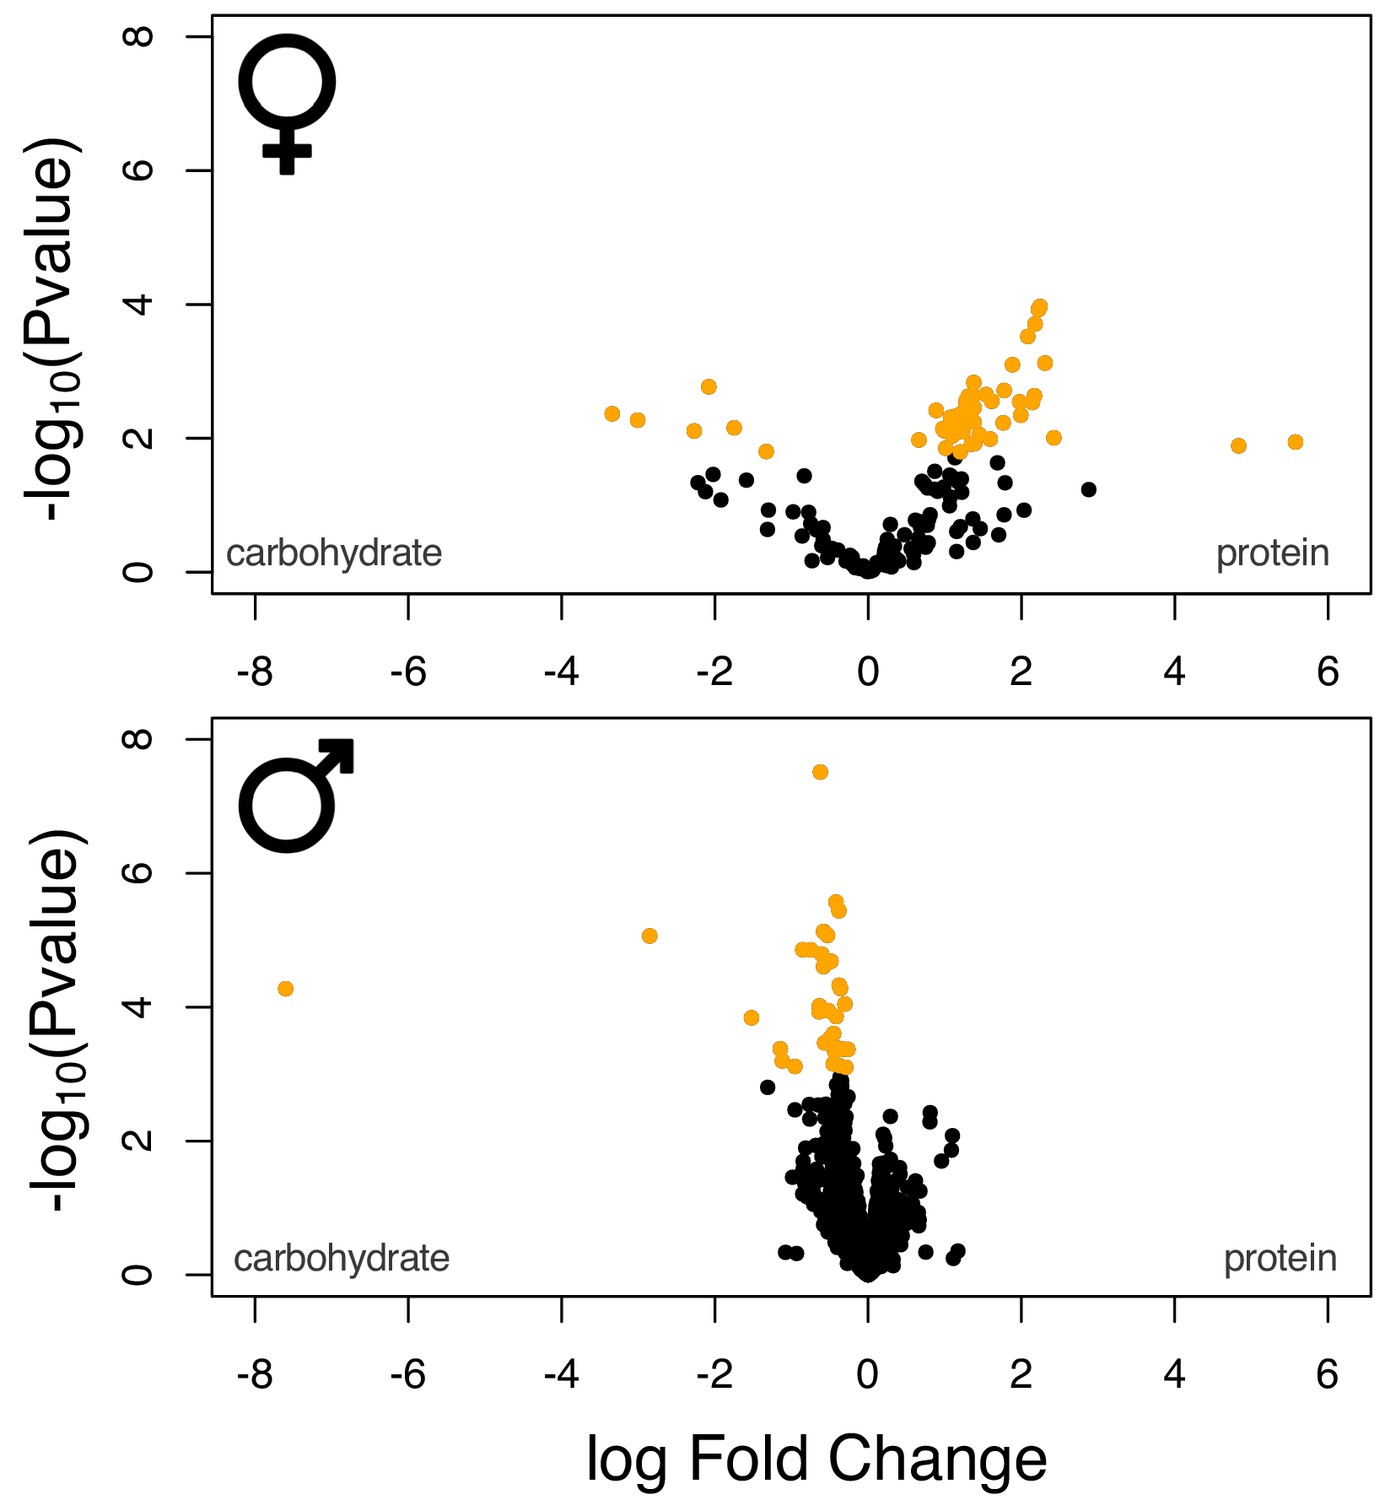
Volcano plot of the sex-specific gene sets.
Yellow data points denote genes that were identified as differentially expressed at a 5% FDR cut-off.
Figure 4
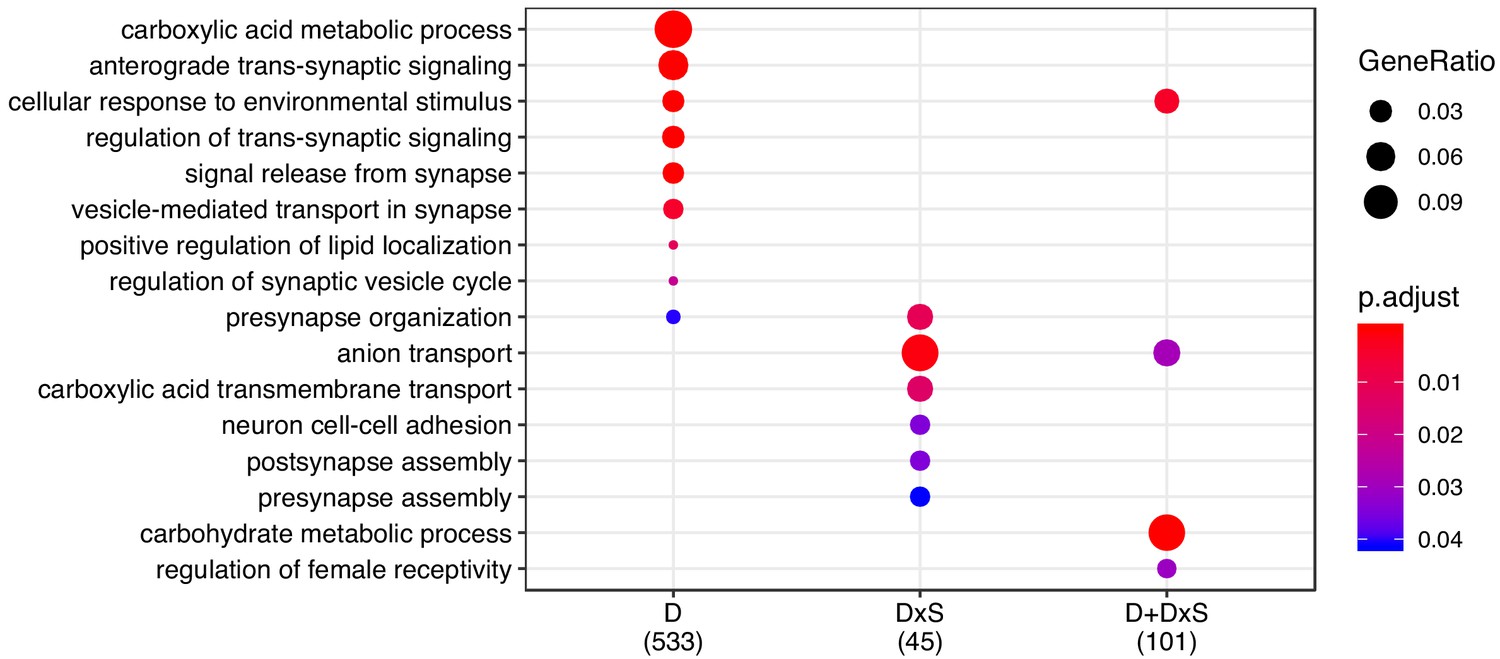
GO enrichment for the shared transcriptomic response.
Enrichment for ‘biological process’ was performed for all categories, and p-values were adjusted for FDR < 0.05 ('p.adjust').
Figure 5
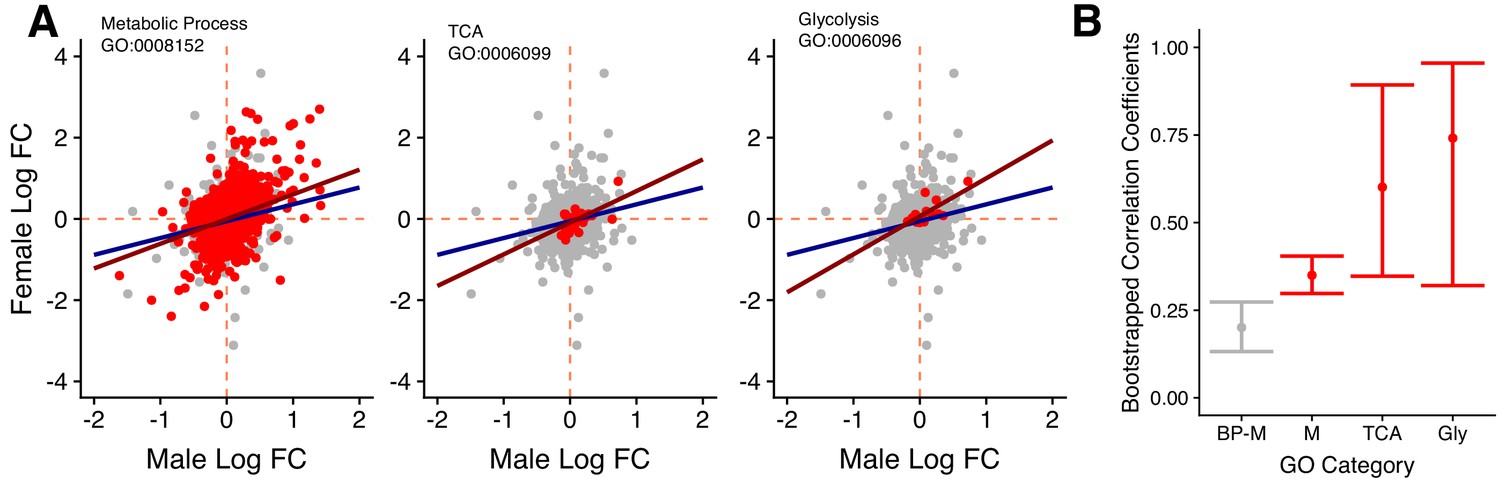
Gene expression for specific GO categories.
(A) Male and female log2 fold changes in gene expression going from carbohydrate to protein diets for selected GO terms. Red data points are genes that are found within the chosen GO terms (Metabolic process, TCA cycle and Glycolysis), whereas grey datapoints all other genes annotated with the first-level parent term ‘biological process’. This background set provides a transcriptome-wide expression baseline between the sexes. Lines represent the regression of female on male log2 fold change for the target term (red) and the background set (blue). (B) Bootstrapped correlation coefficients selected GO categories (red) and the baseline (grey).
Figure 6
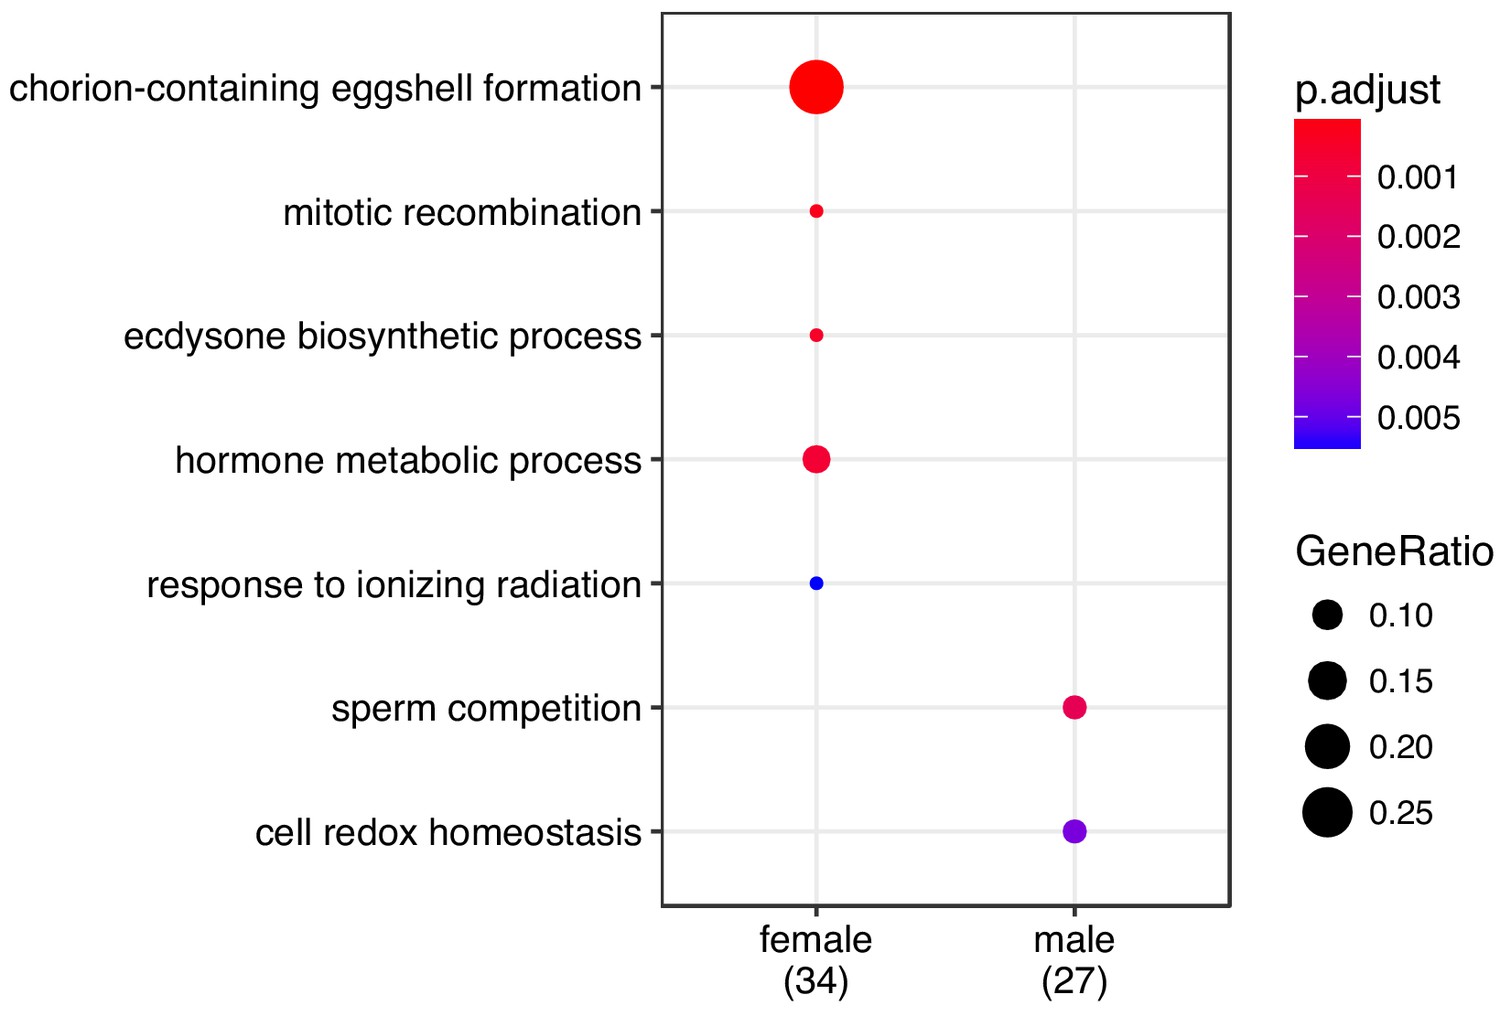
GO enrichment for sex-specific genes.
Enrichment for differentially expressed genes was performed using ‘biological process’ and p-values were adjusted for FDR ('p.adjust').
Figure 7 with 1 supplement
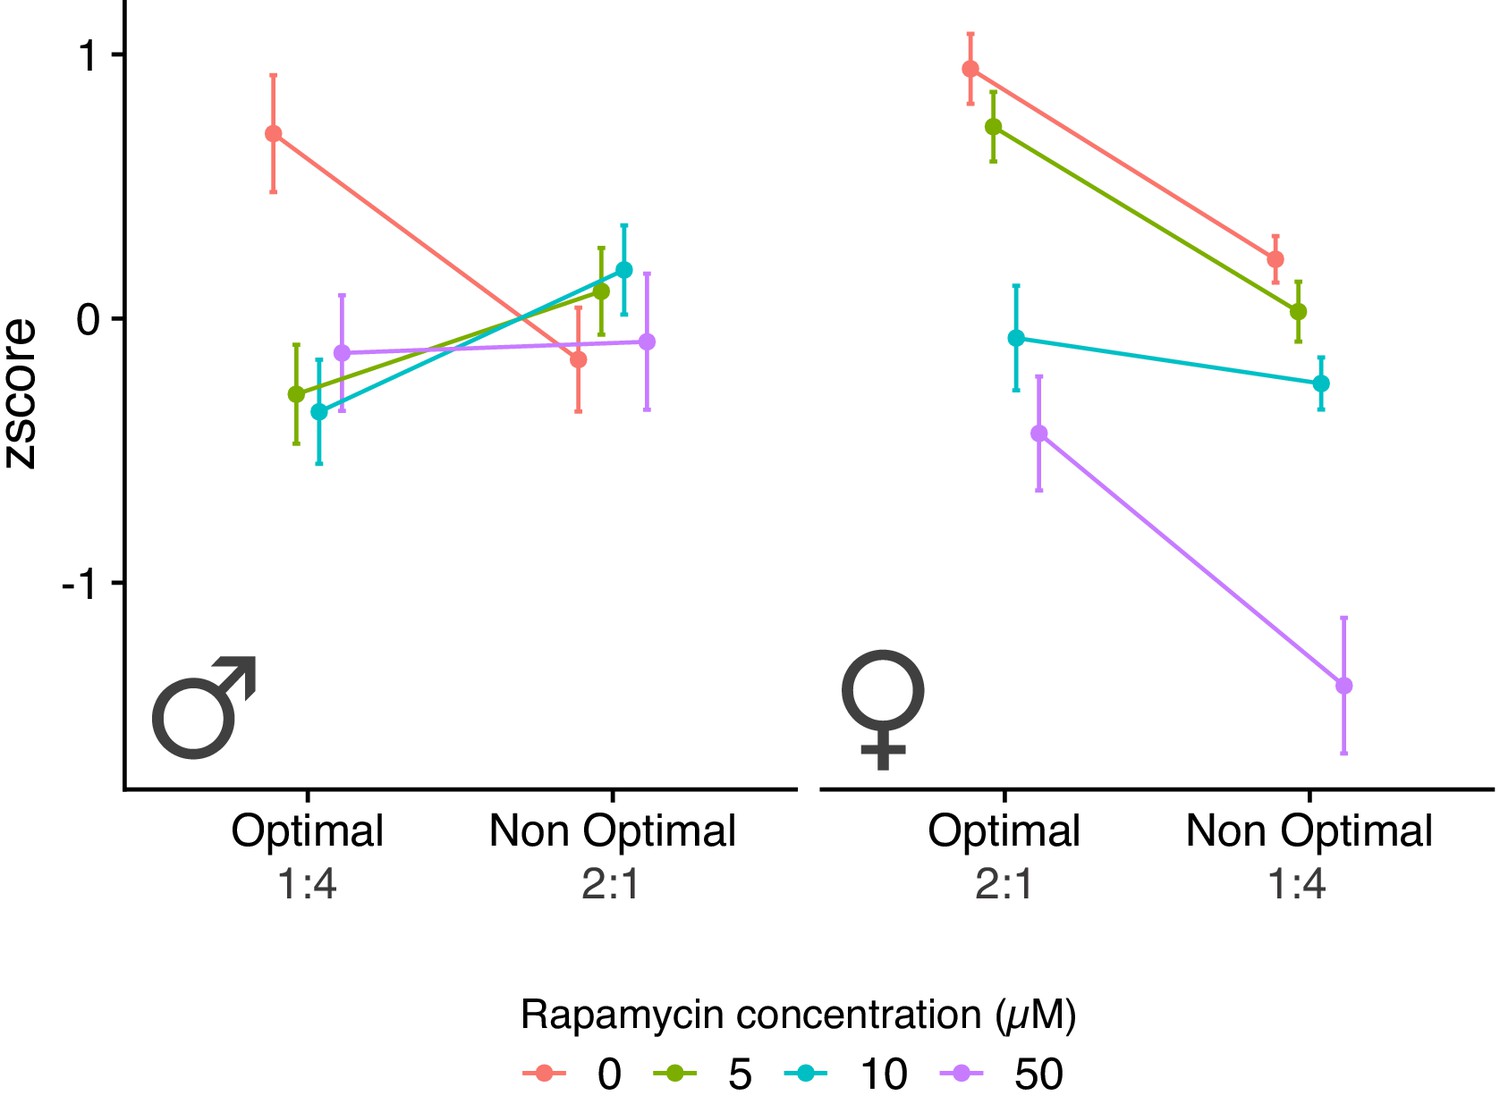
Male and female fitness measures across the two diets and for rapamycin treatments.
Sample size for each experimental treatment is 60 flies.
Figure 7—figure supplement 1
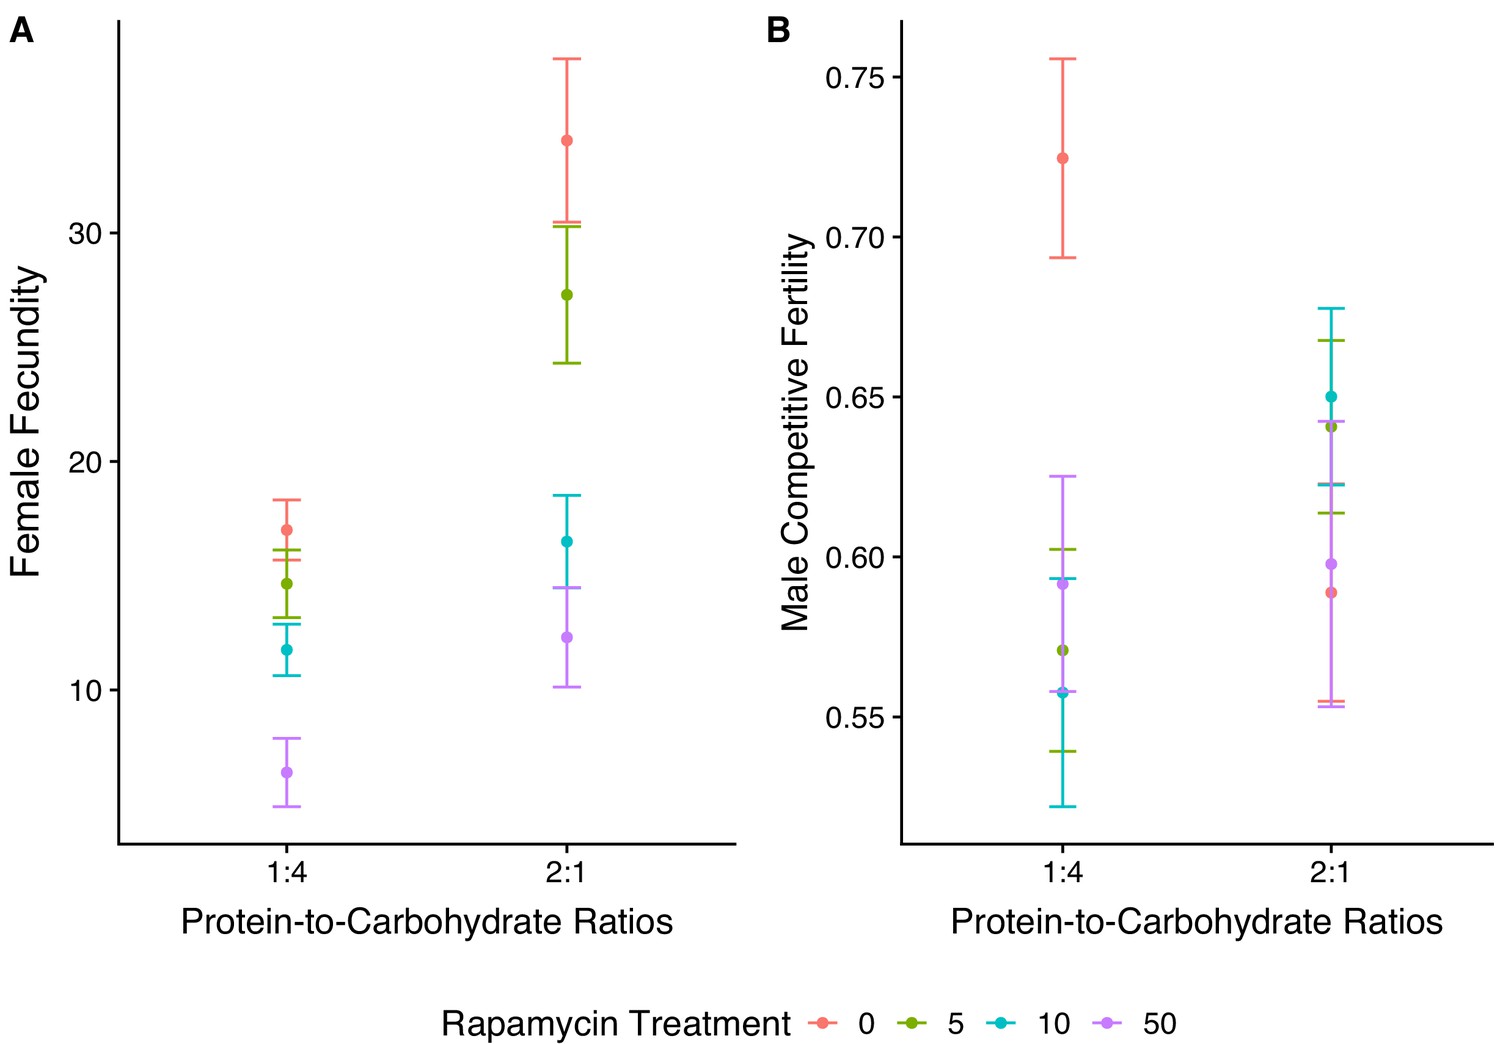
Sex-specific fitness measured across both diets and four rapamycin treatments.
Panel (A) shows data for female fecundity, panel (B) data for male competitive fertility.
Tables
Table 1
Shared transcriptomic response.
Number of genes that are influenced by sex (S), diet (D), and their interaction (D × S). From this method, we were able to cluster genes into three main categories. Categories highlighted in orange encompass genes that show an additive effect to diet (D), whereas clusters in blue show interactive effects (D × S). Green rows show both additive and interactive effects (D+D × S).
| Significance (FDR < 0.05) | n. genes | ||
|---|---|---|---|
| S | D | D × S | |
| - | - | - | 545 |
| - | - | Y | 3 |
| - | Y | - | 18 |
| - | Y | Y | 4 |
| Y | - | - | 7537 |
| Y | - | Y | 48 |
| Y | Y | - | 621 |
| Y | Y | Y | 112 |
Table 2
Sex-specific transcriptomic response.
Number of genes that are differentially expressed when moving from a carbohydrate-rich environment to a protein-rich environment in females and males (FDR < 0.1).
| Sex | Contrast | UP | Ns | DOWN | Total |
|---|---|---|---|---|---|
| Female | Carb → Protein | 50 | 109 | 6 | 56 |
| Male | Carb → Protein | 0 | 1845 | 34 | 34 |
Table 3
Gene overlap between our three categories (D, D × S, D+D × S) and results from three previously published papers.
The first study (A+B) examines female transcriptomic response to dietary restriction and rapamycin across six different tissues (Dobson et al., 2018). The second study (C) characterises genes that respond to TORC1 inhibition via the transcription factors REPTOR and REPTOR-BP (Tiebe et al., 2015). In italics we show the total number of genes in that category, with bold counts showing the significant (p<0.05) overlaps between two categories. Overlap is assessed with Fisher's exact tests, p-values are provided below the counts.
| A. Dietary Restriction | ||||
|---|---|---|---|---|
| Brain (167) | Thorax (193) | Gut (25) | Fatbody (358) | |
| D (639) | 27 p<0.001 | 51 p<0.001 | 14 p<0.001 | 58 p<0.001 |
| D × S (51) | 5 p=0.0026 | 5 p=0.0048 | 0 p=1 | 7 p=0.0041 |
| D+D × S (116) | 10 p<0.001 | 19 p<0.001 | 3 p=0.004 | 20 p<0.001 |
| B. Rapamycin | ||||
| Brain (58) | Thorax (38) | Gut (76) | Fatbody (222) | |
| D (639) | 14 p<0.001 | 9 p=0.0012 | 17 p<0.001 | 57 p<0.001 |
| D × S (51) | 5 p<0.001 | 2 p=0.02 | 2 p=0.07 | 3 p=0.13 |
| D+D × S (116) | 6 p<0.001 | 7 p<0.001 | 4 p=0.017 | 16 p<0.001 |
| C. TORC1 | ||||
| REPTOR/REPTOR-BP (212) | ||||
| D (639) | 28 p=0.019 | |||
| D × S (51) | 1 p=0.78 | |||
| D+D × S (116) | 9 p=0.0068 | |||
Additional files
-
Supplementary file 1
This datafile contains synthetic media recipes (tables 1-3), statistical analysis for Experiment 3 (table 4), and Chi2 analysis for overlaps (table 5).
- https://doi.org/10.7554/eLife.47262.020
-
Supplementary file 2
Gene lists.
In each tab, we show the genes that were significant in our analyses (FDR < 0.05)
- https://doi.org/10.7554/eLife.47262.021
-
Supplementary file 3
Transcription factor enrichment analysis.
For each gene category of genes, we searced for enriched transcription factor motifs. This was done by surveying 5 kb upstream of every gene for enriched motifs.
- https://doi.org/10.7554/eLife.47262.022
-
Supplementary file 4
Diet-dependent expression responses of TOR signalling components.
The table shows male and female fold changes (from high-carbohydrate to high-protein diet) for sets of genes associated with TOR signalling. We used two different methods to identify such genes. Sheets labelled ‘IIS TOR’ contain genes with the Gene Ontology annotations ‘insulin signalling’ or ‘TOR signalling’. Sheet ‘IIS TOR (all)’ shows the overlap between these genes and genes in our dataset (irrespective of significance of differential expression). Sheets ‘IIS TOR (concordant)’ and "IIS TOR (opposing) show genes with sexually concordant and opposing expression responses, respectively (again, irrespectively of significane). Genes in bold show significant expression responses (FDR < 0.05). The sheet ‘REPTOR (all)’ lists genes in our dataset that overlap with the TOR-responsive gene set reported by Tiebe et al. (2015). Again, male and female fold changes are shown, irrespecively of their significance.
- https://doi.org/10.7554/eLife.47262.023
-
Transparent reporting form
- https://doi.org/10.7554/eLife.47262.024
Download links
A two-part list of links to download the article, or parts of the article, in various formats.
Downloads (link to download the article as PDF)
Open citations (links to open the citations from this article in various online reference manager services)
Cite this article (links to download the citations from this article in formats compatible with various reference manager tools)
Sex-specific transcriptomic responses to changes in the nutritional environment
eLife 8:e47262.
https://doi.org/10.7554/eLife.47262


