Generation of human hepatic progenitor cells with regenerative and metabolic capacities from primary hepatocytes
- National Cancer Center Research Institute, Japan
- Keio University, Japan
- Nihon Pharmaceutical University, Japan
- Kobe Pharmaceutical University, Japan
- Tokyo Medical University, Japan
Figures
Figure 1
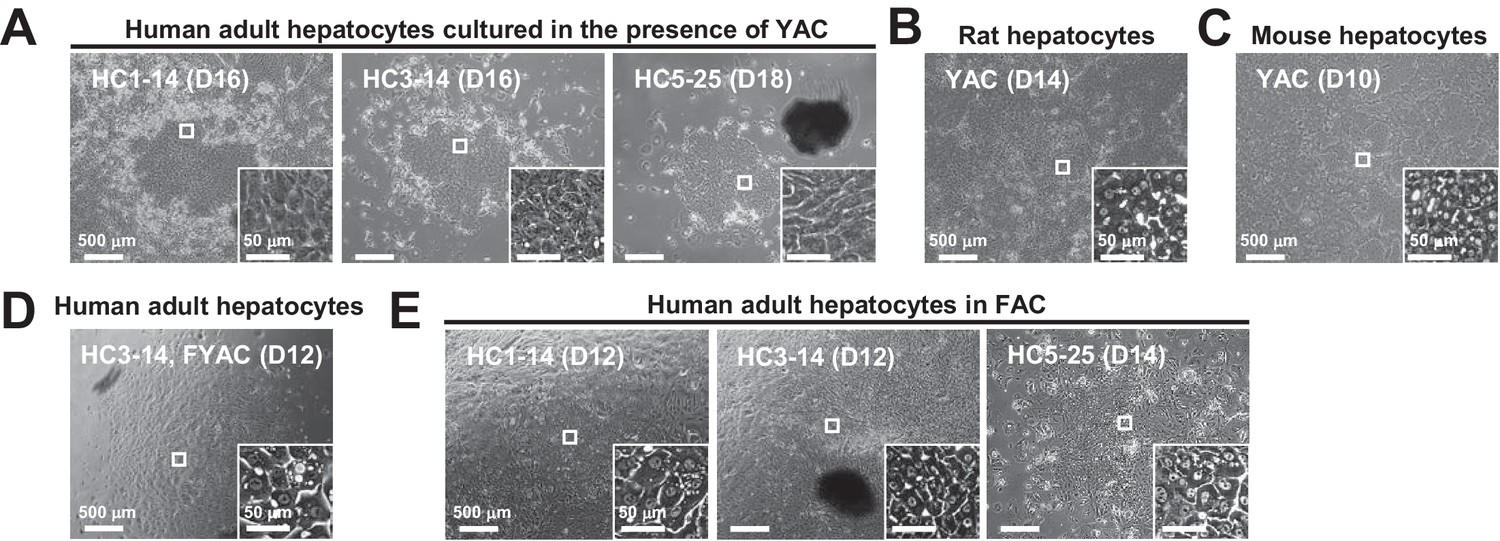
Morphological changes of hepatocytes in response to small molecule stimuli with/without FBS.
(A) Phase contrast images of APHHs cultured in the presence of YAC, which are used to obtain rat and mouse CLiPs. Insets indicate representative magnified images. (B) Phase contrast images of rat CLiPs obtained by culture in the presence of YAC. The inset shows cells that spontaneously differentiated into mature hepatocyte (MH)-like cells in densely packed regions. (C) Phase contrast images of mouse CLiPs obtained by culture in the presence of YAC. The inset shows cells that spontaneously differentiated into MH-like cells in densely packed regions. (D) Phase contrast images of APHHs cultured in the presence of YAC and 10% FBS (FYAC). The inset shows cells that spontaneously differentiated into MH-like cells in densely packed regions. (E) Phase contrast images of APHHs cultured in FAC. Insets show cells that spontaneously differentiated into MH-like cells in densely packed regions.
Figure 2 with 3 supplements
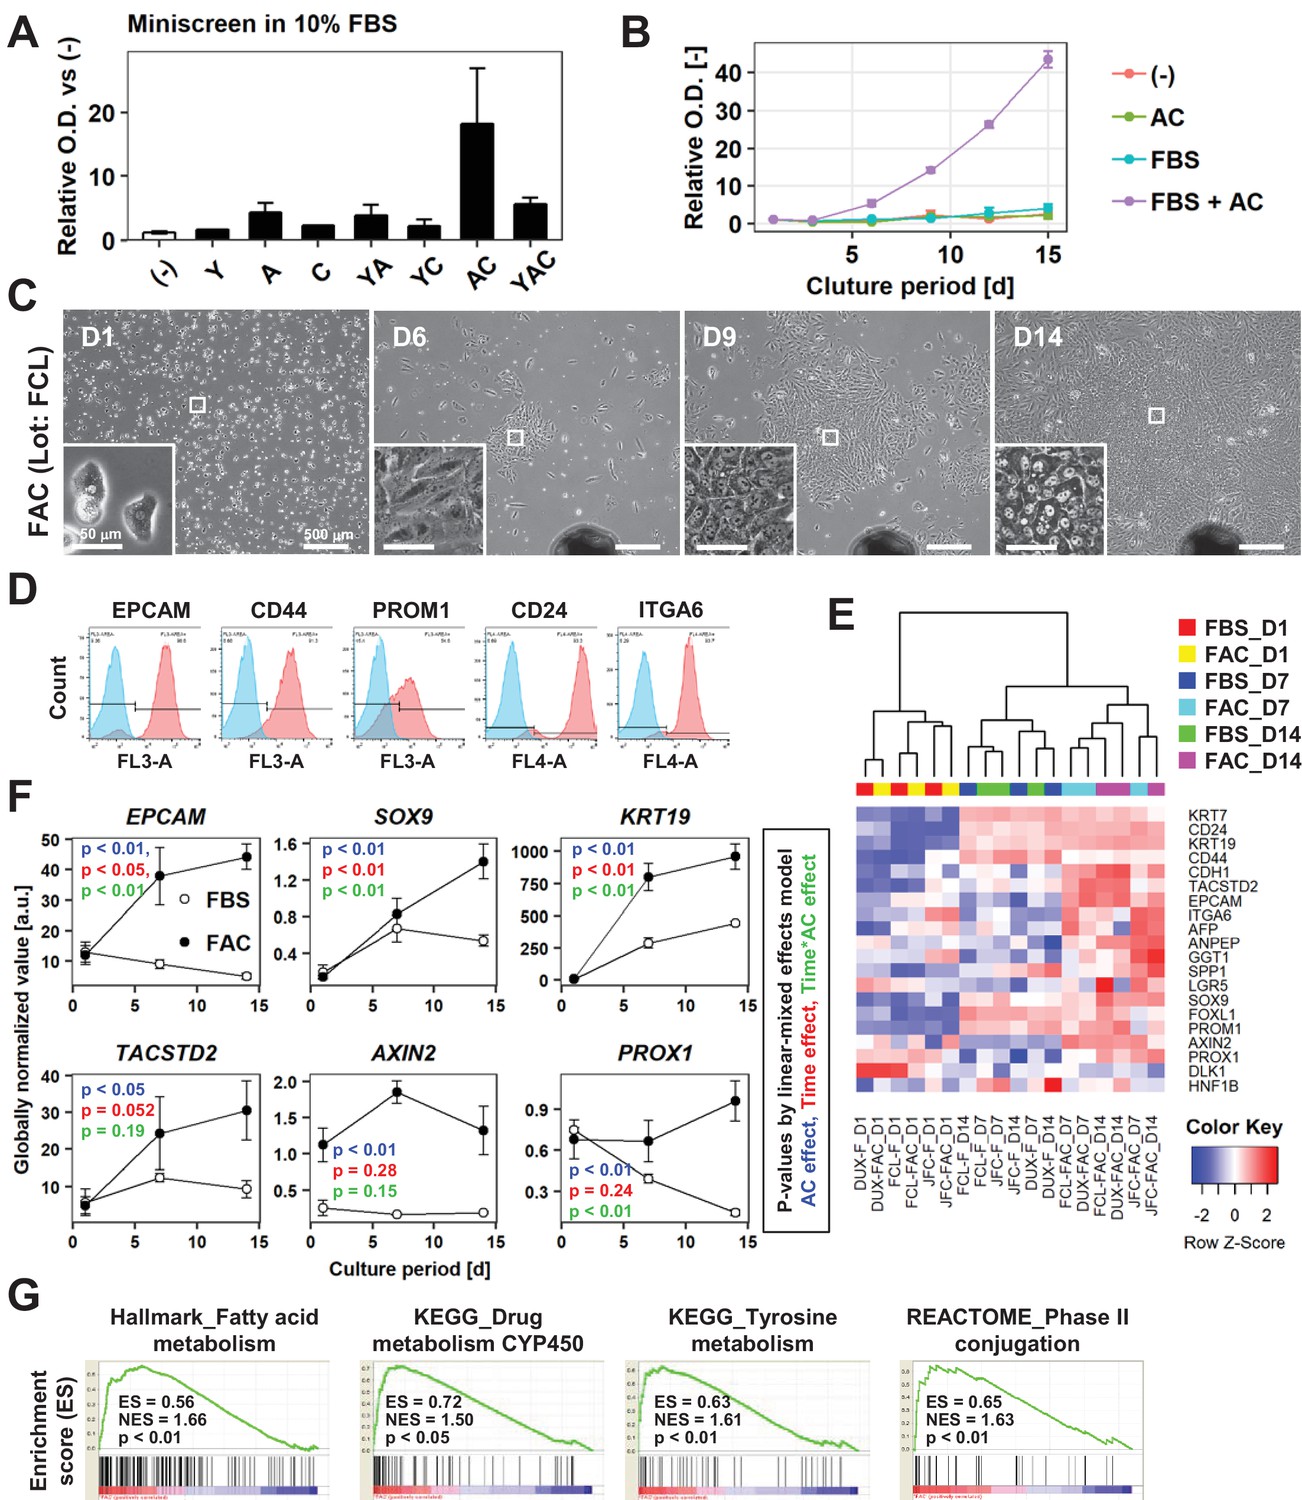
AC together with FBS support the expansion of IPHHs.
(A) WST assay assessing the effects of various combinations of Y, A, and C together with 10% FBS on proliferation of 8-month-old IPHHs (lot FCL). Absorbance at 450 nm was determined at D14 and normalized against that at D0. Data are the mean ± SEM of two repeated experiments. (B) WST assay assessing the effects of AC and FBS on proliferation of IPHHs (lot FCL). Absorbance at 450 nm was determined at D14 and normalized against that at D0. Data are the mean ± SD of three technical replicates. (C) Phase contrast images showing the morphological changes of IPHHs (lot FCL) upon culture in FAC. Inset images show spontaneous hepatic differentiation in densely packed regions at D14. (D) Flow cytometric analysis of surface expression of LPC markers. Results of cells from lot FCL are shown as representative data (see also Figure 2—figure supplement 2A). (E) Heatmap showing expression of BEC/LPC marker genes, as assessed by microarray analysis. Each element represents normalized (log2) expression, as indicated by the color scale. Data are from three lots and two repeated experiments. Hierarchical clustering was performed based on Euclidean distance. (F) Expression levels of genes that were differentially expressed between cells cultured in the presence of FBS and those cultured in FAC are shown as mean ± SEM of three lots per time point (each value is determined as the mean of 2 repeated experiments for each lot). p-Values were calculated by the linear mixed model to account for the covariance structure due to repeated measures at different time points. The meanings of the various colors are described in the figure. (G) GSEA demonstrating enrichment of hepatic function-related gene sets in cells cultured in FAC in comparison with cells cultured in the presence of FBS at D14. p-Values indicate nominal p-values.
Figure 2—figure supplement 1
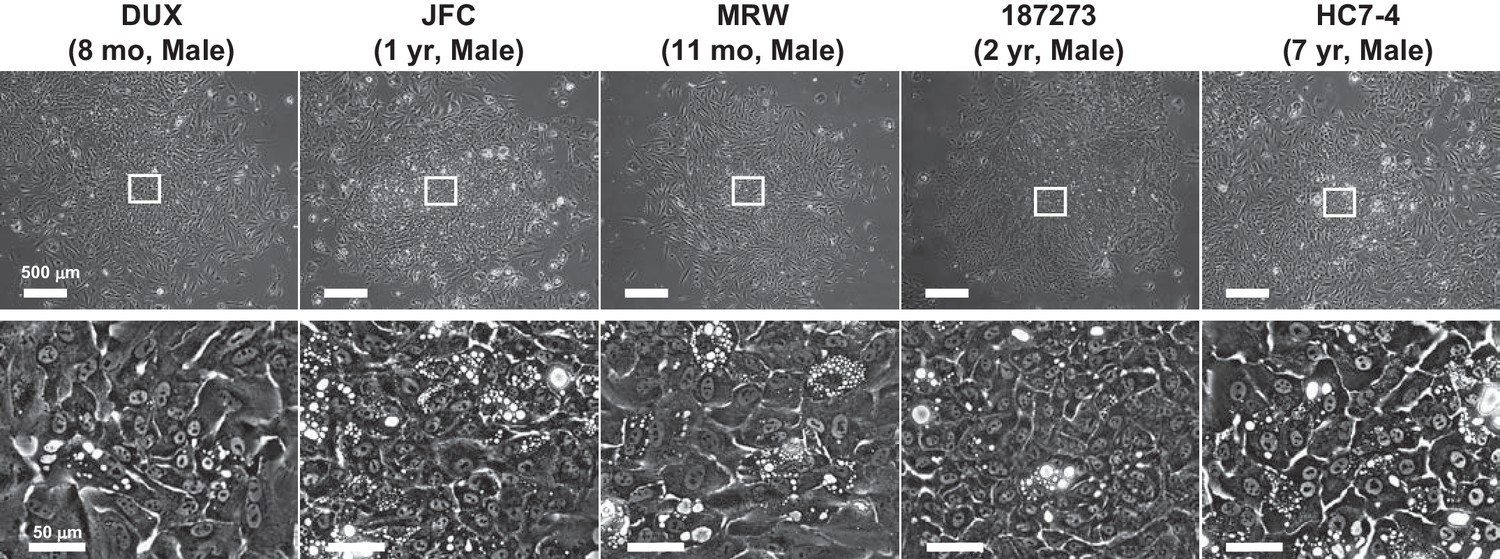
Proliferative colonies observed in infant and juvenile PHHs.
Phase contrast images of PHHs obtained from infant donors (four lots) and a juvenile donor (one lot). Regions with spontaneous hepatic differentiation are magnified.
Figure 2—figure supplement 2
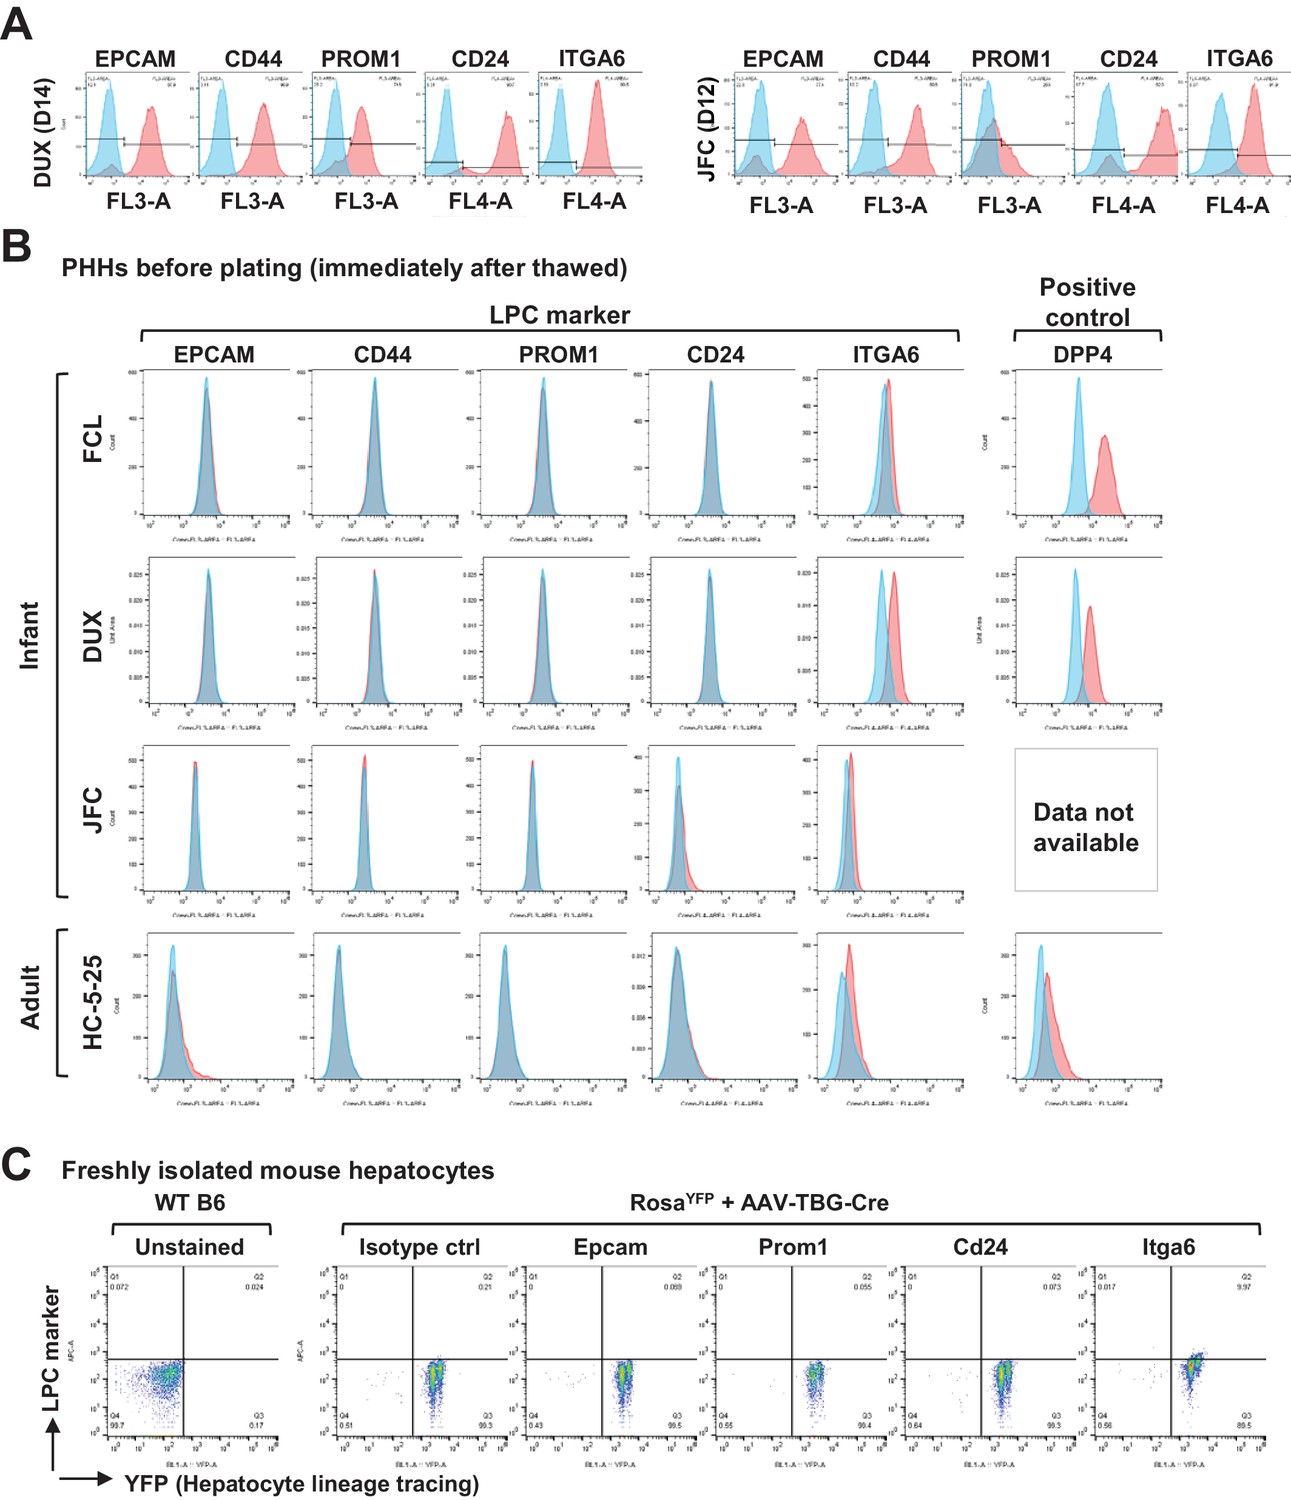
Characterization of FAC-cultured proliferative human hepatic cells.
(A) Flow cytometry of LPC surface markers for hCLiPs derived from lots DUX and JFC PHHs. (B) Flow cytometry of LPC surface markers for cryopreserved PHHs. The cells were thawed and stained with the designated antibodies before plating. To confirm that the surface proteins are preserved after a freeze/cell cycle, cells were stained with an antibody against DPP4, a general hepatocyte marker, as a positive control. (C) Flow cytometry of LPC surface markers in mouse adult hepatocytes. Primary hepatocytes were isolated from a wild type (WT) B6 mouse as a control or a RosaYFP/YFP mouse, which received retro-orbital injection of AAV-TBG-cre for genetically labeling the hepatocytes 1 month prior to cell isolation.
Figure 2—figure supplement 3
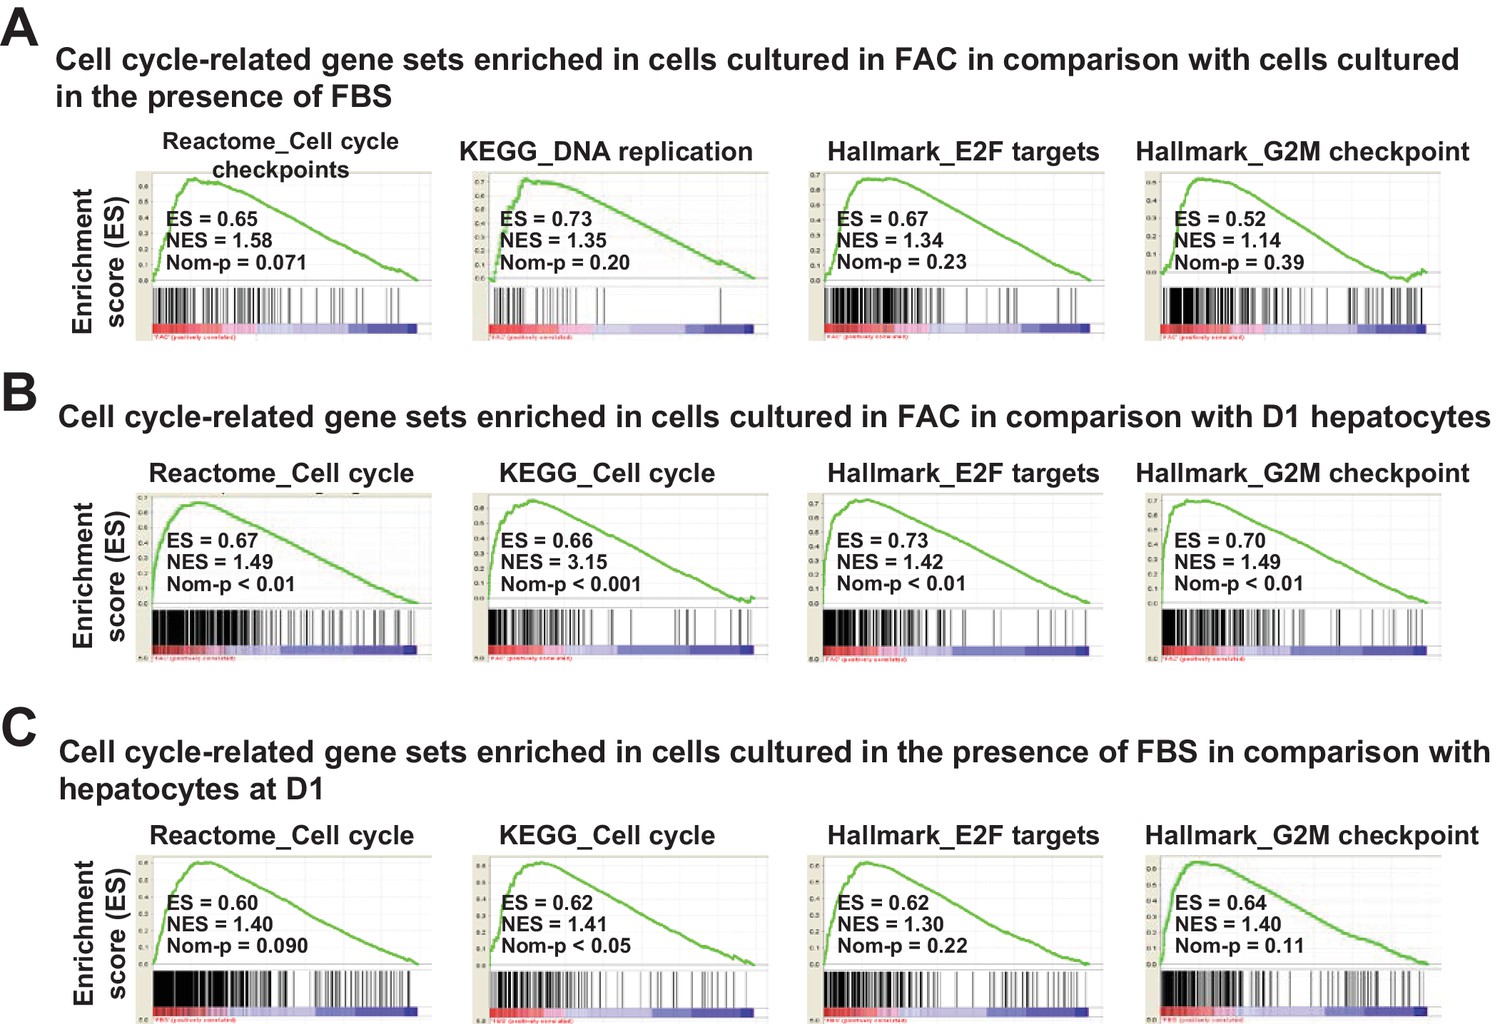
Cell-cycle-related gene expression analysis by GSEA.
(A) GSEA demonstrating enrichment of cell-cycle-related gene sets in cells cultured in FAC in comparison with cells cultured in the presence of FBS at D14. (B) GSEA demonstrating enrichment of cell-cycle-related gene sets in cells cultured in FAC at D14 in comparison with D1 hepatocytes. (C) GSEA demonstrating enrichment of cell-cycle-related gene sets in cells cultured in the presence of FBS at D14 in comparison with D1 hepatocytes.
Figure 3 with 4 supplements
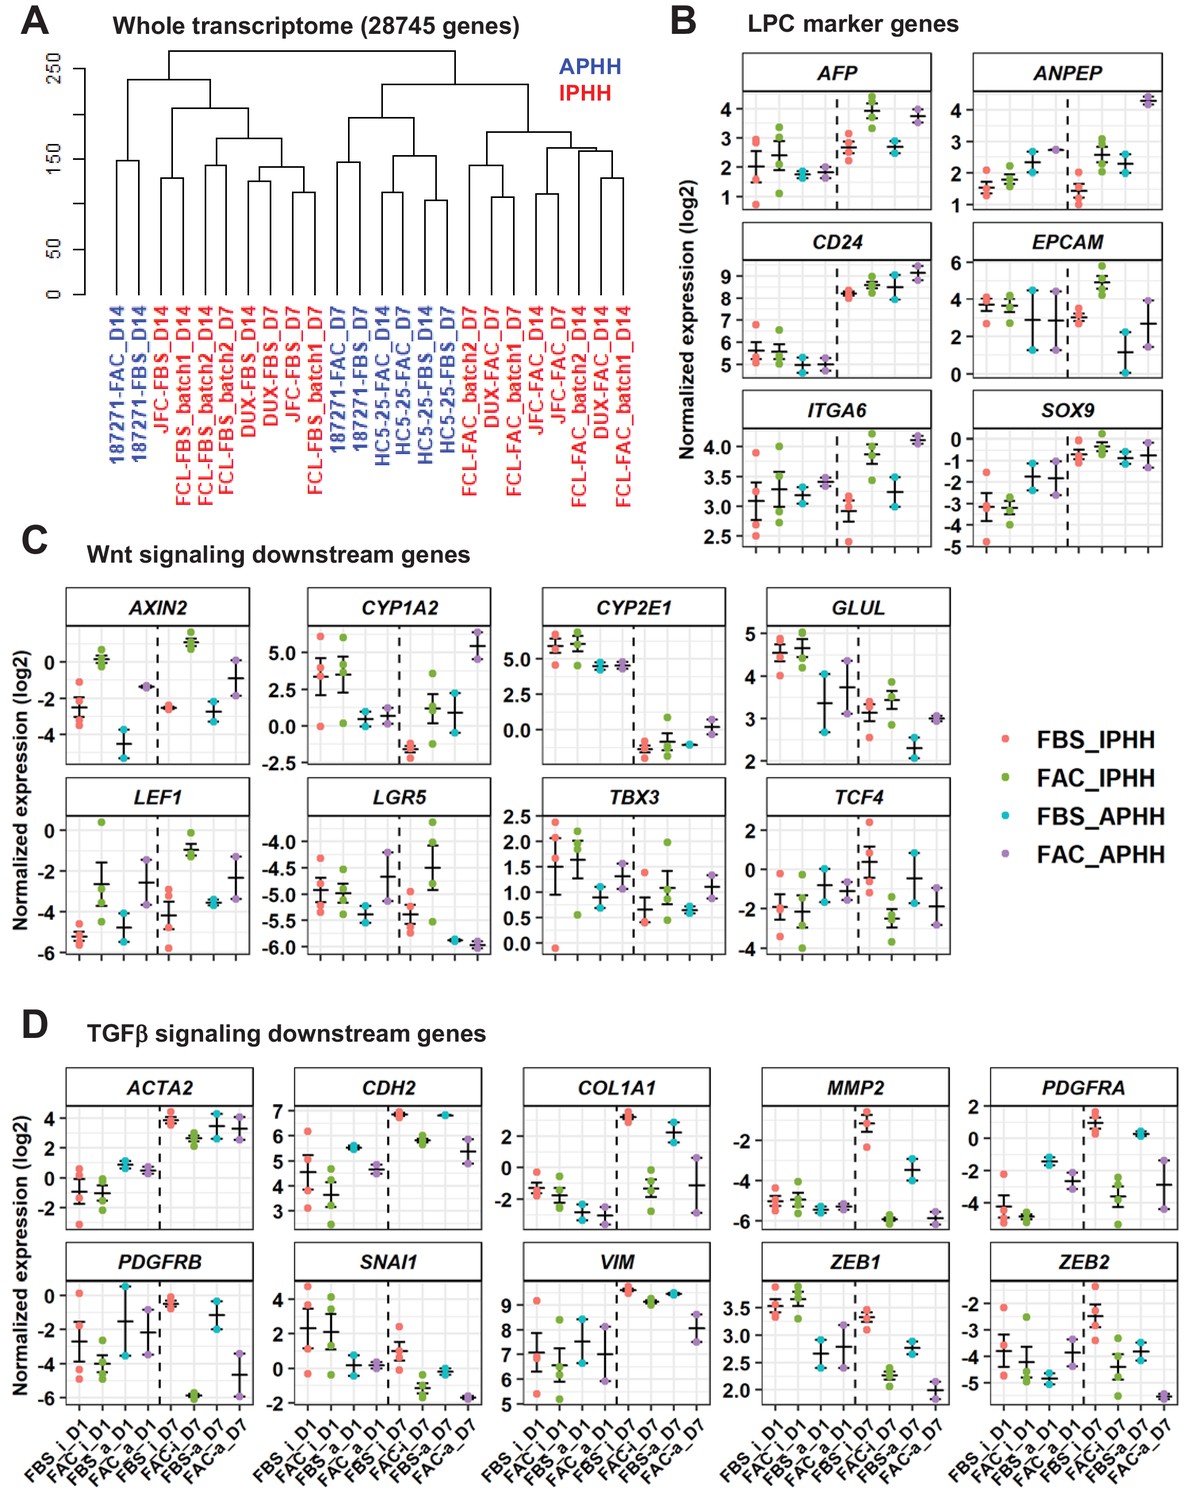
Comparative analysis of responsiveness to FAC of IPHHs and APHHs.
(A) Hierarchical clustering for whole transcriptome of IPHHs (red) and APHHs (blue). Two lots of APHHs (HC5-25 and 187271) and three lots of IPHHs were compared. (B) Gene expression of LPC marker genes was compared between IPHHs and APHHs at D1 and D7 of culture in FBS or FAC. Data are the mean ± SEM. (C) Gene expression of Wnt signaling downsteam genes was compared between IPHHs and APHHs at D1 and D7 of culture in FBS or FAC. Data are the mean ± SEM. (D) Gene expression of TGFβ signaling downsteam genes was compared between IPHHs and APHHs at D1 and D7 of culture in FBS or FAC. Data are the mean ± SEM. FBS_i, FAC_i, FBS_a and FAC_a below each panel denote IPHHs cultured in FBS and FAC, and APHHs cultured in FBS and FAC, respectively.
Figure 3—figure supplement 1
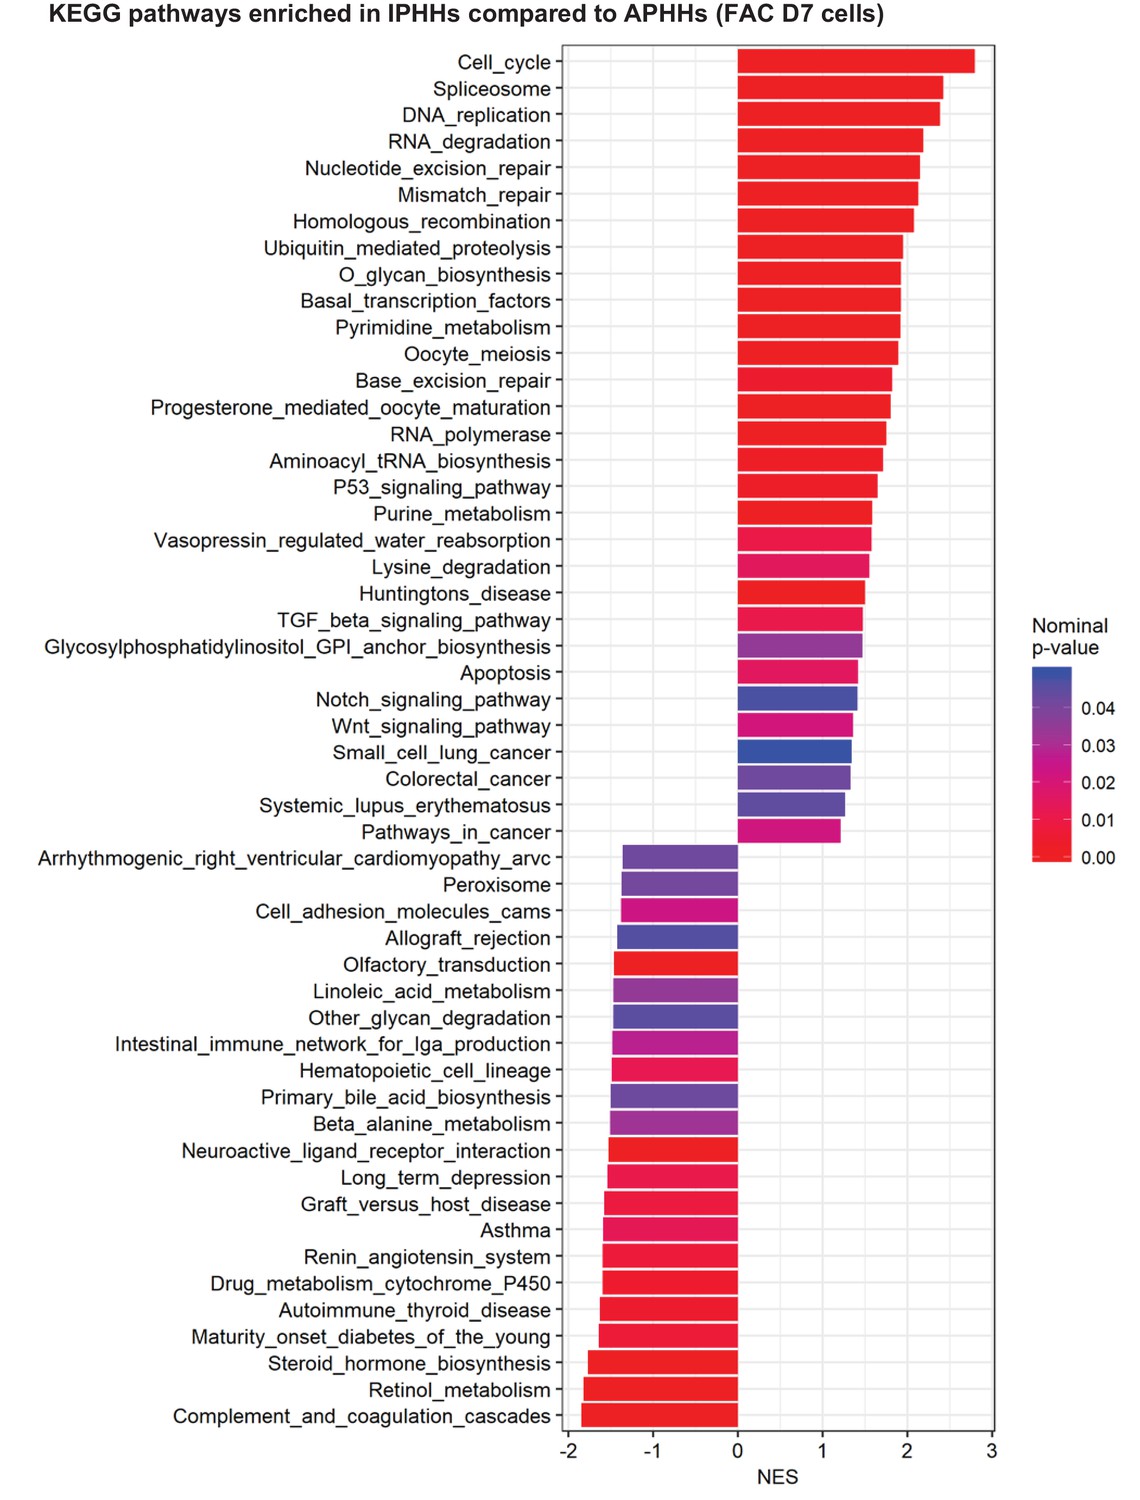
GSEA comparing IPHHs and APHHs cultured in FAC for 7 days (KEGG database).
Pathways enriched (nominal p-value<0.05) in IPHHs compared to APHHs are shown.
Figure 3—figure supplement 2
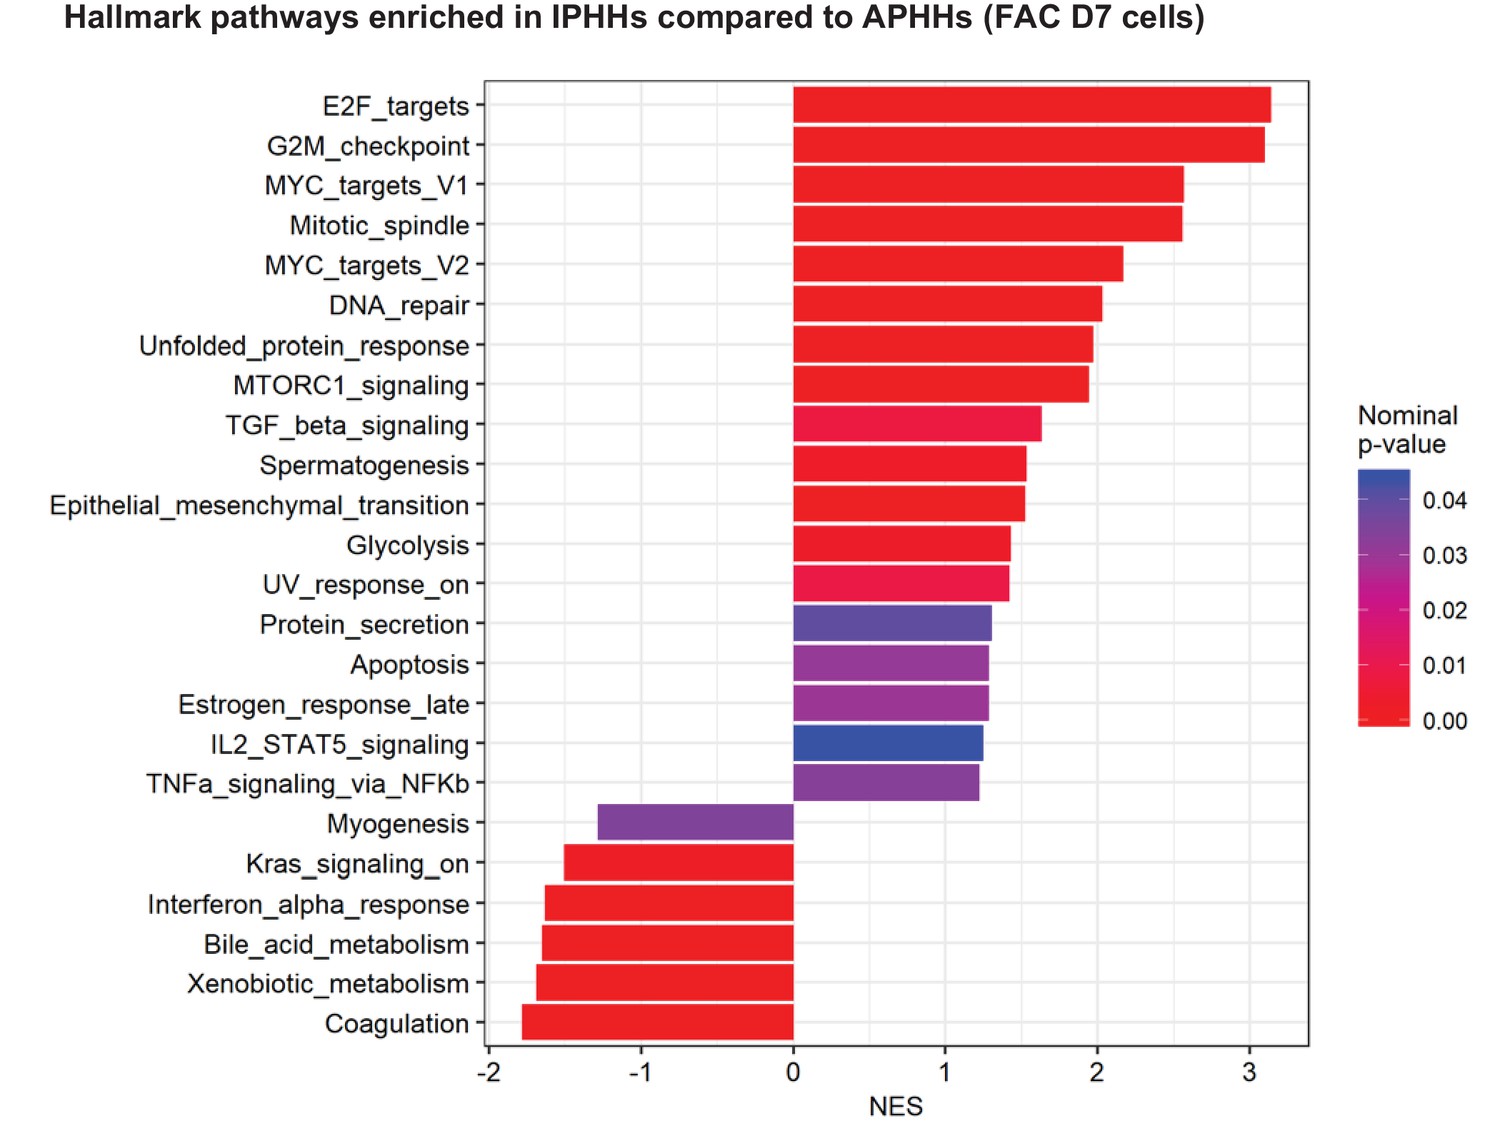
GSEA comparing IPHHs and APHHs cultured in FAC for 7 days (Hallmark database).
Pathways enriched (nominal p-value<0.05) in IPHHs compared to APHHs are shown.
Figure 3—figure supplement 3
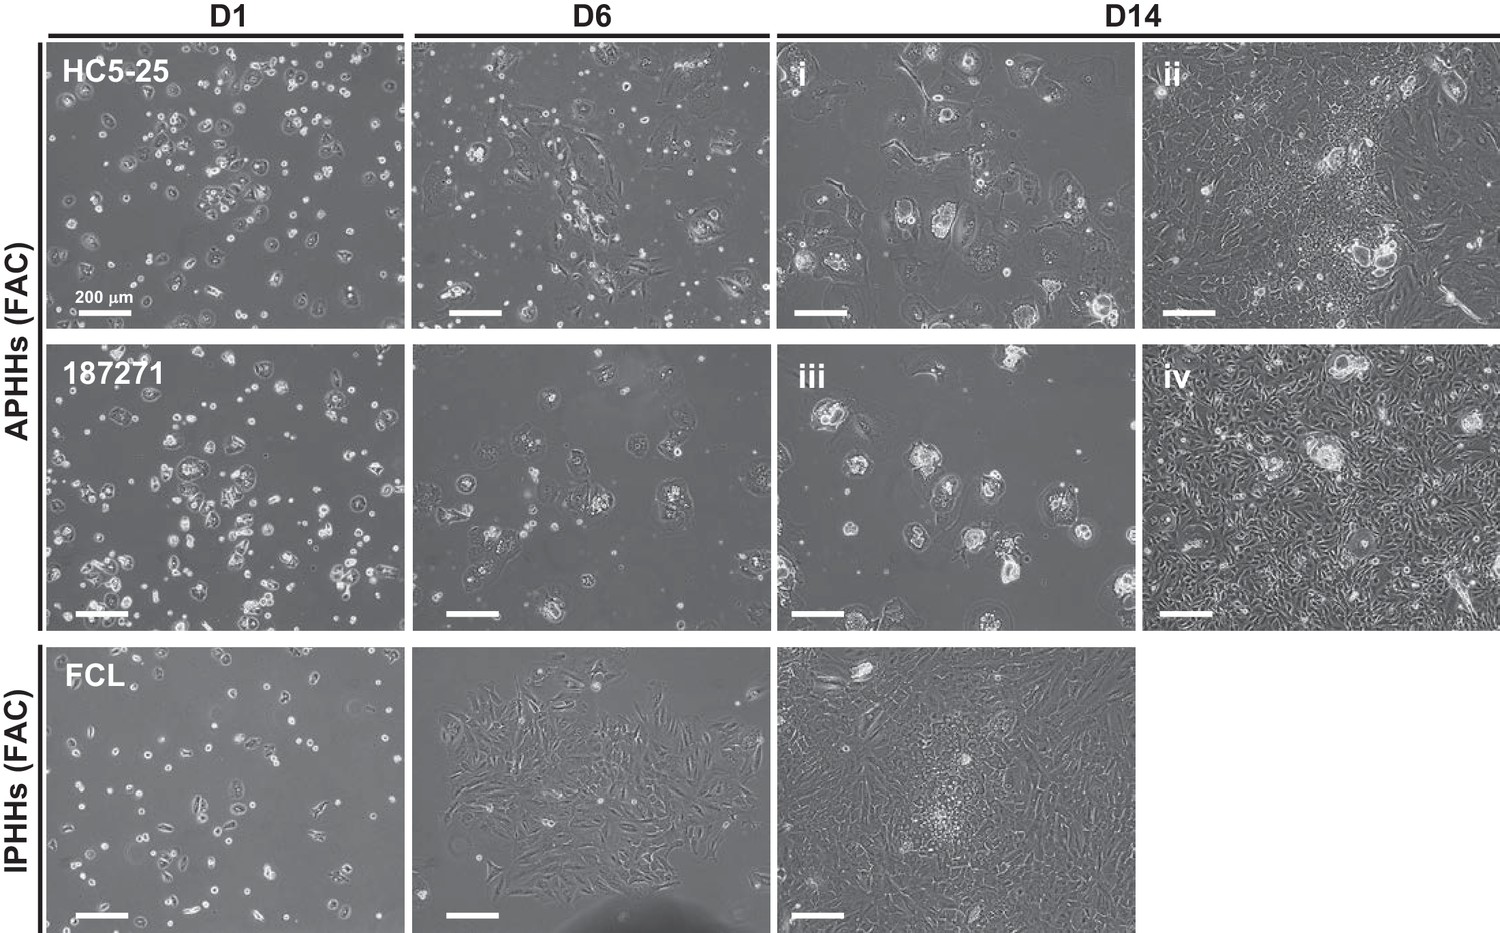
Morphological changes of APHHs and IPHHs which were cultured in FAC medium.
Note that HC5-25 APHHs formed progenitor-like colonies partly, while 187271 APHHs did not. Proliferating cells in 187271 culture were only non-hepatic cells as determined by microscopic observation. FCL IPHHs (referred to ‘batch2’ in (A)) were cultured in the same batch of experiment.
Figure 3—figure supplement 4
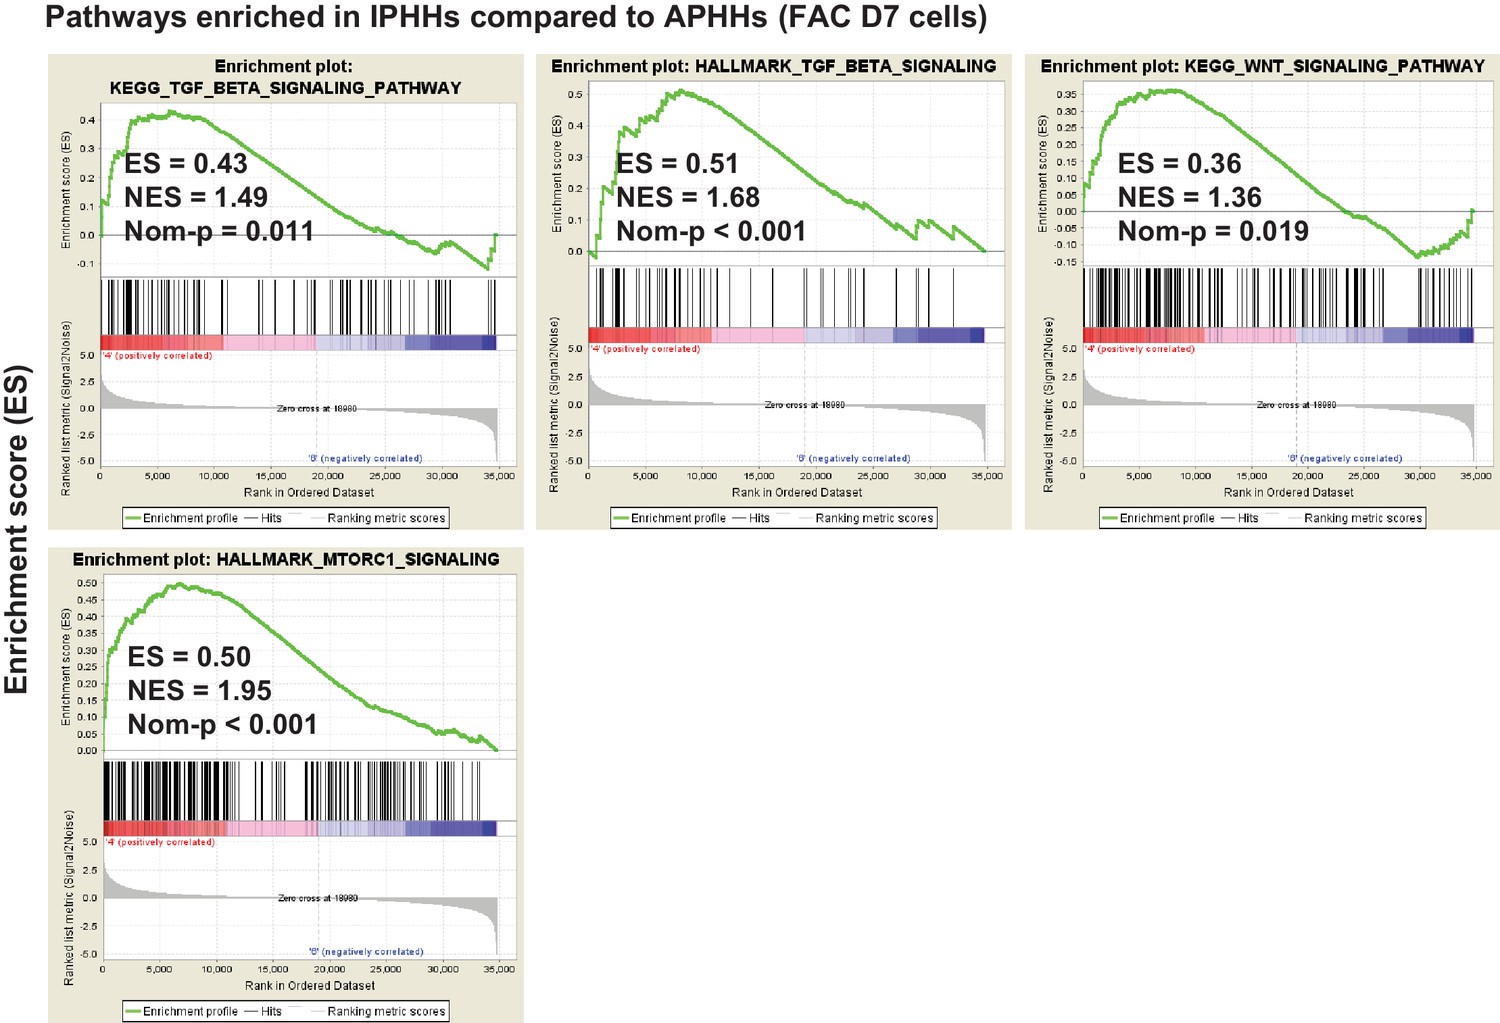
Individual plots of GSEA results for TGFβ, Wnt and mTORC1 signaling pathways.
Figure 4 with 1 supplement

FAC-cultured proliferative cells differentiate into mature hepatocytes in vitro.
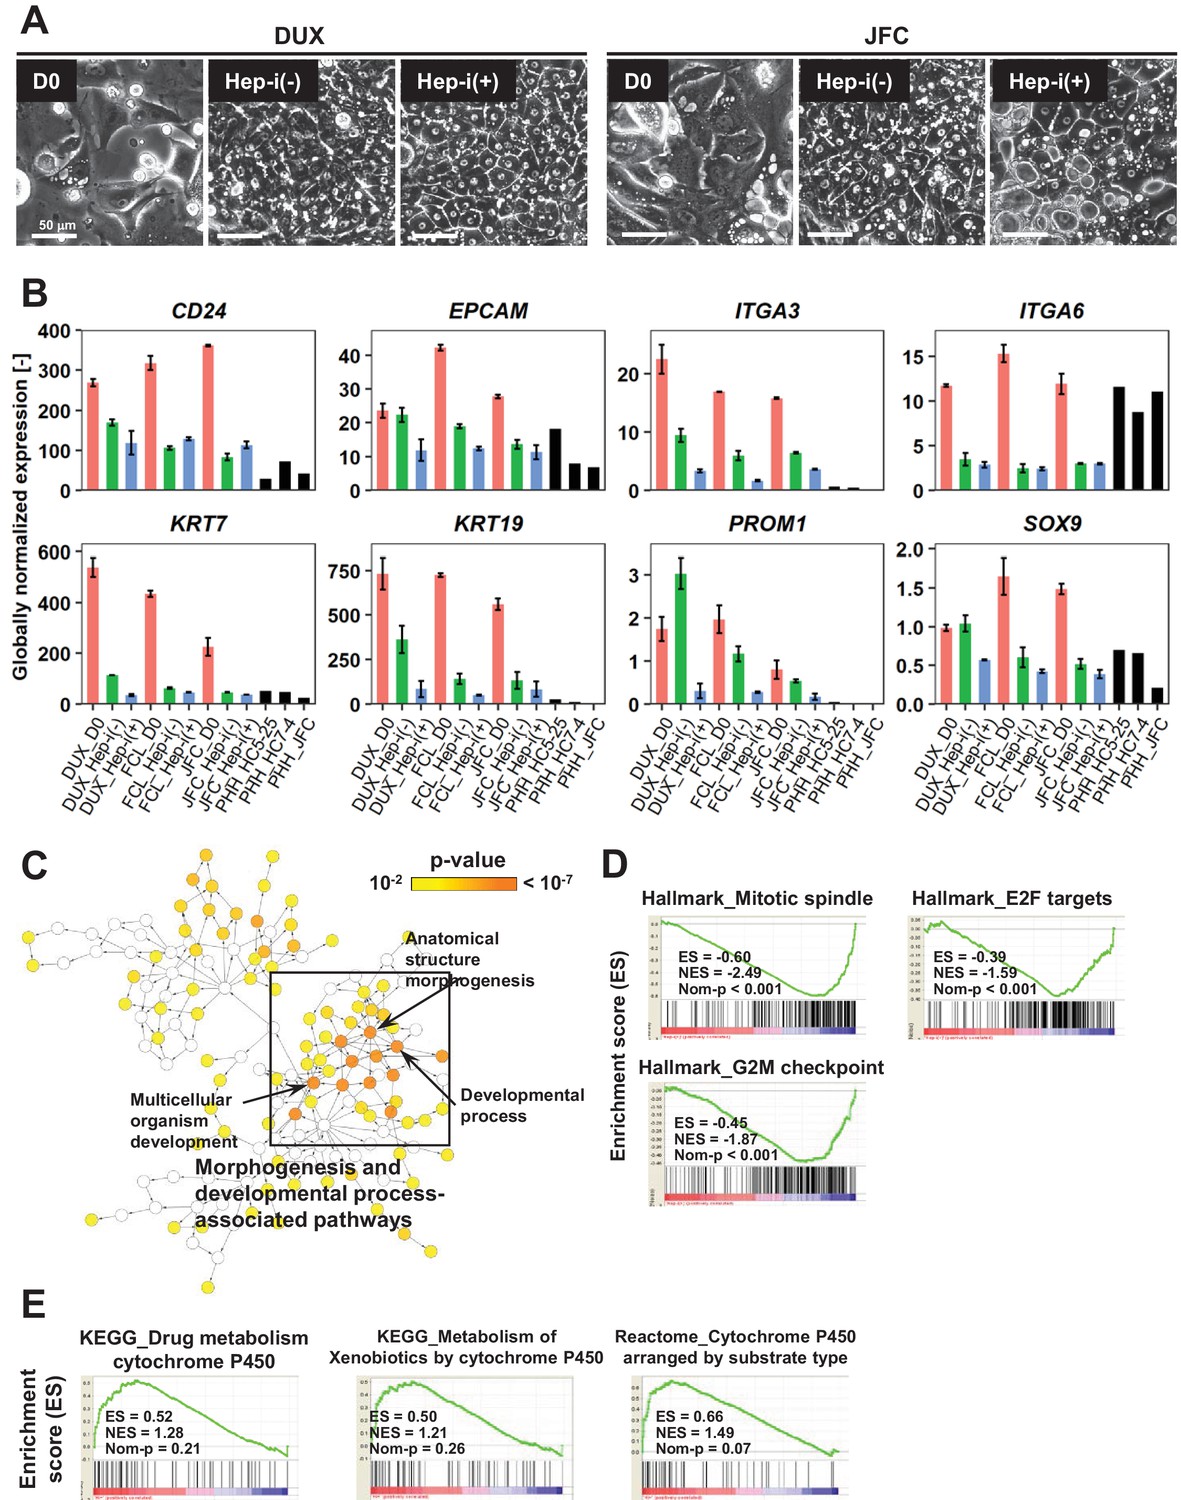
(A) Phase contrast images showing the morphological changes of FAC-cultured human proliferative cells (lot FCL) treated with (Hep-i(+)) or without (Hep-i(-)) hepatic maturation-inducing factors. Also see Figure 4—figure supplement 1A for lots DUX and JFC. (B) Phase contrast images of PHHs for reference. (C) Quantified expression of hepatic function-related genes in hCLiPs derived from the three lots with or without hepatic induction and in PHHs. Data are shown as mean ± SEM of two repeated experiments for each lot of hCLiPs and the results of one experiment for each lot of PHHs. (D) Hierarchical clustering based on Canberra distance of 990 genes that were differentially expressed (≥2 fold change on average for the three lots and p<0.05 by the paired t-test) between Hep-i(-) and Hep-i(+). Data were obtained from two repeated experiments for each lot of hCLiPs and from one experiment for each lot of PHHs. (E) Biological processes overrepresented in Hep-i(+) cells in comparison with Hep-i(-) cells, as identified using BiNGO, a Cytoscape plug-in. p-value is calculated by the default setting of the plug-in. (F) GSEA demonstrating enrichment of hepatic function-related gene sets in Hep-i(+) cells in comparison with Hep-i(-) cells. p-Values indicate nominal p-values.
Figure 4—figure supplement 1
Characterization of proliferative human hepatic cells following hepatic maturation.
(A) Phase contrast images showing the morphological changes of hCLiPs derived from lots DUX and JFC upon hepatic maturation. (B) Quantified expression of BEC/LPC marker genes in hCLiPs derived from the three lots with or without hepatic maturation and in PHHs. Data are the mean ± SEM of two repeated experiments for each lot of hCLiPs and the results of one experiment for each lot of PHHs. (C) Biological processes overrepresented in Hep-i(-) cells in comparison with Hep-i(+) cells, as identified using BiNGO, a Cytoscape plug-in. p-Value is calculated by the default setting of the plug-in. (D) GSEA demonstrating enrichment of cell-cycle-related gene sets in Hep-i(-) cells in comparison with Hep-i(+) cells. (E) GSEA demonstrating enrichment of CYP-associated metabolic pathways in Hep-i(+) cells in comparison with Hep-i(-) cells.
Figure 5 with 1 supplement
hCLiP-derived hepatocytes exhibit CYP enzymatic activity.
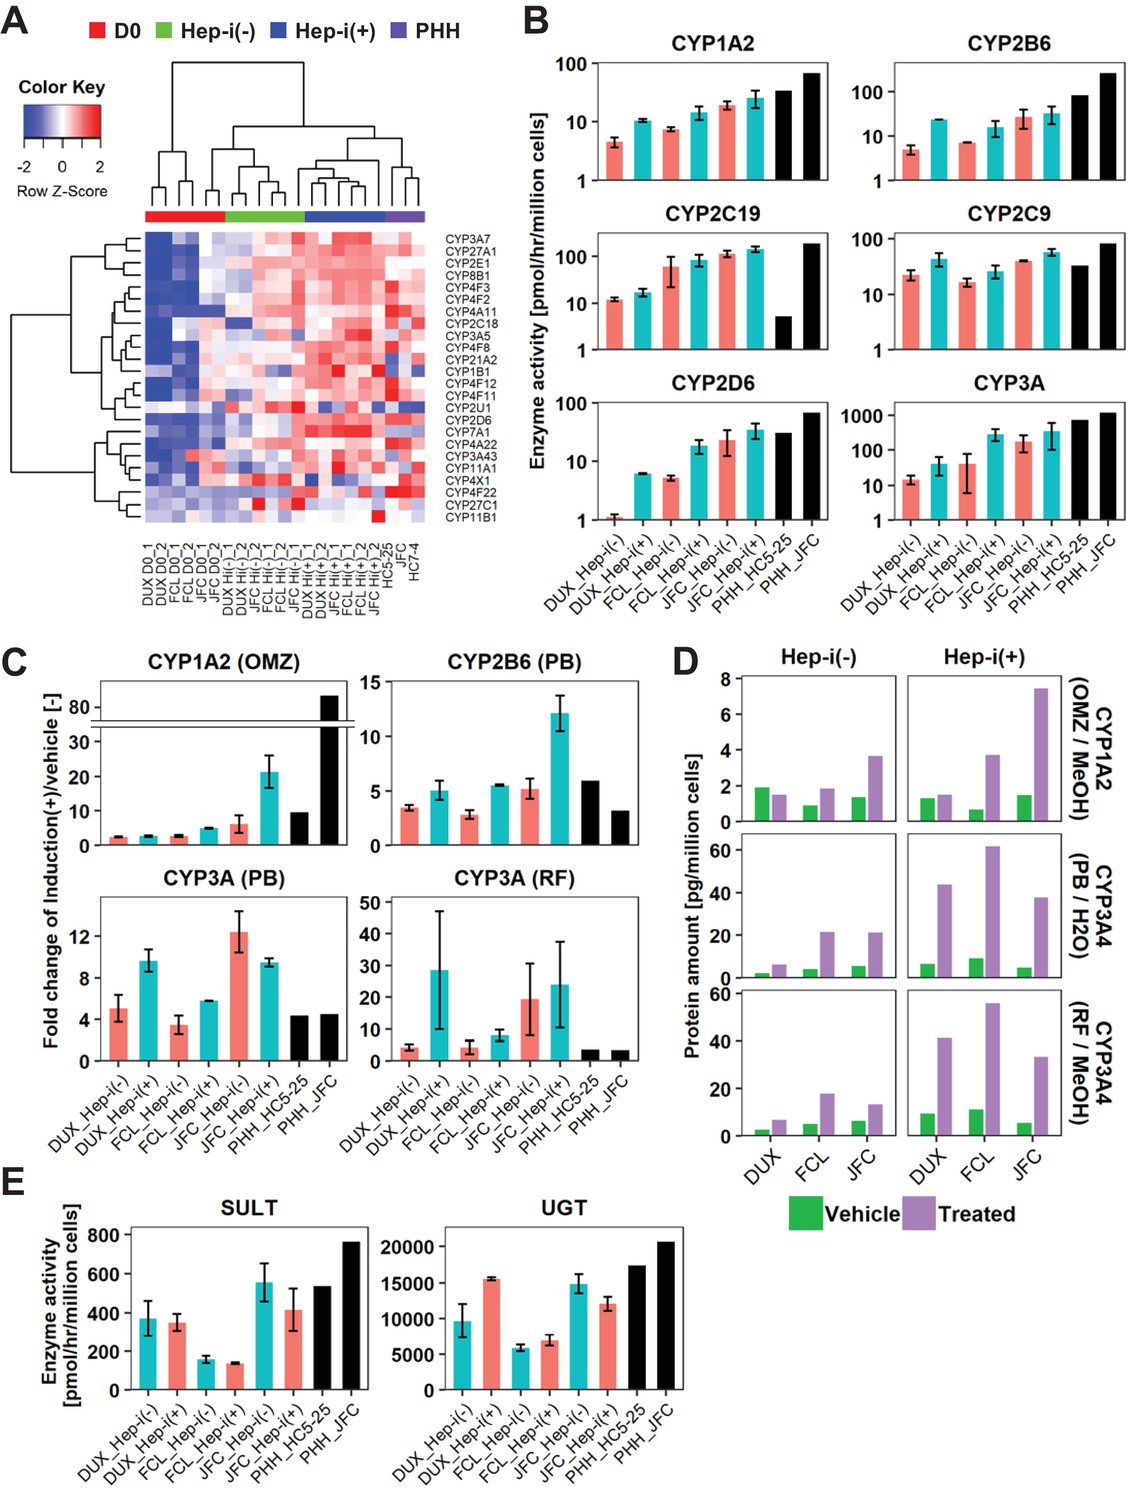
(A) Heatmap showing expression of CYP genes that were differentially expressed between Hep-i(-) and Hep-i(+) cells (≥1.5 fold change), as assessed by microarray analysis. Fold change was calculated using the mean values of three donor-derived CLiPs (experiments were repeated twice for each donor-derived CLiPs). Hierarchical clustering was performed based on Euclidean distance. (B) Basal enzymatic activities of major CYPs in Hep-i(-) cells, Hep-i(+) cells, and PHHs, as assessed by LC-MS/MS using a cocktail of substrates. Data were obtained from two repeated experiments for each lot of hCLiPs and from one experiment for each lot of PHHs. (C) Inducibility of CYP1A2, CYP2B6, and CYP3A activities. Enzymatic activities in inducer-treated cells were compared with those in cells treated with the corresponding vehicle by LC-MS/MS analysis using a cocktail of substrates. Data are the mean ± SEM of two repeated experiments for each lot of hCLiPs and the results of one experiment for each lot of PHHs. (D) LC-MS/MS analysis of the intracellular protein levels of CYP1A2 and CYP3A4 in Hep-i(-) and Hep-i(+) cells treated with inducers or the corresponding vehicle. Data are from one experiment for each lot of hCLiPs. (E) Enzymatic activities of the phase II enzymes UGT and SULT, as assessed by LC-MS/MS analysis using a cocktail of substrates. Data are the mean ± SEM of two repeated experiments for each lot of hCLiPs and the results of one experiment for each lot of PHHs.
Figure 5—figure supplement 1
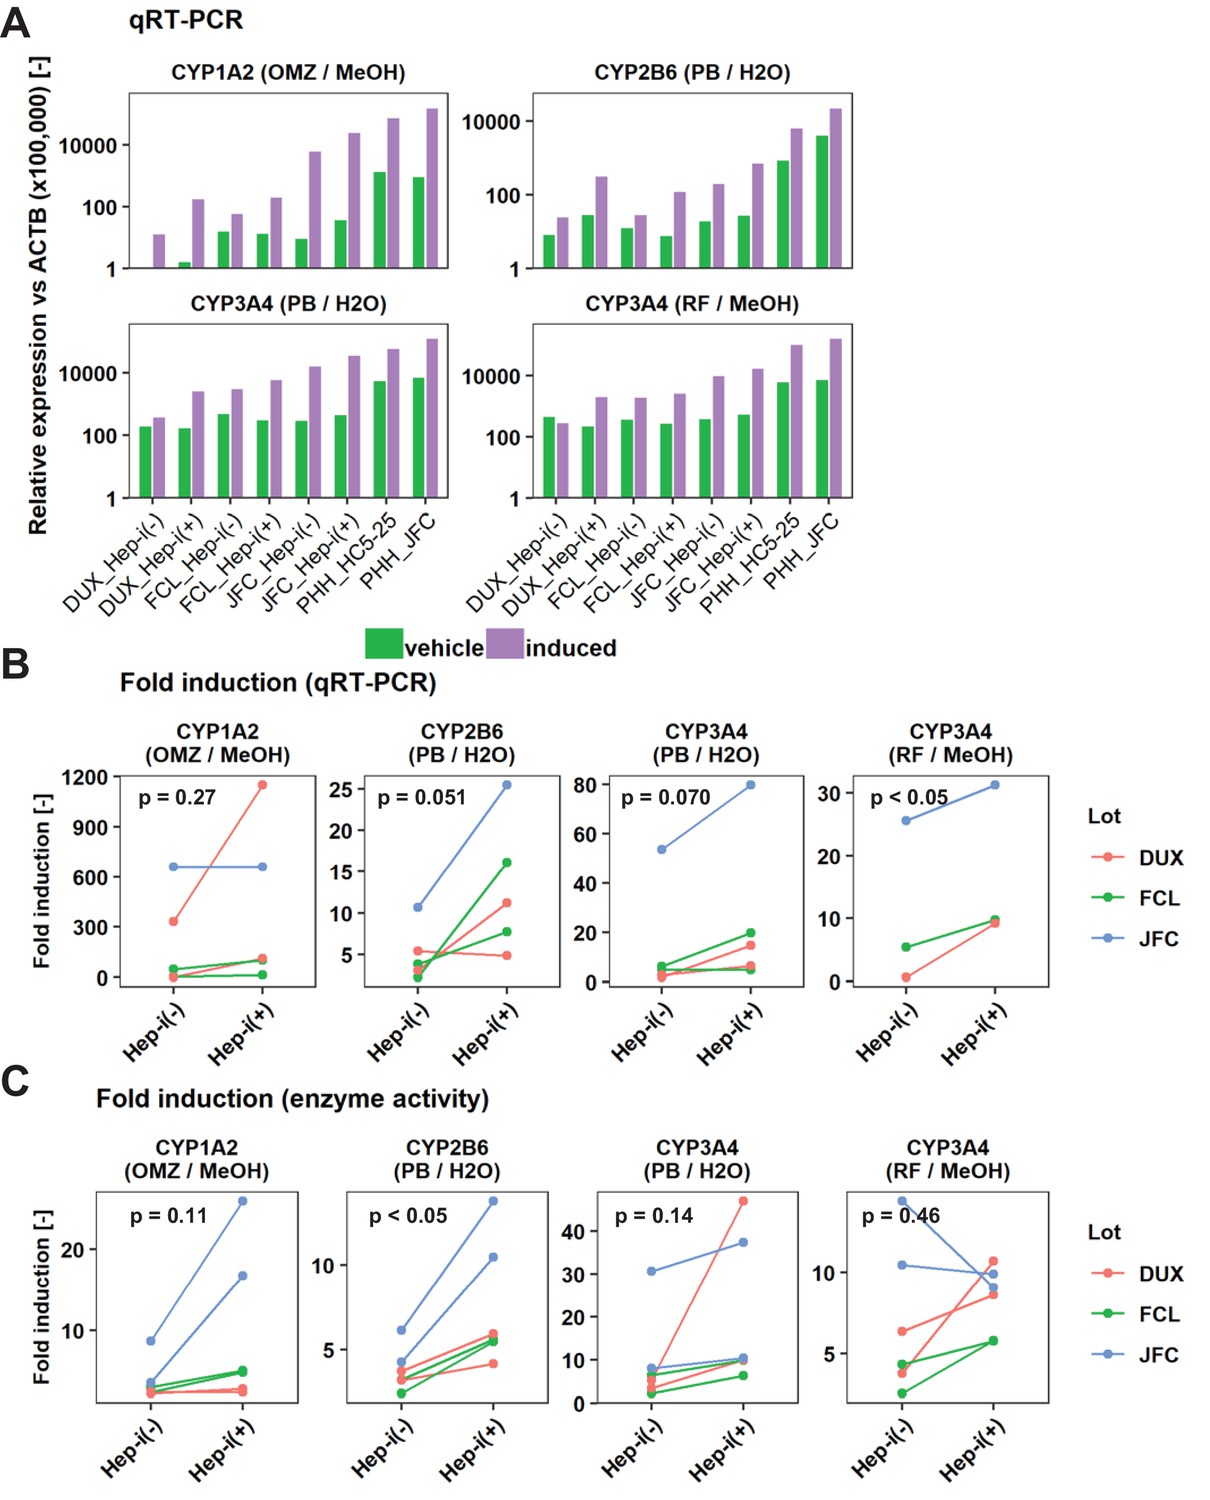
Inducibility of CYP1A2 and CYP3A4 in Hep-i(+) cells.
(A) qRT-PCR analysis of the inducibility of CYP1A2, CYP2B6, and CYP3A mRNA expression. Gene expression levels were normalized against that of ACTB. Data are shown as one representative experiment. (B) Summary of the inducibility of CYP mRNA expression in the individual experiments shown in (B). Data are obtained from one experiment for lot JFC and two repeated experiments for DUX and FCL except CYP3A4 (RF/MeOH) in which all data are obtained from one experiment. (C) Summary of the inducibility of CYP enzymatic activities in the individual experiments shown in (Figure 3C). Data are obtained from two repeated experiments. p-Values are obtained by paired student’s t-test.
Figure 6 with 1 supplement
hCLiPs stably expand in vitro and retain their hepatic differentiation ability.
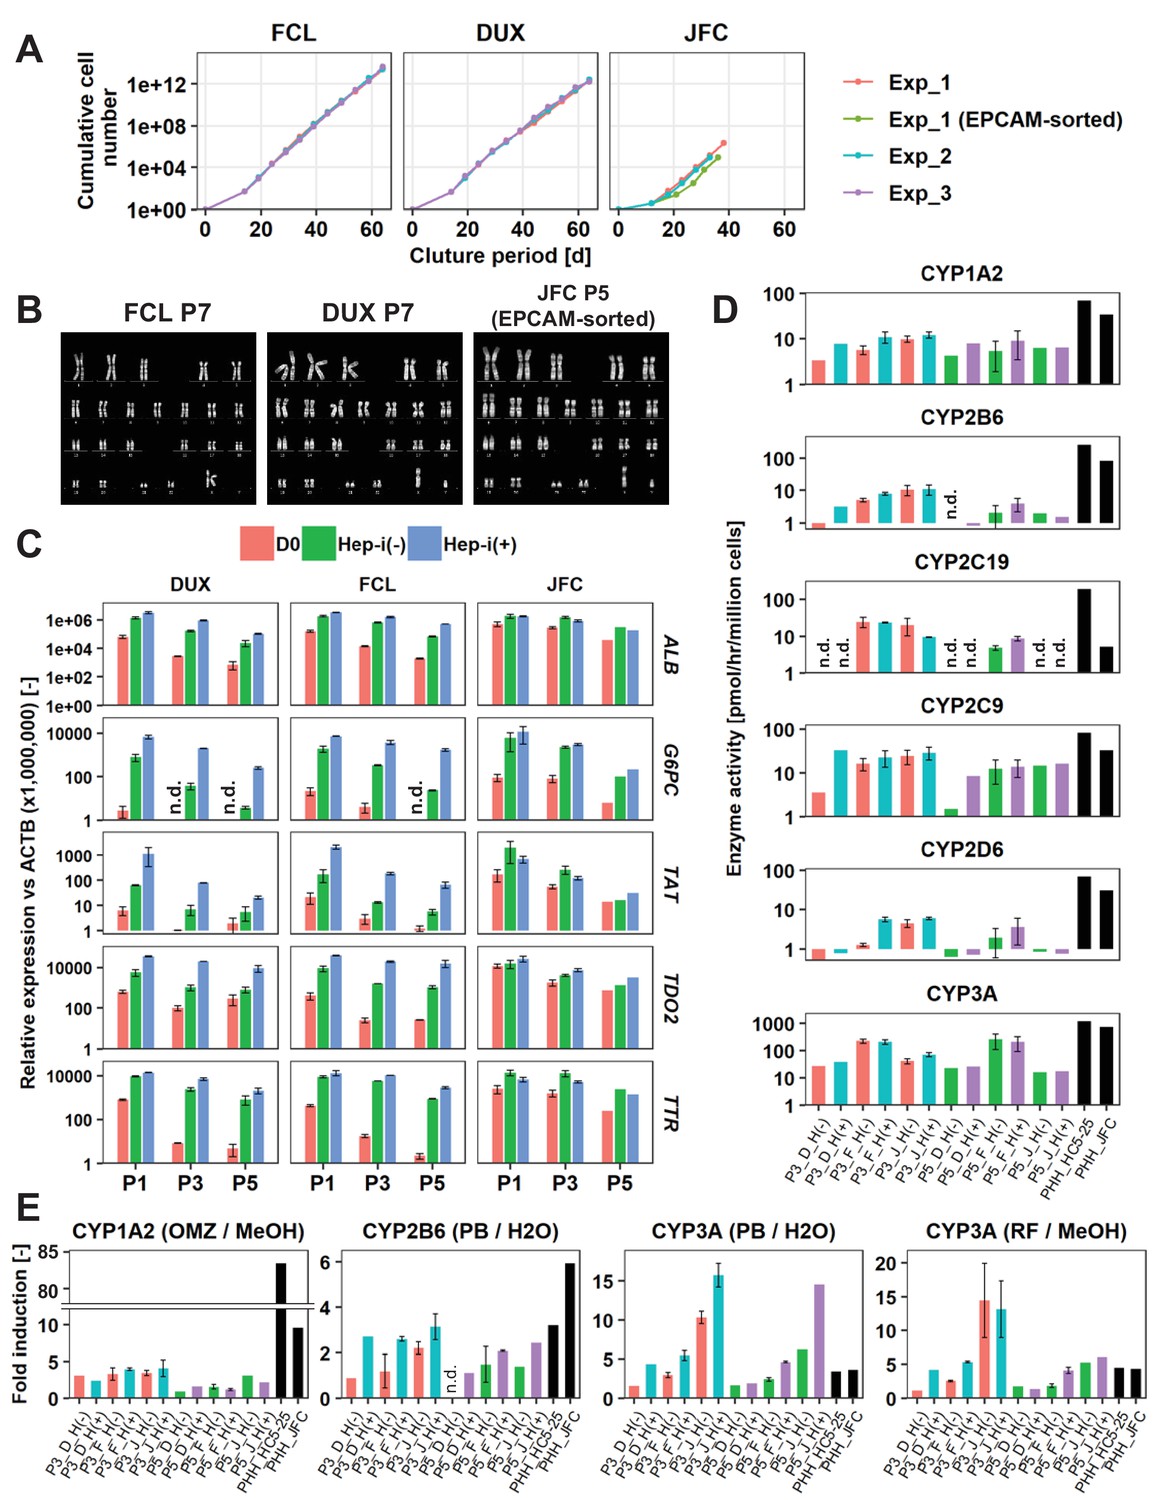
(A) Growth curves of hCLiPs from P0–10 (lots FCL and DUX) or P0–four or P0–5 (lot JFC). Each curve represents data obtained in independent experiments. Data in each plot indicate the cumulative cell numbers at each time point normalized against that at D0 (set to one cell). (B) Representative chromosomal images of hCLiPs derived from the three lots, as assessed by Q-band karyotyping. (C) qRT-PCR analysis of hepatocyte-specific genes at P1, P3, and P5. Data are normalized against ACTB expression, and shown as mean ± SEM of two repeated experiments except JFC cells at P5 (n = 1). (D) Basal enzymatic activities of major CYPs in Hep-i(-) and Hep-i(+) cells at P3 and P5, as well as in PHHs, as assessed by LC-MS/MS using a cocktail of substrates. Data are shown as one experiment or the mean ± SEM of two repeated experiments for each lot of hCLiPs and the results of one experiment for each lot of PHHs. N.d. indicates ‘not detected’. (E) Inducibility of CYP1A2, CYP2B6, and CYP3A activities at P3 and P5. Enzymatic activities in inducer-treated cells were compared with those in cells treated with the corresponding vehicle by LC-MS/MS analysis using a cocktail of substrates. Data are shown as one experiment or the mean ± SEM of two repeated experiments for each lot of hCLiPs and the results of one experiment for each lot of PHHs. N.d. indicates ‘not detected’.
Figure 6—figure supplement 1
Characterization of hCLiPs upon long-term culture.
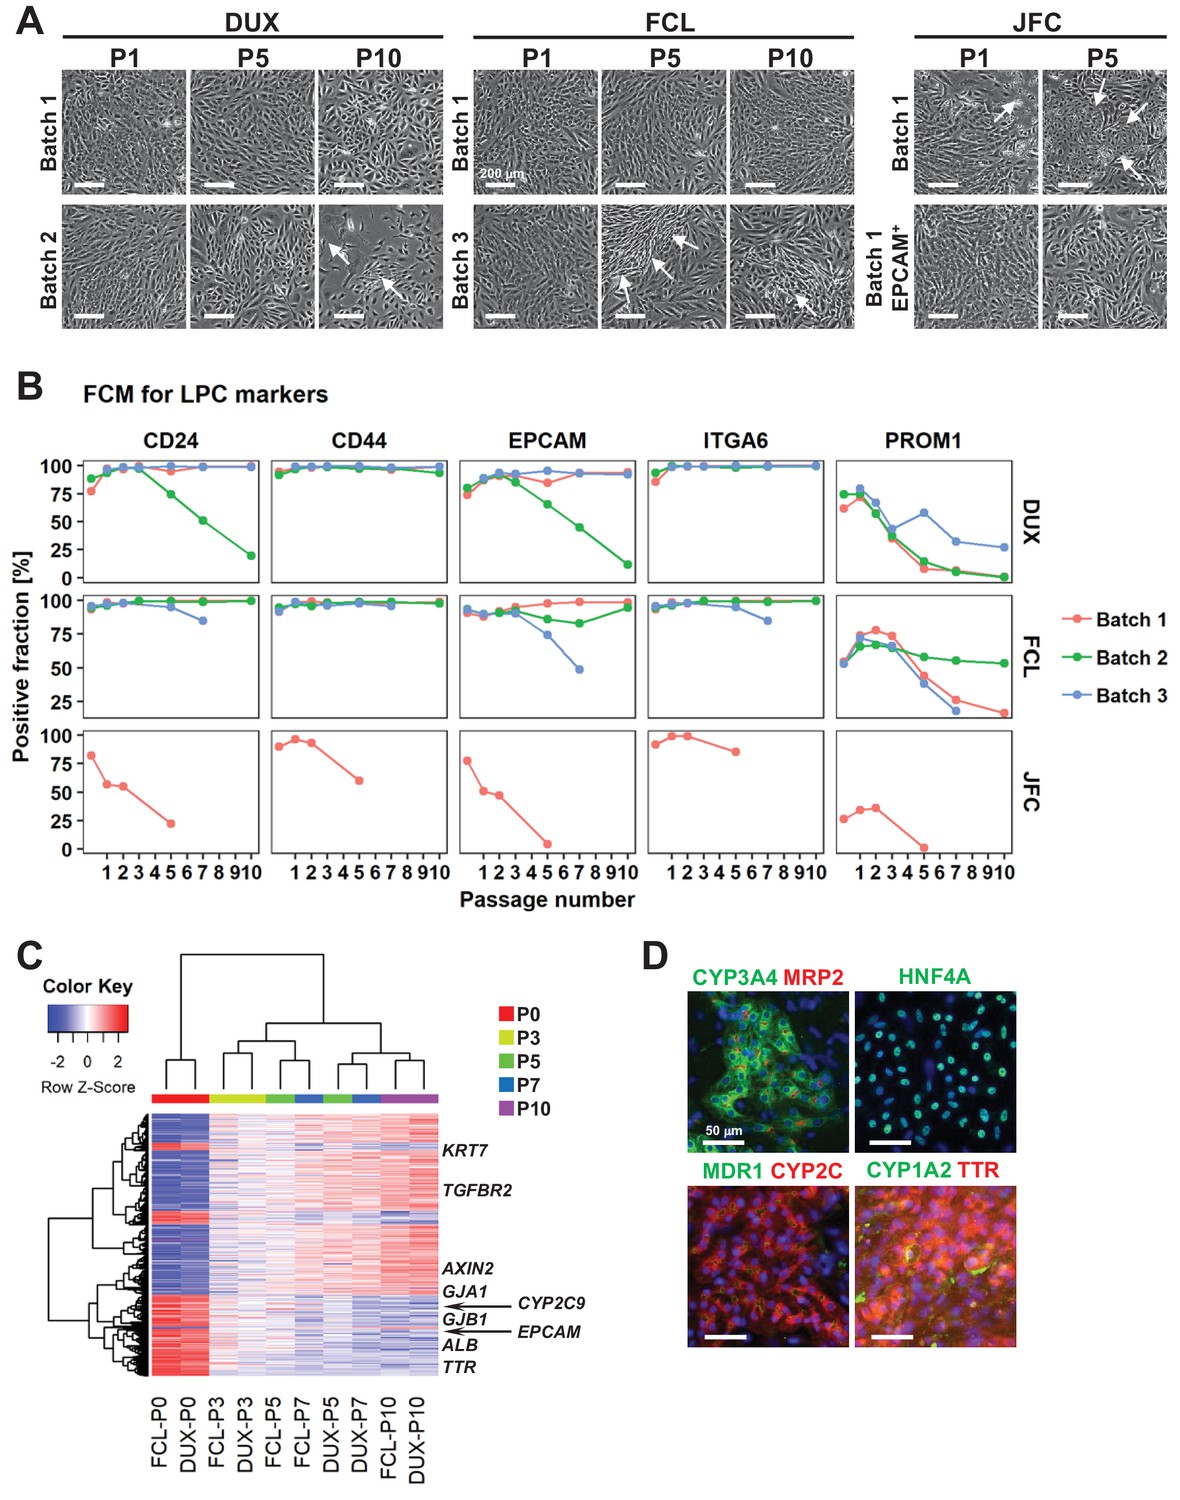
(A) Phase contrast images of hCLiPs upon serial passage. Arrows indicate cells with a fibroblast-like morphology. (B) Surface marker profiling of hCLiPs upon serial passage. Data are from three repeated experiments for cells derived from lots FCL and DUX and from one experiment for cells derived from lot JFC. (C) Hierarchical clustering based on Euclidean distance of genes that were differentially expressed between hCLiPs at P10 and those at P0. Probes were ranked by the weighted average difference method (Kadota et al., 2008), and the top 5% (2445 probes) were defined as differentially expressed genes. (D) Immunocytochemistry of hepatic function-related proteins in hCLiPs at P3 after hepatic maturation.
Figure 7 with 2 supplements

FACS is useful for enrichment of hCLiPs, but does not prevent phenotypic deterioration of the descendant cells in the subsequent culture.
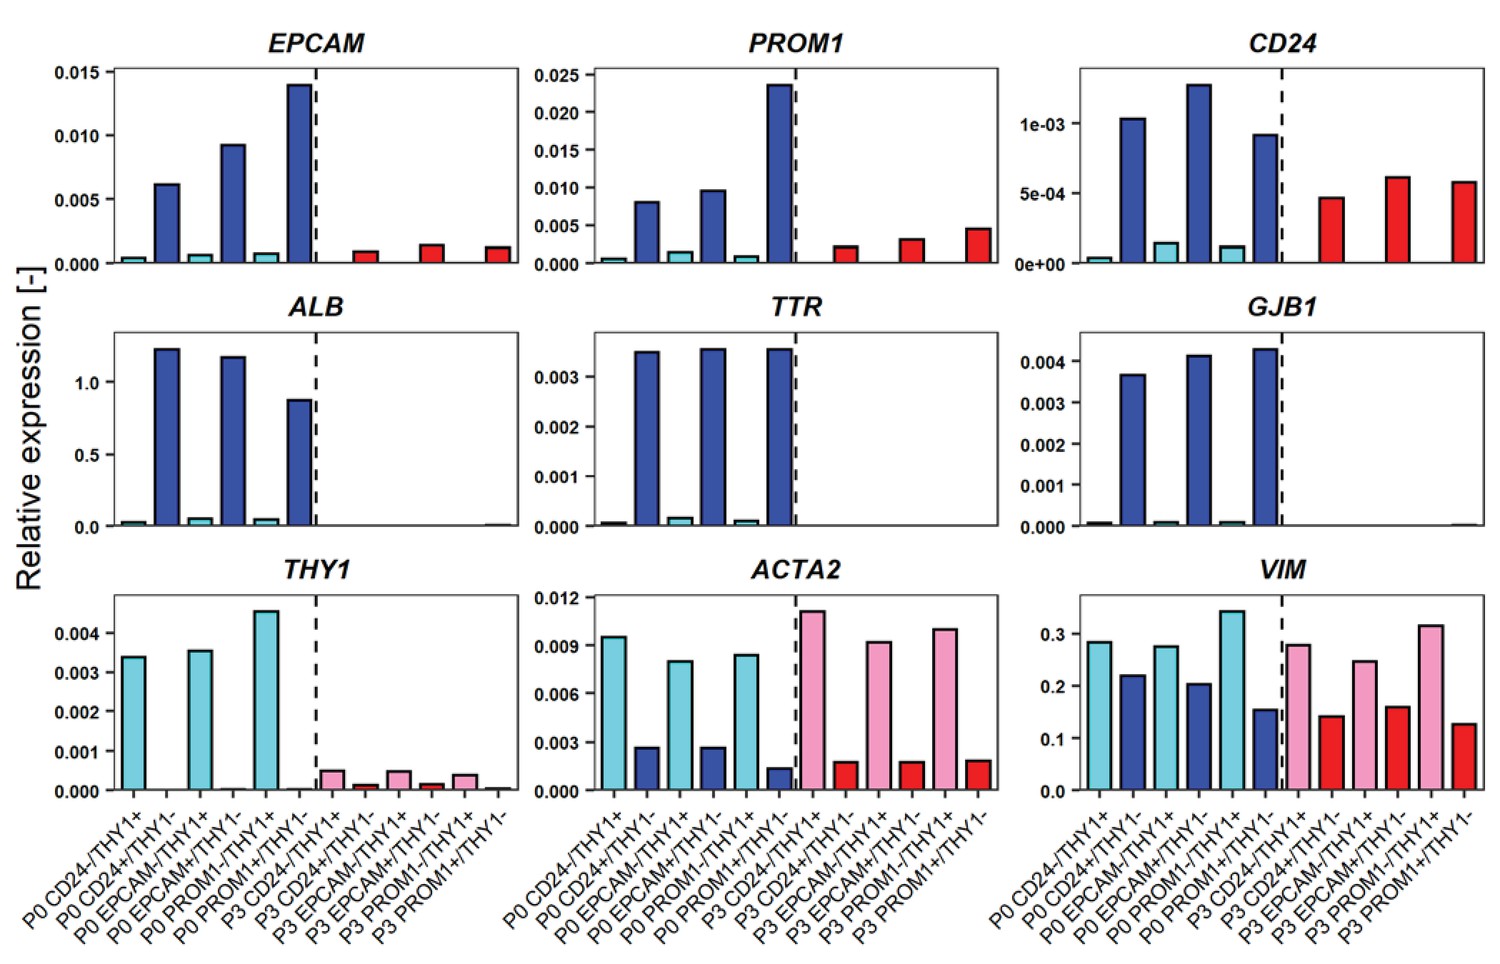
(A) Schematic representation of the experimental design for FACS of LPC marker+THY1- cells (hCLiP-enriched cells) and LPC marker-THY1+ cells (putative NPCs), and the subsequent evaluation by qRT-PCR. Results for the EPCAM/THY sorting experiments are partially shown as a representative of this study. The full result for EPCAM/THY1, PROM1/THY1 and CD24/THY1 sorting experiments are shown in Figure 5—figure supplement 1. (B) qRT-PCR was performed for the cells just after sorting using LPC markers (EPCAM, PROM1 and CD24), hepatic markers (ALB, TTR and GJB1) and fibroblast markers (THY1, ACTA1 and VIM). (C) qRT-PCR using the same gene panel as in (B) was performed for the sorted cells which were plated and subsequently cultured in the standard hCLiP culture condition for another 2 weeks. For comparison between P0 (as shown in B) and these descendant cells are shown in Figure 7—figure supplement 2.
Figure 7—figure supplement 1
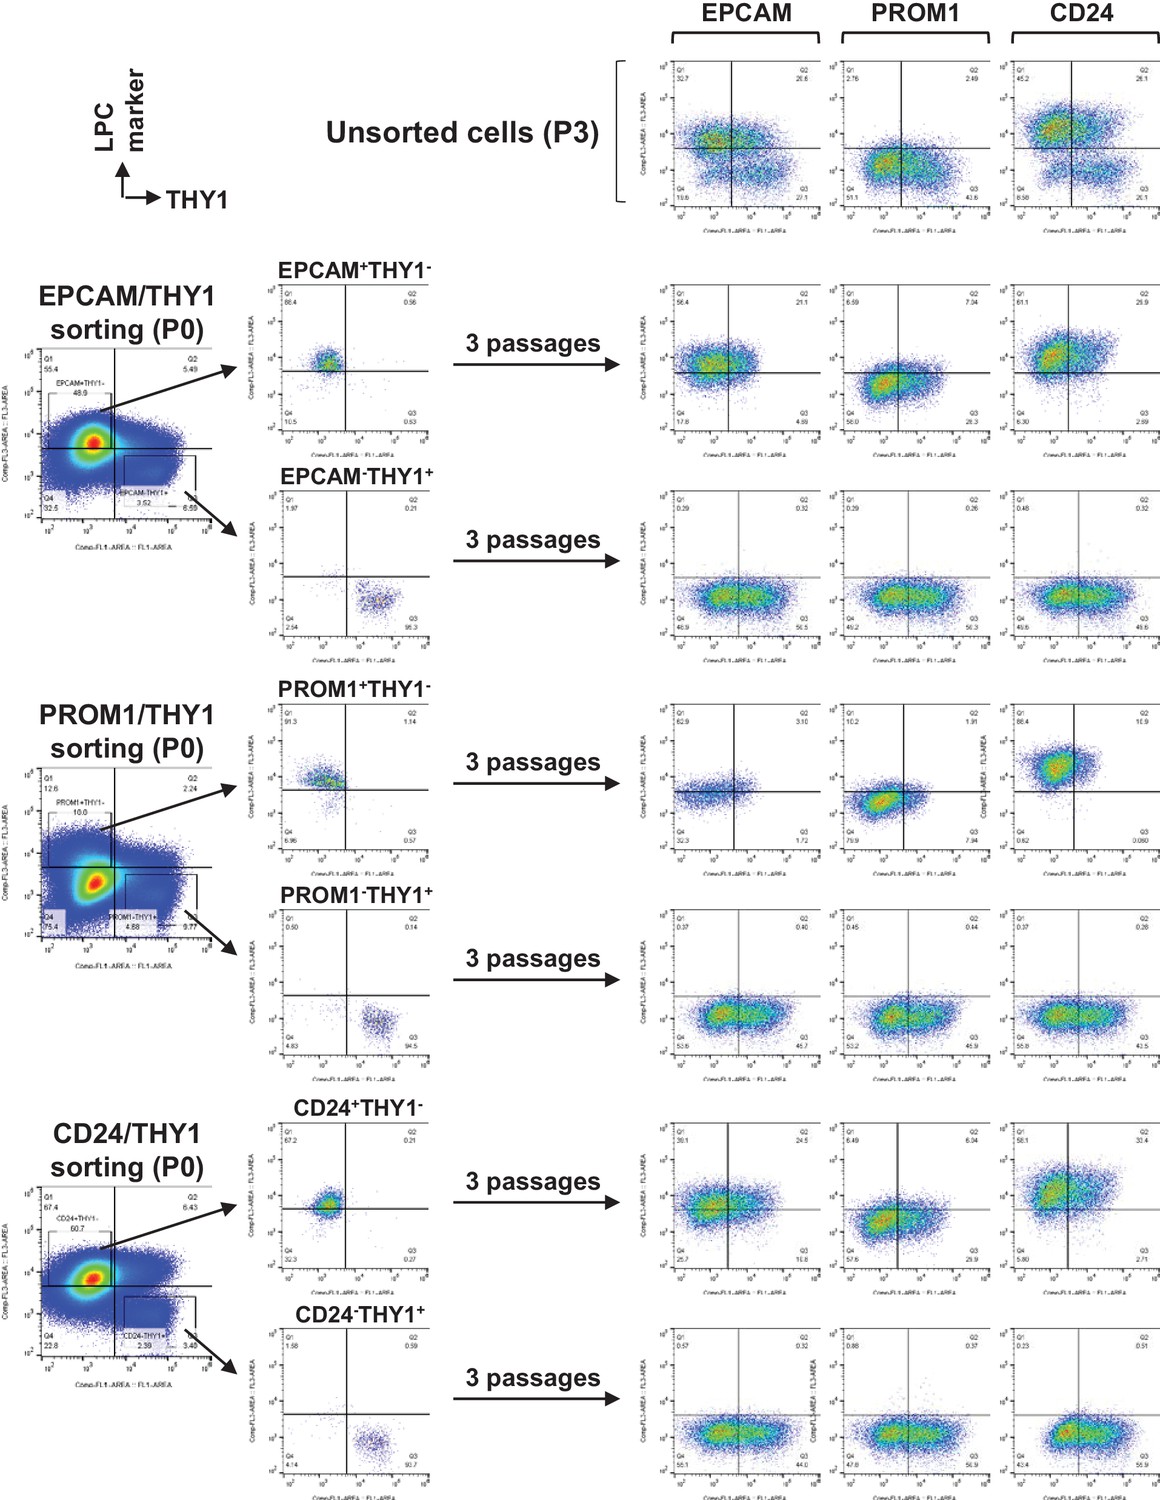
Detailed data for FACS of FCL-hCLiPs using antibodies for LPC markers and THY1.
Unsorted cells which were cultured for the same period with sorted cells are shown on the top.
Figure 7—figure supplement 2
Comparison of gene expression levels of FCL-hCLiPs just after sorting and their descendants which underwent another 2 week culture.
Figure 8 with 1 supplement
hCLiPs repopulate chronically injured mouse livers and contribute to reconstruction of the normal liver architecture.
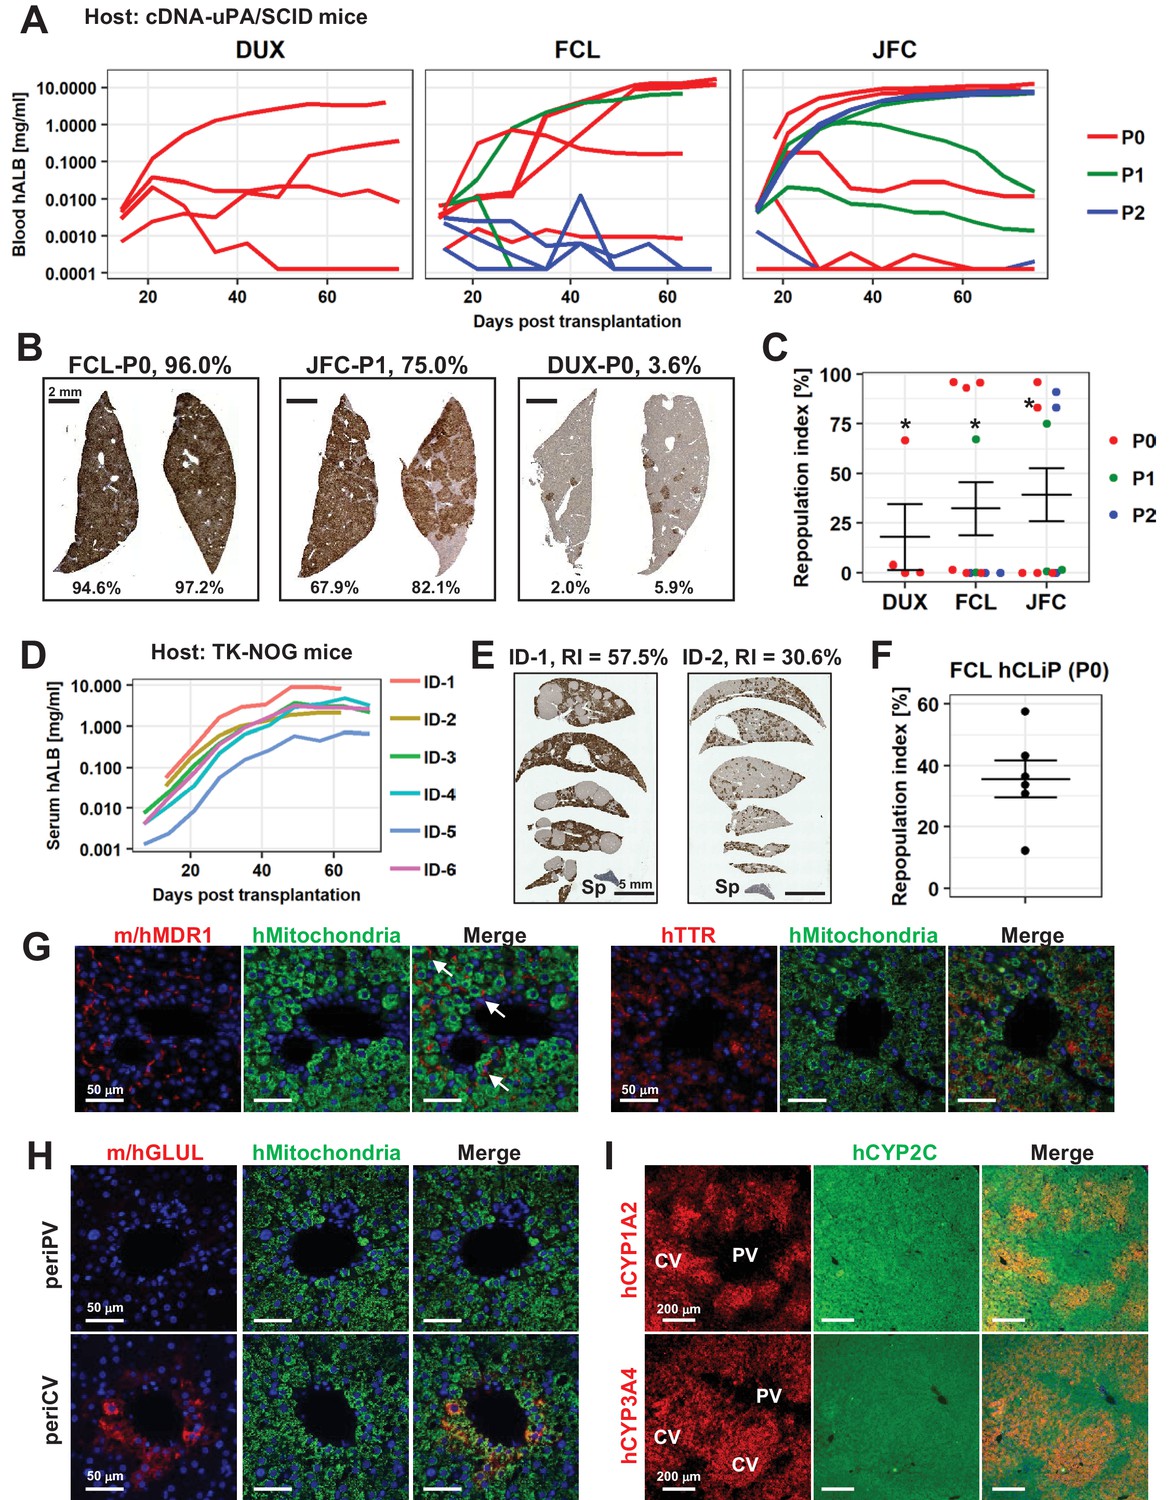
(A) hALB levels in blood of cDNA-uPA/SCID mice. Each line indicates the level in an individual mouse. Colors denote the passage number of transplanted hCLiPs. (B) Representative images of cDNA-uPA/SCID mouse livers highly (left and middle panels) and slightly (right panel) repopulated by hCLiPs. The percentages indicate RIs. (C) Distribution of RIs in livers of cDNA-uPA/SCID mice at 10–11 weeks after transplantation of hCLiPs, as assessed by IHC of CYP2C (shown in B). Colors denote the passage number of transplanted hCLiPs. RIs were calculated for samples marked by asterisks using hepatocytes isolated from chimeric livers by two-step collagenase perfusion followed by incubation with magnetic beads conjugated with a specific anti-mouse antibody (see Materials and methods for details). Bars indicate the mean ± SEM. (D) hALB levels in sera of TK-NOG mice. Each line indicates the level in an individual mouse. (E) Representative IHC of human CYP2C in TK-NOG mouse livers highly (left panel) and intermediately (right panel) repopulated by hCLiPs. The percentages indicate RIs determined based on this IHC. (F) A dot plot showing the distribution of RIs in livers of cDNA-uPA/SCID mice at 10–11 weeks after transplantation of hCLiPs. Bars indicate the mean ± SEM. (G) IHC of the hepatic function marker proteins MDR1 (left panels) and TTR (right panels). Sections were counterstained with an anti-human mitochondria antibody (green) and DAPI. Images of sections transplanted with hCLiPs derived from lot FCL are shown as representative data. (H) IHC of the zone 3-specific protein GLUL. Sections were counterstained with an anti-human mitochondria antibody (green) and DAPI. Images of sections transplanted with hCLiPs derived from lot FCL are shown as representative data. (I) IHC of the zone 3-specific CYPs CYP1A2 and CYP3A4. Sections were counterstained with an antibody against human CYP2C, which does not show strong zone specificity. Nuclei were also counterstained with DAPI in merged images. Images of sections transplanted with hCLiPs derived from lot FCL are shown as representative data. PV and CV indicate portal vein and central vein, respectively.
Figure 8—figure supplement 1
Repopulation assay of FCL-hCLiPs at later passages.
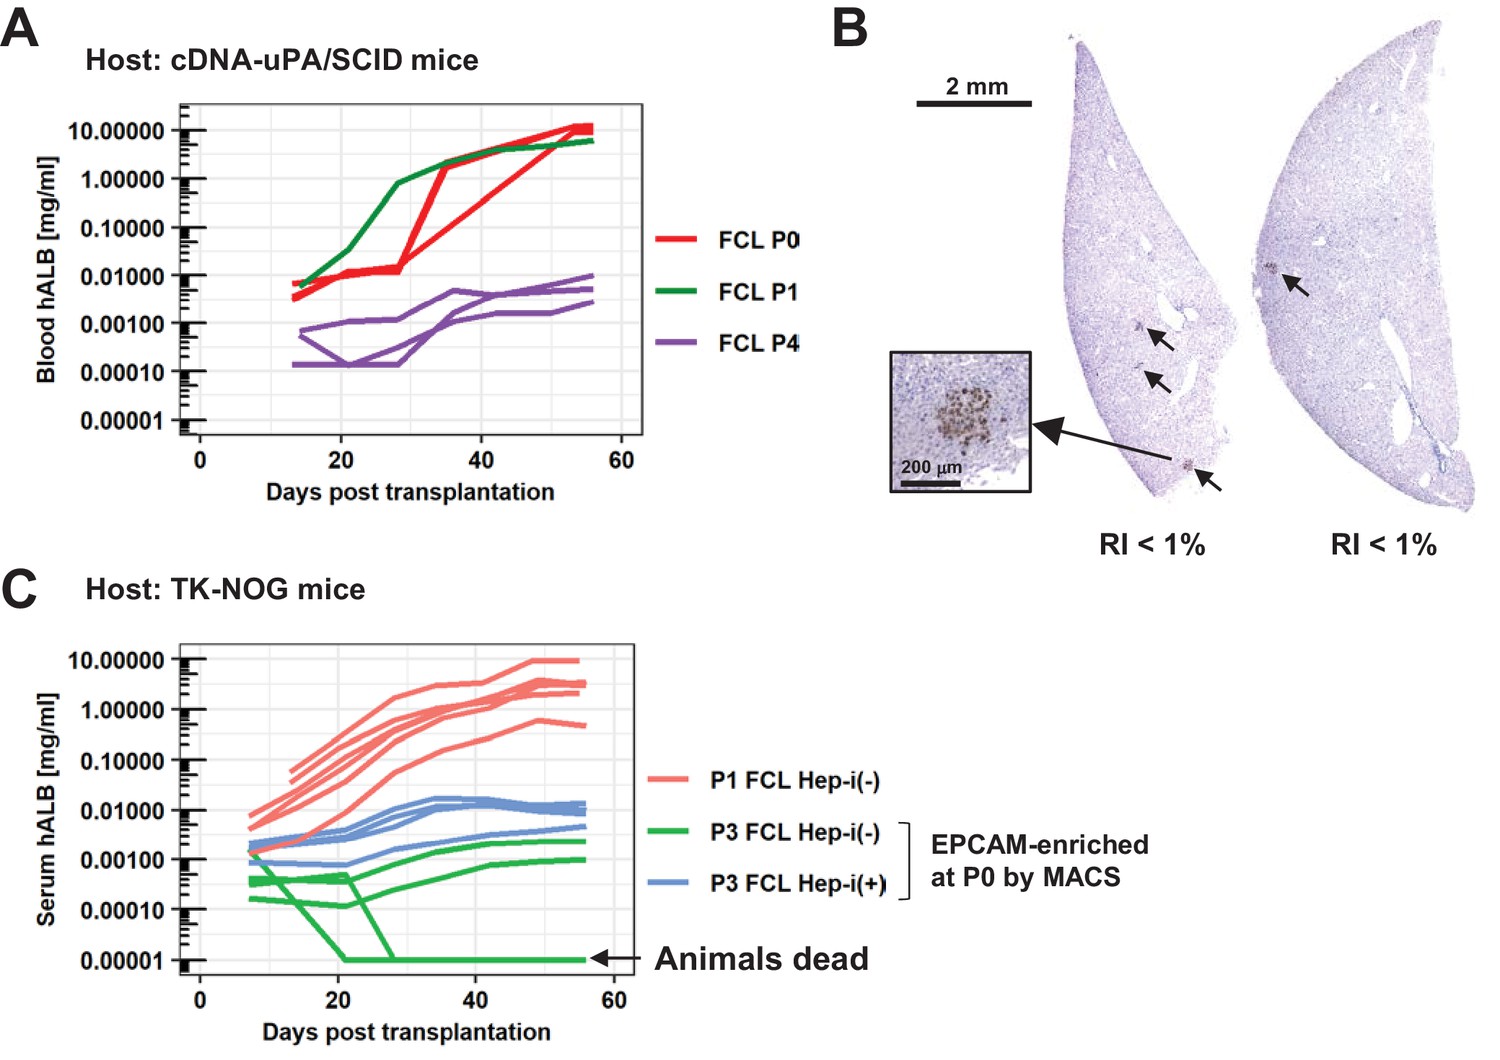
(A) Blood hALB levels in cDNA-uPA/SCID mice which were transplanted with FCL-P4-hCLiPs (purple lines). Each line indicates the level in an individual mouse. cDNA-uPA/SCID mice transplanted with FCL-P0-hCLiPs (red lines) or FCL-P1-hCLiPs (a green line), which were successfully repopulated with high RIs (>60%), are shown as reference (these data are used also in Figure 6A). (B) Representative images of cDNA-uPA/SCID mouse livers transplanted with FCL-P4-hCLiPs. The liver tissue was harvested 8 weeks after transplantation, and stained with a human-specific CYP2C antibody to estimate the RIs. (C) Serum hALB levels in TK-NOG mice which were transplanted with FCL-P3-hCLiPs with (light blue lines) or without (green lines) hepatic induction. Each line indicates the level in an individual mouse. TK-NOG mice transplanted with FCL-P0-hCLiPs (red lines) are shown as reference (these data are used also in Figure 6D).
Figure 9 with 1 supplement
Human cells isolated from chimeric livers of mice transplanted with hCLiPs have mature functions.
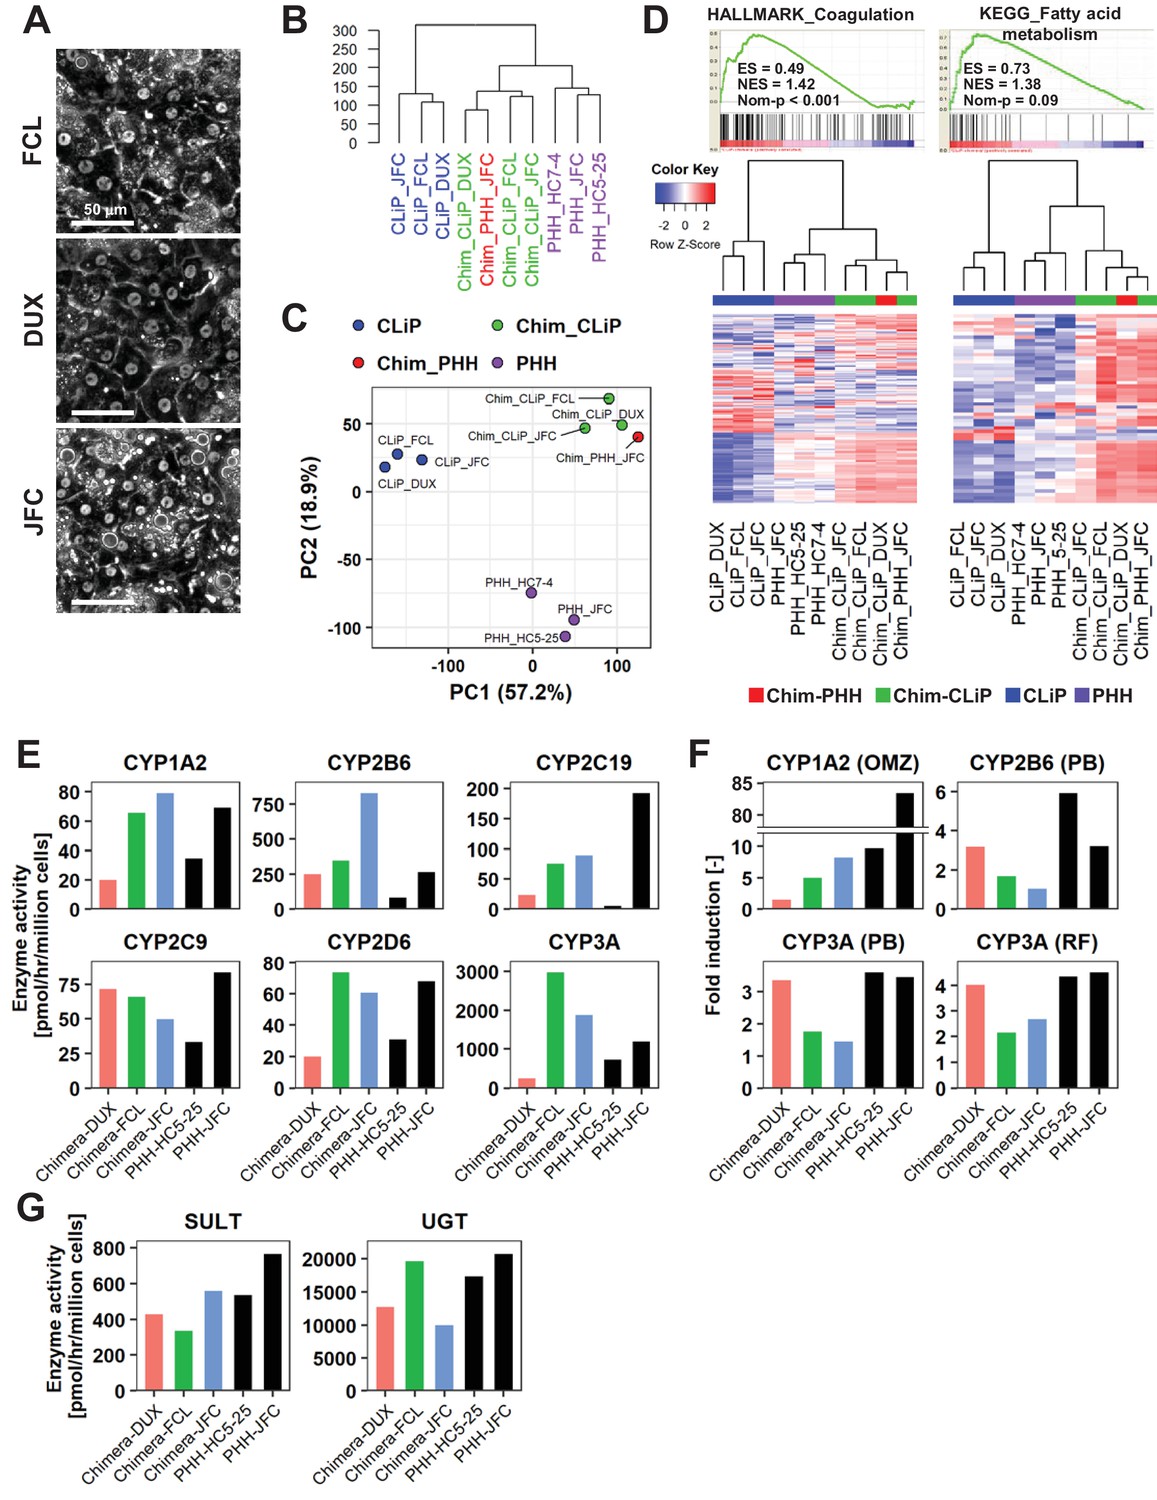
(A) Phase contrast images of human cells isolated from chimeric livers of mice transplanted with hCLiPs. (B) Hierarchical clustering based on Euclidean distance of the entire transcriptome (27,459 probes) comparing hCLiPs prior to transplantation (hCLiP), hCLiP-derived hepatocytes from chimeric livers (transplanted cells were at P1, P0, and P0 for lots FCL, DUX, and JFC, respectively), and PHHs. Data for human hepatocytes isolated from chimeric livers of mice transplanted with PHHs (lot JFC) are shown for reference. (C) PCA mapping of the samples described in (B). (D) Gene sets enriched in hCLiP-derived cells from chimeric livers in comparison with PHHs (top panels) and their corresponding heatmaps (bottom panels). Hierarchical clustering was performed based on Euclidean distance. (E) Basal enzymatic activities of major CYPs in hCLiP-derived cells from chimeric livers and PHHs, as assessed by LC-MS/MS using a cocktail of substrates. Each value is determined by one experiment with two replicate cultures. (F) Inducibility of CYP1A2, CYP2B6, and CYP3A activities. Enzymatic activities in inducer-treated cells were compared with those in cells treated with the corresponding vehicle by LC-MS/MS analysis using a cocktail of substrates. Each value is determined by one experiment with two replicate cultures. (G) Activities of the phase II enzymes UGT and SULT, as assessed by LC-MS/MS analysis using a cocktail of substrates. Each value is determined by one experiment with two replicate cultures.
Figure 9—figure supplement 1
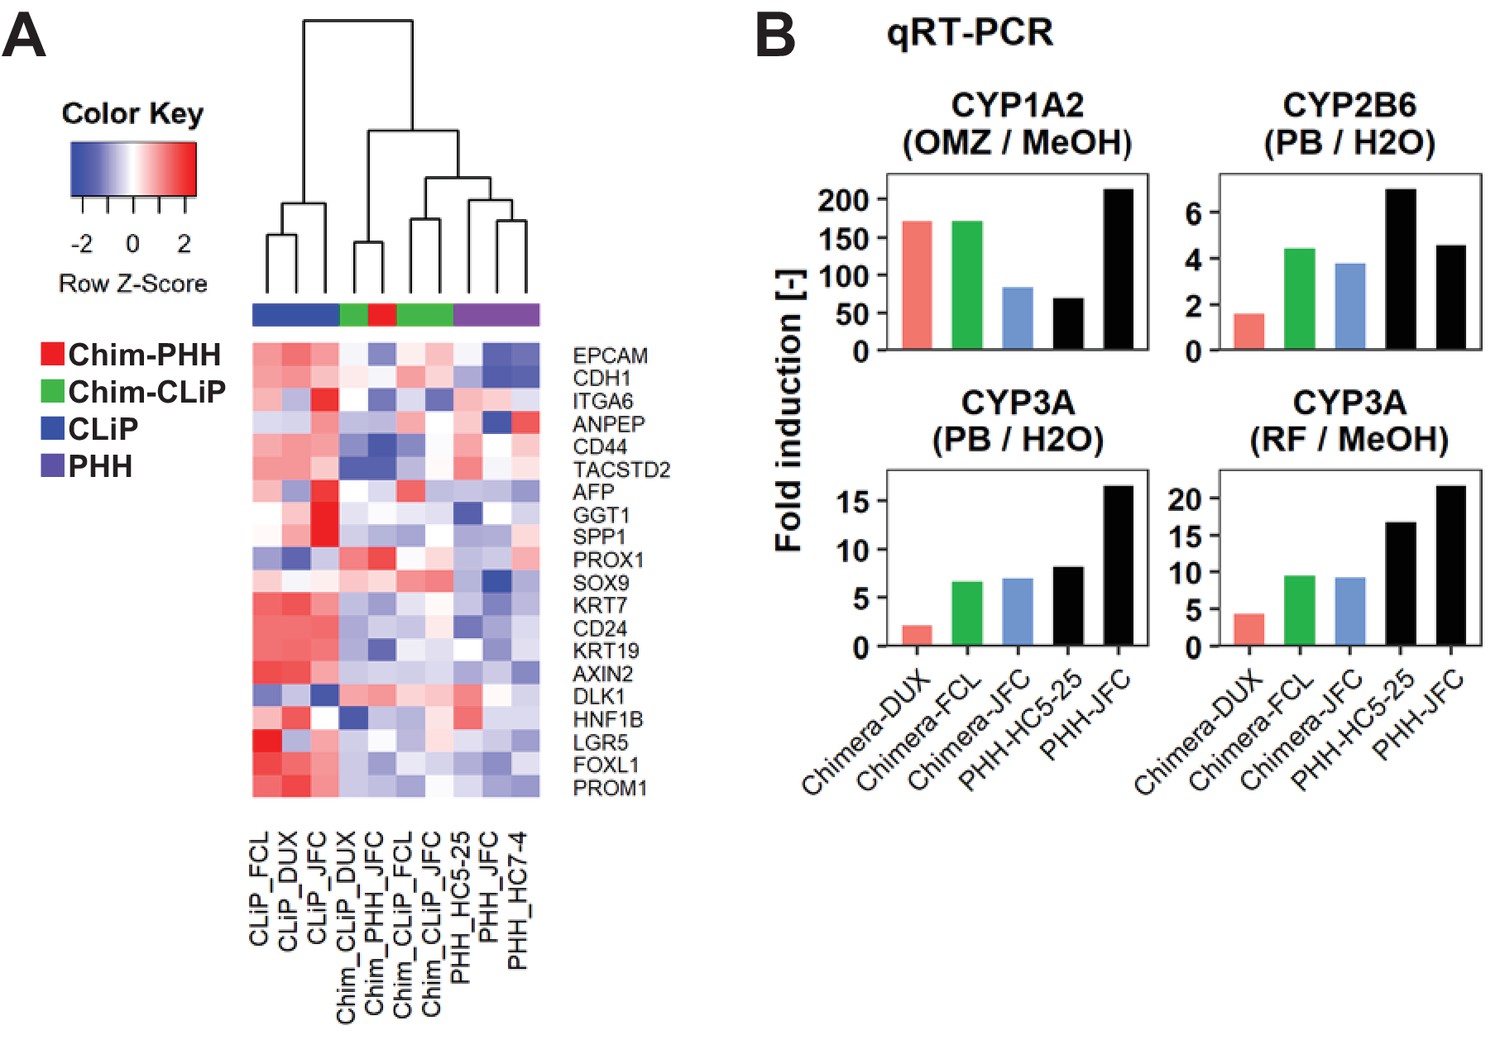
Characterization of human cells isolated from chimeric livers of mice transplanted with hCLiPs.
(A) Heatmap showing expression of BEC/LPC marker genes, as assessed by microarray analysis. Each element represents normalized (log2) expression, as indicated by the color scale. Hierarchical clustering was performed based on Euclidean distance. (B) qRT-PCR analysis of the inducibility of CYP1A2, CYP2B6, and CYP3A mRNA expression. Gene expression levels were normalized against that of ACTB. Each value is determined by one experiment with two replicate cultures. Supplementary file legends.
Author response image 1

Author response image 2
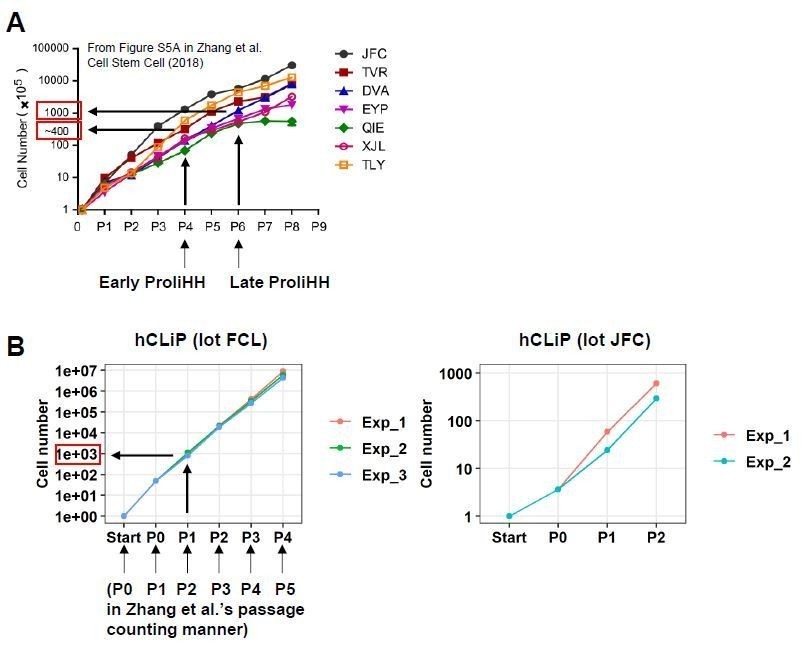
Comparison between ProliHHs and hCLiPs in terms of in vitro growth rates.
(A) According to Figure S5A in Zhang et al., 2018, Early ProliHH and Late ProliHH underwent approximately 200 and 1000 fold expansion from the starting cell number. Note that our passage counting manner is different from theirs. (B) FCL hCLiPs underwent > 40-fold expansion during primary culture (P0), approximately 1000-fold expansion at P1, and 6.4 x 10⁶-fold expansion at P4. It should be noted that our P1 cells correspond to Zhang et al.’s P6 cells in terms of fold expansion form the initial cell number.
Author response image 3
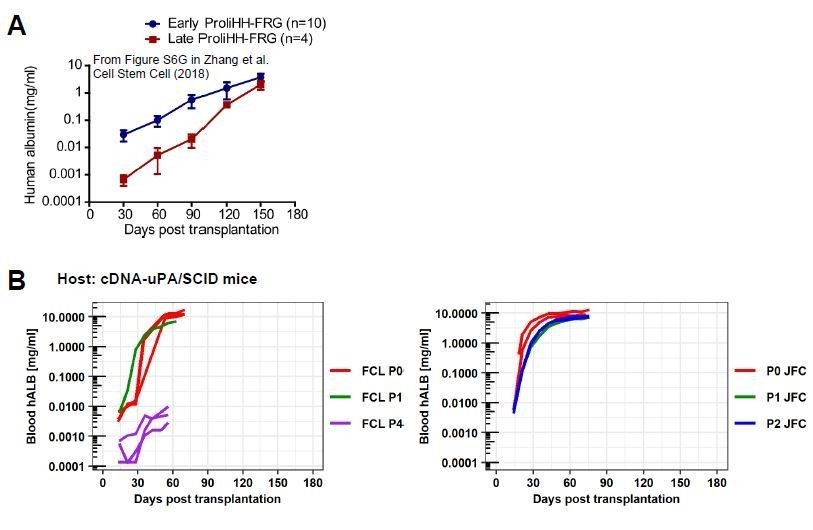
Comparison between ProliHHs and hCLiPs in terms of their repopulation efficiency.
(A)Repopulation experiments in FRG mice using ProliHHs at early (P4) and late (P6) passages. Data are adapted from Supplementary Figure S6G (Zhang et al., 2018).(B)hCLiP (lot FCL) repopulation experiment data (cDNA-uPA/SCID) at early (P0 and P1) and at late (P4) passages are adapted from Figure 6—figure supplement 1C of the present study. JFC (P0, P1, P2) blood hALB data are adapted from Figure 6A in the present study. We omitted data for individuals without substantial repopulation from hCLiPs at early passages and added extended the range of x-axis, to make the comparison with our data and Zhang et al’s data easier.
Tables
Table 1
Donor information of primary human hepatocytes (PHHs) used in this study.
| Cell type | IPHH | IPHH | IPHH | IPHH | IPHH | APHH | APHH | APHH | APHH | APHH |
|---|---|---|---|---|---|---|---|---|---|---|
| Lot | FCL | DUX | JFC | MRW | 187273 | HC7-4 | HC5-25 | HC1-14 | HC3-14 | 187271 |
| Age | 10 mo | 8 mo | 1 yr | 11 mo | 2 yr | 7 yr | 56 yr | 55 yr | 45 yr | 26 yr |
| Sex | Female | Male | Male | Male | Male | Male | Male | Male | Male | Male |
| Race | Hispanic | Caucasian | Caucasian | Caucasian | Caucasian | Caucasian | Caucasian | Caucasian | Caucasian | Caucasian |
| Cause of death | Anoxia/drowning | Anoxia/cardiovascular | Anoxia/second to blunt injury | Asphyxiation | N/A | Anoxia | Cerebrovascular Accident | Anoxia | Cerebrovascular Accident | N/A |
| CMV | - | - | - | + | N/A | + | + | - | - | N/A |
| HIV | - | - | - | - | - | - | - | - | - | - |
| HBV | - | + | + | - | - | - | - | - | - | - |
| HCV | - | - | - | - | - | - | - | - | - | - |
| EBV | - | N/A | N/A | N/A | N/A | N/A | N/A | N/A | N/A | N/A |
| RPR | - | N/A | - | - | N/A | N/A | N/A | N/A | N/A | N/A |
| HTLV | N/A | N/A | N/A | - | N/A | N/A | N/A | - | - | N/A |
-
IPH: Infant primary human hepatocyte; APH: adult primary human hepatocyte; CMV: cytomegarovirus; HIV: human immunodeficiency virus; HBV: hepatitis B virus; HCV: hepatitis C virus; EBV: Epstein-Barr virus; RPR: rapid plasma reagin; HTLV: human T-cell leukemia virus; N/A: information not available.
Additional files
-
Supplementary file 1
All the gene sets enriched in FAC cells compared with FBS cells at D14 of culture (assessed by GSEA).
- https://cdn.elifesciences.org/articles/47313/elife-47313-supp1-v3.xlsx
-
Supplementary file 2
All the gene sets enriched in FAC cells at D14 of culture compared with D1 hepatocytes (assessed by GSEA).
- https://cdn.elifesciences.org/articles/47313/elife-47313-supp2-v3.xlsx
-
Supplementary file 3
All the gene sets enriched in FBS cells at D14 of culture compared with D1 hepatocytes (assessed by GSEA).
- https://cdn.elifesciences.org/articles/47313/elife-47313-supp3-v3.xlsx
-
Supplementary file 4
Significantly enriched gene sets (Nom p<0.05) in Hep-i(+) cells compared with Hep-i(-) cells (assessed by GSEA).
- https://cdn.elifesciences.org/articles/47313/elife-47313-supp4-v3.xlsx
-
Supplementary file 5
Significantly enriched gene sets (Nom p<0.05) in Hep-i(-) cells compared with Hep-i(+) cells (assessed by GSEA).
- https://cdn.elifesciences.org/articles/47313/elife-47313-supp5-v3.xlsx
-
Supplementary file 6
Significantly enriched (NOM p<0.05) gene sets in hCLiP-chimera-derived hepatocytes in comparison with PHHs.
- https://cdn.elifesciences.org/articles/47313/elife-47313-supp6-v3.xlsx
-
Transparent reporting form
- https://cdn.elifesciences.org/articles/47313/elife-47313-transrepform-v3.docx
Download links
A two-part list of links to download the article, or parts of the article, in various formats.
Downloads (link to download the article as PDF)
Open citations (links to open the citations from this article in various online reference manager services)
Cite this article (links to download the citations from this article in formats compatible with various reference manager tools)
Generation of human hepatic progenitor cells with regenerative and metabolic capacities from primary hepatocytes
eLife 8:e47313.
https://doi.org/10.7554/eLife.47313


