A distinct cardiopharyngeal mesoderm genetic hierarchy establishes antero-posterior patterning of esophagus striated muscle
- Institut Pasteur, France
- CNRS UMR 3738, France
- CNRS/MNHN UMR 7221, Muséum national d’Histoire naturelle, France
- National Institutes of Health, United States
- University of Utah, United States
- University of Helsinki, Finland
Figures
Figure 1 with 1 supplement
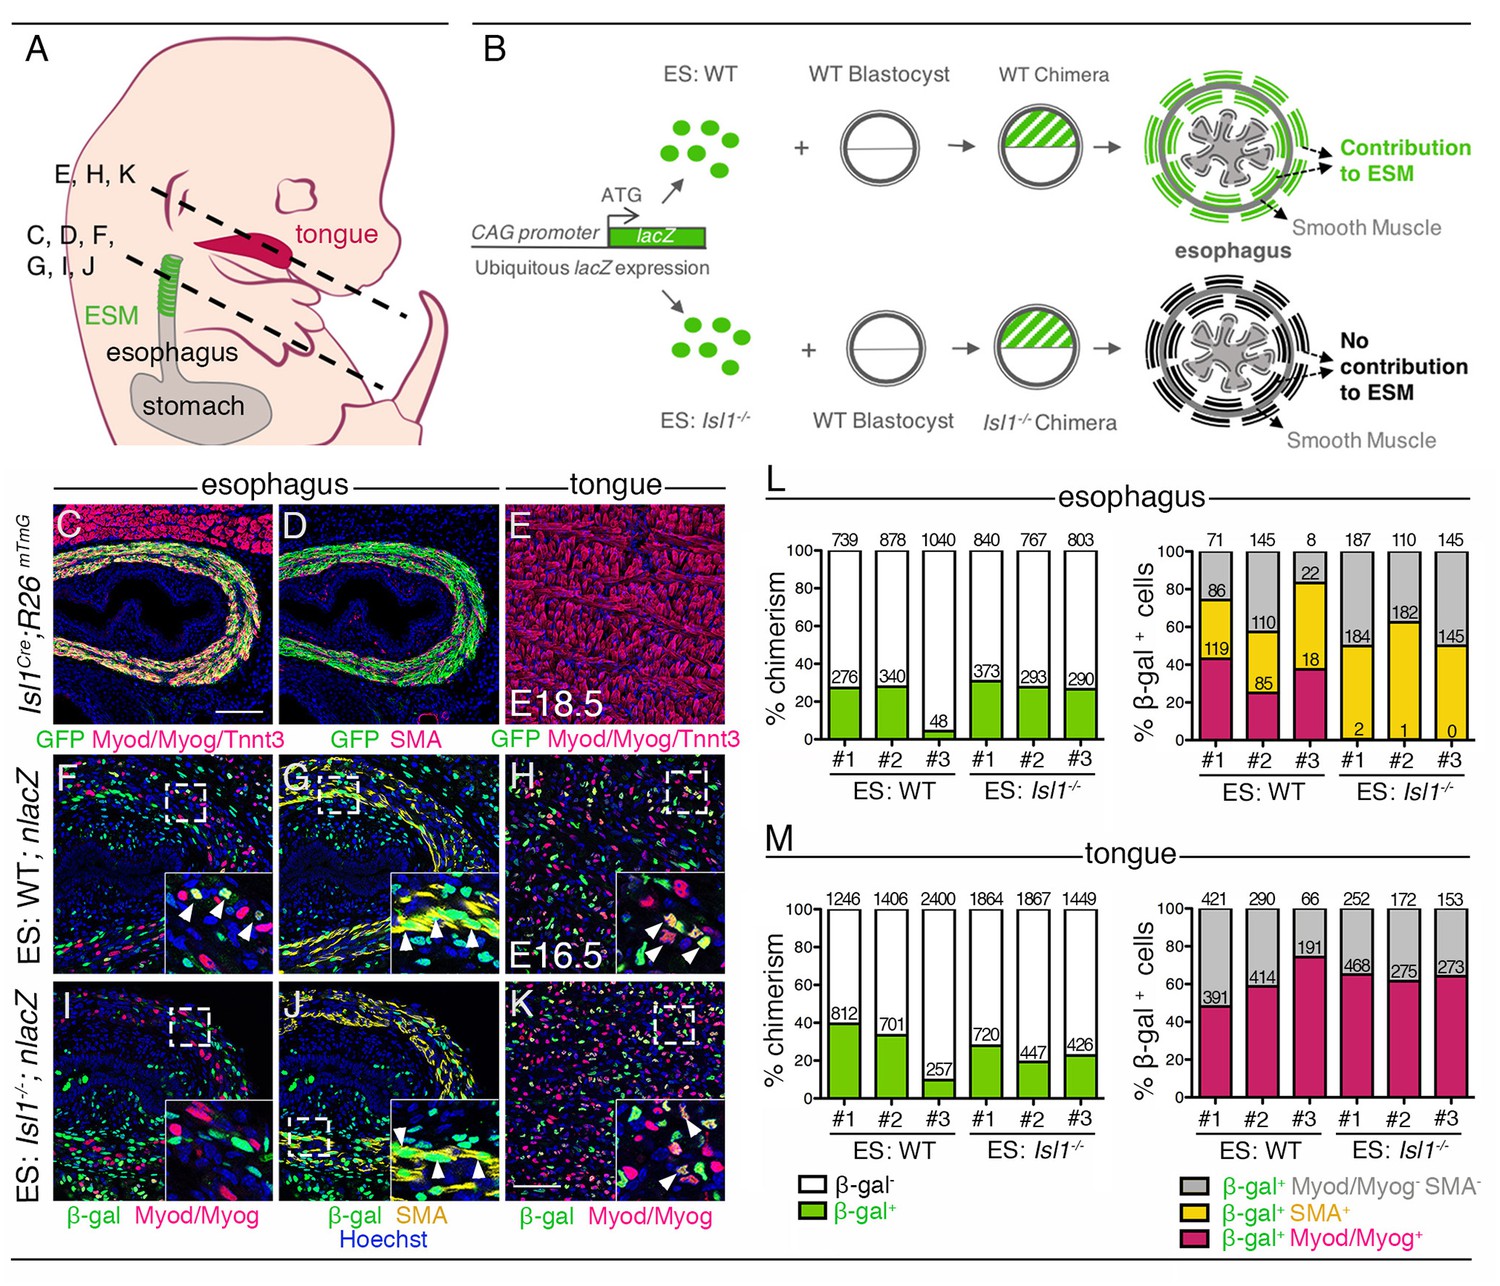
Cell-autonomous role of Isl1 in esophagus myogenic progenitors.
(A) Structures and levels analyzed in the study. (B) Schematic summary of the chimera experiment. (C–E) Immunostainings on transverse cryosections of a E18.5 Isl1Cre;R26mTmG fetus for the GFP reporter, Myod/Myog/Tnnt3 (myogenic markers) and SMA (smooth muscle actin) in the esophagus and tongue. Note that Isl1-derivatives include the esophagus striated muscle but not the esophagus smooth muscle layers and tongue muscle (n = 2). (F–K) Immunostainings on transverse cryosections of E16.5 WT (ES: WT;nlacZ) and Isl1-/- (ES: Isl1-/-;nlacZ) chimeras for the β-gal reporter, Myod/Myog (myogenic markers) and SMA (smooth muscle actin) in the esophagus and tongue (n = 3 each condition). Insets (bottom, right), higher magnifications. White arrowheads indicate examples of β-gal colocalization with SMA or Myod/Myog. (L–M) Percentage of chimerism and of β-gal+ cell contribution to the indicated populations in the esophagus and tongue of WT (ES: WT) and Isl1-/- (ES: Isl1-/-) chimeras (n = 3 each condition, #1–3; three different section levels scored). The total number of cells counted on three different section levels are reported in columns. Note that the Isl1-/- ES-derived cells do not form ESM progenitors but contribute to both esophagus smooth muscle layers and tongue. Scale bars: C, 100 µm; K, 50 µm.
Figure 1—figure supplement 1

Isl1nlacZ/+ cells colonize the esophagus of chimeric Tbx1 mutants.
(A) Structures and levels analyzed in the study. (B) Schematic summary of the chimera experiment. (C–C’’) Macroscopic views of E14.5/E15.5 Isl1nlacZ/+ ES cell-derived chimeric embryos (C, Tbx1 wildtype host; C’, Tbx1 heterozygote mutant host; C’’, Tbx1 homozygote knockout host). A black arrowhead indicates a normal and a white arrowhead a reduced or absent outer ear pinna. Chimeras of Tbx1-/- host are generally edemic (C’’, asterisk). (D–E) X-gal staining of dissected digestive tracks including the heart and thymus glands. A black arrowhead indicates normal (D, D’) and a white arrowhead absent thymus glands (D’’). (E–E’’) Dorsal views of the esophagus (dotted lines). Isl1nlacZ/+ ES contribute extensively to wild type (E) and heterozygote (E’) chimeric embryos, while they contribute to different extent in Tbx1-/- hosts (E’’). A black arrowhead in E-E’’ indicates the most caudal level to which Isl1nlacZ/+ ES contribute. (F–G) Immunostainings on transverse cryosections at the esophagus level of E14.5/E15.5 Isl1nlacZ/+ ES cell-derived chimeric embryos for Tuj1 (neurons), SMA (smooth muscle actin) and β-gal (Isl1-expressing cells). β-gal+ cells are present in the smooth muscle scaffold and contribute to Tnnt3+ fibers in both control (F’, F”) and Tbx1-/- hosts (G’, G”). (H–J) Quantitative analysis (violin plots) of the number of β-gal+ cells per section in present in the smooth muscle scaffold (H), the Tnnt3+ Area per section (I) and ratio of β-gal+ cells per muscle area per section (J) in chimeras derived from heterozygote (n = 4) and Tbx1 mutant hosts (n = 4). Dots, quantification on individual sections (10 sections/condition). p=p value of Mann-Whitney test. Center lines show the medians; box limits indicate the 25th and 75th percentiles as determined by R software. ep, ear pinna; esm, esophagus striated muscle; h, heart; pc, pharyngeal constrictor; tg, thymus glands. Scale bars: B,C, 500 μm; D, 40 μm, D’, 20 μm. Scale bars: D,E, 500 μm; F, 40 μm, F’, 20 μm.
Figure 2 with 2 supplements
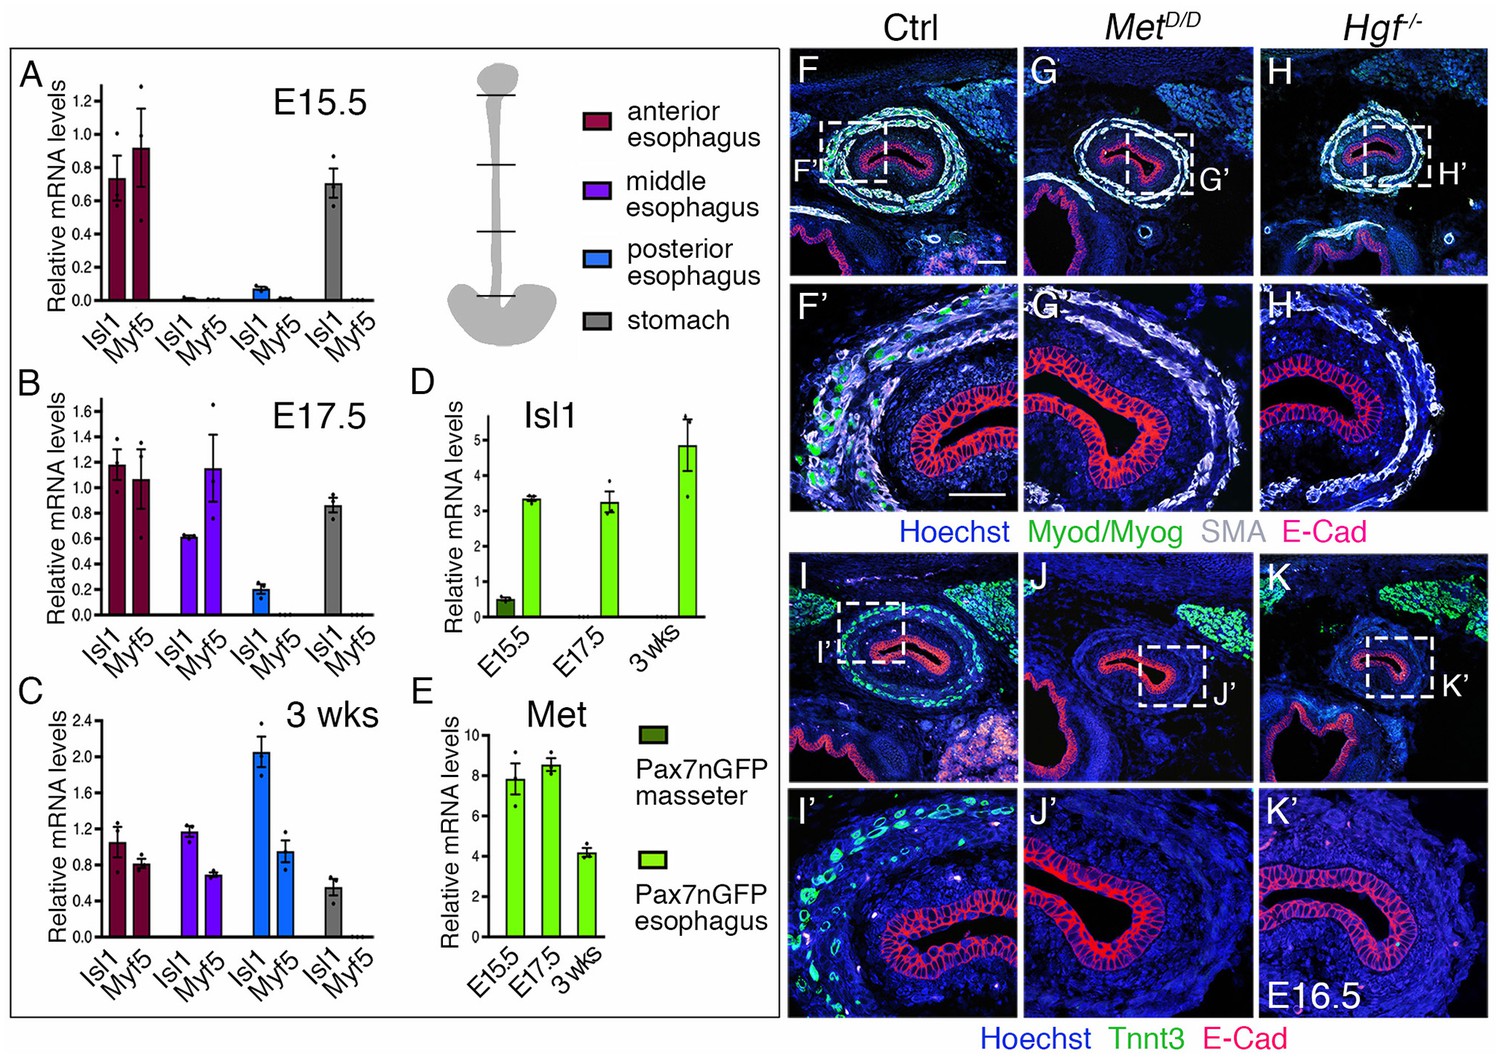
Regulation of esophagus striated muscle patterning involves MET/HGF signaling.
(A–C) RT-qPCR analysis for Isl1 and Myf5 at E15.5 (A), E17.5 (B) and 3 weeks postnatal (C) in different esophagus portions and stomach as indicated in the schematic view (top, right). The low level of Isl1 expression in the posterior esophagus at fetal stages might reflect contamination from the stomach at the esophagus interface (n = 3 each condition). (D–E) RT-qPCR analysis for Isl1 and Met at E15.5, E17.5 and 3 weeks postnatal in Tg:Pax7-nGFP+ cells isolated by FACS from the masseter or esophagus. All data points are plotted and presented as the mean ± SEM (error bars) (n = 3 each condition). (F–H) Immunostainings on transverse cryosections of E16.5 control, MetD/D and Hgf-/- fetuses for Myod/Myog (myogenic progenitors) and SMA (smooth muscle actin). E-Cad labels the esophagus lumen epithelium. Higher magnifications are shown in (F’–H’) (n = 3 each condition). (I–K) Immunostainings on transverse cryosections of E16.5 control, MetD/D and Hgf-/- fetuses for Tnnt3 (myofiber marker) and E-Cad. Higher magnifications are shown in (I’–K’). Note the absence of ESM formation in both Met and Hgf mutants (n = 3 each condition). Scale bars: F, 100 µm; F’, 50 µm.
Figure 2—figure supplement 1
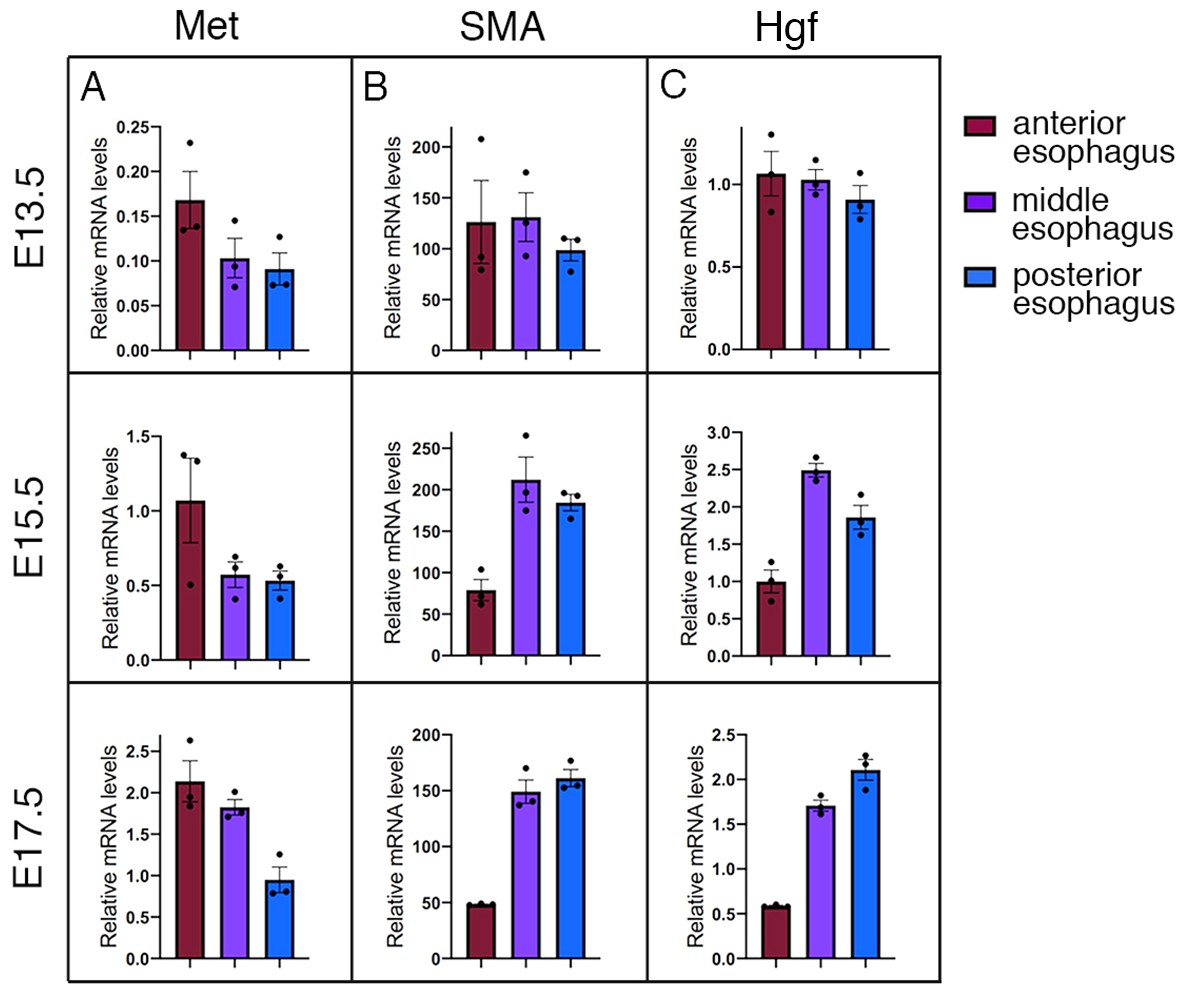
Met and Hgf expression along the developing esophagus.
(A–C) RT-qPCR analysis for Met (A), SMA (B) and Hgf (C) at E13.5, E15.5 and E17.5 in different color-coded esophagus portions (top, right). TBP transcript levels were used for normalization of each target (2ΔCT). All data points are plotted and presented as the mean ± SEM (error bars) (n = 3 each condition).
Figure 2—figure supplement 2
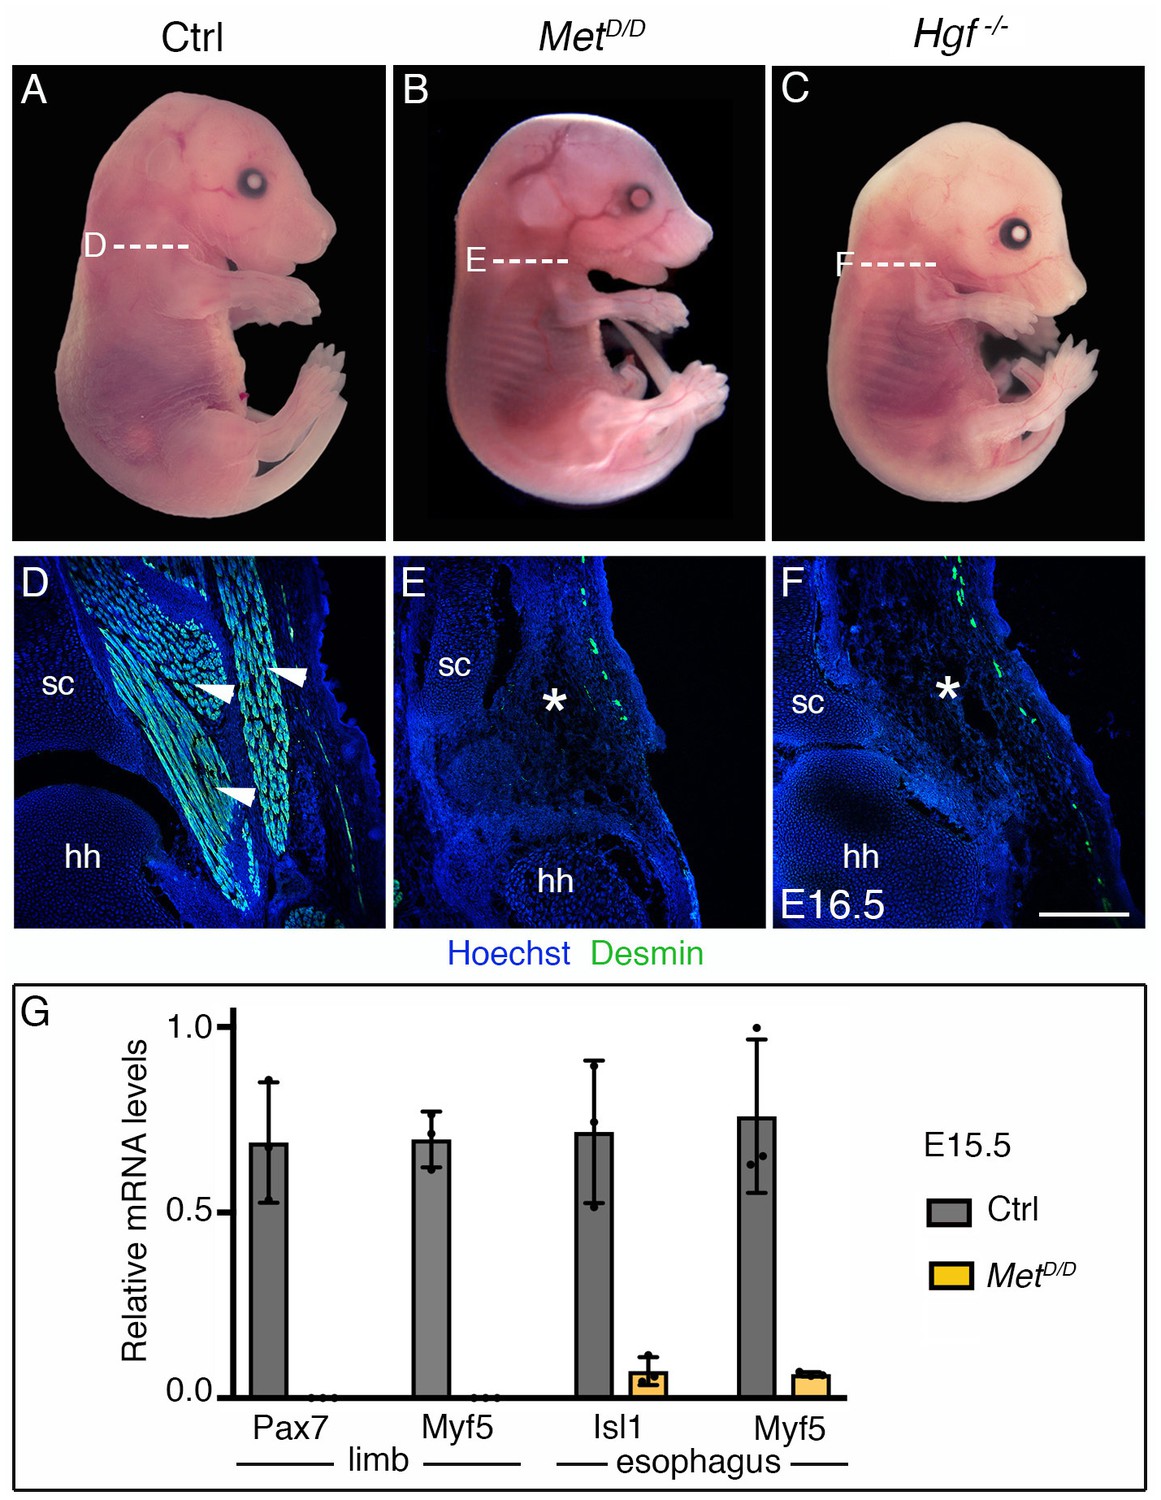
Phenotype of Met and Hgf mutants.
(A–C) Macroscopic view of E16.5 control, MetD/D and Hgf-/- fetuses. (D–F) Immunostainings on transverse cryosections at levels indicated in (A–C) for the myogenic marker Desmin. Note the absence of limb musculature in Met and Hgf mutants (white asterisks) (n = 3 each condition). (G) RT-qPCR analysis for Pax7 and Myf5 in limbs and for Isl1 and Myf5 in esophagi of E15.5 control and MetD/D fetuses. All data points are plotted and presented as the mean ± SEM (error bars) (n = 3 each condition). hh, humeral head; sc, scapula. Scale bars: A, 1000 µm; D, 200 µm.
Figure 3 with 1 supplement
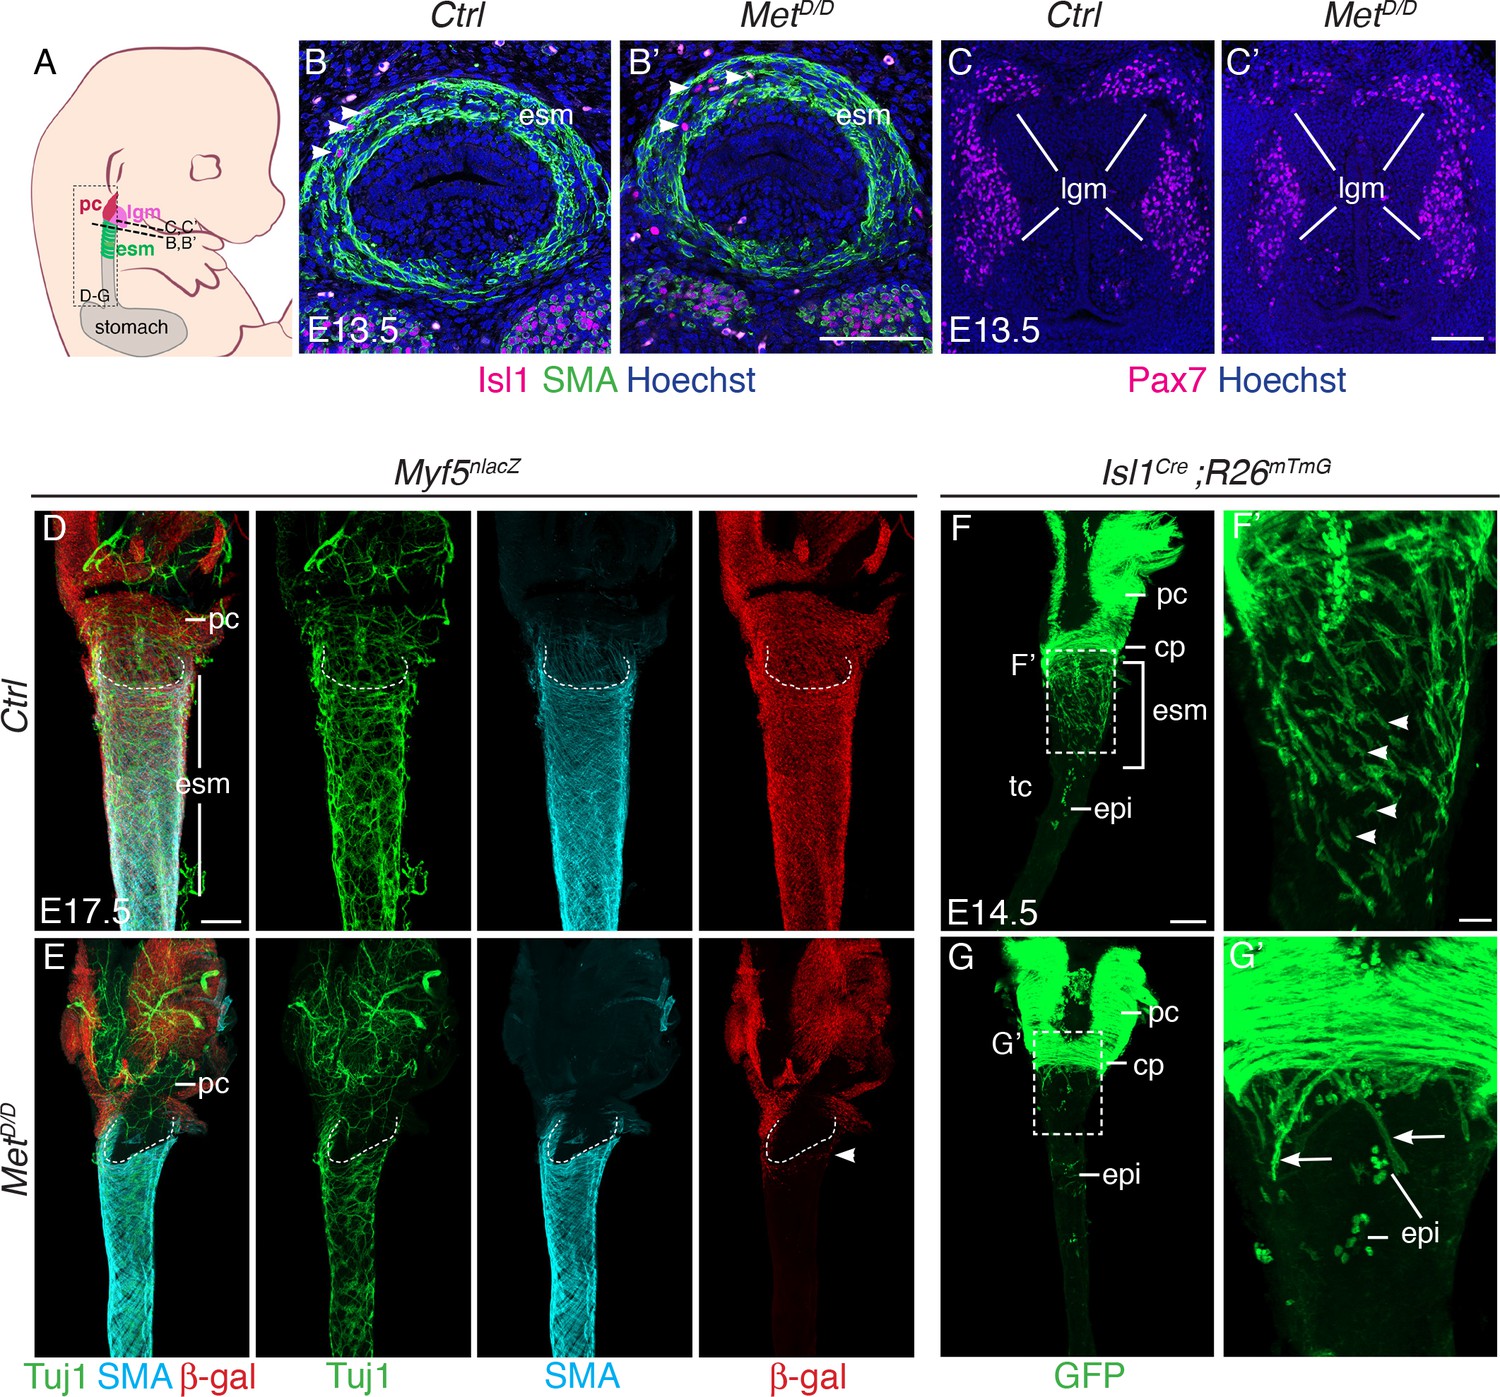
Isl1 progenitors are present anteriorly in the esophagus of MetD/D mutants.
(A) Structures and levels analyzed in the study. (B,B’) Immunostainings on transverse cryosections of E13.5 control and MetD/D embryos for Isl1 expressing progenitors (white arrowheads) and smooth muscle cells (SMA) in the esophagus (n = 2). (C,C’) Immunostainings on transverse cryosections at the laryngeal level of E13.5 control and MetD/D embryos for Pax7 (n = 2). (D–G) Whole mount immunostaining of the upper esophagus of Met mutant and control embryos. (D,E) Ventral views of E17.5 esophagi stained for Tuj1 (neurons), SMA (smooth muscle actin) and β-gal (Myf5nlacZ reporter positive progenitors). White-dotted lines outline the shape of the esophagus entry. White arrowheads point to Myf5nlacZ/+ progenitor cells present in the upper esophagus in the mutant. (F,G) Dorsal views of E14.5 stained for GFP (Isl1 lineage tracing). Isl1-derived muscle progenitors remain largely as mononucleated cells in the control (F,F’, white arrowheads) while GFP+ fibers are mostly seen in the anterior esophagus of the mutant (G,G’, arrows) (n = 2 each condition). cp, cricopharyngeous muscle; epi, epithelial Isl1-derived cells; esm, esophagus striated muscle; lgm, laryngeal muscles; pc, pharyngeal constrictor. Scale bars: B’, C’, F’, 50 µm; D, F, 200 µm.
Figure 3—figure supplement 1
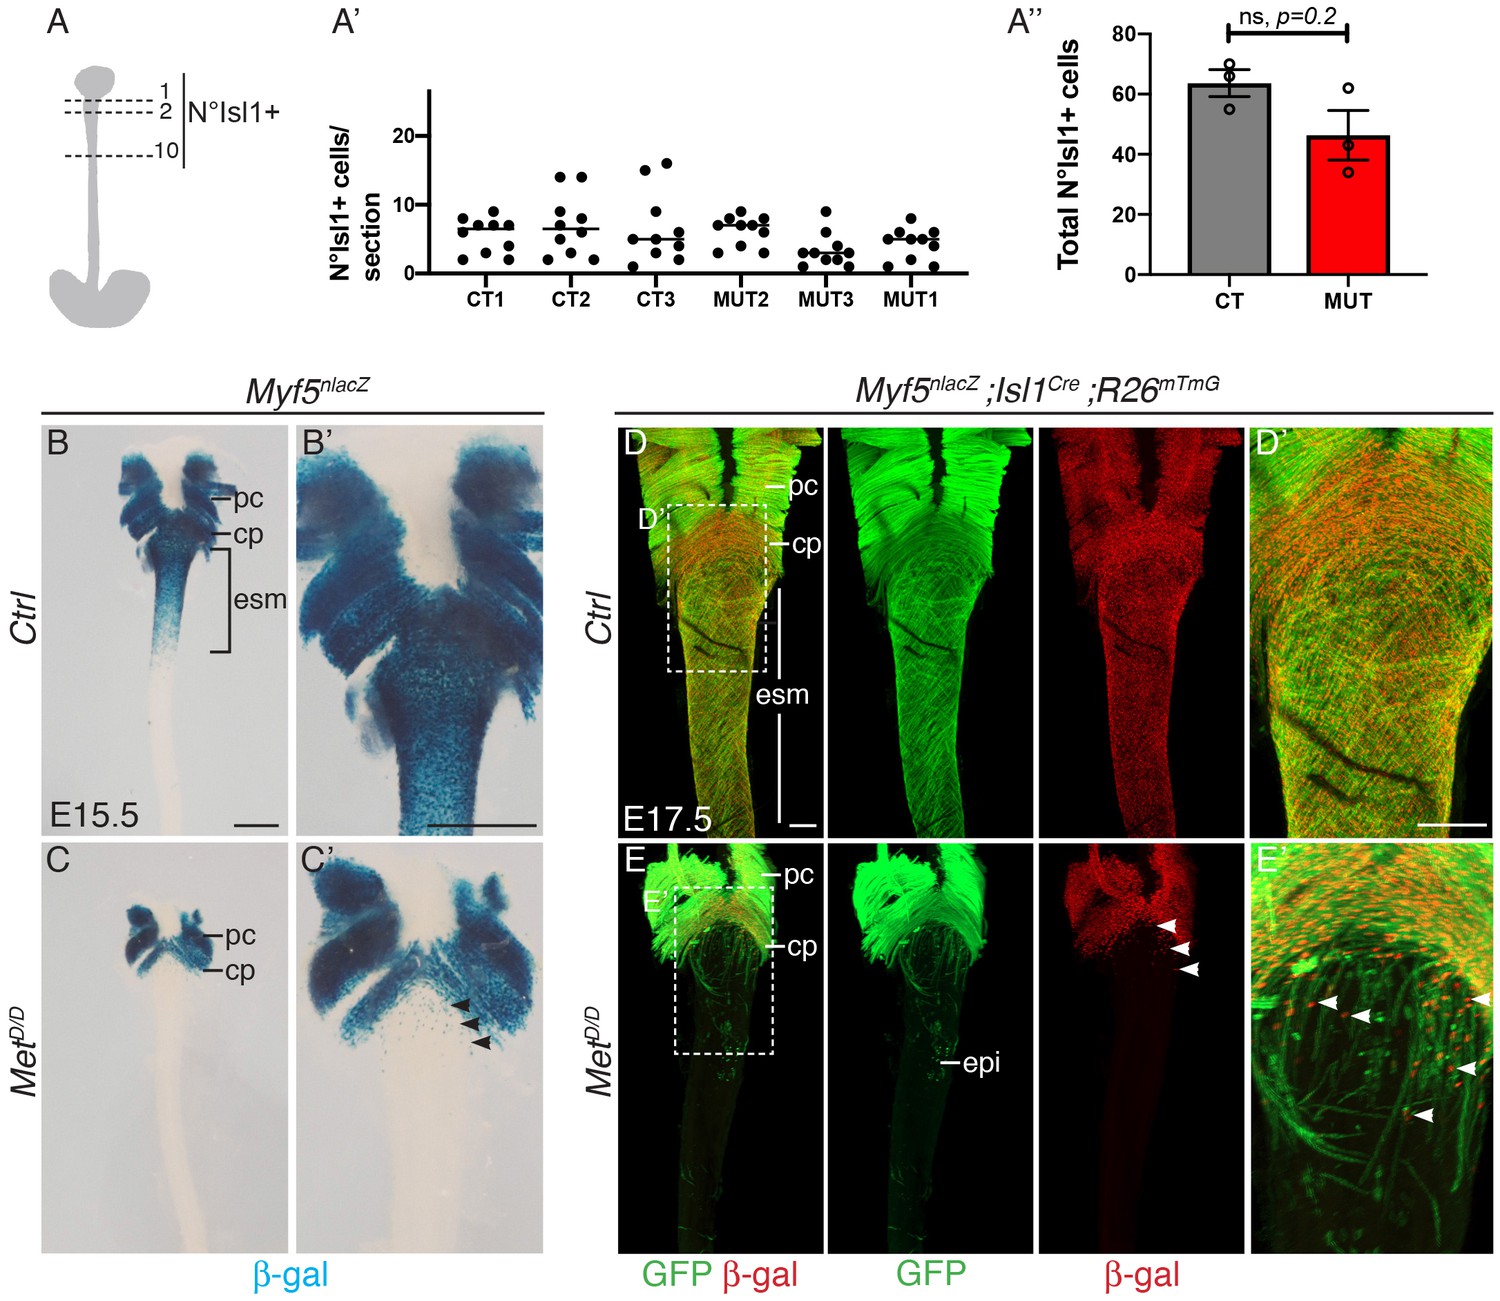
Myogenic cells are present anteriorly in the esophagus of MetD/D mutants.
(A–A’’) Quantification of Isl1+ progenitors in E13.5 control and Met mutant embryos in the anteriormost esophagus (n = 3 each condition). (A) Isl1+ cells were counted on the top ten consecutives esophagus sections. (A’) Individual number of Isl1+ cells per section level and per embryo. (A’’) Total number of Isl1+ cells per embryo. No significant difference was observed between control and Met mutants. Mean ± SEM, Mann-Whitney test. (B–C) Whole mount X-gal staining of the upper esophagus of E15.5 Met mutant and control embryos (dorsal view). (B’–C’) Higher magnification views of the images in (B–C). Black arrowheads point to Myf5+ progenitor cells present in the upper esophagus in the mutant (n = 2 each condition). (D–E) Whole mount immunostaining of the upper esophagus of E17.5 Met mutant and control embryos (dorsal views) stained for β-gal (Myf5 progenitors) and GFP (Isl1 lineage tracing). Myf5+ progenitor cells are present in the anteriormost esophagus of the mutant (E, E’, white arrowheads) (n = 2 each condition). cp, cricopharyngeous; epi, epithelial Isl1-derived cells; esm, esophagus striated muscle; pc, pharyngeal constrictor. Scale bars: B, B’, 500 μm; D, D’ 200 μm.
Figure 4 with 4 supplements
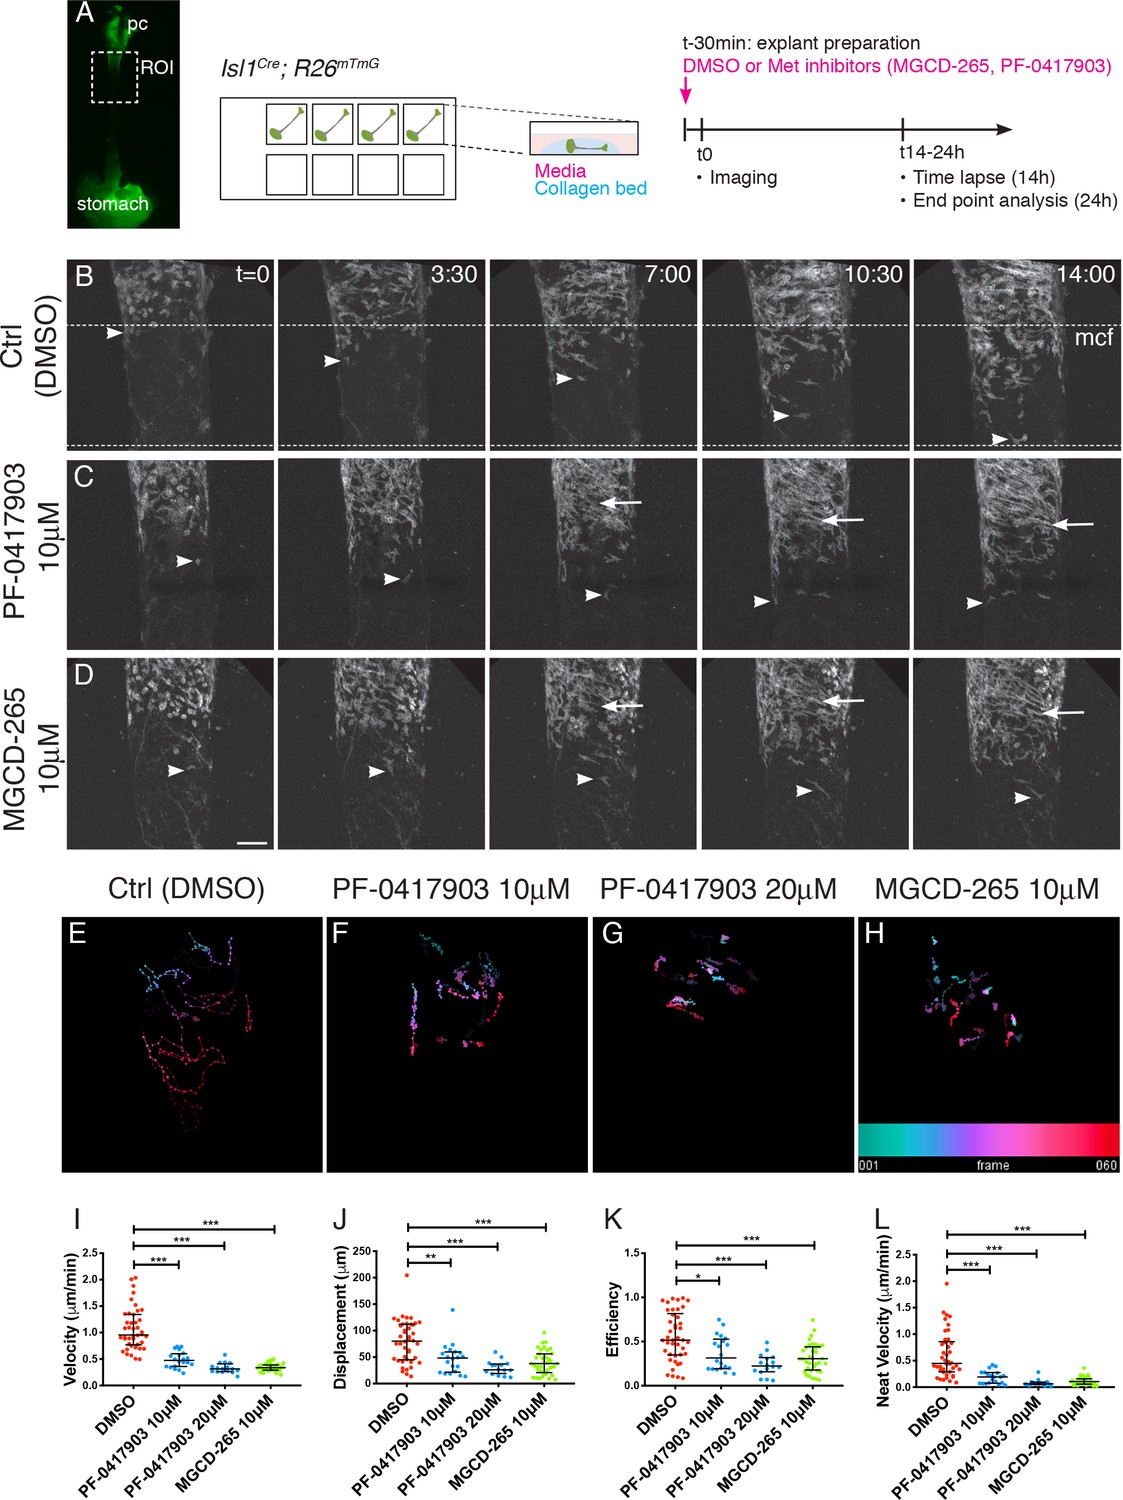
MET/HGF signaling is required for migration of Isl1-derived myogenic progenitors.
(A) Macroscopic view of Isl1Cre;R26mT/mG E14.5 dissected esophagus used for explant culture and live imaging. Esophagi were placed in collagen beds in individual Ibidi wells. MET inhibitors (MGCD-265, PF-0417903) or control (ctrl, DMSO) were added to explants 30 min before imaging. Explants were kept for 14 hr for live imaging (with an image taken every 12–15 min) or 24 hr for analysis at fixed time points (Figure 4—figure supplement 1). (B–D) Maximum projection of time series from a time-lapse experiment of esophagi explant culture in the presence of DMSO (B), 10 μM PF-0417903 (C) or 10 μM MGCD-265 (D). White arrowheads point to Isl1-derived progenitor cells present at the mononucleated cell front (mcf). White arrows highlight the high numbers of fibers that appear progressively in the inhibitor condition. Time (t) is indicated in hours. Dotted lines show the overall advancement of the mcf in the control condition. (E–H) Temporal color coded 2D images of GFP+ cell trajectories tracked in the time lapse movies in control and inhibitor treated explant cultures (related to Figure 4—videos 1, 2 and 3). (I–L) Quantification of cell velocity (in μm/min; I), displacement (μm, the length of the resultant vector between ti and tf of the track; J), efficiency (ratio between the displacement and the distance covered by the whole track; K), net velocity (μm/min, ratio between the displacement and total time of the track; L) in control and inhibitor treated explant cultures. Dots, individual cells tracked (from n = 2 experiments containing control and inhibitor treatments). Mean ± SEM. Statistical significance was assessed by a Mann-Whitney test. pc, pharyngeal constrictor. Scale bar: D, 100 μm.
-
Figure 4—source data 1
This. zip file contains excel tables with the individual tracking parameters.
- https://doi.org/10.7554/eLife.47460.011
Figure 4—figure supplement 1

Met invalidation does not affect the proliferation and survival of Isl1 progenitors.
(A–A’) Tunnel assay on transverse cryosections of E13.5 Met mutant and control embryos. White arrowheads point to Tunnel+ cell outside the ESM (n = 2 each condition). (B–C) Time series from a representative static esophagus explant culture experiment in the presence of DMSO (ctrl), (A) or 10 µM MGCD-265 (B). White arrowheads point to Isl1-derived progenitor cells present at the mononucleated cell front (mcf). White arrows highlight the high numbers of fibers that appear progressively in the inhibitor condition. Time (t) is indicated in hours. Dotted lines show the location of the mcf at 24 hr in the control and inhibitor condition. (D–E) Quantification of the % myogenic cells that are EdU+ (proliferative) and Myog+ (ongoing differentiation) (n = 3 each condition). Scale bars: A’, 50 µm; B, 200 µm.
Figure 4—video 1
Time-lapse movie of a control E14.5 Isl1Cre;R26mT/mG esophagus explant culture.
Time as hh:mm. Related to Figure 4. Individual GFP+ cells are tracked on different colors.
Figure 4—video 2
Time-lapse movie of a E14.5 Isl1Cre;R26mT/mG esophagus explant culture treated with 10 μM PF-0417903.
Time as hh:mm. Related to Figure 4. Individual GFP+ cells are tracked on different colors.
Figure 4—video 3
Time-lapse movie of a E14.5 Isl1Cre;R26mT/mG esophagus explant culture treated with 10 μM MGCD-265.
Time as hh:mm. Related to Figure 4. Individual GFP+ cells are tracked on different colors.
Figure 5 with 2 supplements
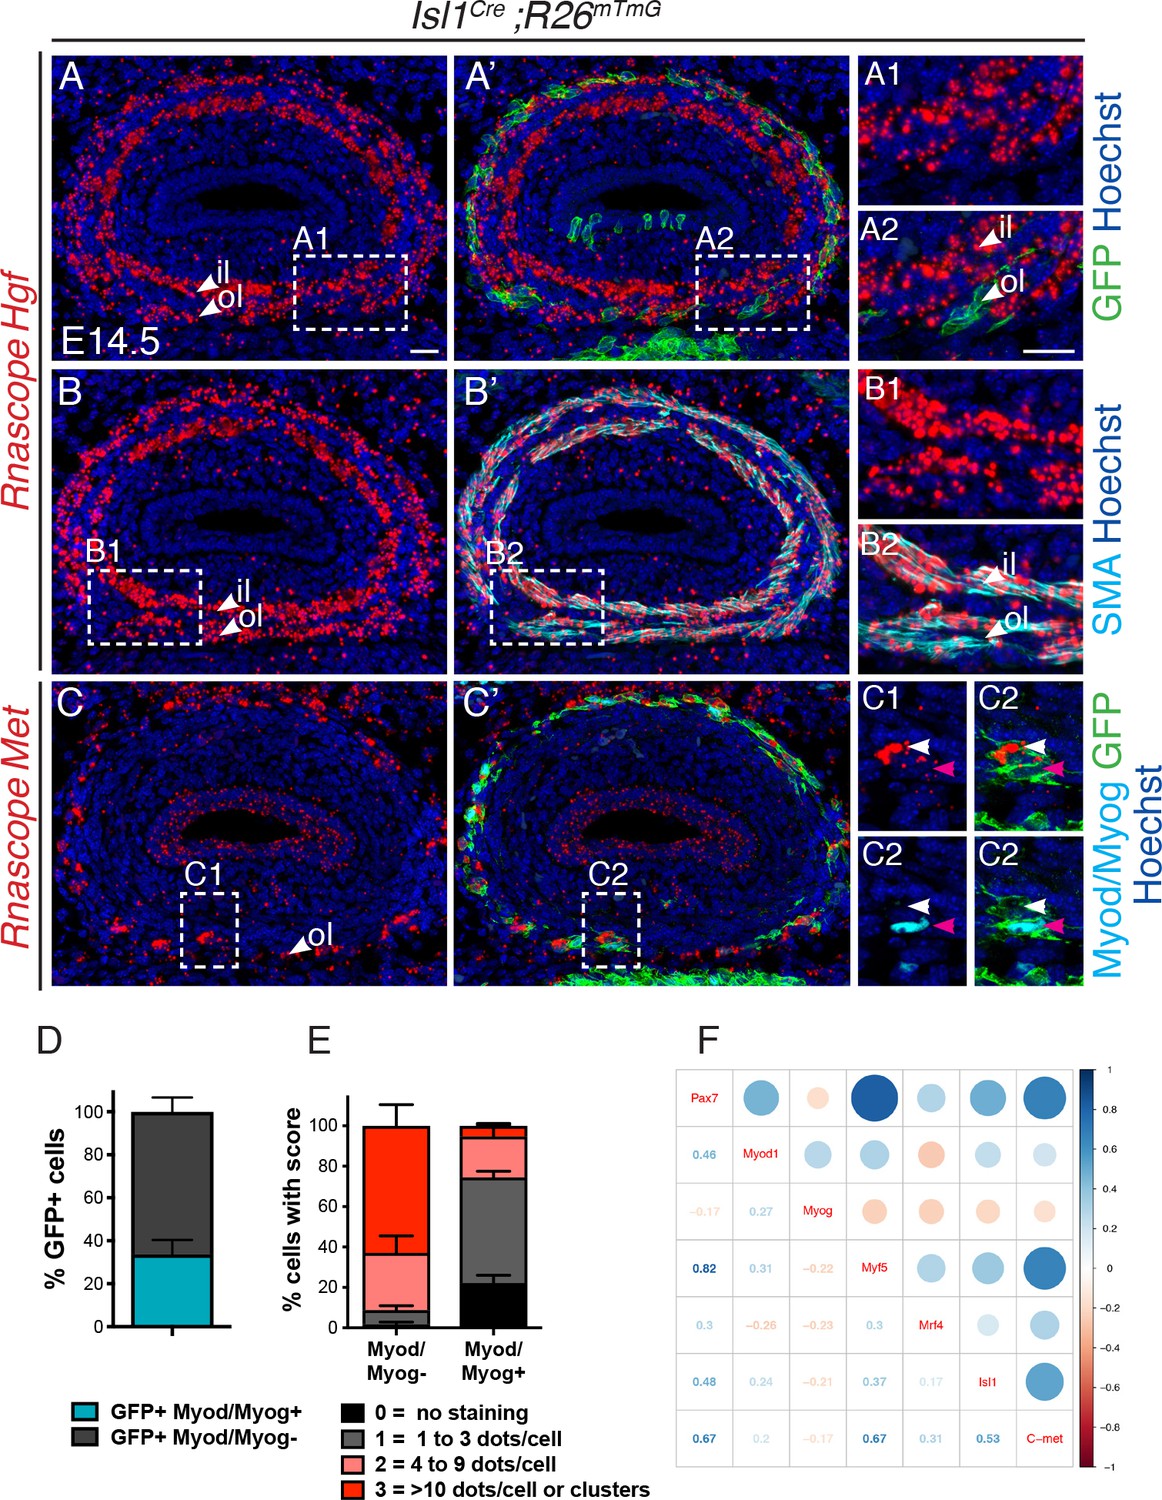
Met is expressed in undifferentiated Isl1-derived myogenic progenitors.
(A–C) In situ hybridization on transverse cryosections at the esophagus level of E14.5 Isl1Cre;R26mTmG embryos for Hgf (A, B) and Met (C), combined with immunofluorescence for GFP (Isl1-derived progenitors), SMA (smooth muscle actin) and Myod/Myog (myogenic cells) (shown in A'-C'). Note that Hgf is expressed adjacent to Isl1-derived cells (A1,A2) by SMA+ cells (B1,B2). Met is expressed by Isl1-derived cells but at levels inversely correlated to Myod/Myog+ expression (C1, C2, channels split for clarity). Note that Isl1-derived myogenic cells are exclusively present in the outer layer at this stage. (D) Histograms of the percentage of Myod/Myod- and Myod/Myog+ Isl1-derived GFP+ cells. (E) Histograms of the percentage of cells in (D) with a defined RNAscope score for Met expression. n = 3 embryos, with a minimum of 3 sections at the anteriormost part of the esophagus per embryo. A total of 368 GFP+ cells were assessed for the expression of Myod/Myog (D) and RNAscope score. (F) Correlogram. The upper part of the mixed correlogram displays graphically the degree of relationships between genes. The bigger the circle, the higher the Spearman’s correlation coefficient; the redder, the more negative; the bluer, the more positive. The lower part shows the values of the Spearman’s coefficient. il, inner layer ; ol, outer layer. Scale bars: A, A2, 20 μm.
-
Figure 5—source data 1
Excel table containing individual countings from three independent experiments to generate the histograms in panels 5D-E.
- https://doi.org/10.7554/eLife.47460.018
-
Figure 5—source data 2
This folder contains the initial single cell count matrix of the Ct values (tab2_3_sc_edge_allGenes_Ct.R), and the R source code (eso_t2_t3__analysis.R) used to filter, log-transformed, normalized, calculate the correlation coefficient and generate the correlogram on this figure.
- https://doi.org/10.7554/eLife.47460.019
Figure 5—figure supplement 1
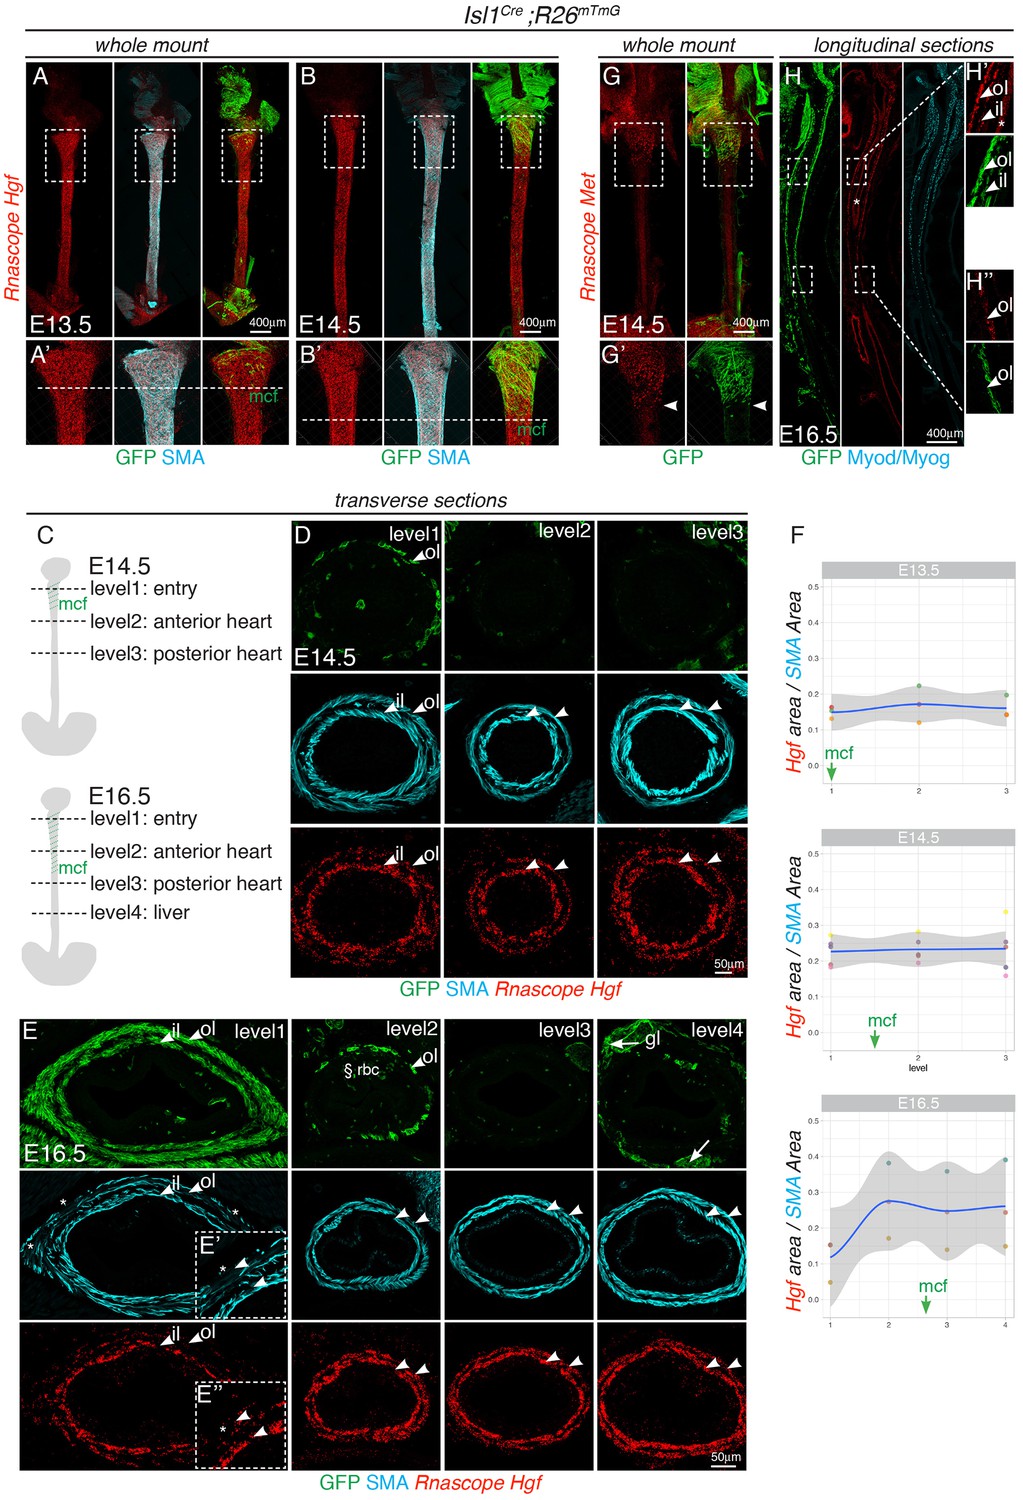
Expression domains of Hgf and Met along the developing esophagus.
RNAscope in situ hybridization on Isl1Cre ;R26mTmG control embryos. (A–B) Whole mount in situ hybridization for Hgf at E13.5 (A) and E14.5 (B) followed by immunostaining for GFP and SMA. Hgf is expressed along the entire esophagus length (A’–B’). Magnifications of the selected regions in (A–B). Dotted lines indicate the myogenic cell front (mcf) (n = 2 per stage). (C–E) In situ hybridization for Hgf on transverse cryosections at E14.5 (D) and E16.5 (E) at different levels as indicated on the scheme (C). SMA and Hgf are co-expressed in a double layered concentric pattern. (E’–E’’) Regression of the outer smooth muscle layer and concomitant reduction in Hgf expression at level one in E16.5 embryos (asterisks). § indicates autofluorescence of red blood cells (rbc). (F) Ratio between the SMA and Hgf thresholded area of expression per section at the indicated levels (n = 3 embryos per stage). The gray shading denotes the confidence interval around the smooth model (blue line, LOESS). (G) Whole mount in situ hybridization for Met at E14.5 (B) followed by immunostaining for GFP. Met is restricted to the anterior esophagus. (H) In situ hybridization for Met on longitudinal cryosections at E16.5 followed by immunostaining for GFP and Myod/Myog. At this stage, Met and mGFP colocalised anteriorly in a bilayered pattern (H’), while posteriorly they were restricted to the outer layer (H’’). Asterisks indicate expression in epithelial lumen. Please note that panels 1G and 1H are located in the upper right portion of the figure. il, inner layer ; ol, outer layer ; mcf, myogenic cell front.
Figure 5—figure supplement 2
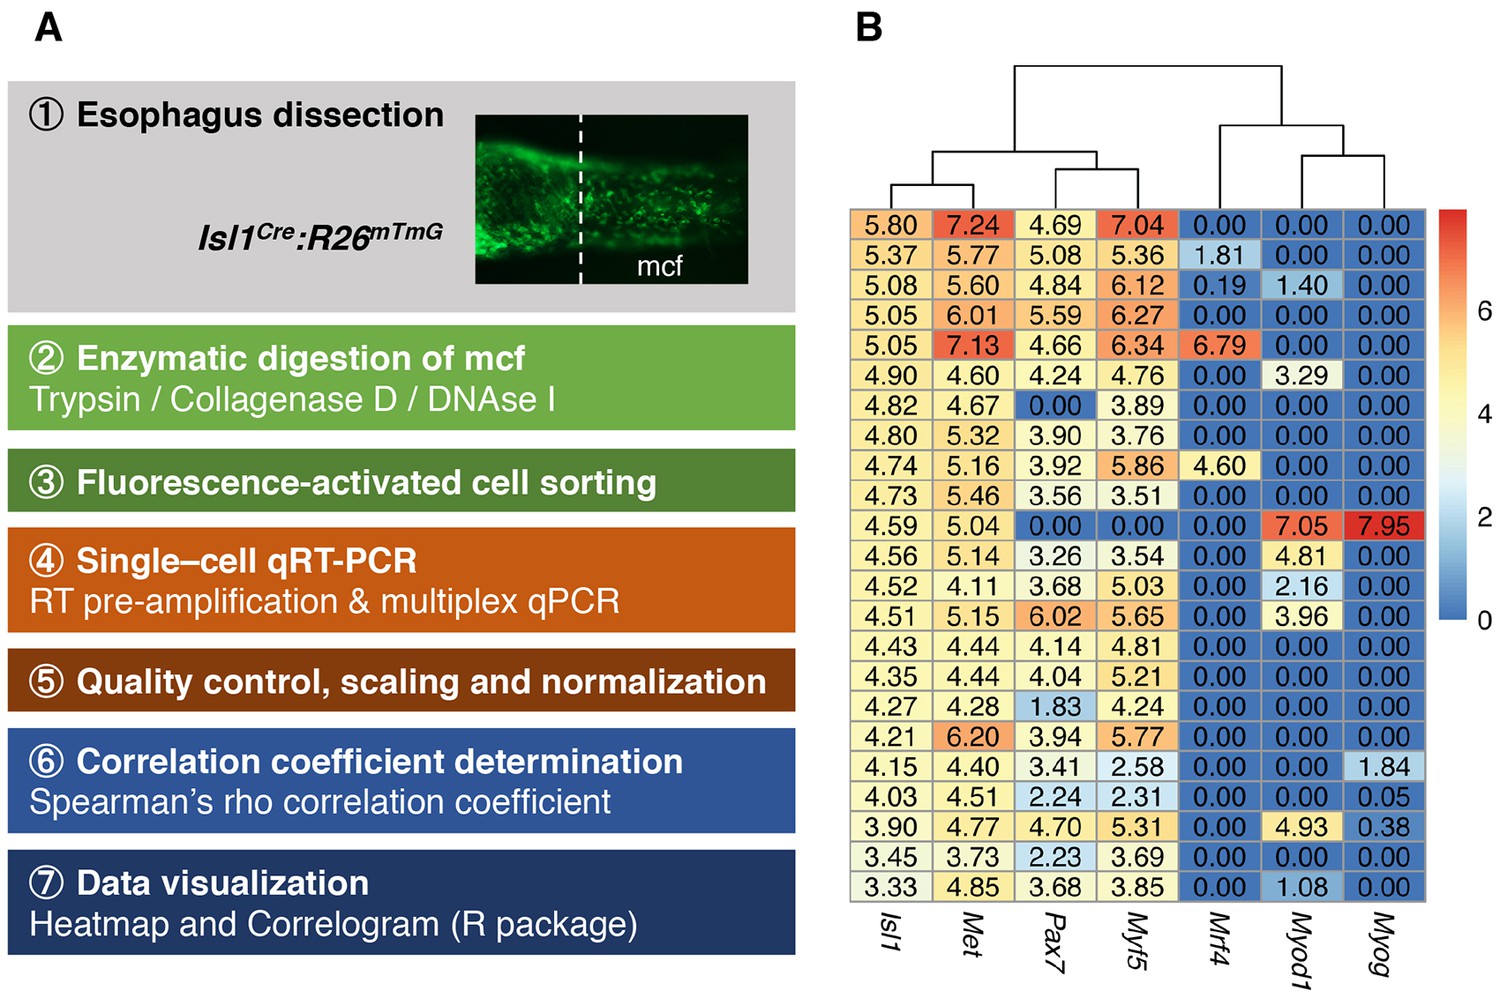
Esophagus single cell analysis.
(A) Experimental procedure for the esophagus mononucleated cells analysis. (B) The heatmap shows the normalized converted expression values, with columns corresponding to the genes and rows corresponding to the different single cells. Dendrogram shows the hierarchical clustering using the Euclidean distance between genes.
Figure 6

Tbx1-Isl1-Met genetic pathway regulates only a subset of CPM-derived muscles.
(A) Masticatory (purple) and facial (blue) muscles originating from anterior pharyngeal arches (PA1-2) are indicated. Neck muscles (green) derived from posterior PAs including trapezius, pharyngeal and laryngeal muscles, develop in a Met-independent context, while esophagus striated muscles are under the control of MET/HGF signaling. (B) A Tbx1/Islet1/Met genetic hierarchy acts in uncommitted ESM progenitors. Then, Met expression decreases in myoblasts during myogenic commitment. (C) Absence of ESM formation in the Met and Hgf mutants. CPM, cardiopharyngeal mesoderm; bc, buccinator; e, esophagus; esm, esophagus striated muscles; lgm, laryngeal muscles; ms, masseter; oo, orbicularis oculi; PA1-6, pharyngeal arches 1–6; pc, pharyngeal constrictor; pl, platysma; st, stomach; te, temporal; tpm, trapezius muscles.
Tables
Key resources table
| Reagent type (species) or resource | Designation | Source or reference | Identifiers | Additional information |
|---|---|---|---|---|
| Strain, strain background (Mus musculus) | B6D2F1/JRj | Janvier | ||
| Genetic reagent (M. musculus) | Islet1Cre | PMID:11299042 | MGI:2447758 | Dr. Thomas M Jessell (Howard Hughes Medical Institute, Columbia University, USA) |
| Genetic reagent (M. musculus) | Myf5nlacZ | PMID:8918877 | MGI:1857973 | Dr. Shahragim Tajbakhsh (Department of Developmental and Stem Cell Biology, Institut Pasteur, France) |
| Genetic reagent (M. musculus) | Tg :Pax7-nGFP | PMID:19531352 | MGI:5308730 | Dr. Shahragim Tajbakhsh (Department of Developmental and Stem Cell Biology, Institut Pasteur, France) |
| Genetic reagent (M. musculus) | R26mT/mG | PMID:17868096 | MGI:3716464 | Pr. Philippe Soriano (Icahn School of Medicine at Mt. Sinai, USA) |
| Genetic reagent (M. musculus) | Hgf KO | PMID:7854452 | MGI:1857656 | Pr. Carmen Birchmeier (Max Delbruck Center for Molecular Medicine, Germany) |
| Genetic reagent (M. musculus) | MetD | PMID:8898205 | MGI:1858019 | Pr. Carola Ponzetto (Department of Molecular Biotechnology, University of Turin, Italy) |
| Genetic reagent (M. musculus) | Tbx1KO | PMID:11242110 | MGI:2179190 | Dr. Virginia Papaioannou (Department of Genetics and Development, Columbia University Medical Center, USA) |
| Antibody | Chicken polyclonal anti-β-gal | Abcam | Cat. #: ab9361 RRID:AB_307210 | IF (1:1000) |
| Antibody | Rabbit polyclonal anti-β-gal | MP Biomedicals | Cat. #: MP 559761 RRID:AB_2687418 | IF (1:1500) |
| Antibody | Chicken polyclonal anti-GFP | Aves Labs | Cat. #: 1020 RRID:AB_10000240 | IF (1:500) |
| Antibody | Chicken polyclonal anti-GFP | Abcam | Cat. #: 13970 RRID:AB_300798 | IF (1:1000) |
| Antibody | Mouse monoclonal IgG1 anti-Islet1 | DSHB | Cat. #: 40.2D6 RRID:AB_528315 | IF (1:1000) |
| Antibody | Mouse monoclonal IgG1 anti-Desmin | Dako | Cat. #: ab8470 RRID:AB_306577 | IF (1:100) |
| Antibody | Mouse monoclonal IgG1 anti-Myod | Dako | Cat. #: M3512 RRID:AB_2148874 | IF (1:100) |
| Antibody | Mouse monoclonal IgG1 anti-Myod | BD-Biosciences | Cat. #: 554130 RRID:AB_395255 | IF (1:500) |
| Antibody | Mouse monoclonal IgG1 anti-Pax7 | DSHB | Cat. #: Pax7 RRID:AB_528428 | IF (1:20) |
| Antibody | Mouse monoclonal IgG2a anti-E-Cad | BD Biosciences | Cat. #: 610182 RRID:AB_397581 | IF (1:500) |
| Antibody | Mouse monoclonal IgG1 anti-Myog | DSHB | Cat. #: F5D RRID:AB_2146602 | IF (1:20) |
| Antibody | Rabbit polyclonal anti-SMA | Abcam | Cat. #: ab5694 RRID:AB_2223021 | IF (1:1000) |
| Antibody | Mouse monoclonal IgG1 anti-Tnnt3 | Sigma Aldrich | Cat. #: T6277 RRID:AB_261723 | IF (1:200) |
| Antibody | Mouse monoclonal IgG2a anti-Tuj1 | Ozyme/BioLegend | Cat. #: BLE801202 RRID:AB_2313773 | IF (1:1000) |
| Antibody | Alexa Fluor 633 F(ab')2 Fragment of Goat Anti-Rabbit IgG (H+L) | Life Technologies | Cat. #: A-21072 RRID:AB_2535733 | IF (1:500) |
| Antibody | Alexa Fluor 555 F(ab')2 Fragment of Goat Anti-Rabbit IgG (H+L) | Life Technologies | Cat. #: A-21430 RRID:AB_2535851 | IF (1:500) |
| Antibody | Alexa Fluor 488 F(ab')2 Fragment of Goat Anti-Rabbit IgG (H+L) | Life Technologies | Cat. #: A-11070 RRID:AB_2534114 | IF (1:500) |
| Antibody | Alexa Fluor 633 Goat Anti-Chicken IgG (H+L) | Life Technologies | Cat. #: A-21103 RRID:AB_2535756 | IF (1:500) |
| Antibody | Alexa Fluor 488 Goat Anti-Chicken IgG (H+L) | Life Technologies | Cat. #: A-11039 RRID:AB_2534096 | IF (1:500) |
| Antibody | Alexa Fluor 633 Goat Anti-Mouse IgG1 (γ1) | Life Technologies | Cat. #: A 21126 RRID:AB_2535768 | IF (1:500) |
| Antibody | Alexa Fluor488 AffiniPure Goat Anti-Mouse IgG1 (γ1) | Jackson ImmunoResearch | Cat. #: 115-545-205 RRID:AB_2338854 | IF (1:500) |
| Antibody | Cy3-AffiniPure Goat Anti-Mouse IgG1 (γ1) | Jackson ImmunoResearch | Cat. #: 115-165-205 RRID:AB_2338694 | IF (1:500) |
| Antibody | Cy3-AffiniPure Goat Anti-Mouse IgG2a (γ2a) | Jackson ImmunoResearch | Cat. #: 115-165-206 RRID:AB_2338695 | IF (1:500) |
| Antibody | Dylight 405 Goat Anti-Mouse IgG2a (γ2a) | Jackson ImmunoResearch | Cat. #: 115-475-206 RRID:AB_2338800 | IF (1:500) |
| Commercial assay, kit | RNAscope 2.5 HD reagent Kit-RED | ACD/Bio-techne | Cat. #: 322350 | |
| Commercial assay, kit | RNAscope Multiplex Fluorescent reagent Kit-V2 | ACD/Bio-techne | Cat. #: 323100 | |
| Commercial assay, kit | RNAscope Probe – Mm-Hgf (C1) | ACD/Bio-techne | Cat. #: 315631 | |
| Commercial assay, kit | RNAscope Probe – Mm-Met (C1) | ACD/Bio-techne | Cat. #: 405301 | |
| Commercial assay, kit | Opal 570 Reagent Pack | PerkinElmer | Cat. #: FP1488001KT | 1 :1500 of reconstituted reagent in RNAscope Multiplex TSA Buffer |
| Sequence-based reagent | qPCR Primer TBP Fw | This paper | ATCCCAAGCGATTTGCTG | Materials and methods, Quantitative RT-qPCR section |
| Sequence-based reagent | qPCR Primer TBP Rev | This paper | CCTGTGCACACCATTTTTCC | Materials and methods, Quantitative RT-qPCR section |
| Sequence-based reagent | qPCR Primer Isl1 Fw | Gopalakrishnan et al., 2015 | CGTGCTTTGTTAGGGATGGGA | |
| Sequence-based reagent | qPCR Primer Isl1 Rev | Gopalakrishnan et al., 2015 | AGTCGTTCTTGCTGAAGCCT | |
| Sequence-based reagent | qPCR Primer Myf5 Fw | This paper | GACAGGGCTGTTACATTCAGG | Materials and methods, Quantitative RT-qPCR section |
| Sequence-based reagent | qPCR Primer Myf5 Rev | This paper | TGAGGGAACAGGTGGAGAAC | Materials and methods, Quantitative RT-qPCR section |
| Sequence-based reagent | qPCR Primer Met Fw | Sambasivan et al., 2009 | GCATTTTTACGGACCCAACC | |
| Sequence-based reagent | qPCR Primer Met Rev | Sambasivan et al., 2009 | TTCACAGCCGGAAGAGTTTC | |
| Sequence-based reagent | qPCR Primer Hgf Fw | This paper | CTTCTCCTTGGCCTTGAATG | Materials and methods - Quantitative RT-qPCR section |
| Sequence-based reagent | qPCR Primer Hgf Rev | This paper | AGGCCATGGTGCTACACTCT | Materials and methods -Quantitative RT-qPCR section |
| Sequence-based reagent | qPCR Primer SMA Fw | This paper | CTCTCTTCCAGCCATCTTTCAT | Materials and methods - Quantitative RT-qPCR section |
| Sequence-based reagent | qPCR Primer SMA Rev | This paper | TATAGGTGGTTTCGTGGATGC | Materials and methods -Quantitative RT-qPCR section |
| Sequence-based reagent | Taqman qPCR Primers Tbp | ThermoFisher Scientific | Cat. #: Mm00446971_m1 | Sequence not available, probe spans exons |
| Sequence-based reagent | Taqman qPCR Primers Actb | ThermoFisher Scientific | Cat. #: Mm00607939_s1 | Sequence not available, primers and probe map within a single exon |
| Sequence-based reagent | Taqman qPCR Primers Hprt | ThermoFisher Scientific | Cat. #: Mm01545399_m1 | Sequence not available, probe spans exons |
| Sequence-based reagent | Taqman qPCR Primers Rpl13a | ThermoFisher Scientific | Cat. #: Mm01612987_g1 | Sequence not available, probe spans exons |
| Sequence-based reagent | Taqman qPCR Primers Rps29 | ThermoFisher Scientific | Cat. #: Mm02342448_gH | Sequence not available, probe spans exons |
| Sequence-based reagent | Taqman qPCR Primers Pax7 | ThermoFisher Scientific | Cat. #: Mm01354484_m1 | Sequence not available, probe spans exons |
| Sequence-based reagent | Taqman qPCR Primers Myod | ThermoFisher Scientific | Cat. #: Mm01203489_g1 | Sequence not available, probe spans exons |
| Sequence-based reagent | Taqman qPCR Primers Myog | ThermoFisher Scientific | Cat. #: Mm00446195_g1 | Sequence not available, probe spans exons |
| Sequence-based reagent | Taqman qPCR Primers Pax3 | ThermoFisher Scientific | Cat. #: Mm00435491_m1 | Sequence not available, probe spans exons |
| Sequence-based reagent | Taqman qPCR Primers Myf5 | ThermoFisher Scientific | Cat. #: Mm00435125_m1 | Sequence not available, probe spans exons |
| Sequence-based reagent | Taqman qPCR Primers Mrf4 | ThermoFisher Scientific | Cat. #: Mm00435127_g1 | Sequence not available, probe spans exons |
| Sequence-based reagent | Taqman qPCR Primers Isl1 | ThermoFisher Scientific | Cat. #: Mm00517585_m1 | Sequence not available, probe spans exons |
| Sequence-based reagent | Taqman qPCR Primers Met | ThermoFisher Scientific | Cat. #: Mm00436382_m1 | Sequence not available, probe spans exons |
Additional files
-
Transparent reporting form
- https://doi.org/10.7554/eLife.47460.021
Download links
A two-part list of links to download the article, or parts of the article, in various formats.
Downloads (link to download the article as PDF)
Open citations (links to open the citations from this article in various online reference manager services)
Cite this article (links to download the citations from this article in formats compatible with various reference manager tools)
A distinct cardiopharyngeal mesoderm genetic hierarchy establishes antero-posterior patterning of esophagus striated muscle
eLife 8:e47460.
https://doi.org/10.7554/eLife.47460


