Distinct mechanisms of microRNA sorting into cancer cell-derived extracellular vesicle subtypes
- University of California, Berkeley, United States
- Howard Hughes Medical Institute, University of California, Berkeley, United States
- University of Texas, United States
Figures
Figure 1 with 1 supplement
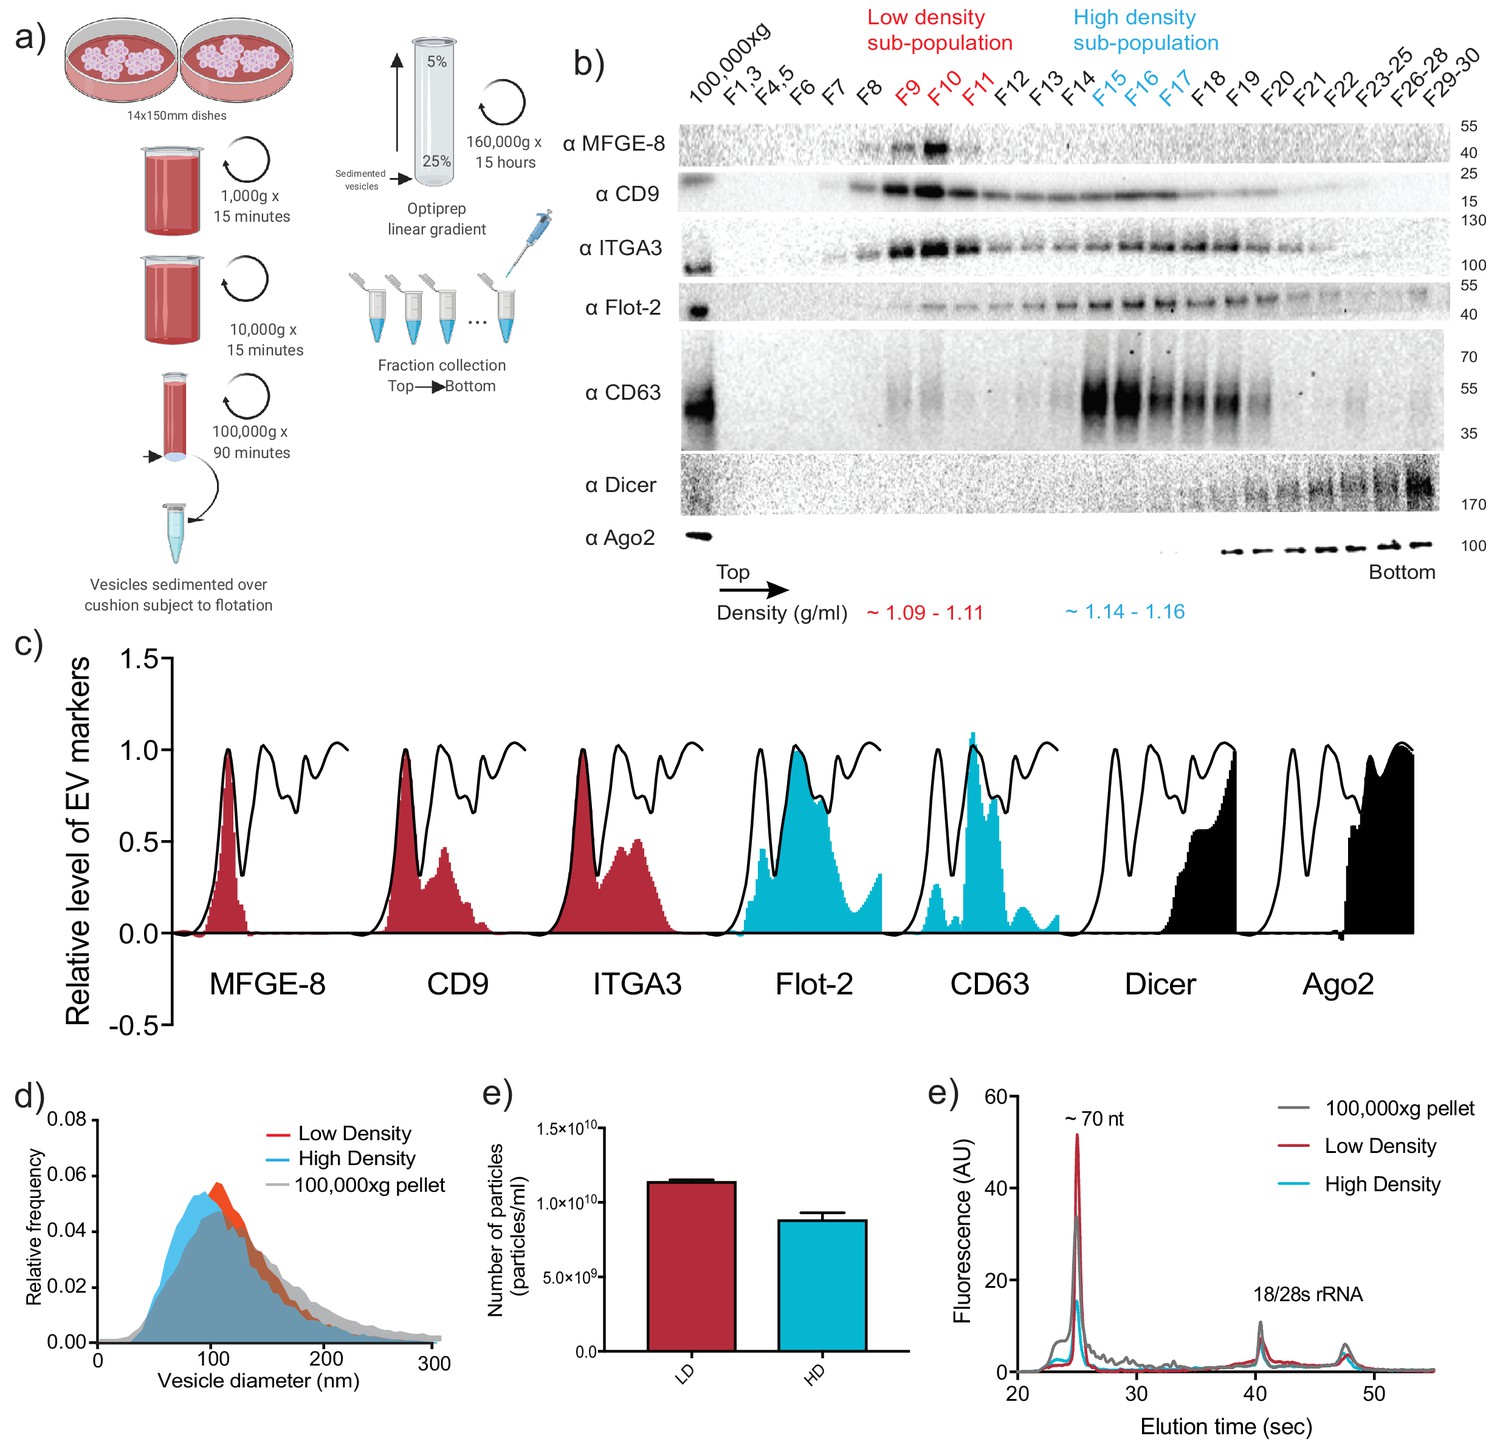
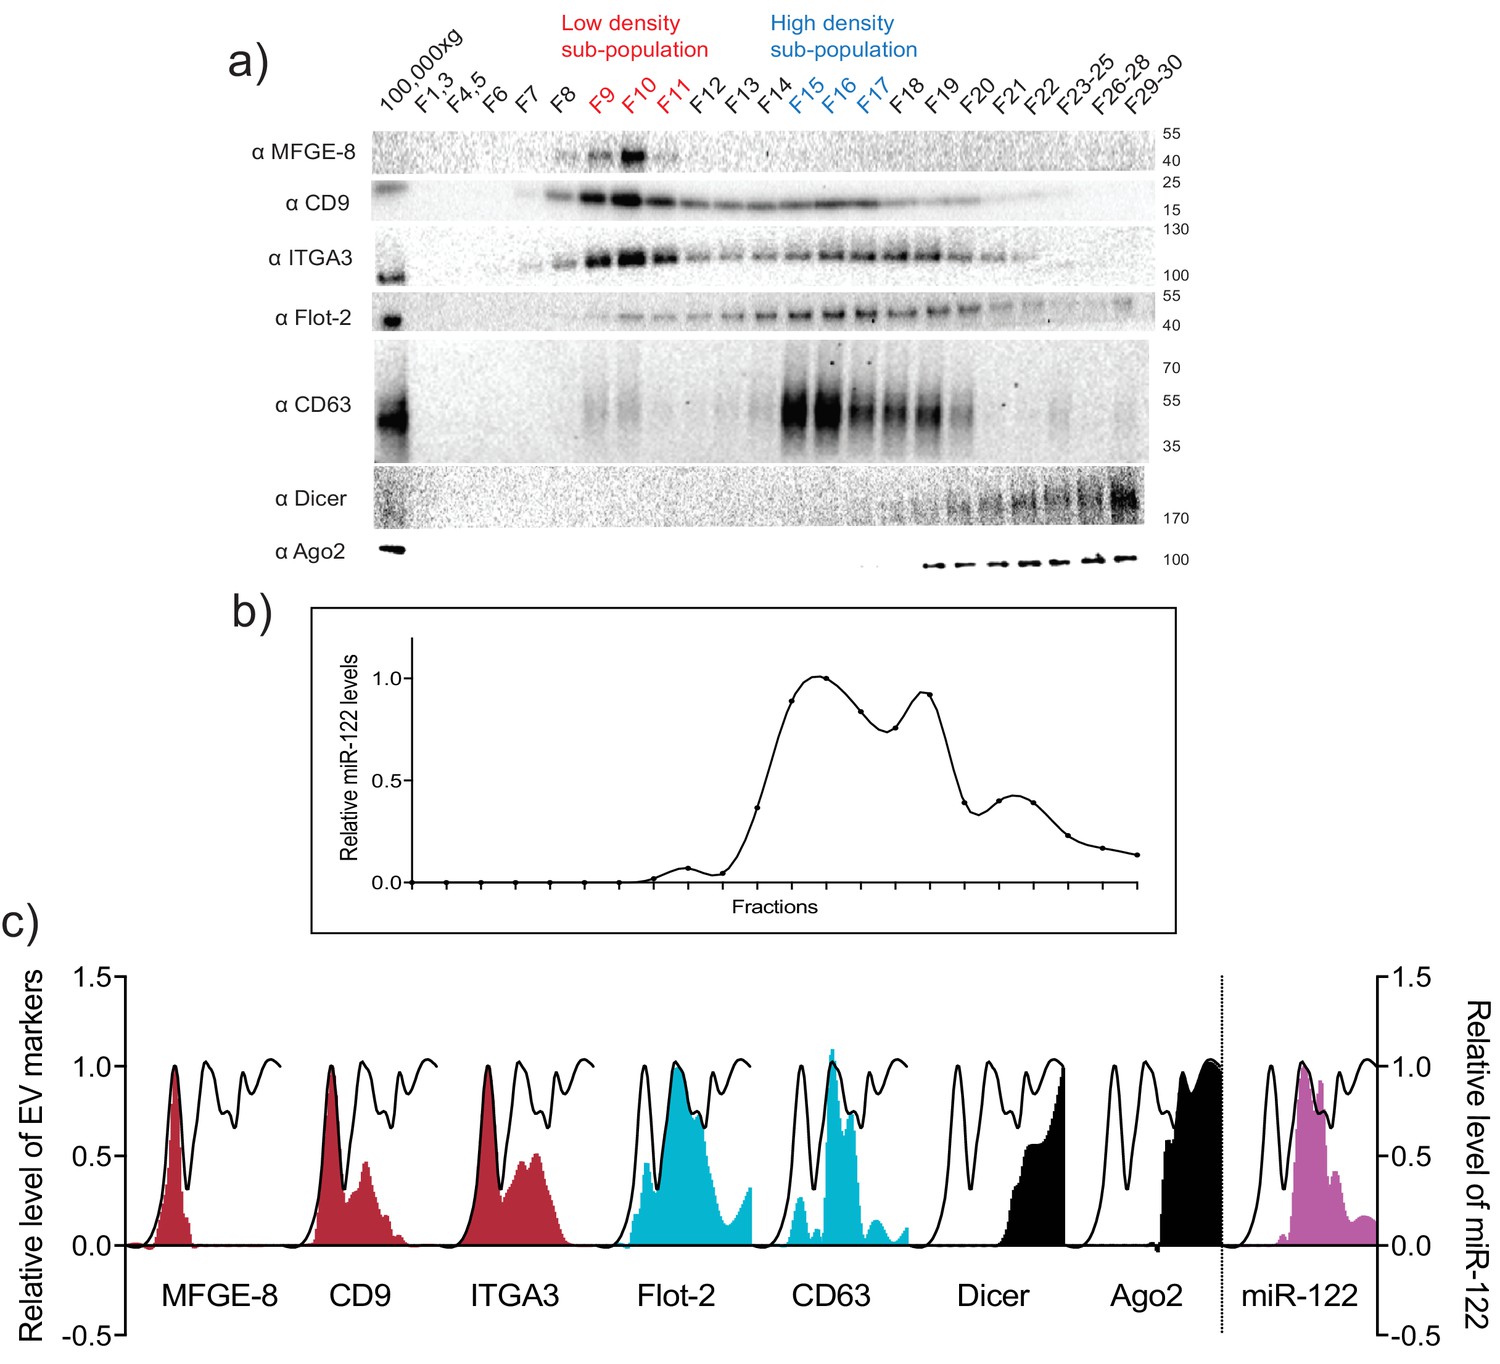
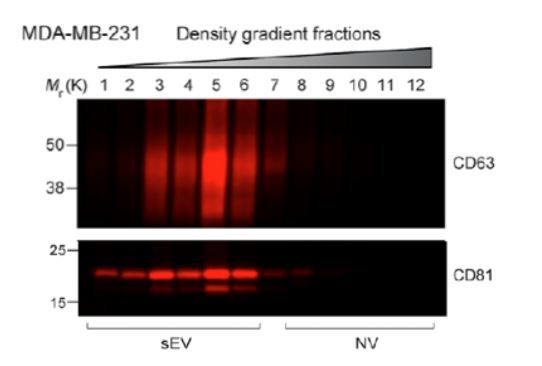
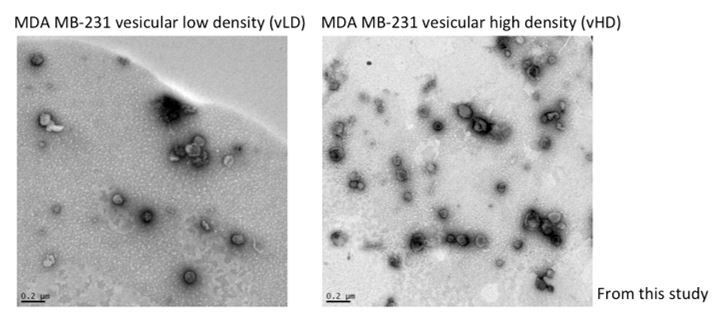
Two biochemically distinct sEV sub-populations are released by MDA-MB-231 cells.
(a) Schematic showing the two-step purification methodology. Differential ultracentrifugation was followed by buoyant density flotation in a linear iodixanol gradient (Figure 1—figure supplement 1). (b) Immunoblot across the iodixanol gradient for classical sEV markers as well as other non-vesicular RNP components. The two discrete sub-populations are indicated. CD63, a glycosylated protein, migrates heterogeneously. (c) Quantification of individual proteins as in 1b. The black line delineates the maximum signal across the gradient showing three distinctive areas. The first, second and third peak represent the vLD, vHD and non-vesicular RNP fractions. (d) Nanoparticle tracking analysis showing the size distribution of the vHD and vLD sub-populations. The high-speed pellet is also shown. (d) Quantification of the particle number per sEV sub-population using Nanoparticle tracking analysis. Data plotted are from two independent experiments; error bars represent standard deviation from independent samples. (e) Bioanalyzer analysis of the vHD and vLD RNA. The high-speed pellet RNA is also shown.
Figure 1—figure supplement 1

Linearity of iodixanol density gradient.
Calculated iodixanol fraction densities collected from the top to bottom of the gradient (fractions 1 to 25) as measured by refractometry (Figure 1—figure supplement 1—source data 1). Fractions were collected post 160,000 g ultracentrifugation (Figure 1a). In red, fractions corresponding to the vLD sub-population. In blue, fractions corresponding to the vHD sub-population.
-
Figure 1—figure supplement 1—source data 1
Refraction index and calculated densities of the fractions across the gradient (31 fractions in total).
- https://doi.org/10.7554/eLife.47544.004
Figure 2
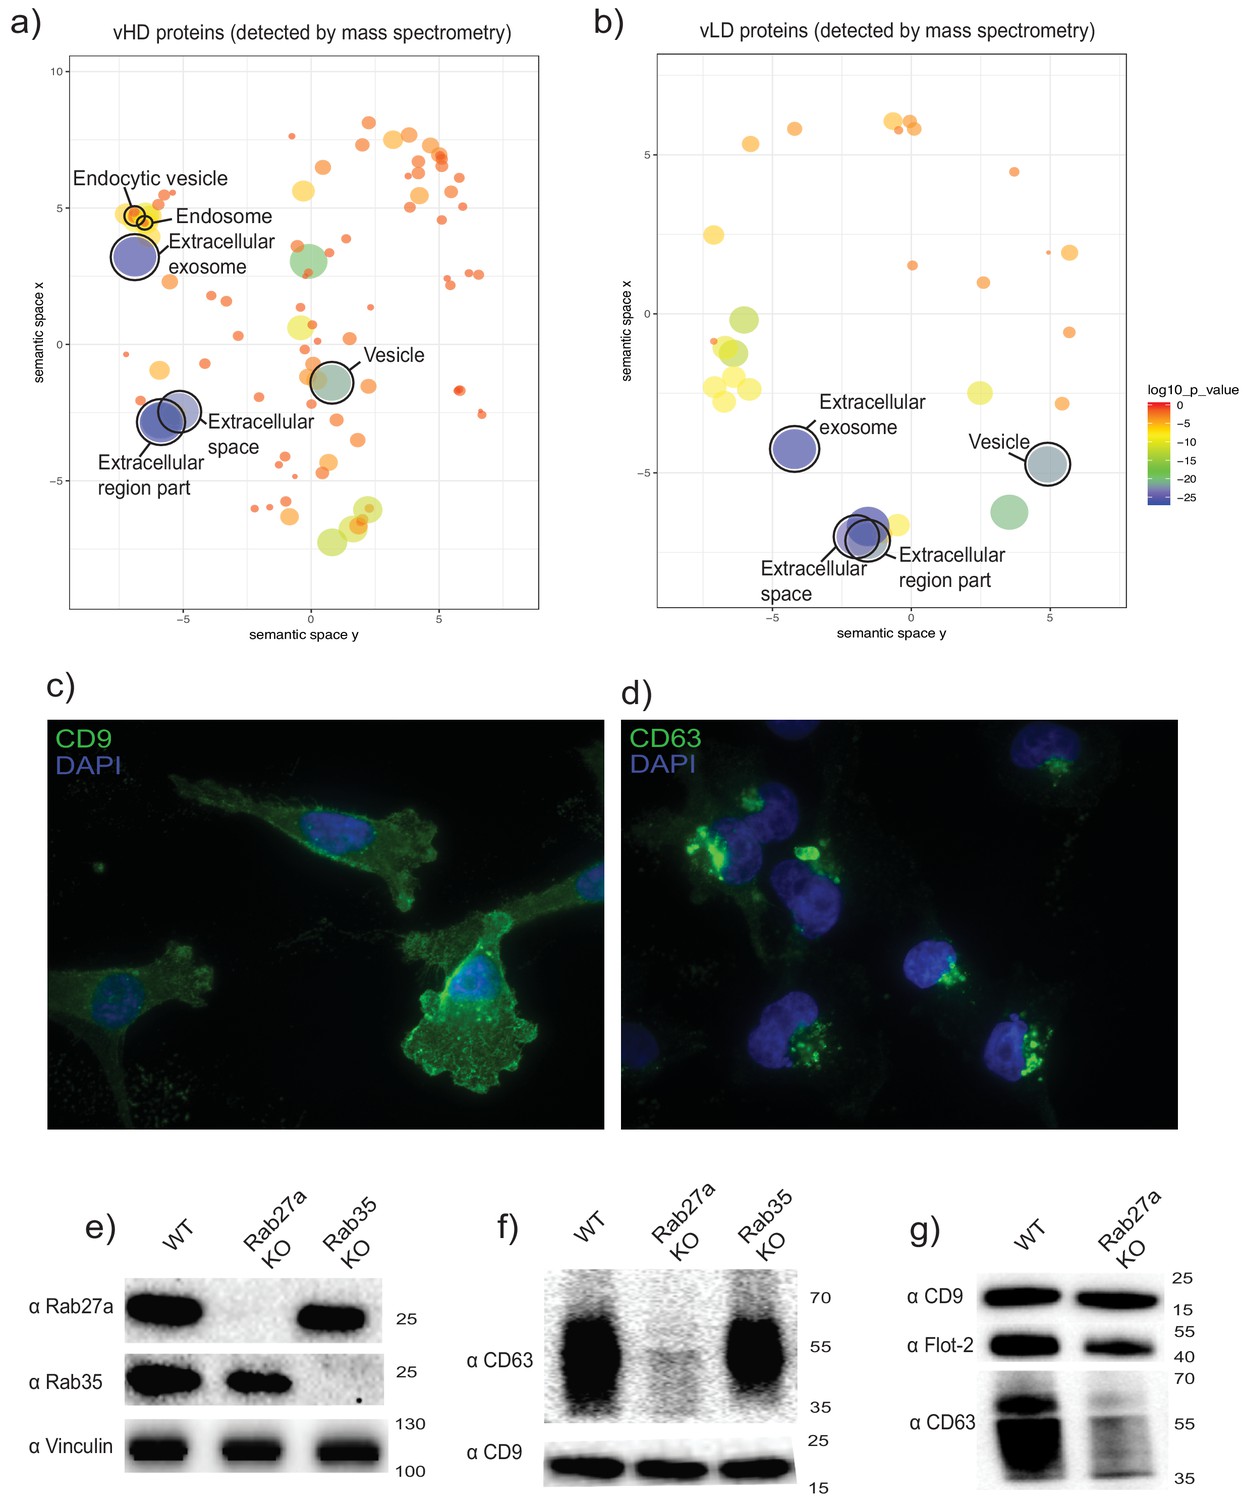
The two biochemically distinct sEV sub-populations co-fractionate with membranes of different sub-cellular origin.
(a, b) Gene ontology analysis for sub-cellular localization of proteins that coincide with vHD and vLD proteins detected by mass spectrometry. The gene ontology analysis platform compares the list of proteins given per group to the human genome frequency. The detection of enrichment for a certain organelle/localization is represented as circles, with the size of circles correlating to log10 p-value. (c, d) Immunofluorescence for two tetraspanins enriched in each sEV sub-population. CD9 and CD63 enriched in vLD and vHD respectively. (e) Analysis of WT, CRISPR-Cas9 Rab27a KO and CRISPR-Cas9 Rab35 KO by immunoblot. Rab27a, Rab35 and vinculin are shown. (f) Immunoblots for CD63 and CD9 in sEVs secreted by WT, Rab27a KO cells and Rab35 KO cells. The amounts of loaded sEVs were normalized by total cell number. (g) Immunoblots for CD63, CD9 and flotillin-2 in sEVs secreted by WT and Rab27a KO cells. The amounts of loaded sEVs were normalized by total cell number.
-
Figure 2—source data 1
List of proteins detected by mass spectrometry in both EV sub-populations.
- https://doi.org/10.7554/eLife.47544.006
Figure 3 with 4 supplements
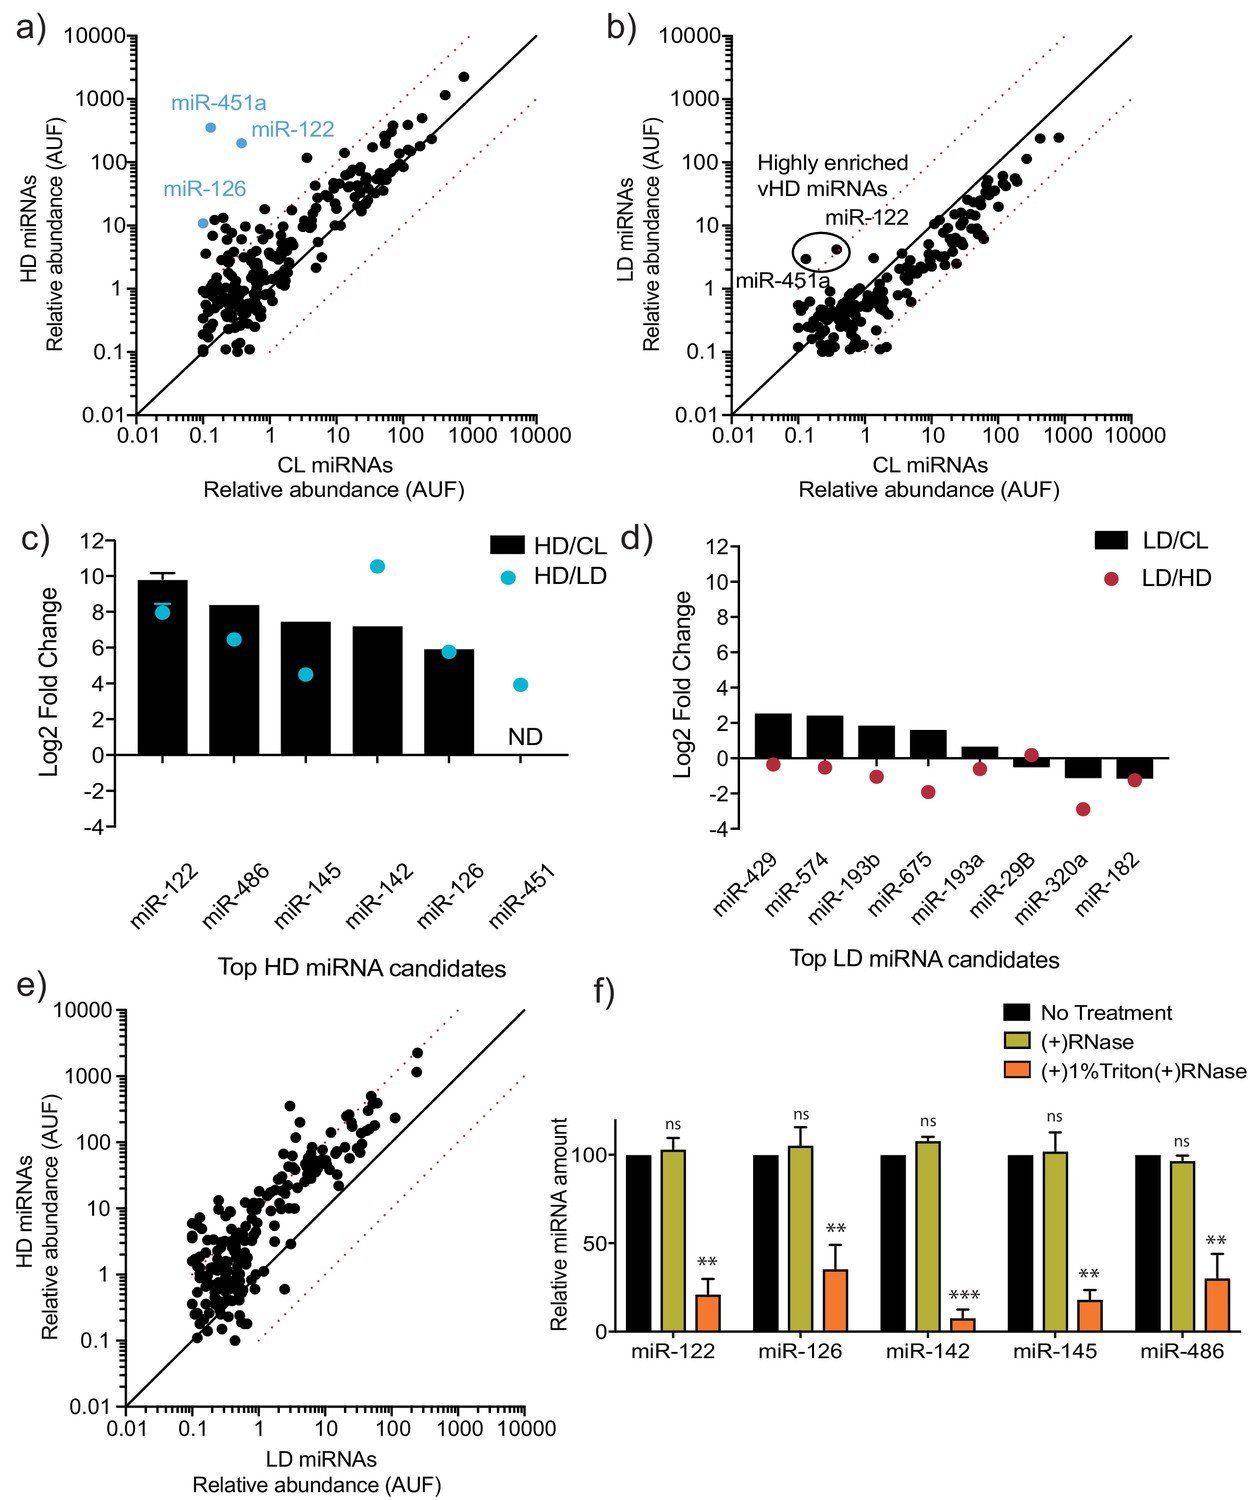
MicroRNA profiling of high buoyant density and low buoyant density sEV sub-populations.
(a, b) Scatterplots showing the relative abundance (as arbitrary units of fluorescence (AUF)) for miRNAs detected in vHD and vLD sub-populations relative to cellular levels, as detected by Firefly profiling and normalized per ng of total RNA. In blue, vHD miRNAs that were selected for further validation by RT-qPCR. Circled miRNAs in vLD represent those also found to be enriched in the vHD-subpopulation. (c, d) Log2 fold change for top vHD and vLD candidate miRNAs in vHD or vLD relative to cells (vHD/CL or vLD/CL, respectively) and vHD relative to vLD or vice versa (vHD/vLD or vLD/vHD, respectively). MiRNA species were quantified by RT-qPCR and normalized per ng of total RNA. Data plotted for miR-122 are from three independent experiments (biological replicates), each independent experiment with triplicate qPCR reactions; error bars represent standard deviation from independent samples. (e) Scatterplots showing relative abundance of miRNAs (AUF) detected in vHD and vLD sub-populations normalized per ng of total RNA, as detected by Firefly profiling. (f) RNase protection of highly enriched vHD miRNAs quantified by qPCR. Isolated sEVs were treated with or without RNase If and or Triton X-100. Data plotted are from two independent experiments, each independent experiment with triplicate qPCR reactions; error bars represent standard deviation from independent samples. Statistical significance was performed using Student’s t-test (**p<0.01, ***p<0.001, ns = not significant). CL: cellular lysate. Dashed red lines in a, b and e, represent 10-fold differences.
Figure 3—figure supplement 1
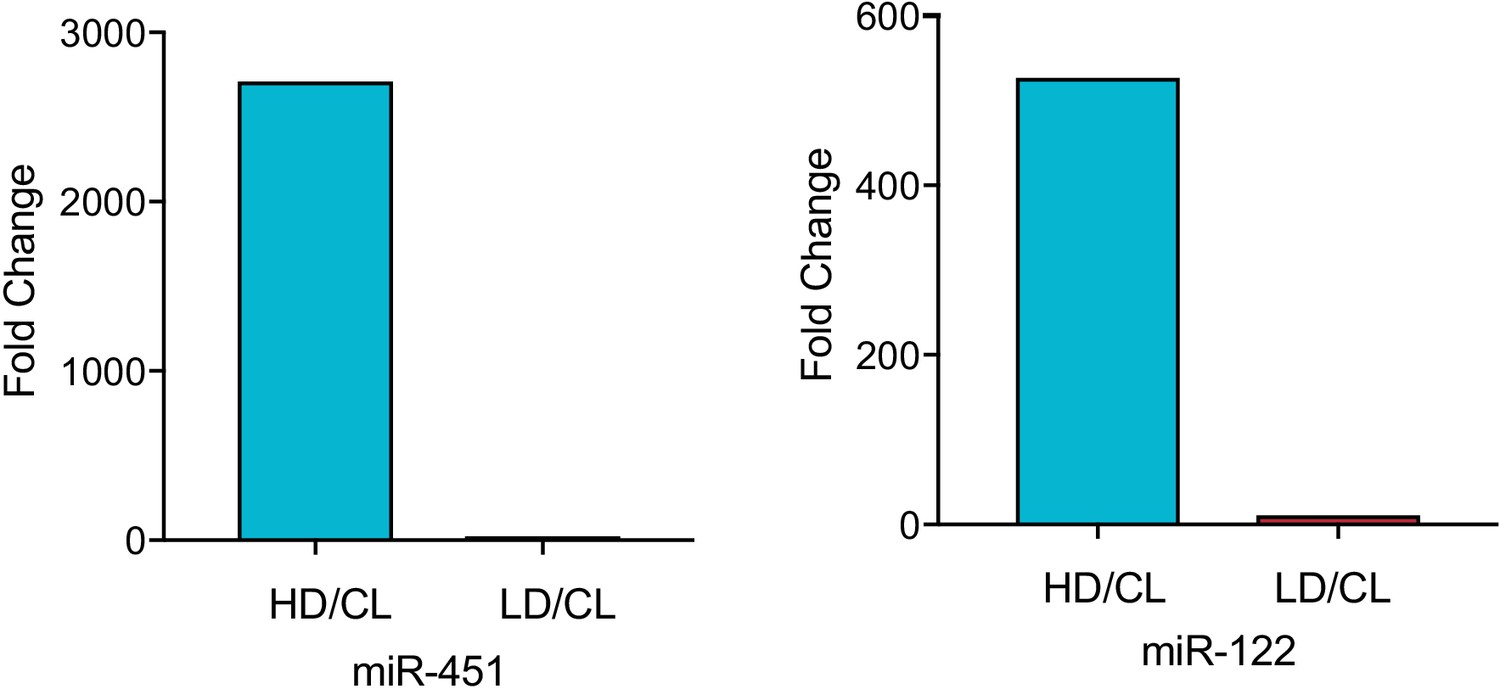
MiR-122 and miR-451 are highly enriched in the vHD sub-population.
Fold difference vHD/CL or vLD/CL for miR-451a and miR-122. Data extracted from Firefly profiling. CL: cellular lysate.
Figure 3—figure supplement 2

TGIRT-sequencing of high buoyant density and low buoyant density sEV sub-populations.
(a, b) Scatterplots showing the relative abundance (as reads per million (RPM)) for miRNAs detected in vHD and vLD sub-populations relative to CL levels. Normalized per total number of miRNA reads. In blue, vHD miRNAs that were selected for further validation by qPCR. In red, vLD miRNAs selected for further validation by qPCR. Circled miRNAs in vLD represent those also found to be enriched in the vHD-subpopulation c) Venn Diagram showing the total number of vHD and vLD uniquely found miRNAs (miRNAs with non-detectable signal in cellular lysates) detected by TGIRT-seq. (d) Bar graph showing the distribution of all small non-coding RNA transcripts found in vHD and vLD sub-populations. (e) tRNA start site distribution showing the majority of tRNA reads start at position 16, previously described as the site of an EV-specific D-loop modification (Shurtleff et al., 2017). The putative D-loop modification is present at relatively same levels in both the vHD and vLD sub-populations. CL: cellular lysate. Dashed red lines in a and b represent 10-fold differences.
Figure 3—figure supplement 3

MiR-122 accumulates in conditioned media (CM) over time.
Quantification of total number of miR-122 molecules in CM. CM was incubated with or without MDA-MB-231 cells for a period of 48 hr. Samples were collected at the indicated time points. Cell debris and apoptotic bodies were removed by low and medium speed centrifugation (as in steps 1–2 shown in Figure 1a).
Figure 3—figure supplement 4
MiR-122 co-fractionates with the vHD sub-population.
(a) Iodixanol linear gradient showing the distribution of EV and non-vesicular RNP markers. (b) Quantification of miR-122 by qPCR across the linear gradient. The majority of MiR-122 co-fractionates with the vHD subpopulation. (c) Quantification of individual proteins as in a and miR-122 as in b across the gradient. The black line delineates the maximum signal across the gradient showing the three distinct components. The first, second and third peak represent the vLD, vHD and non-vesicular RNP fractions.
Figure 4 with 2 supplements
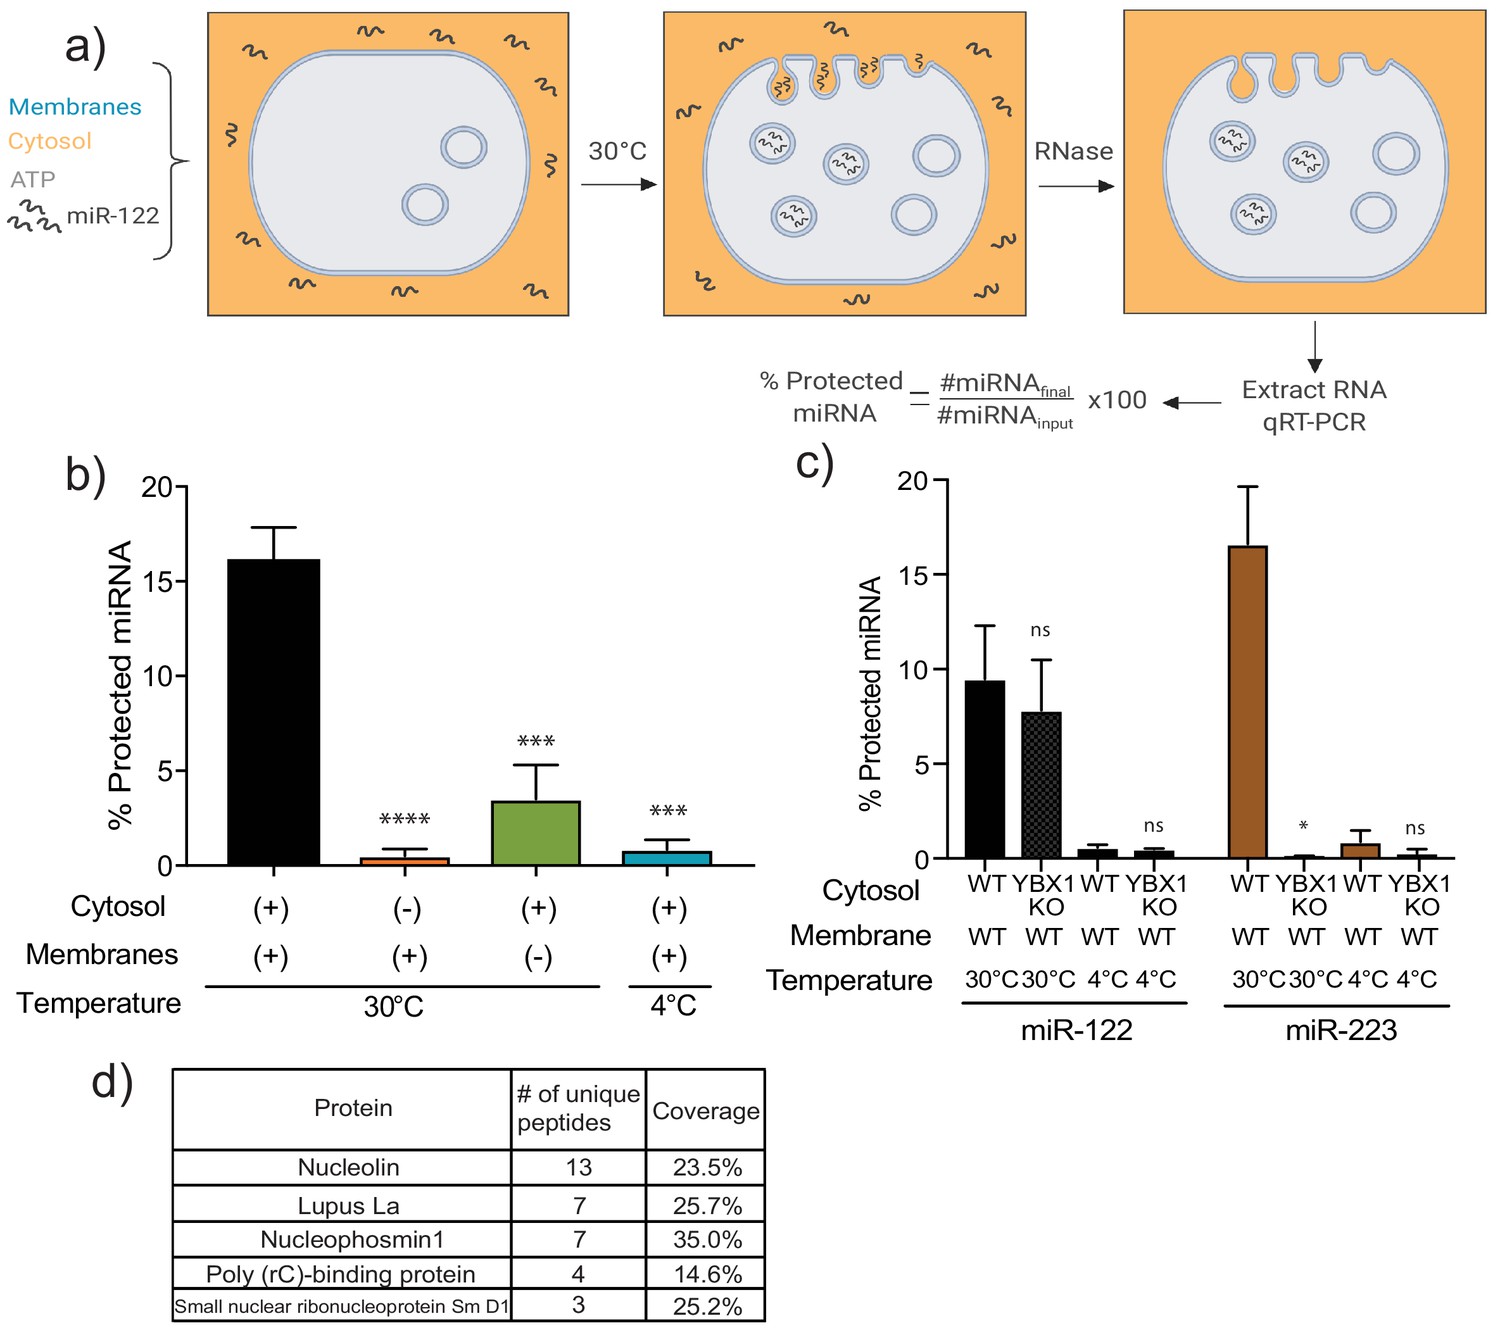
MiR-122 packaging is recapitulated in a cell-free reaction.
(a) Schematic depicting the in vitro packaging reaction. Image reproduced from the original manuscript developing the cell-free reconstitution assay (Shurtleff et al., 2016). (b) Quantification of the in vitro packaging reaction of miR-122. Reactions with or without membranes (15,000xg pellet), cytosol (150,000xg supernatant) prepared from MDA-MB-231 cells and incubated at 30°C or 4°C are shown. Data plotted are from three independent experiments, each independent experiment with triplicate qPCR reactions; error bars represent standard deviation from independent samples. (c) Quantification of the in vitro packaging of miR-122 and miR-223. Cytosols from WT or YBX1 KO HEK293T cells were used. Incubations at 30°C or 4°C are shown. Data plotted are from two independent experiments, each independent experiment with triplicate qPCR reactions; error bars represent standard deviation from independent samples. (d) List of RNA binding proteins pulled down with biotinylated miR-122 after a modified in vitro packaging reaction was performed (see Materials and methods). Statistical significance was performed using Student’s t-test (*p<0.05, ***p<0.001, ****p<0.0001, ns = not significant).
Figure 4—figure supplement 1
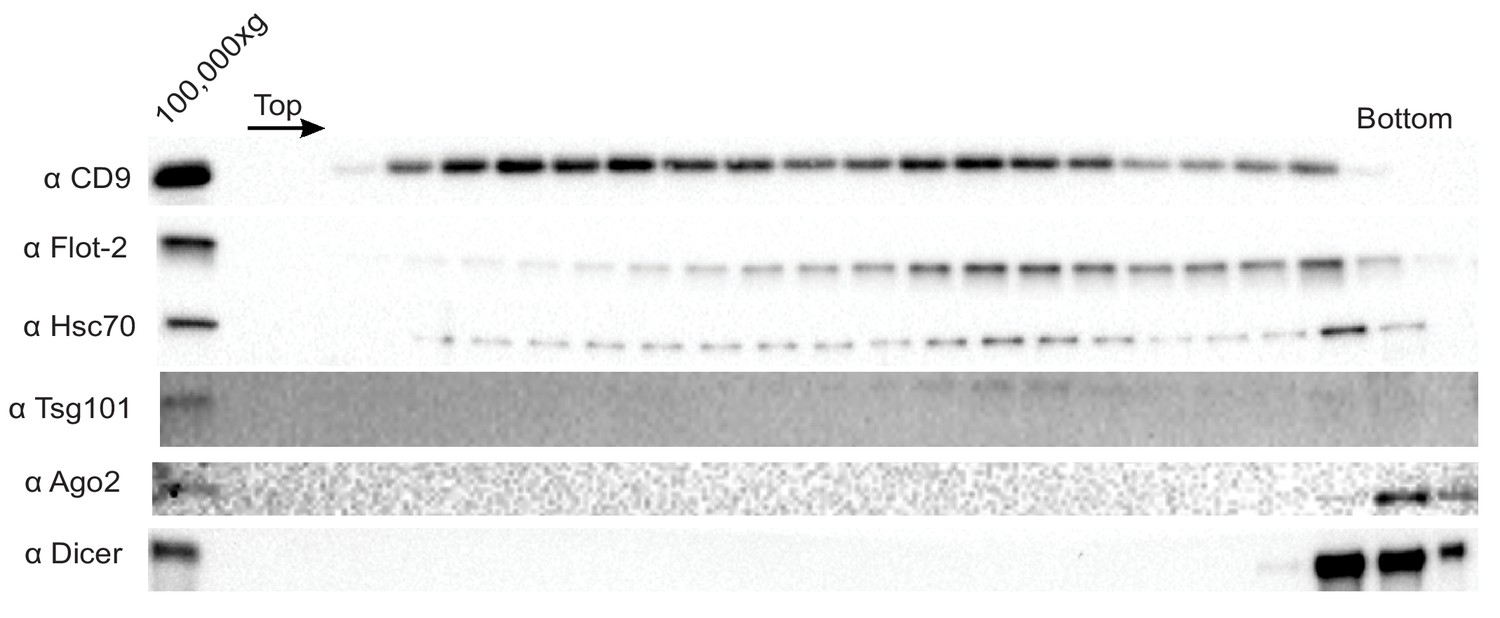
Ago2 and Dicer are not sEV-associated in MB-MDA-231 cells.
Immunoblot for sEV markers across the linear ioxidanol gradient as depicted in Figure 1a, except that the sucrose cushion step to sediment and concentrate the vesicles was not included. Therefore the amount of sedimentable material subjected to flotation was diminished.
Figure 4—figure supplement 2
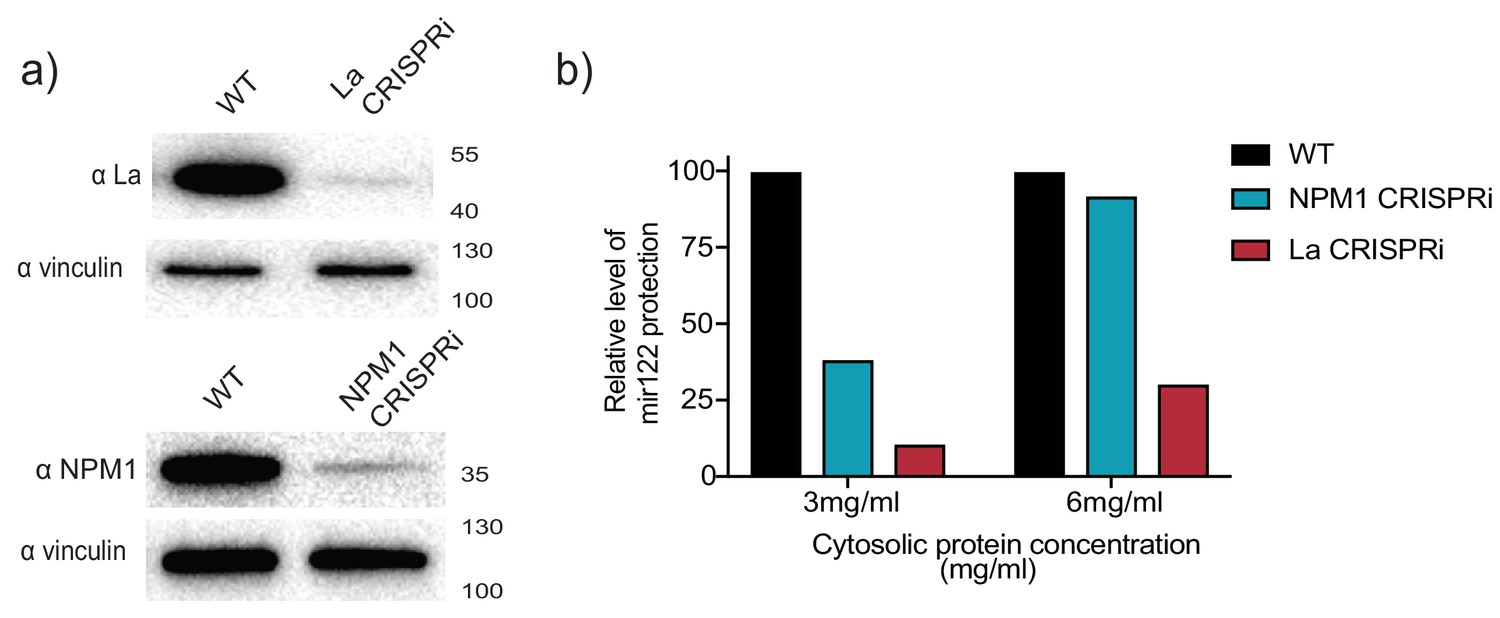
CRISPRi efficiently depletes the RNA binding protein candidates.
(a) Analysis of RBP depletion by immunoblots. Immunoblots for La, NPM1 and vinculin are shown. (b) Relative quantification of miR-122 in vitro packaging. Cytosols from WT, La or NPM1-depleted backgrounds were tested in the reactions (cytosols from (a) were used). Two cytosolic protein concentrations were tested: 3 and 6 mg/ml.
Figure 5 with 1 supplement

Sorting of miR-122 into EVs in vitro requires La.
(a) Quantification of miR-122 in vitro packaging. WT and La-depleted cytosols were titrated from 1.5 to 6 mg/ml. Data plotted are from two independent experiments, each independent experiment with triplicate qPCR reactions; error bars represent standard deviation from independent samples. (b) Heterologously expressed La rescues miR-122 in vitro packaging. Quantification of miR-122 in vitro packaging is shown. Cytosols from WT or La-depleted cells with or without complementation using purified La were used. Reactions without cytosol, with or without membranes and with added purified La are also shown. Data plotted are from three independent experiments, each independent experiment with triplicate qPCR reactions; error bars represent standard deviation from independent samples. (c) Immunoblots showing the levels of endogenous or heterologously expressed added La used in the in vitro reactions as in (b) are shown. (d) Immunoblots for La following miR-122 in vitro packaging performed as for Figure 3d according to the conditions indicated. Statistical significance was performed using Student’s t-test (**p<0.01, ns = not significant).
Figure 5—figure supplement 1
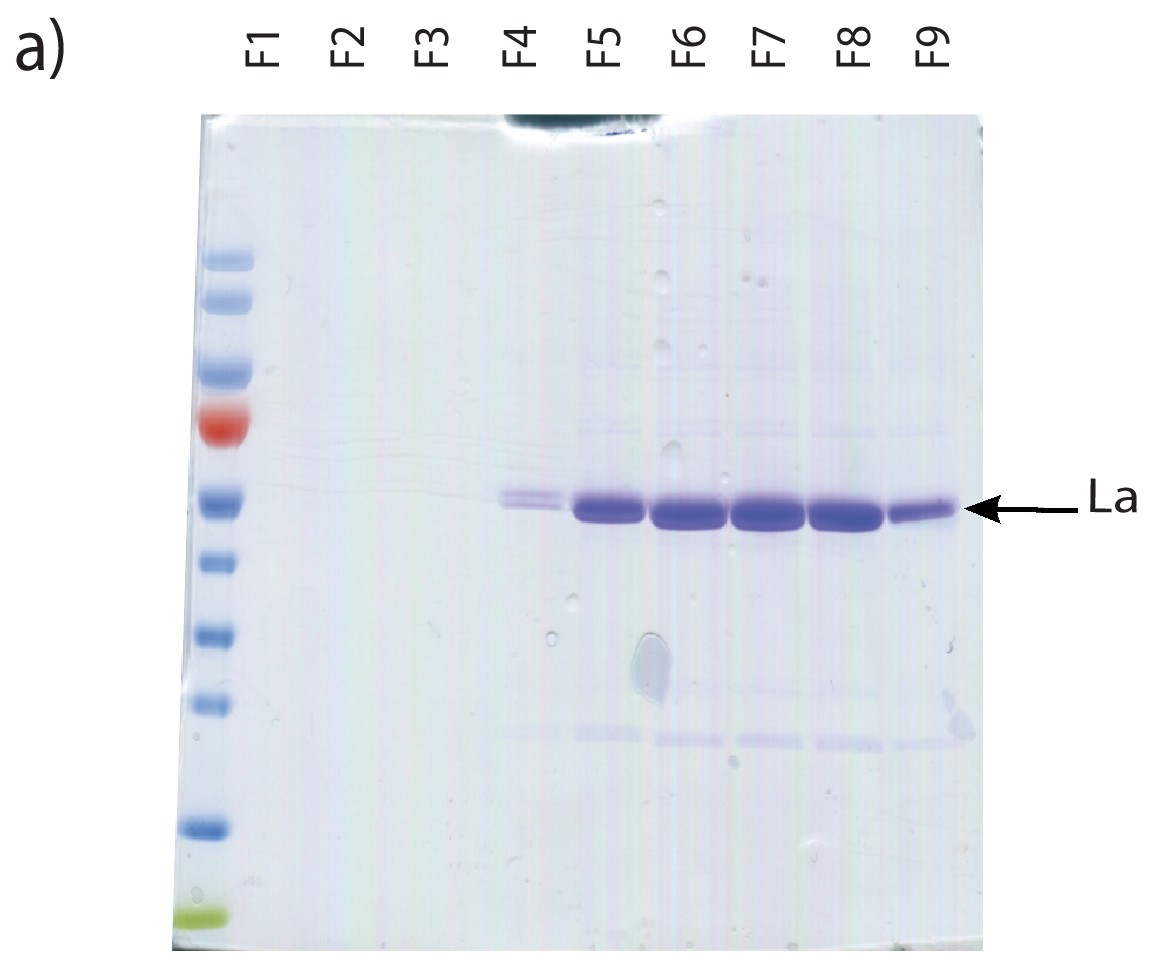
Purification of heterologously expressed La.
Coomassie staining of purified La fractions. Fractions shown were collected post gel filtration on Sephadex G25 columns.
Figure 6 with 1 supplement
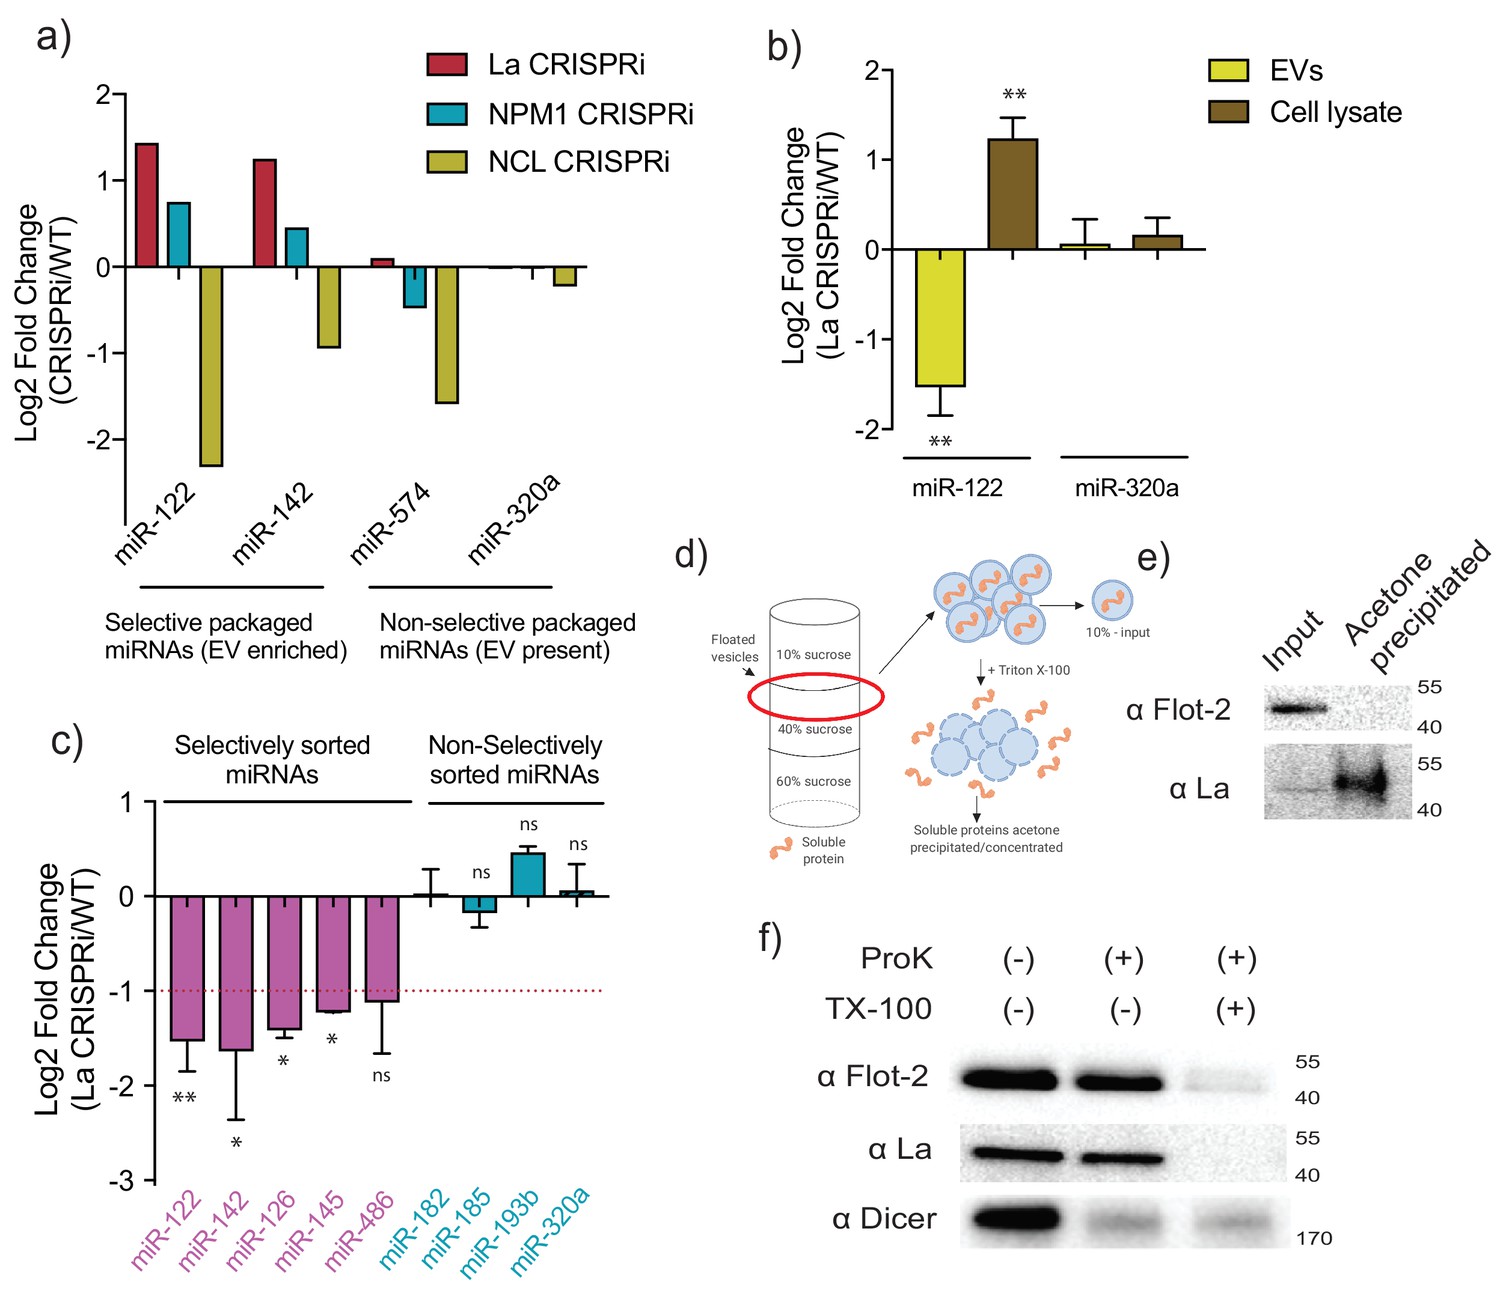
MiR-122 sorting into sEVs requires La in vivo.
(a) Log2 fold change for intracellular levels of miRNAs of interest post-depletion of the shown RBPs by CRISPRi. MiR-122 and miR-142 were used as representatives of selectively packaged miRNAs. MiR-574 and miR-320a were used as representatives of non-selectively packaged miRNAs. Data quantified by RT-qPCR, normalized per ng of total RNA. (b) Log2 fold change of intracellular and secreted levels of miRNAs of interest quantified by RT-qPCR. sEVs were purified from WT and La-depleted cells. Cellular lysates were isolated at the moment of EV collection. MiR-320a was used as a control for non-selectively packaged miRNAs. Data plotted are from three independent experiments (biological replicates); each independent experiment with triplicate qPCR reactions, error bars represent standard deviation from independent samples. (c) Log2 fold change of secreted levels of miRNAs of interest quantified by RT-qPCR. sEVs were purified from WT and La-depleted cells. MiRNAs in pink represent miRNAs selectively sorted into vHD sEVs, miRNAs in blue represent non-selectively sorted miRNAs present in both vLD and vHD sEVs. Data plotted are from three independent experiments (biological replicates) for miR-122, miR-142 and miR-320a and from two independent experiments (biological replicates) for the rest; each independent experiment with triplicate qPCR reactions; error bars represent standard deviation from independent samples. (d) Schematic representation of the flotation assay and acetone precipitation as in (e). The high-speed pellet of conditioned medium was floated in a step sucrose gradient (input) and the soluble content was released by the addition of TX-100 and then concentrated by acetone precipitation (acetone precipitated). (e) sEV samples post-flotation and acetone precipitation/concentration were tested. Immunoblots for flotillin-2 and La are shown. Acetone precipitation captures mostly soluble proteins (Feist and Hummon, 2015), thus flotillin-2 is only detectable in the floated sample, prior to acetone precipitation, whereas La detection improves post precipitation/concentration. (f) Proteinase K protection assays in high-speed pellet fractions. Samples were treated with or without proteinase K and or Triton X-100. Immunoblots for flotillin-2, La and Dicer are shown. Statistical significance was performed using Student’s t-test (*p<0.05, **p<0.01, ns = not significant).
Figure 6—figure supplement 1
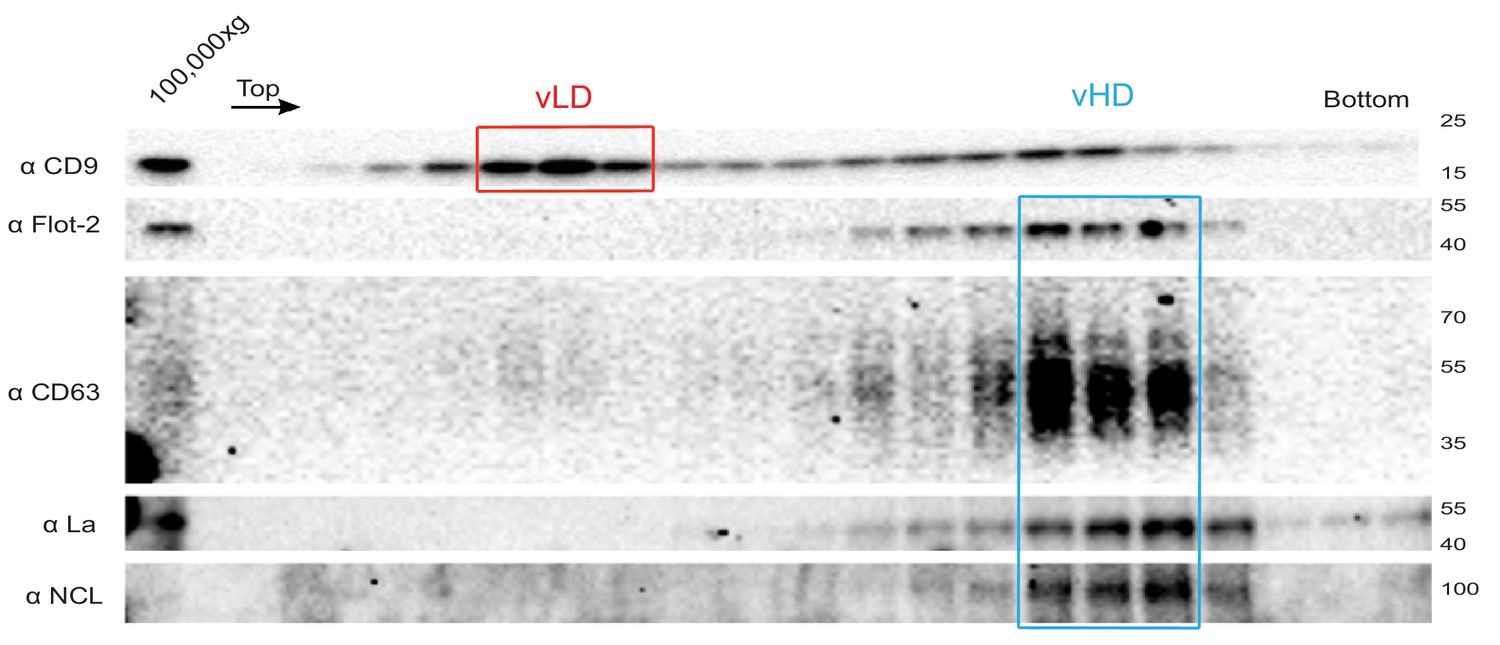
The La protein co-fractionates with the vHD sub-population.
Immunoblots across the optiprep linear gradient for classical sEV markers as well as for La and nucleolin are shown.
Figure 7 with 3 supplements
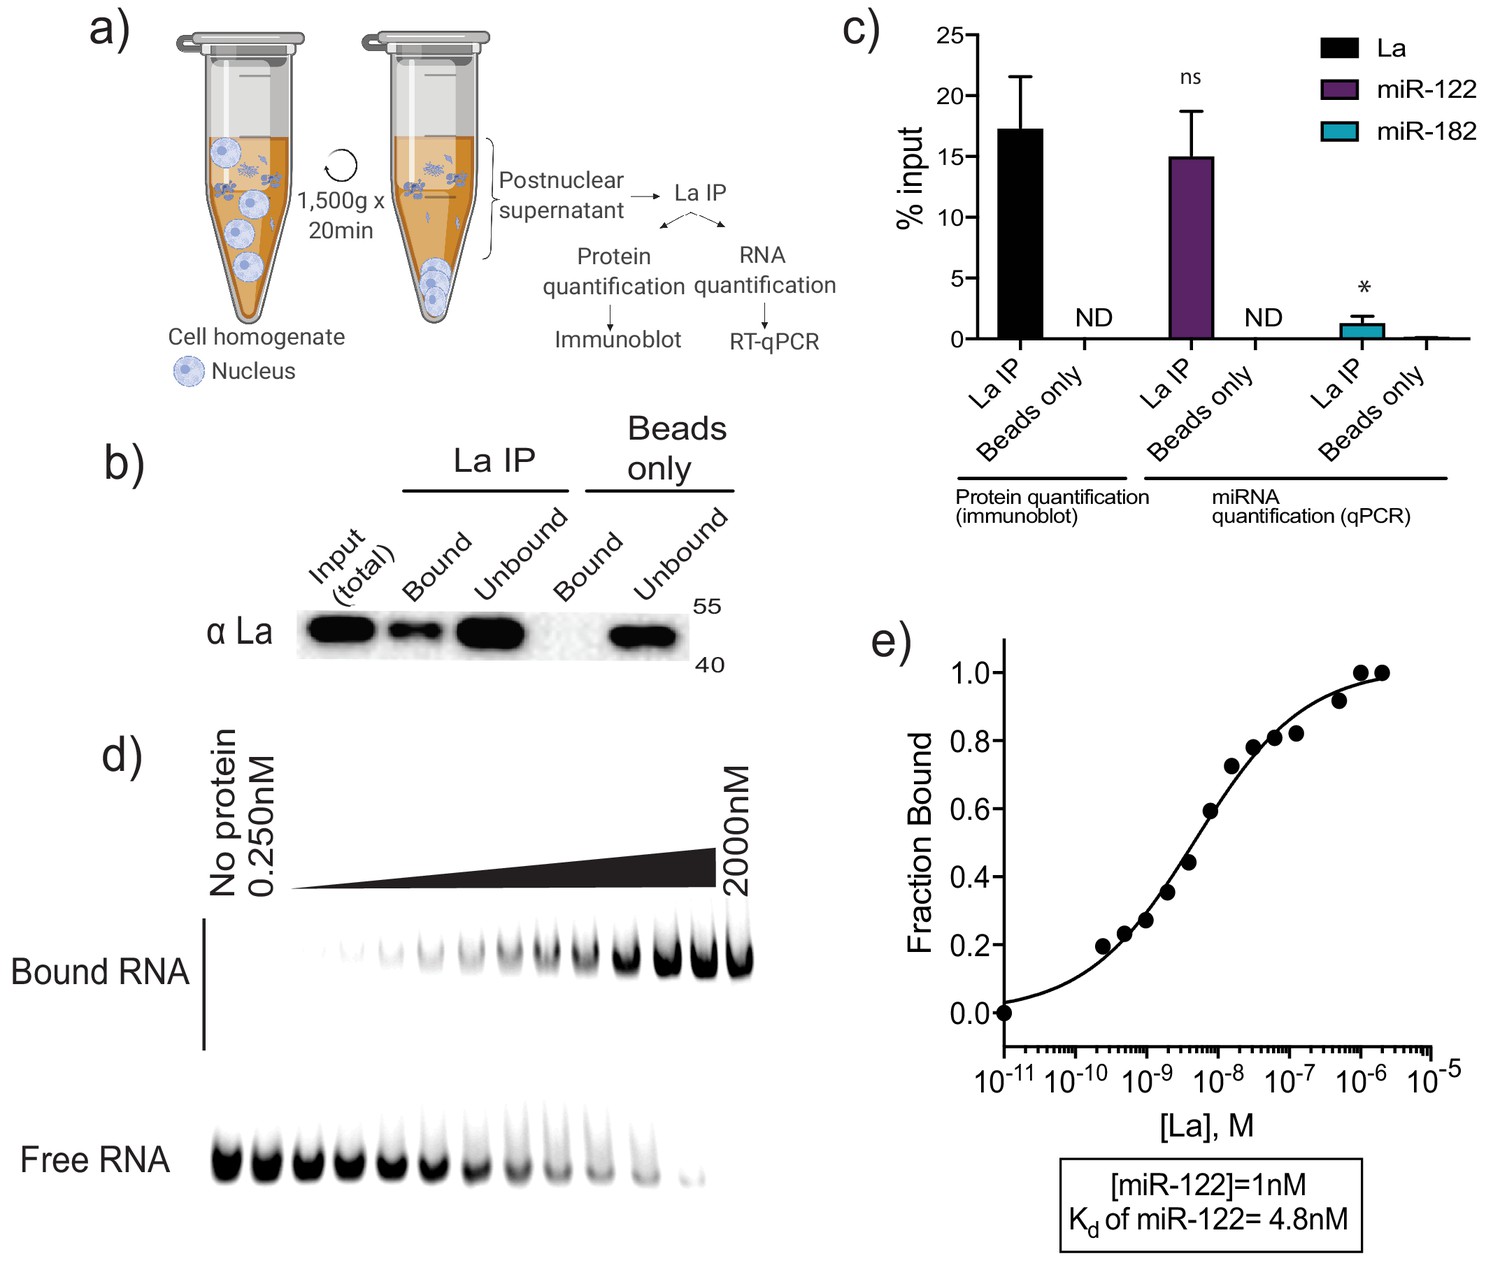
La interacts with miR-122 in vitro and in vivo.
(a) Schematic representing immunoprecipitation of endogenous La shown in (b) and (c). (b) Immunoblot for La post-La IP. (c) Quantification of the La immunoblot post La IP. The relative levels, as percentage of input, of miR-122 and miR-182 co-IP with La are also shown. MiR-182, a non-selectively sorted miRNA, served as a negative control for La binding. Data plotted are from two independent experiments (biological replicates), for qPCR data each independent experiment with triplicate qPCR reactions; error bars represent standard deviation from independent samples. (d) EMSA assays using 5’ fluorescently labeled miR-122. Purified La was titrated from 250 pM to 2 μM. In gel fluorescence was detected. (e) Quantification of (d) showing the calculated Kd. Fraction bound was quantified as a function of exhaustion of free miRNA. Statistical significance was performed using Student’s t-test (*p<0.05, ns = not significant).
Figure 7—figure supplement 1

Detection of nuclear and cytoplasmic La by immunofluorescence.
(a) Immunofluorescence for endogenous La was performed. WT and La-depleted cells were fixed and permeabilized with 0.1% Triton X-100. La and DAPI staining are shown. (b) Cells with arrows in (a) are shown side by side to confirm antibody specificity.
Figure 7—figure supplement 2

La associates with Rab7-positive vesicles.
(a) Immunofluorescence for endogenous La and Rab7 was performed. WT cells were fixed and permeabilized with 0.02% saponin in order to preserve the nuclear envelope intact and avoid detection of nuclear La. (b) Structured illumination microscopy (SIM) was used to achieve higher resolution.
Figure 7—figure supplement 3
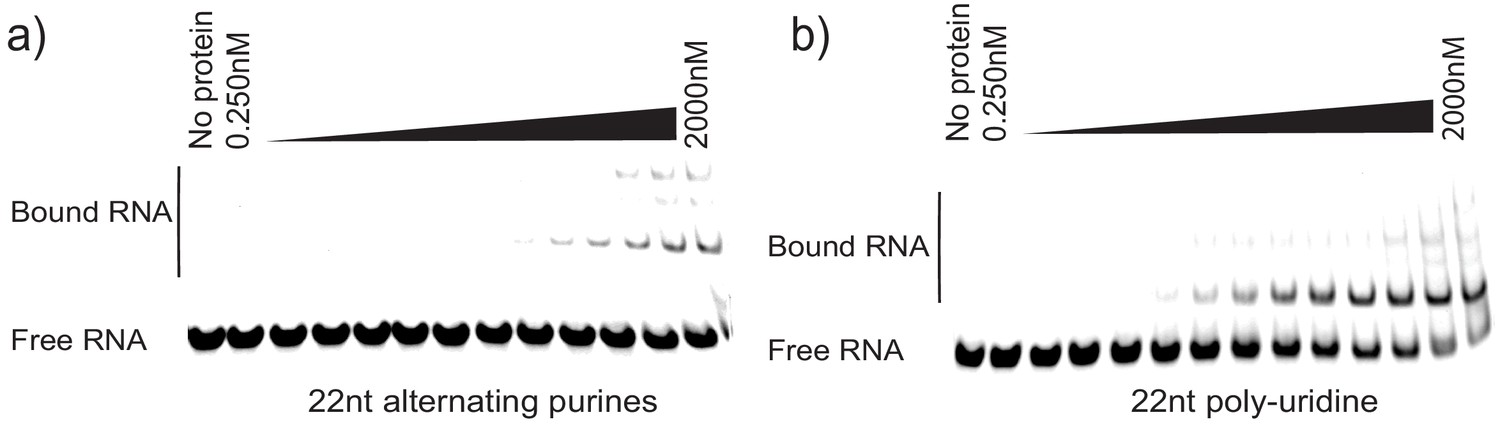
Controls for La specificity during EMSA.
(a) 22nt RNA oligonucleotide consisting of alternating purines was incubated with different concentrations of purified La. Negative control for binding. (b) 22nt poly-uridine oligonucleotide was incubated with different concentrations of purified La as a positive control for binding.
Figure 8 with 1 supplement

A bipartite motif in miR-122 is required for its packaging and interaction with La in vitro.
(a) The sequences of miR-122 WT and mutated versions are shown. (b) Quantification of in vitro packaging of miR-122 WT and mutated versions. Data plotted are from three independent experiments, each with triplicate qPCR reactions; error bars represent standard deviation from independent samples. (c) Binding affinity curves (as calculated from EMSAs) for miR-122 and the mutated versions are shown. Fraction bound was quantified as a function of exhaustion of free miRNA. Statistical significance was performed using Student’s t-test (**p<0.01).
Figure 8—figure supplement 1
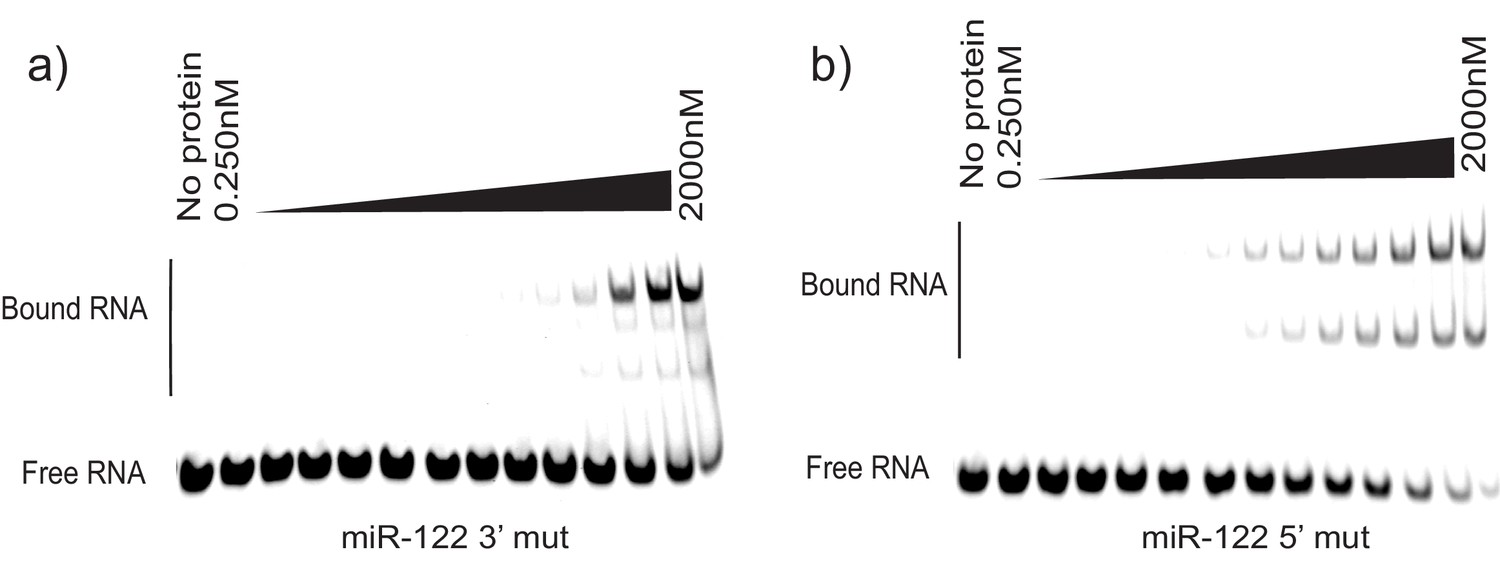
EMSA for miR-122 mutated versions.
(a) miR-122 3’ mutated oligonucleotide incubated with increasing amounts of La. (b) miR-122 5’ mutated oligonucleotide incubated with increasing amounts of La.
Figure 9
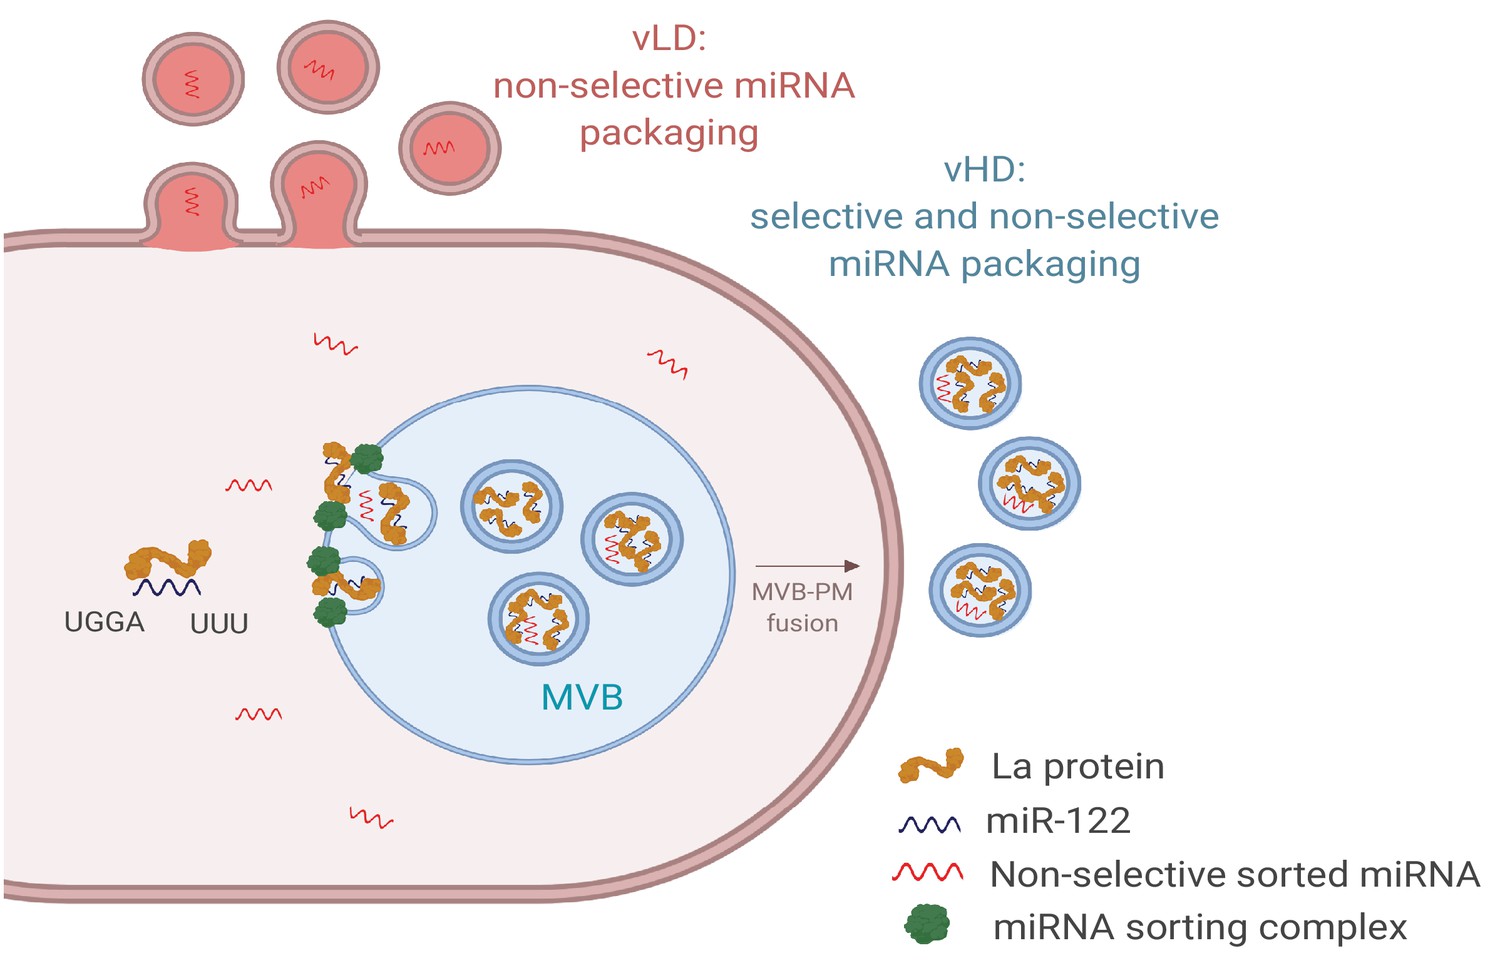
Diagram representing the current model of miRNA sorting into extracellular vesicles derived from MDA-MB-231 cells.
At least one vesicular species within the vHD sub-population has its origin in the endocytic pathway, representing the classical exosomes. We propose a selective mechanism of miRNA sorting occurring at the site of vHD vesicle biogenesis where La, along with bound miR-122 (which interaction is mediated by at least two RNA motifs), is targeted for capture into a bud invaginating into the interior of an endosome. vLD vesicles may originate at the plasma membrane, representing shedding vesicles. There may be no selective miRNA sorting occurring at the site of vLD vesicle biogenesis. Non-selective miRNA sorting occurs in both the vHD and vLD sub-populations. MVB: multivesicular body, PM: plasma membrane.
Author response image 1
Author response image 2
Tables
Key resources table
| Reagent type (species) or resource | Designation | Source or reference | Identifiers | Additional information |
|---|---|---|---|---|
| Gene (Homo sapiens - Ssb) | La | Addgene | RRID:Addgene_38241 | N/A |
| Antibody | anti-La (mouse monoclonal) | Origene Technologies | RRID: AB_2239866 | IF 1:100. WB: 1:1000 |
| Antibody | anti-Rab7 (goat polyclonal) | Santa Cruz | RRID: AB_2175486 | IF 1:100 |
| Antibody | anti-CD63 (mouse monoclonal) | Developmental Studies Hybridoma Bank | RRID: AB_528158 | IF 1:100 |
| Antibody | anti-CD9 (mouse monoclonal) | Biolegend | RRID: AB_314907 | IF 1:100 |
| Antibody | Anti-ITGA3 (rabbit polyclonal) | Abcam | RRID: AB_2810979 | WB 1:1000 |
| Antibody | anti-MFGE-8 (mouse monoclonal) | R and D systems | RRID: AB_2142466 | WB 1:1000 |
| Antibody | anti-Flot-2 (mouse monoclonal) | BD biosciences | RRID: AB_397766 | WB 1:1000 |
| Antibody | anti-Tsg101 (mouse monoclonal) | GeneTex | RRID: AB_373239 | WB 1:1000 |
| Antibody | anti-CD63 (mouse monoclonal) | BD biosciences | RRID: AB_396297 | WB 1:1000 |
| Antibody | anti-Ago2 (rabbit monoclonal) | Cell signaling | RRID: AB_2096291 | WB 1:1000 |
| Antibody | anti-Ago2 (rabbit monoclonal) | Abcam | RRID: AB_2713978 | WB 1:1000 |
| Antibody | anti-dicer (rabbit polyclonal) | Santa cruz | RRID: AB_639122 | WB 1:1000 |
| Antibody | anti-vinculin (rabbit monoclonal) | Abcam | RRID: AB_11144129 | WB 1:1000 |
| Antibody | anti-Rab27a (mouse monoclonal) | Abcam | RRID: AB_945112 | WB 1:1000 |
| Antibody | anti-nucleophosmin (mouse monoclonal) | Abcam | RRID: AB_297271 | WB 1:1000 |
| Antibody | anti-nucleolin (rabbit polyclonal) | Abcam | RRID: AB_776878 | WB 1:1000 |
| Antibody | anti-Hsc70 (rabbit monoclonal) | Abcam | RRID: AB_444764 | WB 1:1000 |
| Antibody | anti-tubulin (mouse monoclonal) | Abcam | RRID: AB_2241126 | WB 1:1000 |
| Cell line (Spodoptera frugiperda) | Sf9 | Other | N/A | Cell culture facility at UC Berkeley |
| Cell line (Homo sapiens) | MDA-MB-231 | Other | N/A | Cell culture facility at UC Berkeley |
| Cell line (Homo sapiens) | MDA-MB-231 Rab27a KO | This study | N/A | Obtained by CRISPR-Cas9 |
| Cell line (Homo sapiens) | MDA-MB-231 Rab35 KO | This study | N/A | Obtained by CRISPR-Cas9 |
| Recombinant DNA reagent | UCOE- EF1a-dCas9-BFP-KRAB (plasmid) | N/A | N/A | Dr. Jonathan Weissman (University of California, San Francisco) |
| Recombinant DNA reagent | EF1Alpha-puro-T2A-BFP (plasmid) | Addgene | RRID:Addgene_60955 | N/A |
| Software, algorithm | GO term finder | N/A | RRID:SCR_008870 | N/A |
| Software, algorithm | REVIGO | N/A | RRID:SCR_005825 | N/A |
| Software, algorithm | mirDeep | N/A | RRID:SCR_010829 | N/A |
| Software, algorithm | HISAT2 | N/A | RRID:SCR_015530 | N/A |
| Software, algorithm | Bowtie | N/A | RRID:SCR_005476 | N/A |
| Software, algorithm | Samtools | N/A | RRID:SCR_002105 | N/A |
| Software, algorithm | Bedtools | N/A | RRID:SCR_006646 | N/A |
| Peptide, recombinant protein (enzyme) | TGIRT-III Enzyme | InGex | N/A | See Materials and methods for further details. |
Additional files
-
Transparent reporting form
- https://doi.org/10.7554/eLife.47544.026
Download links
A two-part list of links to download the article, or parts of the article, in various formats.
Downloads (link to download the article as PDF)
Open citations (links to open the citations from this article in various online reference manager services)
Cite this article (links to download the citations from this article in formats compatible with various reference manager tools)
Distinct mechanisms of microRNA sorting into cancer cell-derived extracellular vesicle subtypes
eLife 8:e47544.
https://doi.org/10.7554/eLife.47544


