Transverse tubule remodeling enhances Orai1-dependent Ca2+ entry in skeletal muscle
- University of Rochester School of Medicine and Dentistry, United States
- University Gabriele d'Annunzio, Italy
Figures
Figure 1 with 1 supplement
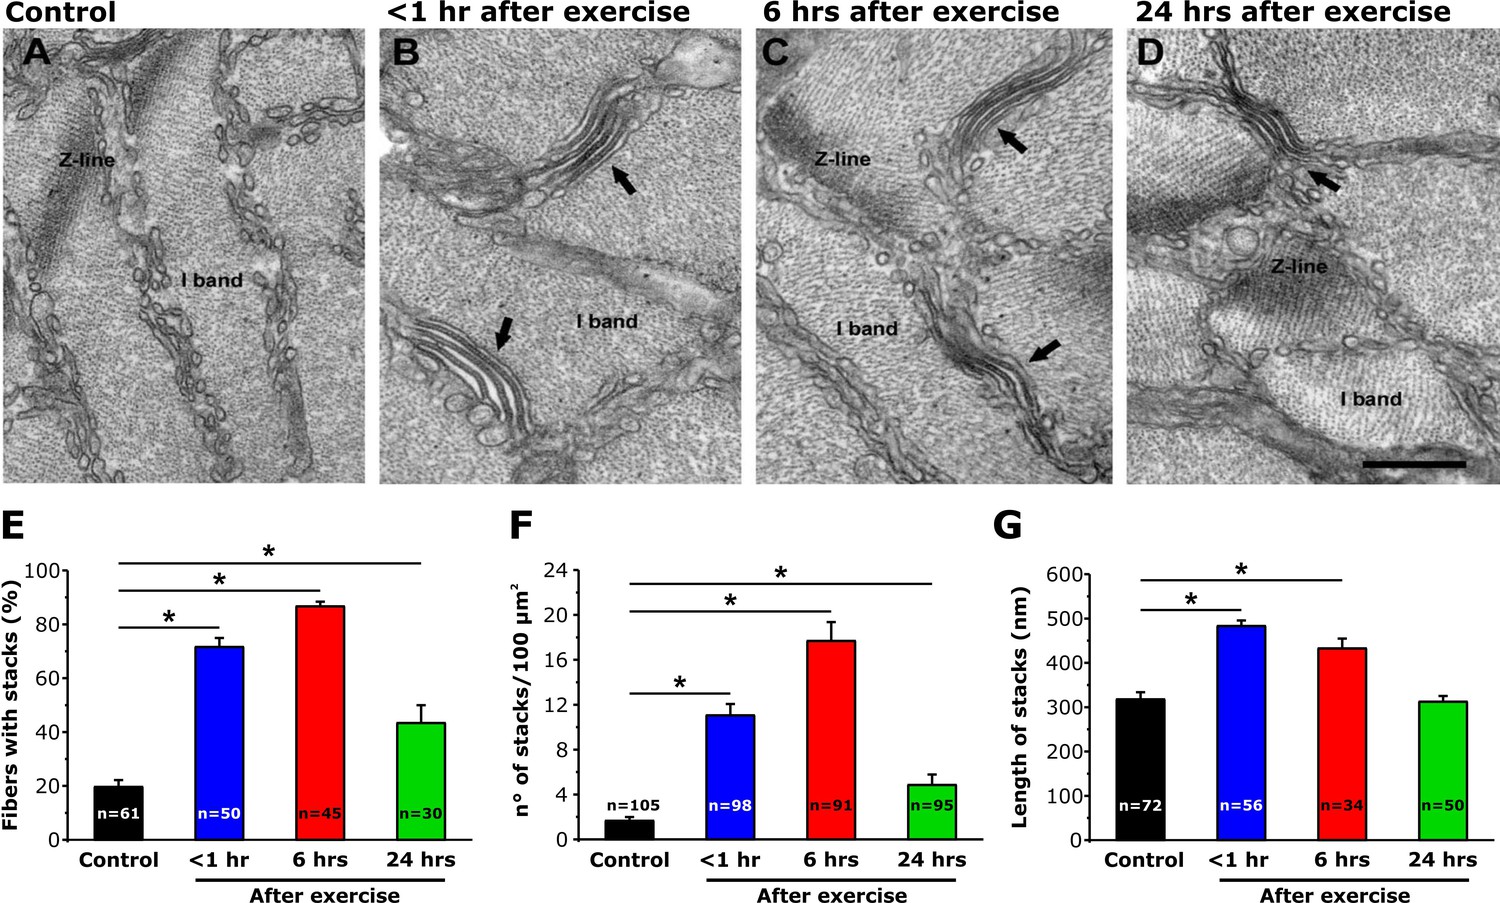
SR-stack incidence, number/area, and length after exercise.
(A–D) Representative EM images of cross sections (in proximity of I band) of EDL muscle fibers from control mice (A) and from mice < 1 hr (B), 6 hr (C), and 24 hr (D) after acute treadmill exercise (empty arrows point to stacks of SR membranes). (E) Percentage of muscle fibers exhibiting SR-stacks. (F) Number of SR stacks per 100 μm2 of cross sectional area. (G) SR-stack length. Numbers in bars (n) indicate the number of fibers analyzed. Number of mice used: Control, n = 4;<1 hr after exercise, n = 4; 6 hr after exercise, n = 4; 24 hr after exercise, n = 3; *p<0.05. Data are shown as mean ± SEM.
Figure 1—figure supplement 1
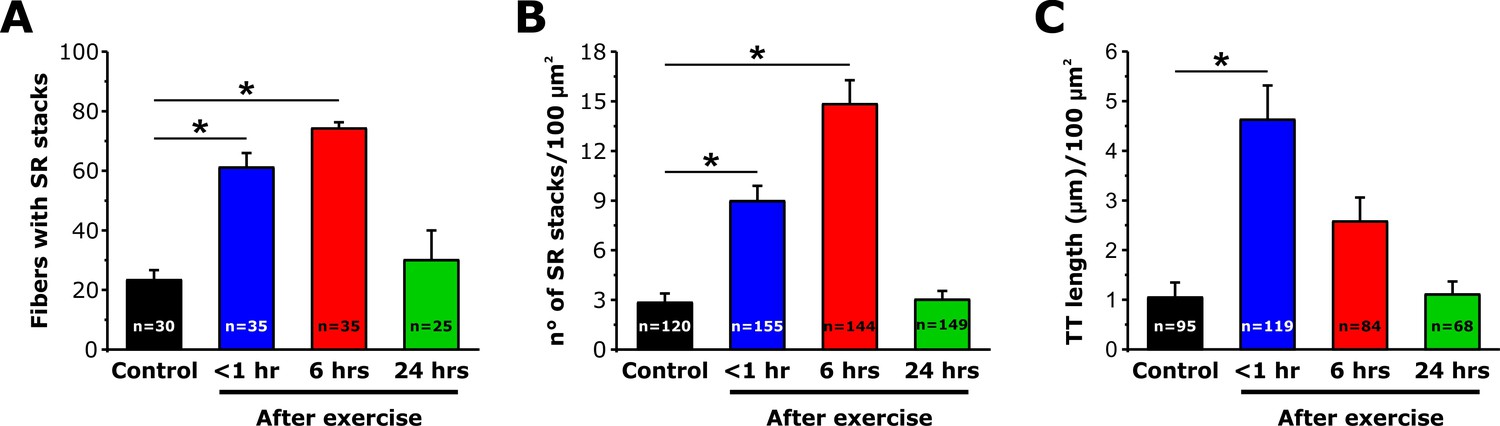
SR-stack incidence, number/area, and T-tubule length after exercise.
Quantitative analysis of the percentage of muscle fibers exhibiting SR stacks (A), number of SR stacks per 100 μm2 of cross sectional area (B), and TT length in the I band (μm/100 μm2 of cross sectional area) (C) determined from EM images of fibers from fixed FDB muscles from control mice and mice < 1 hr, 6 hr, and 24 hr after acute treadmill exercise. Numbers in bars (n) indicate the number of FDB fibers analyzed. Number of mice used: Control, n = 3;<1 hr after exercise, n = 3; 6 hr after exercise, n = 4; 24 hr after exercise, n = 3; *p<0.05. Data are shown as mean ± SEM.
Figure 2

TT extension at the I band after exercise.
(A–D) Representative EM images of cross sections (in proximity of the I band) of EDL muscle fibers from control mice (A) and from mice < 1 hr (B), 6 hr (C), and 24 hr (D) after acute treadmill exercise (empty arrows point to SR-stacks, while black arrows point to TT extensions which are stained in black with ferrocyanide precipitate). (E and F) Quantitative analysis of TT-SR contact length (E) and total TT length (F) within the I band (μm/100 μm2 of cross sectional area). Numbers in bars (n) indicate the number of EDL fibers analyzed. Number of mice used: Control, n = 4;<1 hr after exercise, n = 4; 6 hr after exercise, n = 4; 24 hr after exercise, n = 3; *p<0.05. Data are shown as mean ± SEM.
Figure 3

Effect of exercise on the maximum rate of Mn2+ quench following store depletion.
(A) Representative traces of fura-2 fluorescence during application of 0.5 mM Mn2+recorded in FDB fibers following store depletion with 1 μM thapsigargin + 15 μM cyclopiazonic acid (+depletion) isolated from control mice and from mice < 1 hr, 6 hr, and 24 hr after acute treadmill exercise. (B) Quantitative analysis of the maximum rate of Mn2+ quench following store depletion. (C) Frequency histogram of percentage of fibers exhibiting different levels of maximal rate of Mn2+ quench. Histogram data were fit with a single Gaussian distribution. Numbers in bars (n) reflect the number of FDB fibers analyzed. Number of mice used: Control, n = 5;<1 hr after exercise, n = 5; 6 hr after exercise, n = 3; 24 hr after exercise, n = 3; *p<0.05. Data are shown as mean ± SEM.
Figure 4 with 1 supplement

Effect of exercise on the maximum rate of Mn2+ quench in the absence of store depletion.
(A) Representative traces of fura-2 fluorescence during application of 0.5 mM Mn2+ recorded in FDB fibers in the absence of store depletion (-depletion) isolated from control mice and from mice < 1 hr, 6 hr, and 24 hr after acute treadmill exercise. (B) Quantitative analysis of the maximum rate of Mn2+ quench in the absence of store depletion. (C) Frequency histogram of percentage of fibers exhibiting different levels of maximal rate of Mn2+ quench. Histogram data were fit with a single Gaussian distribution. Numbers in bars (n) reflect the number of FDB fibers analyzed. Numbers in bars (n) reflect the number of FDB fibers analyzed. Number of mice used: Control, n = 5;<1 hr after exercise, n = 5; 6 hr after exercise, n = 3; 24 hr after exercise, n = 3; *p<0.05. Data are shown as mean ± SEM.
Figure 4—figure supplement 1
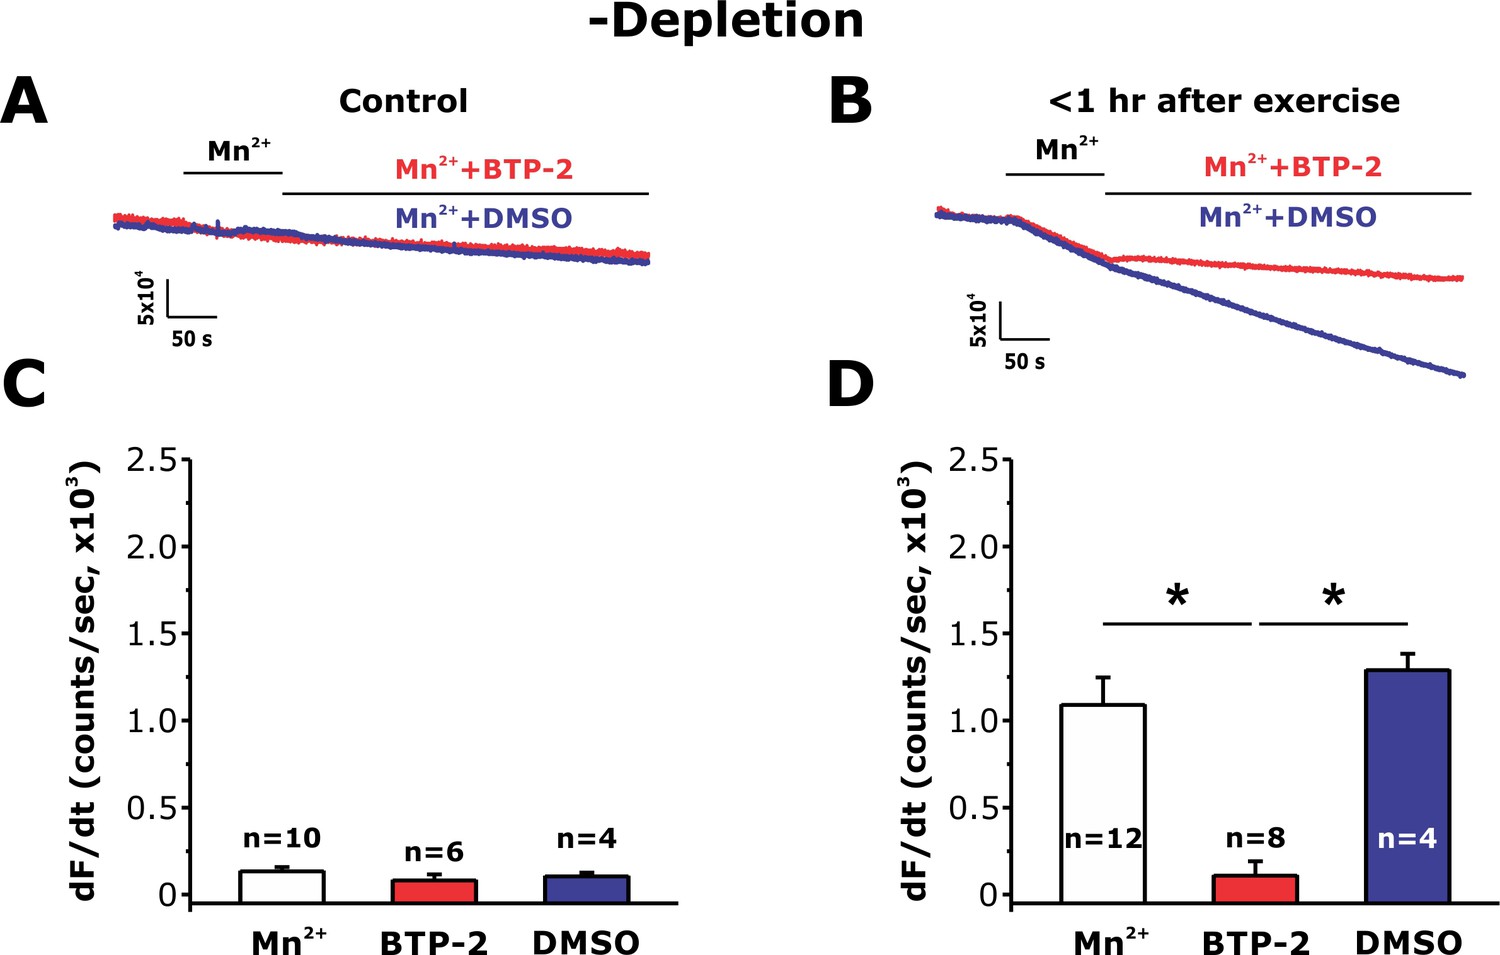
Sensitivity of constitutive Mn2+ quench in non-depleted FDB fibers after exercise to SOCE inhibitor BTP-2.
(A and B) Representative traces of fura-2 fluorescence during application of 0.5 mM Mn2+ and then 0.5 mM Mn2+ supplemented with either DMSO vehicle (blue traces) or 10 μM BTP-2 (red traces) in FDB fibers in the absence of store depletion (-depletion) isolated from control mice and from mice < 1 hr after acute treadmill exercise. (C and D) Quantitative analysis of the maximum rate of Mn2+ quench calculated for FDB fibers from control mice (C) and from mice < 1 hr after acute treadmill exercise (D). Numbers in bars (n) reflect the number of FDB fibers analyzed. Number of mice used: Control, n = 3;<1 hr after exercise, n = 3; *p<0.05. Data are shown as mean ± SEM.
Figure 5 with 3 supplements
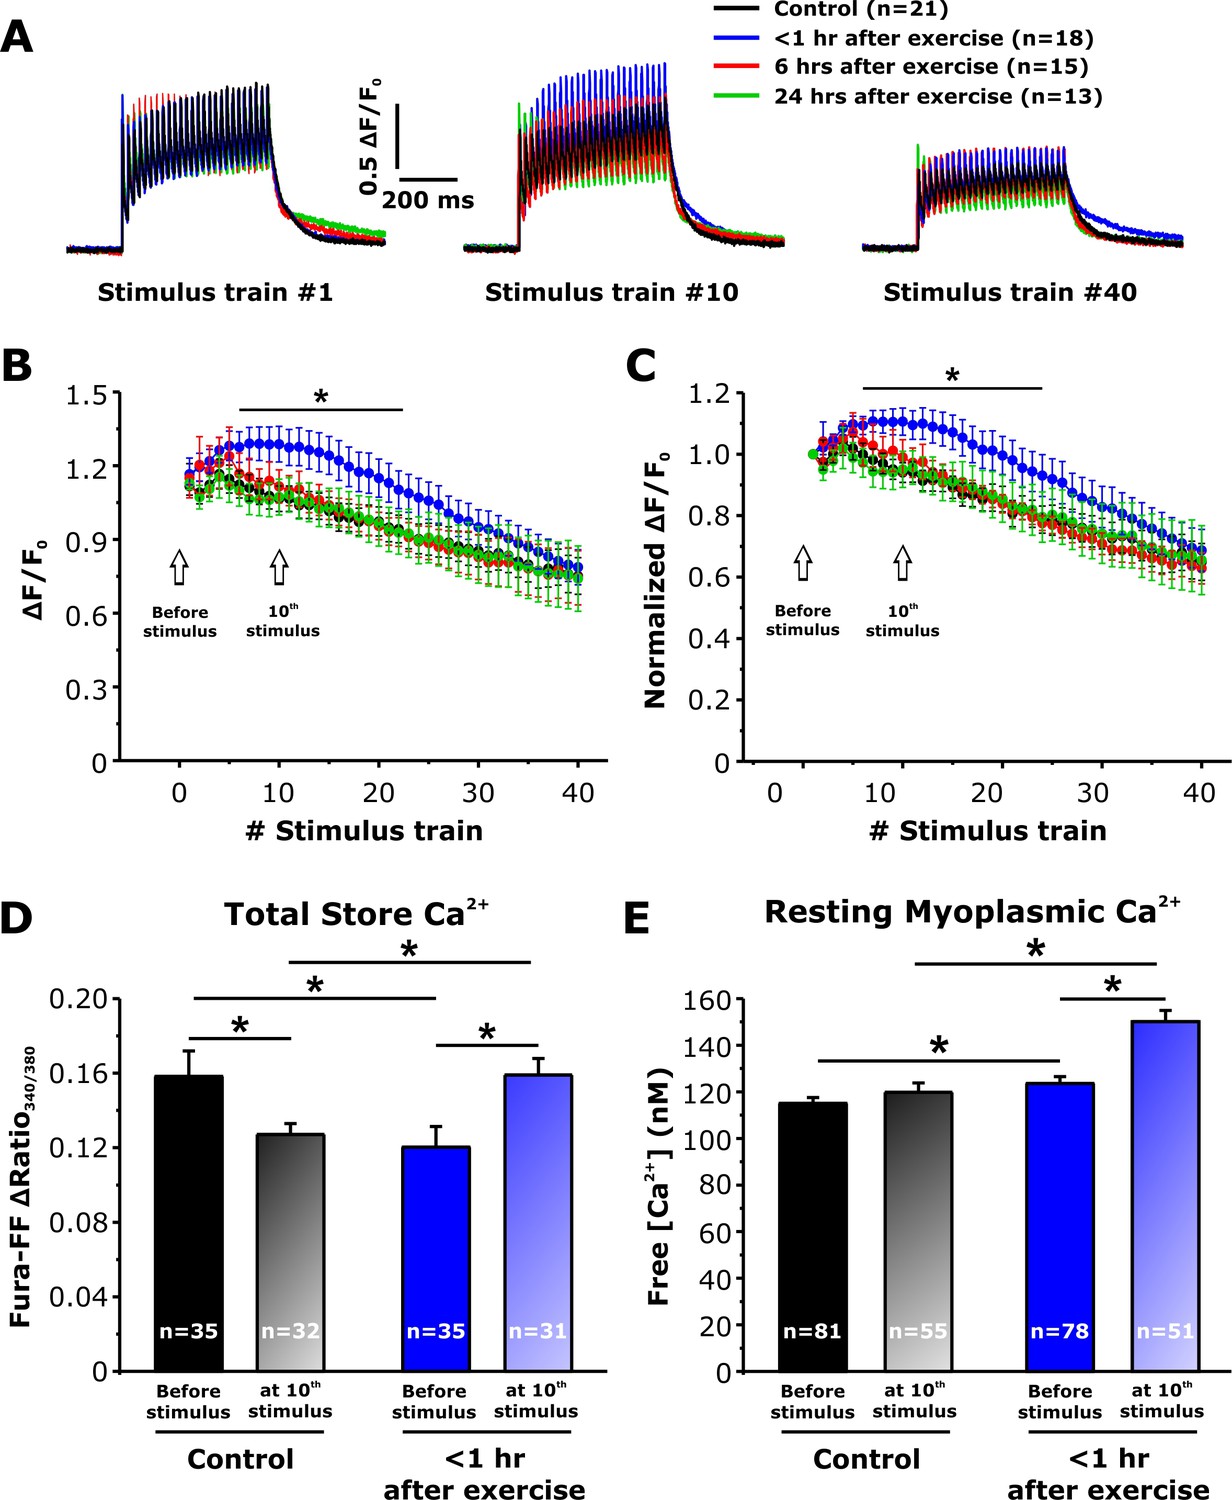
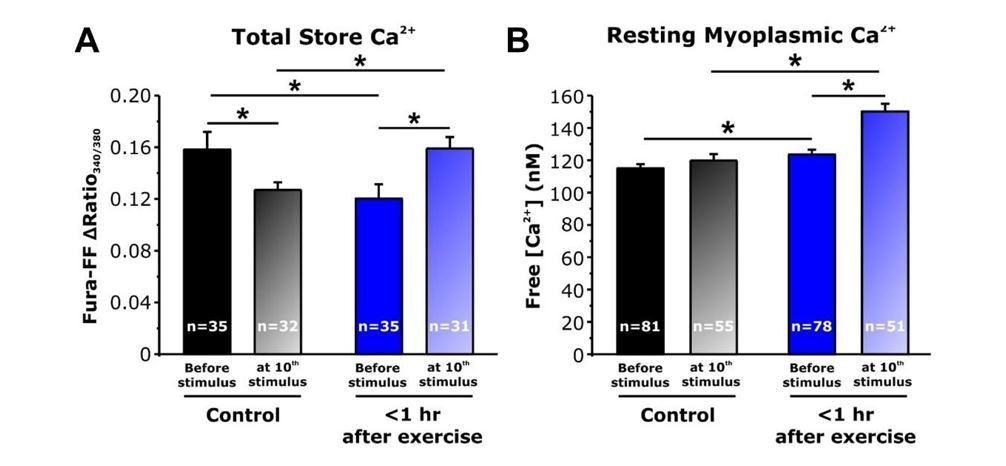
Effect of exercise on peak Ca2+ transient amplitude during repetitive, high-frequency stimulation.
(A) Representative superimposed relative (ΔF/F0) mag-fluo-4 traces during the 1st, 10th, and 40th stimulation train (500 ms, 50 Hz, every 2.5 s, duty cycle 0.2) in FDB fibers isolated from control mice and from mice < 1 hr, 6 hr, and 24 hr after acute treadmill exercise. (B and C) Quantitative analysis of the time course of relative (B) and normalized (C) change in peak mag-fluo-4 fluorescence. (D and E) Effect of high-frequency stimulation on total releasable Ca2+ store content in fura-FF-loaded fibers (D) and resting myoplasmicCa2+ concentration in fura-2-loaded fibers (E) from control mice and mice < 1 hr after exercise in the absence (solid bars) and following (shaded bars) delivery of 10 stimulus trains (500 ms, 50 Hz, every 2.5 s). n = number of FDB fibers analyzed. Number of mice used in A-C: Control, n = 5;<1 hr after exercise, n = 5; 6 hr after exercise, n = 4; 24 hr after exercise, n = 3. Number of mice used in D: Control, n = 4 (before stimulation) and n = 4 (after stimulation);<1 hr after exercise, n = 3 (before stimulation) and n = 4 (after stimulation). Number of mice used in E: Control, n = 5 (before stimulation) and n = 4 (after stimulation);<1 hr after exercise, n = 5 (before stimulation) and n = 4 (after stimulation); *p<0.05. Data are shown as mean ± SEM.
Figure 5—figure supplement 1
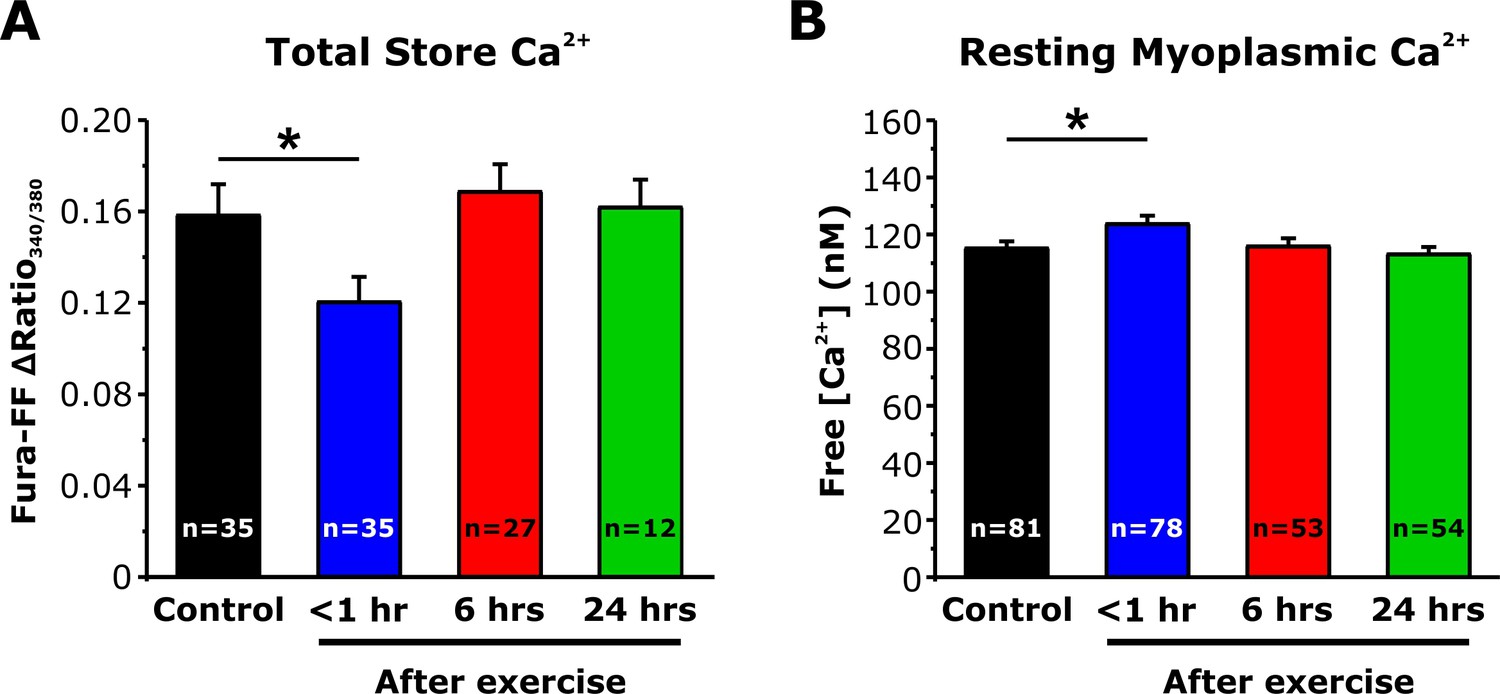
Effect of exercise on total Ca2+store content and resting myoplasmic Ca2+ concentration.
(A) Quantitative analysis of the total Ca2+ store content elicited during application of ICE (10 µM ionomycin, 30 µM CPA, and 100 µM EGTA) in fura-FF-loaded FDB fibers. (B) Quantitative analysis of resting myoplasmic Ca2+concentration recorded in fura-2-loaded FDB fibers. Data shown for control and <1 hr after acute treadmill exercise are replotted from Figure 5D and E to enable comparison with measurements taken from mice 6 and 24 hr after exercise. Numbers in bars and parentheses (n) reflect the number of FDB fibers analyzed. Number of mice used in A: Control, n = 4; <1 hr after exercise, n = 4; 6 hr after exercise, n = 3; 24 hr after exercise, n = 3. Number of mice used in B: Control, n = 5; <1 hr after exercise, 5; 6 hr after exercise, n = 4; 24 hr after exercise, n=4; *p<0.05. Data are shown as mean ± SEM.
Figure 5—figure supplement 2
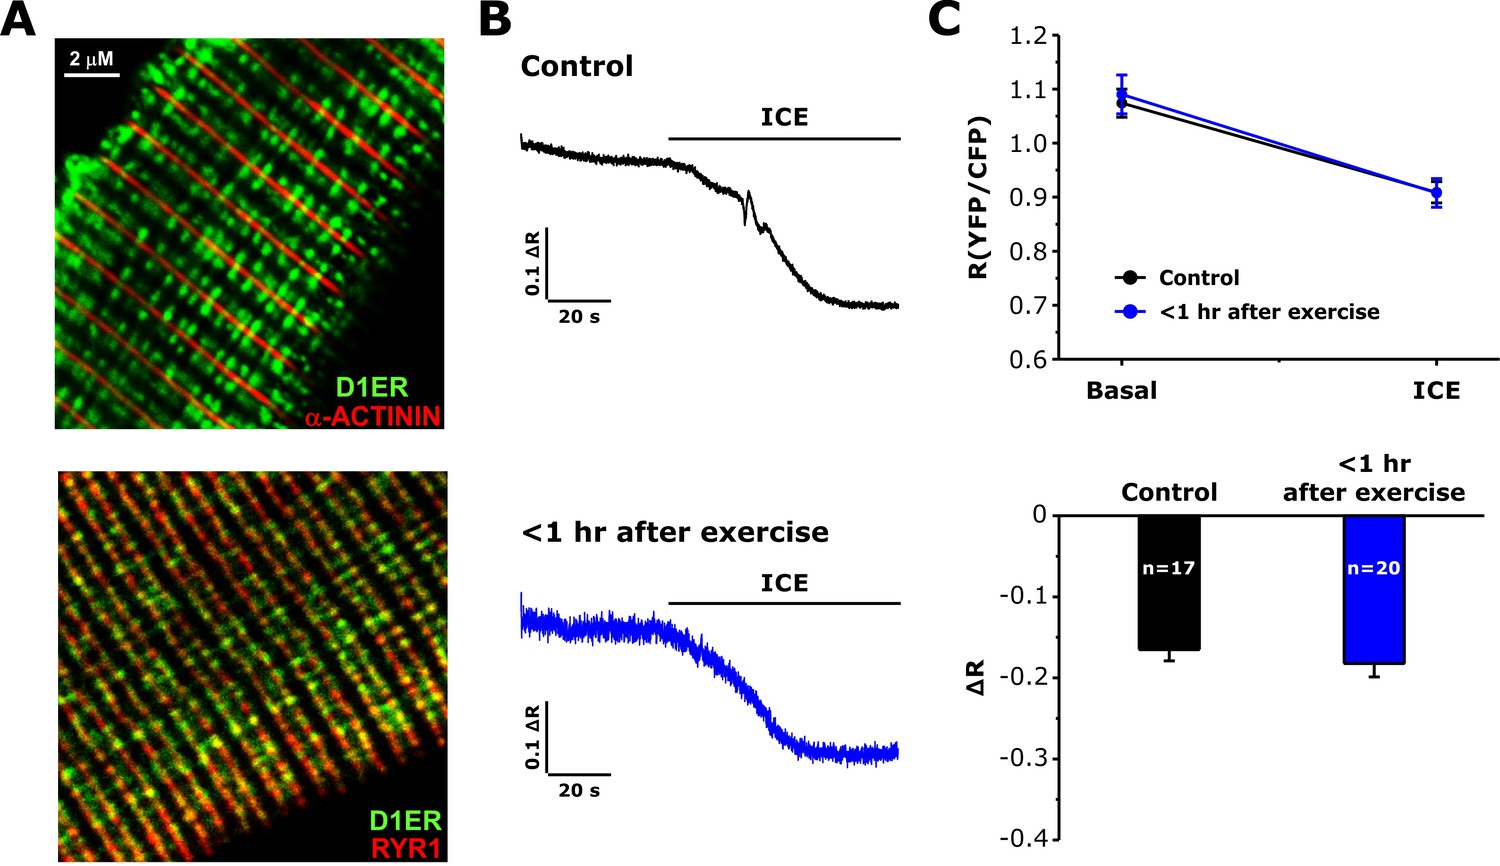
Measurements of free SR Ca levels in D1ER-expressing FDB fibers.
(A) Representative confocal images for D1ER (green) and markers for either the Z-line (α-ACTININ, upper) or the SR terminal cisternae (RYR1, lower). (B) Representative D1ER YFP/CFP ratio traces during application of ICE in FDB fibers from control or <1 hr after exercise mice. (C) Average D1ER YFP/CFP ratio values at baseline and after addition of ICE (upper) and maximal ICE-induced change in D1ER ratio (lower). Numbers in bars (n) reflect the number of FDB fibers analyzed. Number of mice used: Control, n = 3;<1 hr after exercise, n = 3; *p<0.05. Data are shown as mean ± SEM.
Figure 5—figure supplement 3
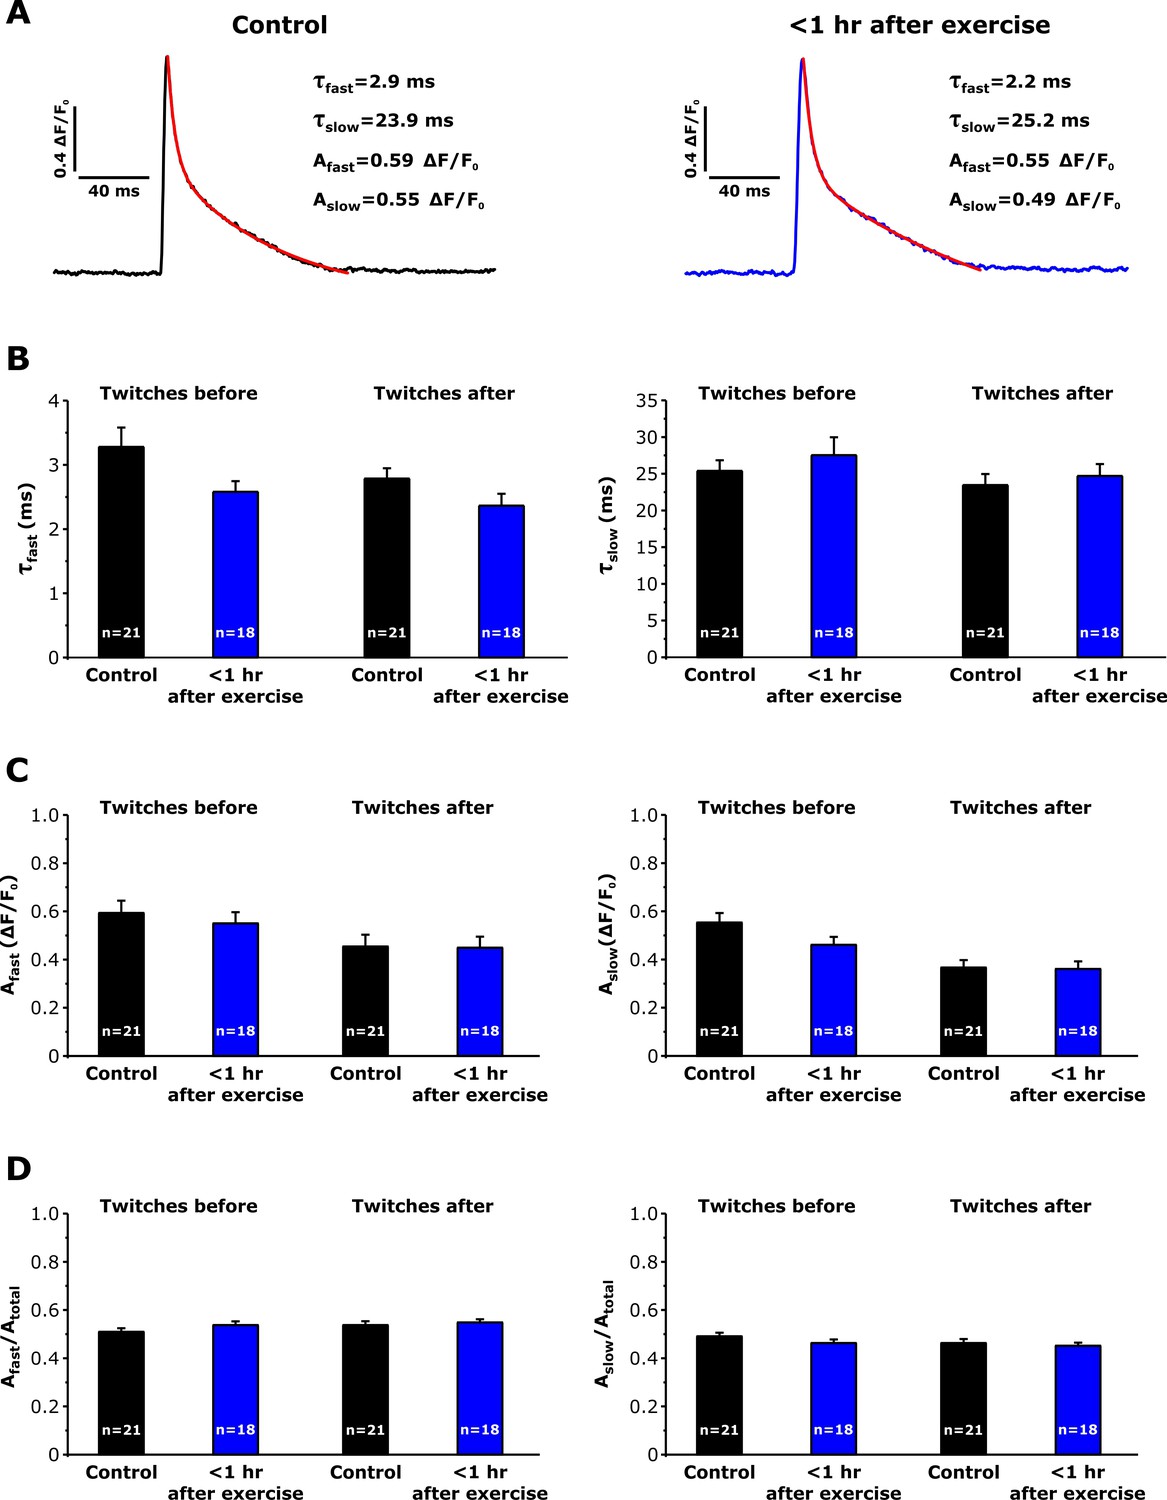
Effect of repetitive, high-frequency stimulation on Ca transient decay kinetics in FDB fibers from control and exercised mice.
Electrically-evoked twitch transients (0.5 Hz) were collected and averaged immediately before and after delivery of 10 stimulus trains (500 ms, 50 Hz, every 2.5 s). (A) Representative relative mag-fluo-4 fluorescence (ΔF/F0) traces elicited during twitch transients (0.5 Hz) in FDB fibers isolated from control mice (left black trace) and from mice < 1 hr after acute treadmill exercise (right blue trace) before 10 stimulus trains. Superimposed red traces represent the result of fitting the decay phase of the transient to the sum of two exponentials. Insets: values of calculation of the fast and slow time constants (τfast, τslow) and fast and slow amplitudes (Afast, Aslow) of twitch Ca2+ transient decay. (B and C) Analysis of τfast and τslow (B) and of Afast and Aslow (C) amplitudes of twitch Ca2+ transient decay. (D) Analysis of the relative amplitudes of the fast (Afast/Atotal) and slow (Aslow/Atotal) components of twitch Ca transient decay. Numbers in bars reflect the number of FDB fibers analyzed. Number of mice used: Control, n = 5;<1 hr after exercise, n = 4; *p<0.05. Data are shown as mean ± SEM.
Figure 6 with 1 supplement
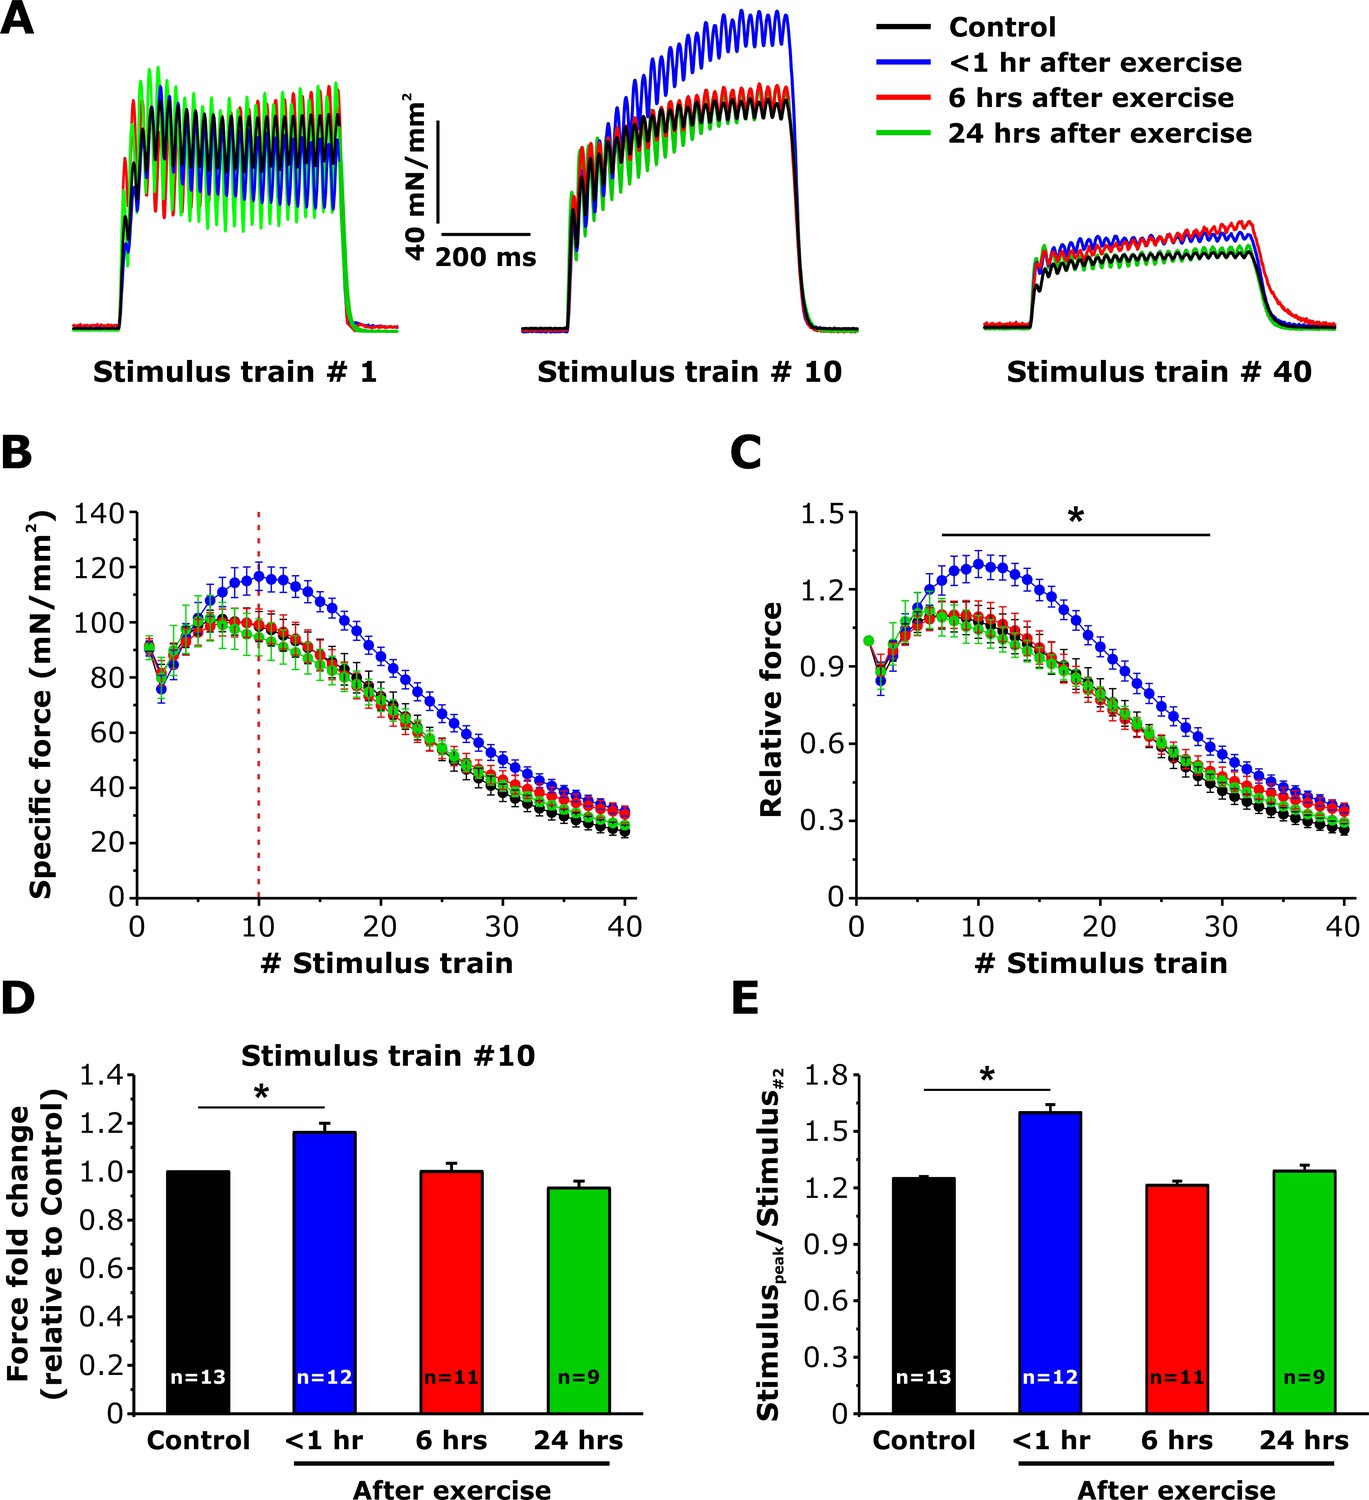
Effect of exercise on contractile force during repetitive, high-frequency stimulation.
(A) Representative specific force traces elicited during the 1st, 10th, and 40th stimulus train (500 ms, 50 Hz, every 2.5 s, duty cycle 0.2) in EDL muscles excised from control mice and from mice < 1 hr, 6 hr, and 24 hr after acute treadmill exercise. (B and C) Quantitative analysis of the time course of specific (B) and normalized (C) peak force during 40 consecutive, high-frequency stimulus trains. (D) Quantitative analysis of the fold change of peak-specific force calculated at the 10thstimulus train. (E) Quantitative analysis of the ratio between the maximum peak-specific force produced during the 40 stimulus trains and that of the 2nd stimulus train. Numbers in bars (n) reflect the number of EDL muscles analyzed. Number of mice used: Control, n = 7;<1 hr after exercise, n = 5; 6 hr after exercise, n = 6; 24 hr after exercise, n = 5; *p<0.05. Data are shown as mean ± SEM.
Figure 6—figure supplement 1
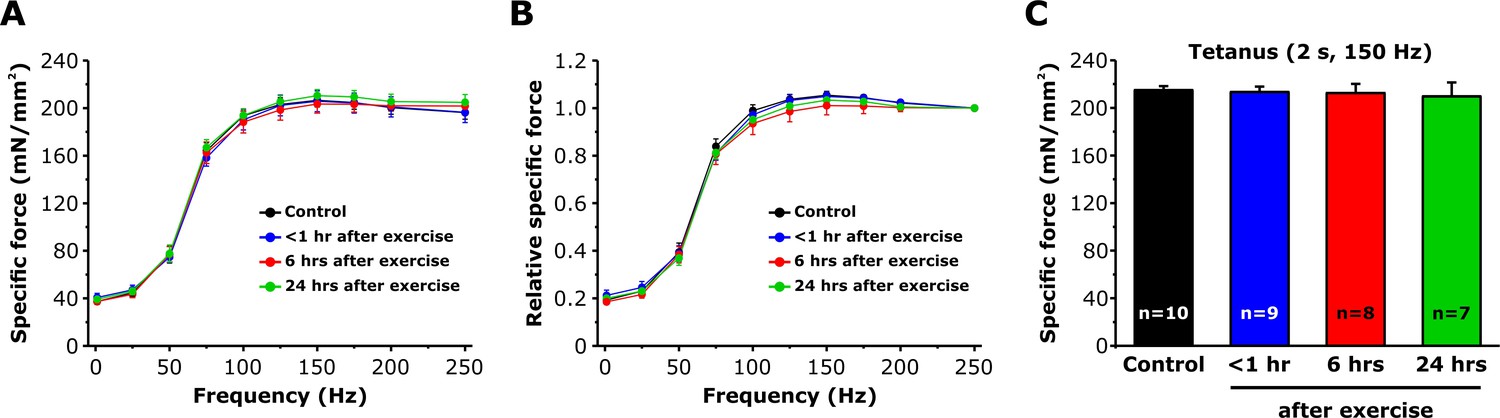
Effect of exercise on EDL muscle force-frequency curve and maximum tetanic force.
(A and B) Absolute and relative specific force-frequency curves obtained by applying stimulus trains from 1 to 250 Hz in EDL muscles from control mice and from mice < 1 hr, 6 hr, and 24 hr after acute treadmill exercise. (C) Peak tetanic-specific force elicited during a single 2 s, 150 Hz tetanic stimulation recorded from the same EDL muscles shown in A and B. Numbers in bars (n) reflect the number of EDL muscles analyzed. Number of mice used: Control, n = 7;<1 hr after exercise, n = 5; 6 hr after exercise, n = 6; 24 hr after exercise, n = 5; *p<0.05. Data are shown as mean ± SEM.
Figure 7 with 1 supplement
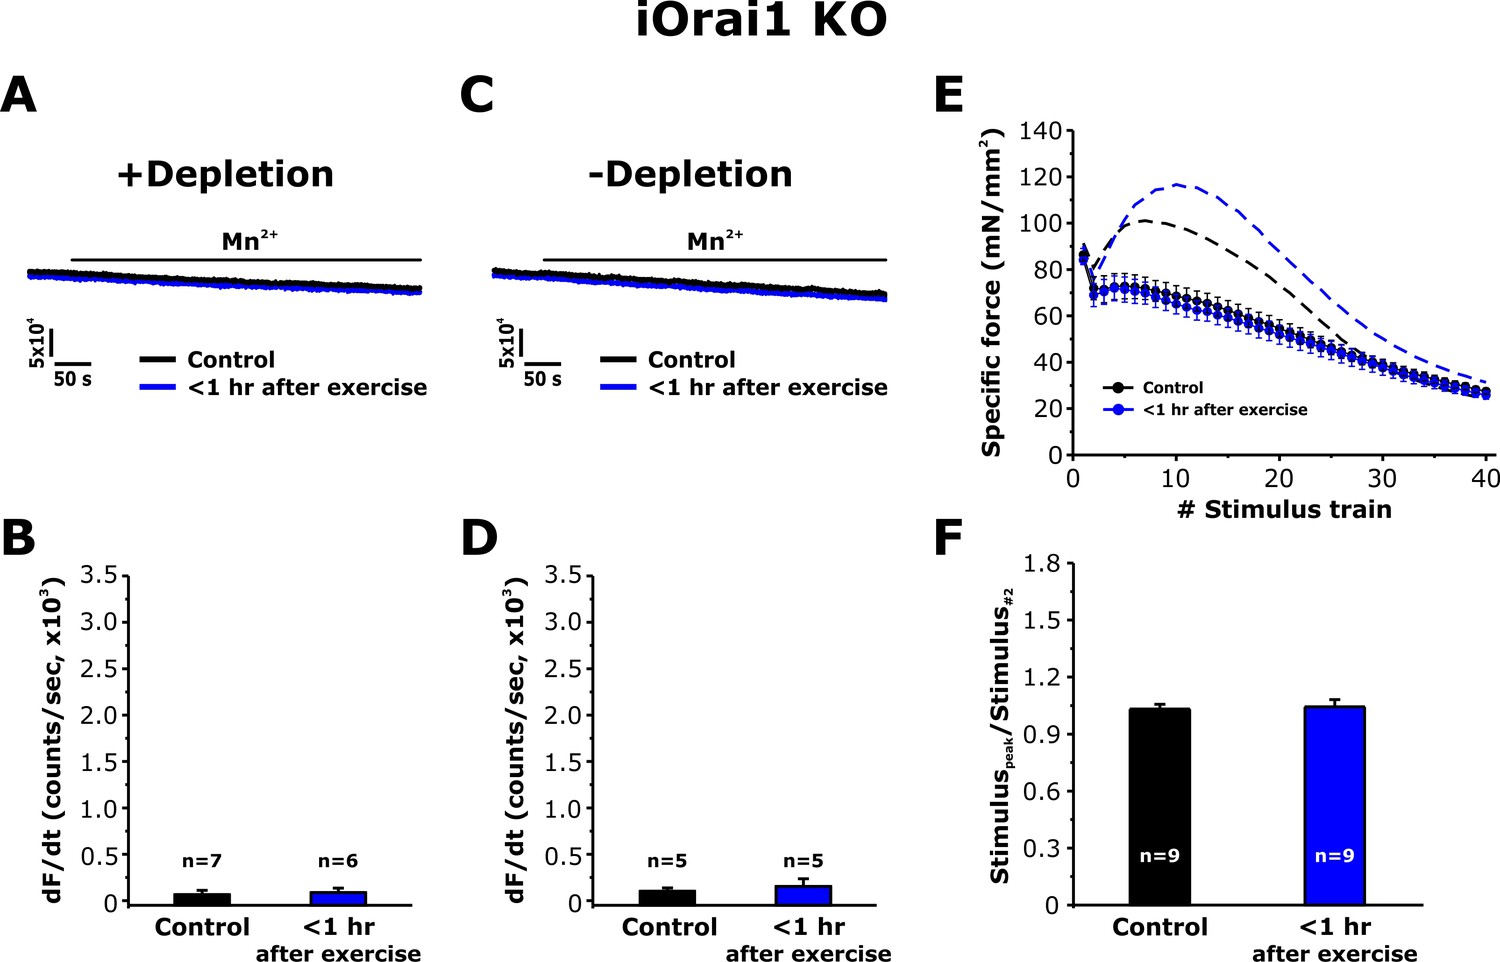
Effect of exercise on the maximum rate of Mn2+ quench and contractile force in iOrai1 KO mice.
Data were obtained in EDL muscles and FDB fibers from non-exercised iOrai1 KO mice and iOrai1 KO mice < 1 hr after acute treadmill. (A) Representative traces of fura-2 fluorescence during application of 0.5 mM Mn2+ recorded in FDB fibers following store depletion with 1 μM thapsigargin + 15 μM cyclopiazonic (+depletion). (B) Representative traces of fura-2 fluorescence during application of 0.5 mM Mn2+ recorded in FDB the absence of store depletion (-depletion). (C–D) Quantitative analysis of the maximum rate of Mn2+ quench under store-depleted (C) and non-depleted (D) conditions in FDB fibers. (E) Quantitative analysis of the time course of specific force during 40 consecutive, high-frequency stimulus trains in EDL muscles. (F) Quantitative analysis of the ratio between the maximum peak-specific force produced during the 40 stimulus trains and that of the 2nd stimulus train in EDL muscles. Numbers (n) reflect the number of FDB fibers or muscles analyzed. Number of mice used: iOrai1 KO control, n = 5; iOrai1 KO exercised, n = 5; *p<0.05. Data are shown as mean ± SEM.
Figure 7—figure supplement 1

Effect of exercise on the maximum rate of Mn2+ quench and contractile force in dnOrai1 mice.
Data were obtained in FDB fibers and EDL muscles from non-exercised dnOrai1 mice and dnOrai1 KO mice < 1 hr after acute treadmill. (A) Representative traces of fura-2 fluorescence during application of 0.5 mM Mn2+ recorded in FDB fibers following store depletion with 1 μM TG + 15 μM CPA (+depletion). (B) Representative traces of fura-2 fluorescence during application of 0.5 mM Mn2+ recorded in FDB the absence of store depletion (-depletion). (C–D) Quantitative analysis of the maximum rate of Mn2+ quench under store-depleted (C) and non-depleted (D) conditions in FDB fibers. (E) Quantitative analysis of the time course of specific force during 40 consecutive, high-frequency stimulus trains in EDL muscles. (F) Quantitative analysis of the ratio between the maximum peak-specific force produced during the 40 stimulus trains and that of the 2nd stimulus train in EDL muscles. Numbers (n) reflect the number of FDB fibers or muscles analyzed. Number of mice used: dnOrai1 control, n = 4; dnOrai1 exercised, n = 4; *p<0.05. Data are shown as mean ± SEM.
Figure 8
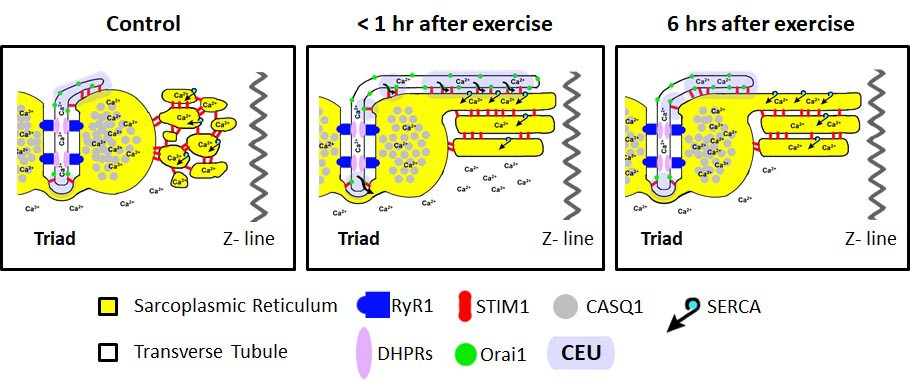
Model of structural events and functional effects of CEU assembly and disassembly following acute exercise and during recovery.
Left) In non-exercised or sedentary muscle, the SR is fully replete with Ca2+ ions, and the myoplasmic Ca2+ concentration is low. STIM1 proteins are located throughout the I band, while Orai1 proteins are almost exclusively within the TT membrane. Middle) Less than 1 hr after acute exercise, total Ca2+ store content is reduced, and myoplasmic Ca2+ is modestly elevated. In addition, the free-SR undergoes a remodeling that results in the formation of SR-stacks, while the TT elongates from the triad into the I band to create junctional contacts, referred to as Calcium Entry Units (CEUs). Right) 6 hr of recovery after acute exercise, the SR is fully replete with Ca2+, the myoplasmic Ca2+ concentration returns to control levels, and the TT extension is largely retracted back from contacts with SR-stacks.
Author response image 1

Effect of calsequestrin type 1 knockout (CASQ1-null) on total releasable Ca2+ store content.
A) Representative fura-FF ratio traces of total Ca2+ store content elicited during application of ICE in FDB fibers from wild-type (WT) and CASQ1-null mice. B) Peak change in fura-FF ratio during ICE application. n = number of FDB fibers analyzed; *p<0.05. Data are shown as mean ± SEM.
Author response image 2
Effect of repetitive, high-frequency stimulation on total releasable Ca2+ store content and resting myoplasmic Ca2+ concentrationin FDB fibers from control and <1 hour after exercise mice.
A) Quantitative analysis of total Ca2+ store content elicited during application of ICE (10 µM ionomycin, 30 µM CPA, and 100 µM EGTA) in fura-FF-loaded FDB fibers in the absence (solid bars) and following (shaded bars) delivery of 10 stimulus trains (500 ms, 50 Hz, every 2.5 seconds). E) Quantitative analysis of resting myoplasmic Ca2+ concentration recorded in fura-2-loaded FDB fibers in the absence (solid bars) and following (shaded bars) delivery of 10 stimulus trains (500 ms, 50 Hz, every 2.5 seconds). n = number of FDB fibers analyzed; *p<0.05. Data are shown as mean ± SEM.
Additional files
-
Transparent reporting form
- https://doi.org/10.7554/eLife.47576.017
Download links
A two-part list of links to download the article, or parts of the article, in various formats.
Downloads (link to download the article as PDF)
Open citations (links to open the citations from this article in various online reference manager services)
Cite this article (links to download the citations from this article in formats compatible with various reference manager tools)
Transverse tubule remodeling enhances Orai1-dependent Ca2+ entry in skeletal muscle
eLife 8:e47576.
https://doi.org/10.7554/eLife.47576


