Evolutionary pathways to antibiotic resistance are dependent upon environmental structure and bacterial lifestyle
- University of Pittsburgh, United States
Figures
Figure 1
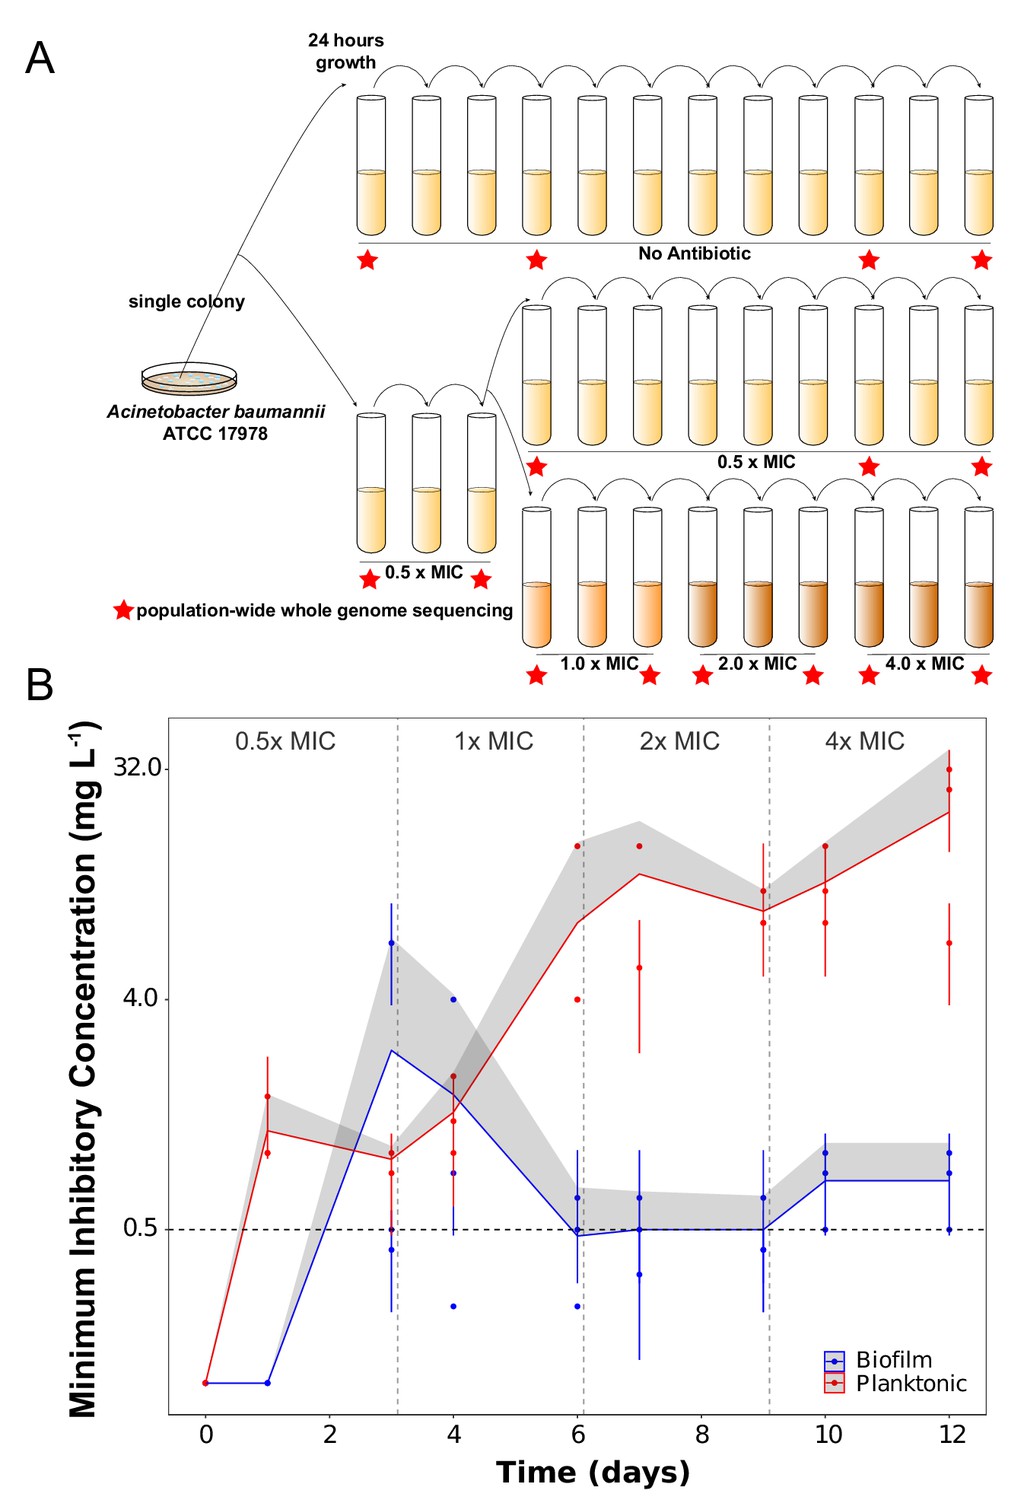
Experimental design (A) and dynamics of evolved resistance levels during the evolutionary rescue experiment (B).
(A) A single clone of A. baumannii ATCC 17978 was propagated both in biofilm and planktonic conditions for 12 days under no antibiotics (top), subinhibitory concentrations of CIP (0.0625 mg/L = 0.5 x MIC) (middle) or in increasing concentrations of CIP (bottom). For the latter, termed evolutionary rescue, the concentration of CIP was doubled from 0.5 x MIC to 4.0 x MIC every 72 hr. As a control, five populations of A. baumannii ATCC 17978 were propagated in biofilm and five in planktonic conditions in the absence of antibiotics. We estimated the MICs to CIP and froze the populations for sequencing before and after doubling the antibiotic concentrations (red stars). (B) MICs (mg/L) of CIP were measured for replicate populations during the evolutionary rescue. The red and blue points represent the MICs of three populations propagated in planktonic or biofilm, respectively, with the 95% CI represented by the error bars. The red and blue lines represent the grand mean of the three planktonic and biofilm populations, respectively, with the upper 95% CI indicated by the gray shaded area. Horizontal dashed line indicates the highest CIP exposure during the experiment (4x MIC) and vertical lines indicate time when CIP concentration was doubled.
Figure 2 with 3 supplements
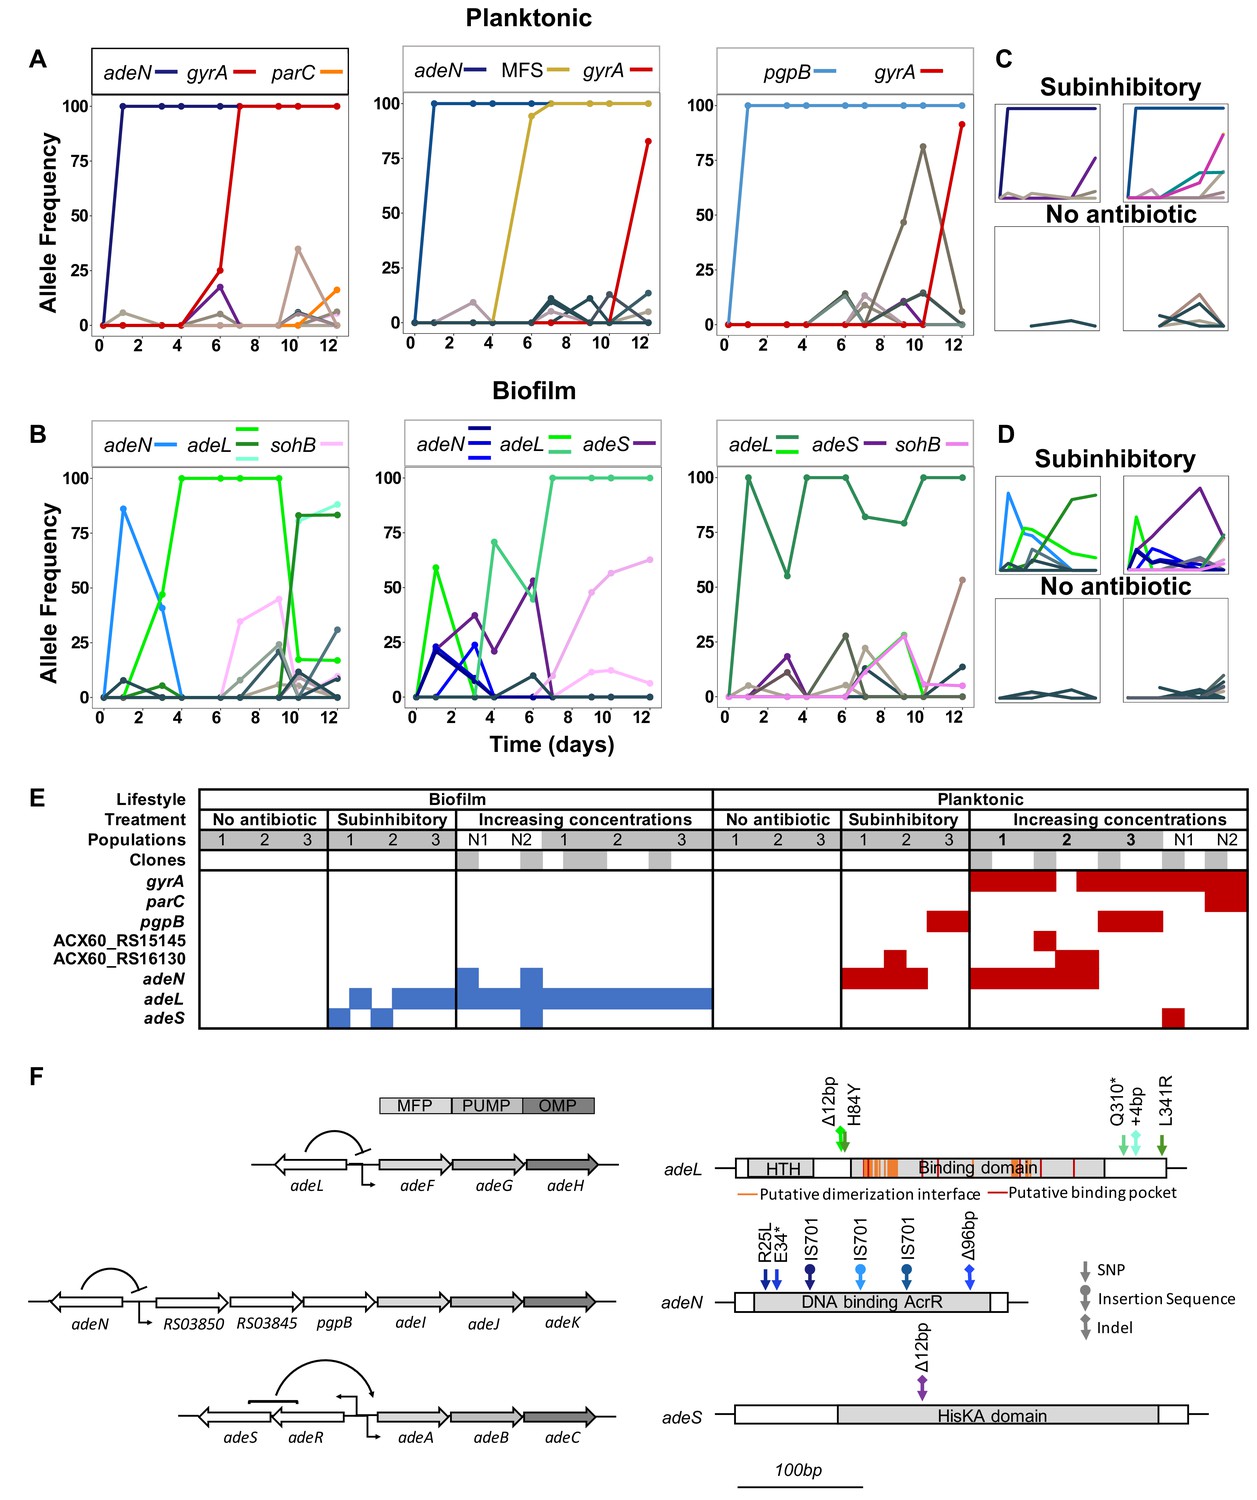
Lifestyle-dependent mutations and dynamics under increasing CIP selection.
Mutation frequencies in planktonic (A and C) and biofilm populations (B and D) over time as determined by population-wide whole genome sequencing. A) and B) show the mutation frequencies obtained under increasing concentrations of CIP. From left to right: P1, P2 and P3 in A) and B1, B2 and B3 in B). C) and D) show the mutation frequencies obtained under the subinhibitory (top) and no antibiotic (bottom) treatments. Mutations in the same gene share a color. Blue: adeN or genes regulated by adeN; green: adeL; gold: MFS putative transporter ACX60_RS15145; purple: adeS; pink: sohB; red: gyrA; and orange: parC. Gray and brown colors indicate genes potentially unrelated to adaptation to CIP. (F) Mutated genes in the sequenced clones. Each column represents one clone. Gray shading of populations indicates whole population sequencing and N1 and N2 indicate populations where only clones were sequenced. Gray shaded clones were used for MIC and fitness estimations. Blue and red indicate SNPs in biofilm and planktonic growing populations respectively. For all SNPs identified in the 49 clones, see Figure 2—figure supplement 2 and Supplementary file 2. (G) The genetic organization of the RND efflux pumps is shown on the left. MFP and OMP denote membrane fusion protein and outer membrane protein respectively. All mutations found in the RND regulators are shown on the right.
-
Figure 2—source data 1
Mutation frequencies in evolved populations, labelled for example P4.60x = planktonic, replicate 4, day 6, 0x no antibiotic.
- https://doi.org/10.7554/eLife.47612.011
Figure 2—figure supplement 1
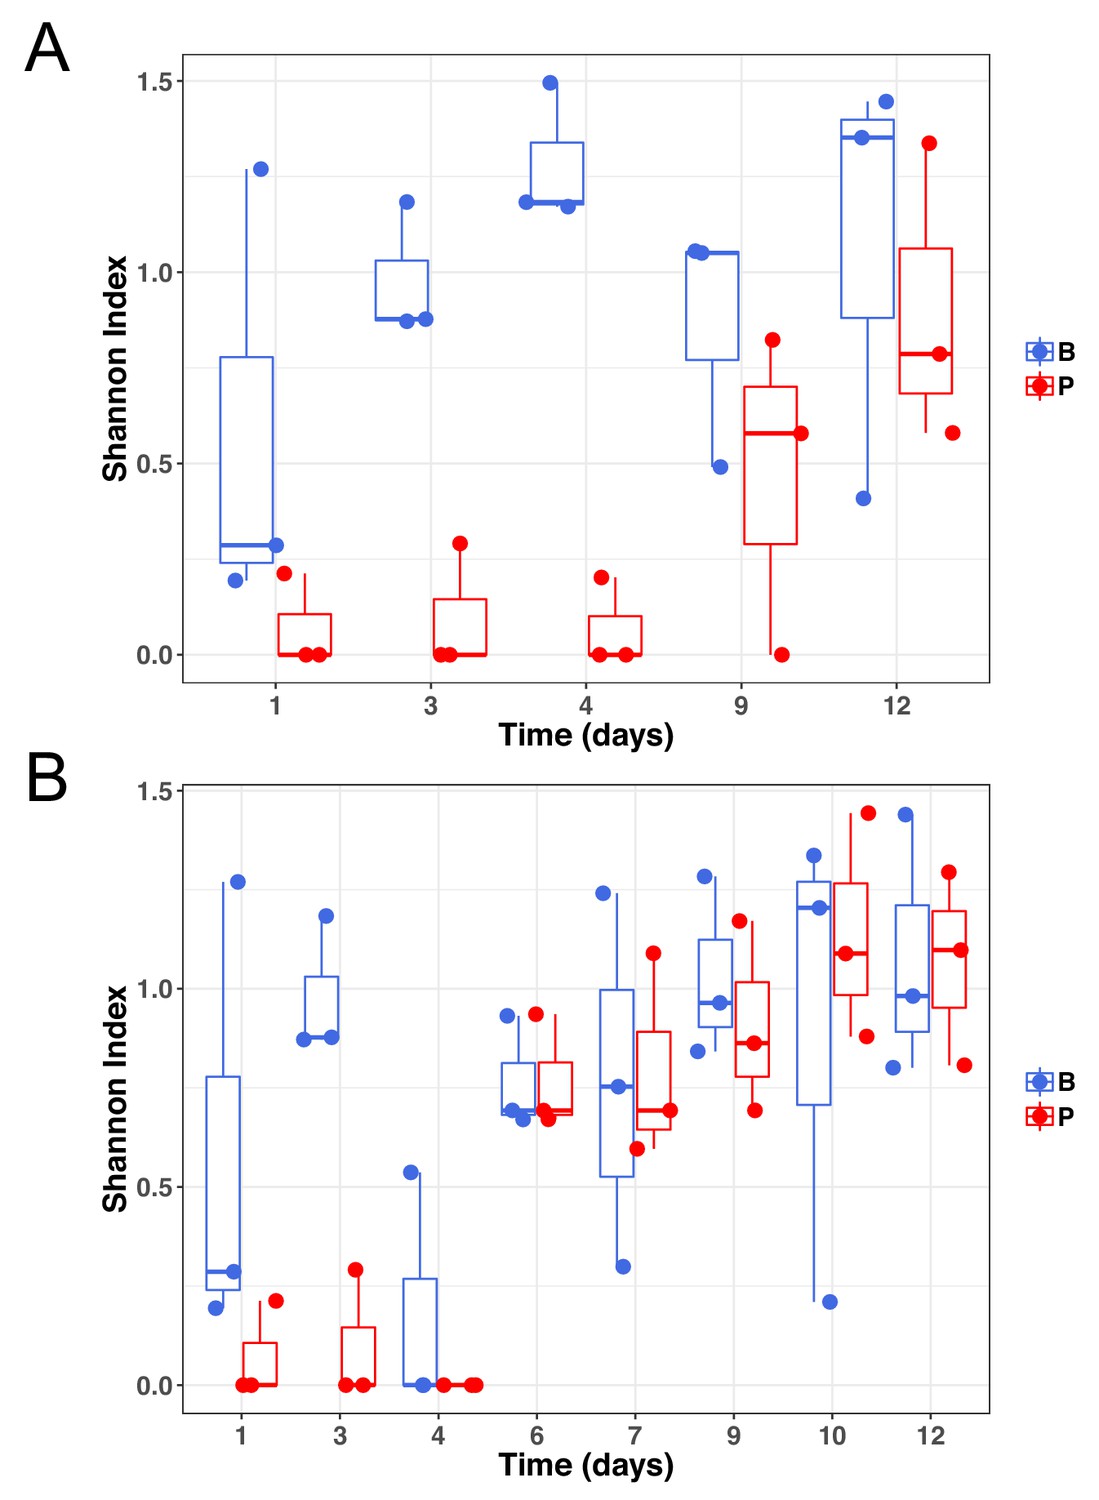
Genetic diversity of samples at subinhibitory concentrations of ciprofloxacin (A) or during the evolutionary rescue experiment with increasing concentrations of ciprofloxacin (B).
Biofilm populations in blue and planktonic populations in red.
Figure 2—figure supplement 2

Mutated genes in the sequenced clones differ between treatments.
Each column represents one clone. Gray shaded clones were used for MIC and fitness estimations. Red color indicates SNPs or small indels, blue color indicates new junction evidences and gray indicates missing coverage indicative of a deletion.
Figure 2—figure supplement 3
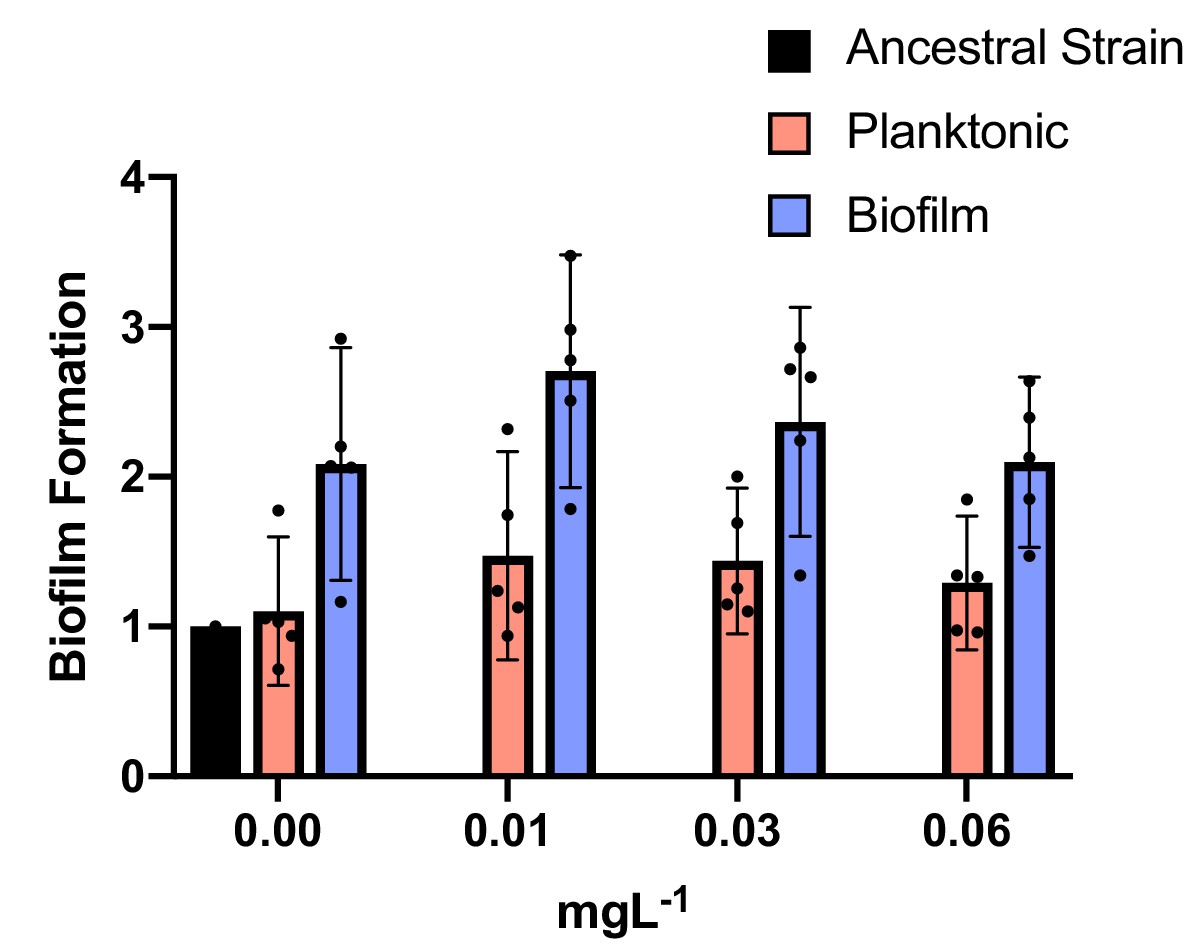
Biofilm production under subinhibitory concentrations of CIP.
Blue and red bars show biofilm and planktonic clones, respectively. The ancestral strain is represented by the black bar. Individual clone results are shown as points. The averages are shown by bars. 95% CI are indicated by the error bars. Biofilm clones produced more biofilm than planktonic clones: two tailed t-test of biofilm formation with 0.00 mg/L of CIP: p=0.006, t = 3.008, df = 32; with 0.01 mg/L of CIP: p=0.0006, t = 3.780, df = 32; with 0.03 mg/L of CIP: p=0.0077 t=2.841, df = 32 and with 0.0625 mg/L of CIP: p=0.018 t=2.471 df=32.
Figure 3

Evolved trade-off between resistance level and fitness.
Relative fitness (average ± SEM) of 10 evolved clones from the evolutionary rescue experiment compared to the ancestor and their MICs (mg/L) to CIP. Fitness was measured in both planktonic (squares) and biofilm (circles) conditions. MICs were estimated in planktonic conditions. Black dot represents the ancestral clone. *Denotes the clone with gyrA and parC mutations.
-
Figure 3—source data 1
Mean fitness and resistance values of selected clones.
- https://doi.org/10.7554/eLife.47612.014
Figure 4
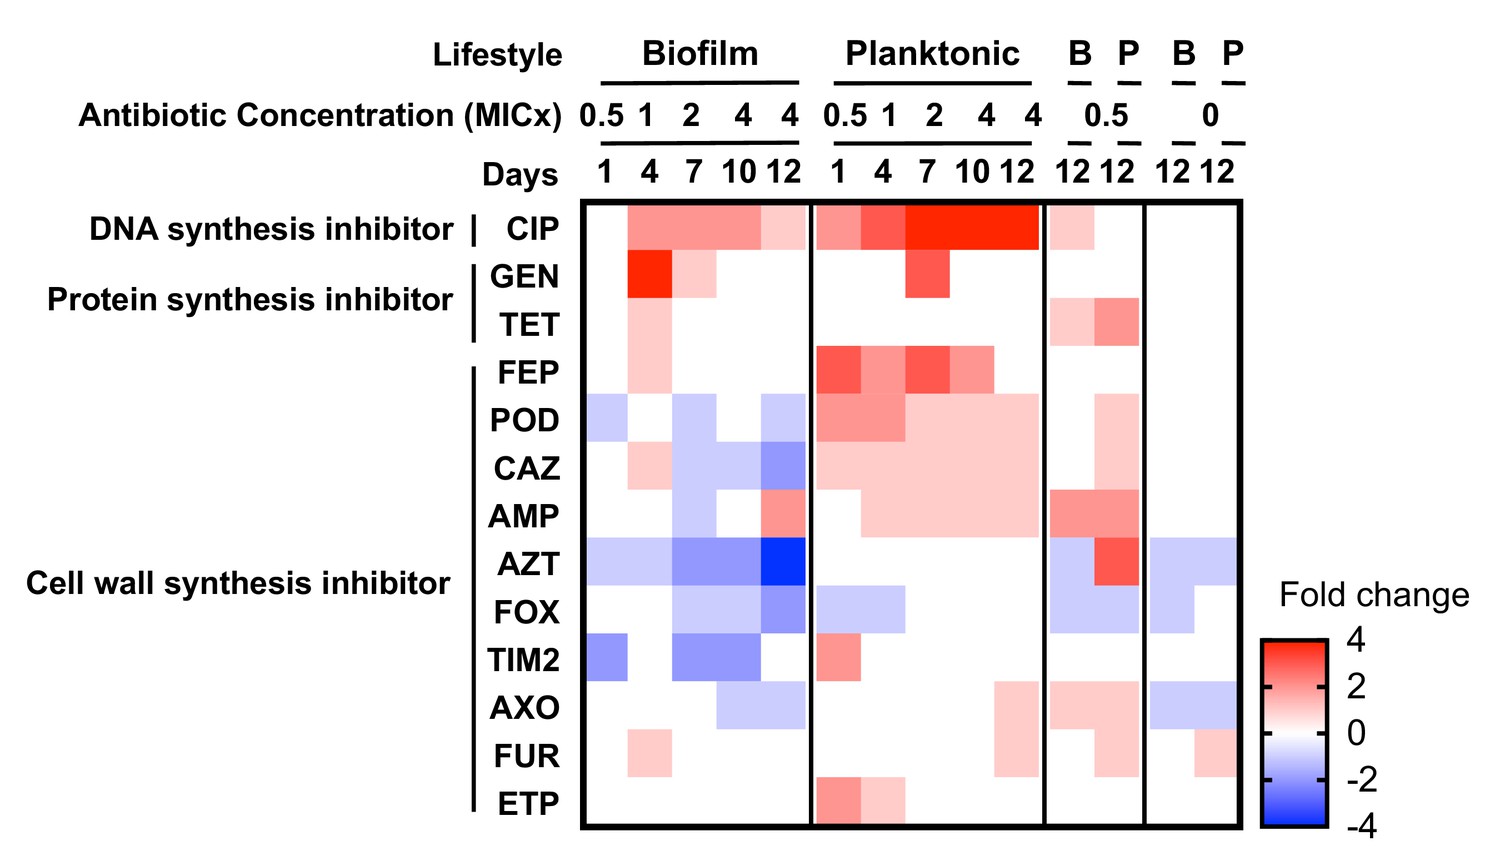
Collateral sensitivities and cross resistances to various antibiotics.
Heat map showing the relative changes in antimicrobial susceptibility to 13 of the 23 antibiotics tested in the evolved populations (those not shown had no changes). Results shown are the median values of the fold change in the evolved populations compared to the ancestral strain. For subinhibitory and no-antibiotic treatments, only day 12 is shown. CIP, ciprofloxacin; GEN, gentamicin; TET, tetracycline; FEP, cefepime; POD, cefpodoxime; CAZ, ceftazidime; AMP, ampicillin; AZT, aztreonam; FOX, cefoxitin; TIM2, ticarcillin/clavulanic acid constant; AXO, ceftriaxone; FUR cefuroxime; ETP, ertapenem.
Figure 5
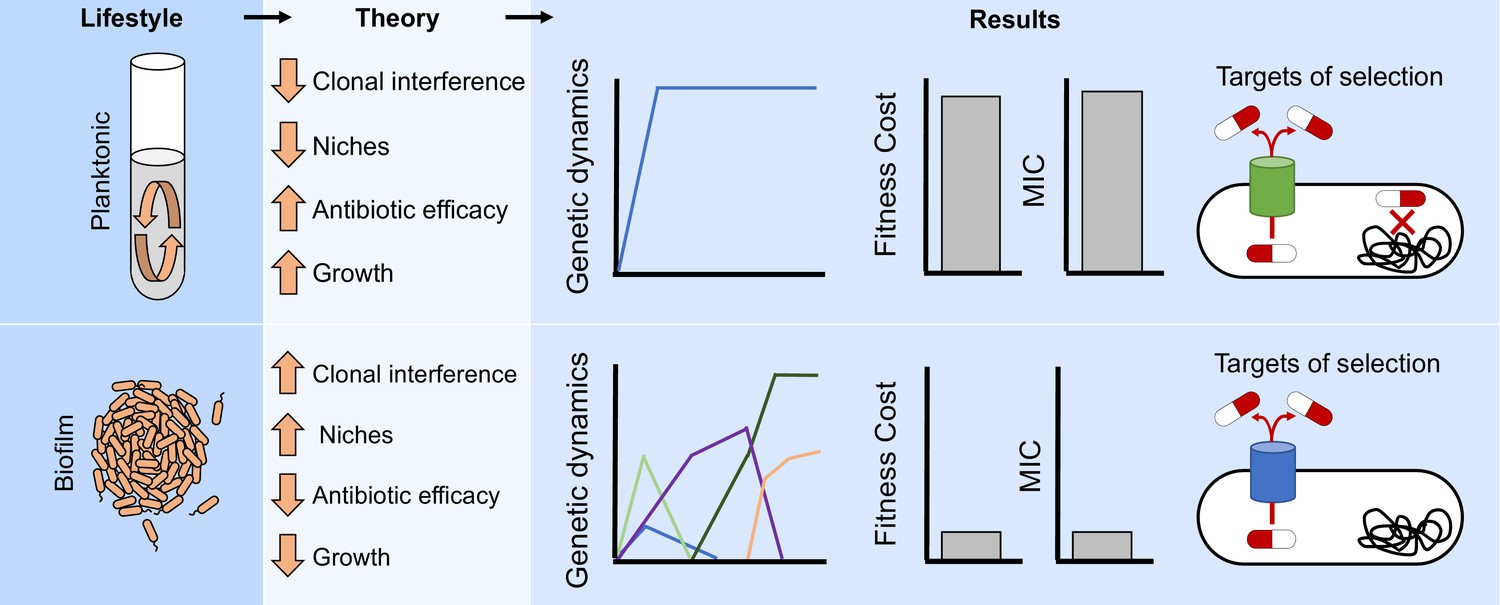
Lifestyle determines the evolution of antibiotic resistance.
The environmental structure of biofilms can increase clonal interference and generate distinct ecological conditions which can favor different niches. Those factors will generate more complex evolutionary dynamics in biofilms compared to well-mixed populations (Figure 2A–D and Figure 2—figure supplement 1). In addition, the efficacy of the antibiotic can be reduced by the protection conferred by the biofilm and the relatively slow growth of the cells. Therefore, different evolutionary dynamics (Figure 3) and targets of selection conferring lower antibiotic resistance (Figures 1B and 2E and Figure 2—figure supplement 2) will be selected for in structured populations compared to well-mixed ones.
Tables
Table 1
Antibiotic susceptibility of the populations propagated in the absence, in subinhibitory concentrations or increasing concentrations of CIP at the end of the experiment (day 12).
MICs are expressed in mg/L and standard errors of the mean are indicated. Fold increases in MIC compared to the ancestral strain are also indicated.
| Treatment and Populations | MIC (mg/L) | Fold MIC increase |
|---|---|---|
| No Antibiotic | ||
| Planktonic | ||
| P1 | 0.25 ± 0.00 | 2 |
| P2 | 0.25 ± 0 | 2 |
| P3 | 0.21 ± 0.03 | 1.68 |
| Biofilm | ||
| B1 | 0.25 ± 0 | 2 |
| B2 | 0.25 ± 0 | 2 |
| B3 | 0.25 ± 0 | 2 |
| Subinhibitory | ||
| Planktonic | ||
| P1 | 2.33 ± 0.72 | 18.64 |
| P2 | 4 ± 0 | 32 |
| P3 | 1 ± 0 | 8 |
| Biofilm | ||
| B1 | 0.41 ± 0.07 | 3.28 |
| B2 | 0.5 ± 0 | 4 |
| B3 | 0.5 ± 0 | 4 |
| Evolutionary rescue | ||
| Planktonic | ||
| P1 | 26.67 ± 5.34 | 213.36 |
| P2 | 32 ± 0 | 256 |
| P3 | 6.67 ± 1.34 | 53.36 |
| Biofilm | ||
| B1 | 1 ± 0 | 8 |
| B2 | 0.5 ± 0 | 4 |
| B3 | 0.83 ± 0.17 | 6.64 |
Table 2
Antibiotic susceptibility of one clone of each population propagated in increasing concentrations of CIP at the end of the experiment (day 12).
MICs were measured in biofilms and are expressed in mg/L and standard errors of the mean are indicated. Fold increase in MIC compared to the ancestral strain are also indicated.
| Treatment and Populations | MIC measured in biofilms (mg/L) | Fold MIC increase |
|---|---|---|
| Evolutionary rescue | ||
| Planktonic | ||
| P1 | >128 ± 0 | >1024 |
| P2 | >128 ± 0 | >1024 |
| P3 | >128 ± 0 | >1024 |
| Biofilm | ||
| B1 | 32 ± 0 | 256 |
| B2 | 32 ± 0 | 256 |
| B3 | 32 ± 0 | 256 |
Table 3
Mutation spectrum of different selective environments.
Attributes of the contending mutations during the 12 days of the evolution experiment. aResults from the last day of the experimental evolution. bAccounting for all unique mutations detected after filtering (see Materials and methods). For mutation dynamics over time, see Supplementary file 2.
| Increasing concentrations | Subinhibitory concentrations | |||
|---|---|---|---|---|
| Planktonic | Biofilm | Planktonic | Biofilm | |
| Total mutations | 28 | 38 | 6 | 16 |
| Nonsynonymous/Synonymousa | 8.5 | 9.67 | 2/0 | 6 |
| Intergenic | 8 | 11 | 0 | 4 |
| Nonsynonymous | 9 | 13 | 2 | 6 |
| Percent intergenic mutationsb | 29 | 29 | 0 | 25 |
Table 4
Efflux pumps and their regulators in A. baumannii 17978 targeted under CIP pressure.
Adapted from Li et al. (2016). AG aminoglycosides, AZI azithromycin, BL β-lactams, CHL chloramphenicol, CL clindamycin, ERY erythromycin, FLO florfenicol, FUA fusidic acid, FQ fluoroquinolones, GEN gentamicin, MIN minocycline, NAL nalidixic acid, NOR norfloxacin, RIF rifampicin, SUL sulfonamides, TET tetracycline, TGC tigecycline, TMP trimethoprim. a References in Li et al. (2016).
| Transporter Family | Regulator | Efflux pump | Substratesa |
|---|---|---|---|
| RND | AdeSR | AdeABC | AG, BL, CHL, ERY, FQ, NAL, TET, TGC |
| RND | AdeL | AdeFGH | CHL, ERY, FQ, NAL, SUL, TET, TGC, TMP |
| RND | AdeN | AdeIJK | AZI, BL, CHL, ERY, FQ, FUA, MIN, NAL, RIF, SA, SUL, TET, TMP |
| MATE | - | AbeM | FQ, GEN |
Additional files
-
Supplementary file 1
Estimated mutation probabilities during experimental evolution.
- https://doi.org/10.7554/eLife.47612.017
-
Supplementary file 2
Complete list of mutated genes in the pre-adapted ancestor, in the sequenced clones, and those detected within each population by day.
- https://doi.org/10.7554/eLife.47612.018
-
Transparent reporting form
- https://doi.org/10.7554/eLife.47612.019
Download links
A two-part list of links to download the article, or parts of the article, in various formats.
Downloads (link to download the article as PDF)
Open citations (links to open the citations from this article in various online reference manager services)
Cite this article (links to download the citations from this article in formats compatible with various reference manager tools)
Evolutionary pathways to antibiotic resistance are dependent upon environmental structure and bacterial lifestyle
eLife 8:e47612.
https://doi.org/10.7554/eLife.47612


