Origin and role of the cerebrospinal fluid bidirectional flow in the central canal
- Institut du Cerveau et de la Moelle épinière (ICM), Sorbonne Universités, UPMC Univ Paris 06, Inserm, CNRS, AP-HP, Hôpital Pitié-Salpêtrière, France
- ESPCI Paris, PSL University, CNRS, Institut Langevin, France
- École Polytechnique Fédérale de Lausanne, Switzerland
- Institute of Psychiatry and Neuroscience of Paris, Hôpital Saint-Anne, Université Descartes, INSERM U1266, France
- Norwegian University of Science and Technology, Norway
Figures
Figure 1

Automated CSF flow analysis in the central canal quantifies the bidirectional velocity profile in 30 hpf embryos.
(A) Inverted contrast widefield image showing a 30 hpf zebrafish embryo injected with Texas Red: Texas Red fills all fluid-containing cavities, including ventricles, central canal (CC, white arrows), floor plate, somite boundaries, and blood vessels. (B) Instantaneous velocities of 20 nm fluorescent particles, as measured with a particle tracking velocimetry (PTV) algorithm, inside the central canal in a region corresponding to the red box in (A). The length, direction, and color of all arrows are coded according to the instantaneous bead velocity, ranging from −8 (blue) to 8 μm/s (red). (C1) Time series showing subsequent images of fluorescent beads injected in the DV and transported down the CC used to generate kymographs at different dorso-ventral (D–V) positions. (C2) Example kymographs computed in a dorsal, central, or ventral position in the CC. Each line represents the trajectory of one bead, projected along the rostro-caudal (R–C) axis. The slope of each trajectory gives a bead velocity projected onto the R-C axis. (C3) Histogram of velocities obtained at the three positions shown in (C2). (C4) Velocity profile (mean ± s.e.m. in blue) calculated for all D-V positions (expressed in absolute and relative position) in the CC for one WT embryo showing a maximum in the ventral side and a minimum in the dorsal side. (D1) Values of minimal (extremum in the dorsal part) and maximal velocities measured on 110 WT zebrafish embryos. Each dot represents the extremal values of one profile, and each color presents an experiment performed on siblings. 2 R-C positions are sampled per embryo. Extremal velocities are respectively 4.78 ± 0.79 μm.s-1 (ventral CC) and - 4.80 ± 0.82 μm.s-1 (dorsal CC). (D2) Values of relative D-V position of minimal, null, and maximal speed in the dorsal, center and ventral position in the CC (median positions are respectively 0.82, 0.53, and 0.29). Horizontal scale bar is 150 μm in (A), 15 μm in (B, C1, C2), and vertical scale bar is 5 s in (C2).
Figure 2 with 1 supplement
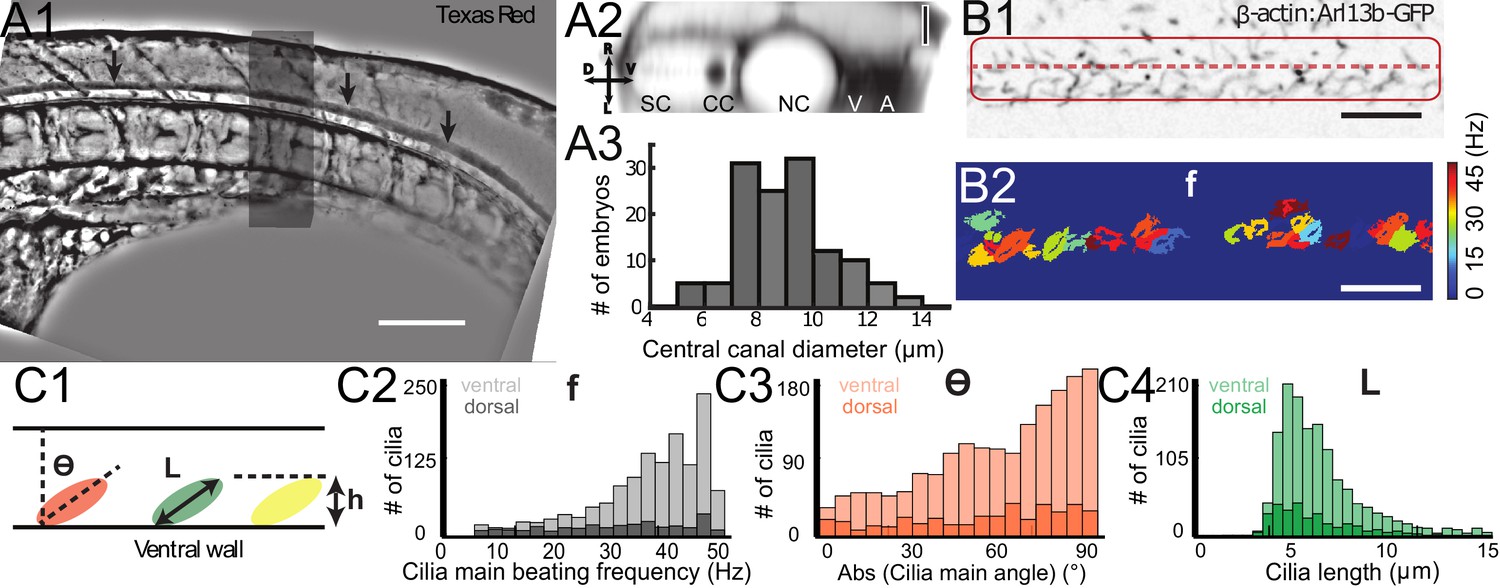
Geometry of the central canal and properties of motile cilia in 30 hpf embryos.
(A1, A2) Central canal filled with TexasRed injected in the brain ventricles shown laterally from maximal Z-projection stack of 75 inverted contrast images acquired with 1 μm Z-step (A1) and corresponding vertical profile (A2, 5x rescale on the axial dimension enabled similar pixel size in X/Y and Z): SC, spinal cord, CC, central canal (black arrows in (A1)), NC, notochord, V, vein and A, artery. (A3) Histogram of central canal diameter from n = 129 WT embryos, with a median value of 8.9 ± 0.9 μm (mean ± 0.5 s.t.d.). (B1, B2) Lateral view in the CC where cilia are labeled with GFP in Tg (β-actin:Arl13b-GFP) transgenic embryos (B1) used to draw a map of local main beating frequency (B2) from the fluorescence signal obtained by calculating the local Fourier transform. Regions of constant frequency are color-coded and most likely correspond to single cilium beating. (C1) Scheme presenting some parameters of interest extracted from regions of constant frequency obtained in (B2) and fitted as ellipses to obtain their mean orientation Θ, their major axis (L), associated with the cilia maximal length, and their height (h), that is their projection along the D-V axis. The latter parameter gives the portion of central canal occupied by beating cilia. (C2, C3, C4) Histograms of parameters extracted in many regions of constant frequency of n = 89 Tg(β-actin: Arl13b-GFP) 30 hpf embryos, for a total of 1704 motile cilia (298 dorsal cilia and 1406 ventral cilia) analyzed in total. A central frequency of 38.1 Hz (median frequency with s.d 10.0 Hz) (C2), a mean absolute orientation |Θ| 62.6° (s.d. 23.4°) (c3), a length L of 5.8 μm (s.d. 2.0 μm) (C4) as well as a beating height of 2.7 μm (s.d. 1.9 μm) (not shown) were found for ventral cilia. Dorsal motile cilia have a central frequency of 32.3 Hz ± 12.3 Hz, a caudal orientation of absolute value 59.7°± 25.8° and a length of 5.5 μm ± 3.0 μm. Scale bar is 50 μm in (A1), and 15 μm in (A2, B1, B2).
Figure 2—figure supplement 1

Motile cilia beating pattern in the central canal of 30 hpf embryos.
(A) Kymograph of motile cilia dynamics in the ventral central canal associated to Figure 2B1. Note the diversity of beating patterns of neighboring cilia. Not only cilia beat at many frequencies, but some of them also show unrepeatable patterns. Horizontal scale bar is 20 µm, and vertical scale bar is 0.5 s. (B) Corresponding power spectral density map showing the position of the different maximal frequencies for each cilium. Note that some cilia show a power spectrum with several local maxima, accounting for the asynchronicity of the beating patterns observed. In order to obtain the frequency map as in Figure 2B2, we extract only the global maximum.
Figure 3 with 1 supplement
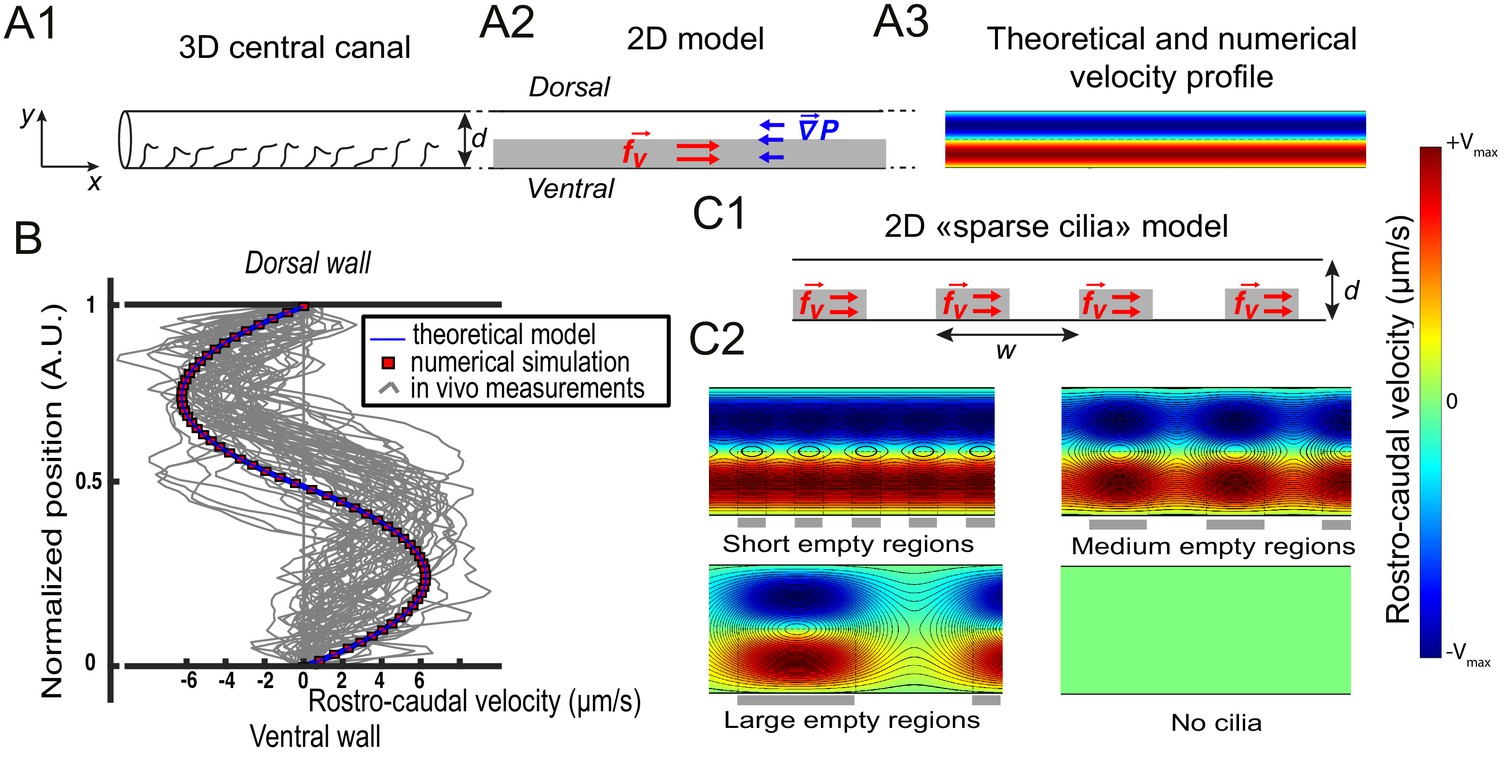
Theoretical and numerical results explain how motile cilia generate local CSF flow in 30 hpf embryos.
(A1) Schematic of the three-dimensional central canal that can be reduced to a quasi-cylinder whose ventral wall is paved by regularly positioned motile cilia, and whose dorsal wall is composed of more loosely distributed passive cilia. (A2) The model reduces the geometry to a bidimensional channel of thickness d, composed of two main regions occupying the ventral and dorsal halves of the channel. In the ventral region, the cilia contribution is modeled as a constant bulk force. A constant gradient of pressure, present in the whole central canal, opposes the cilia-induced force and ensures a global zero flux on a cross section. (A3) Numerically and theoretically calculated velocity maps, where dark blue represents highest rostral velocities (negative values), while dark red holds for the highest caudal velocities (positive values). (B) Numerical (red squares) and theoretical (blue line) velocity profiles, composed of two parabolas matched at the center of the cross-section (Relative position = 0.5). They are convincingly compared to a superimposition of in vivo measurements obtained on 57 WT siblings. (C1) ‘Sparse cilia’ model, accounting for the spatially inhomogeneous defects in cilia structure or motility (as observed in some mutants with defective cilia). The model reduces these defects to regions in the ventral side that are fully passive and where no force applies. Numerical simulations enable to derive the flow with an arbitrary distribution of these passive regions. (C2) Maps of characteristic streamlines obtained for various aspect ratios w/d of the repeat units. Small passive regions show most of the streamlines parallel to the walls. A central recirculation, or vortex, is gradually more present in between cilia regions as the lateral extension of the passive region increases. The corresponding distribution of pressure in the central canal for these different cases is represented in Figure 3—figure supplement 1.
Figure 3—figure supplement 1
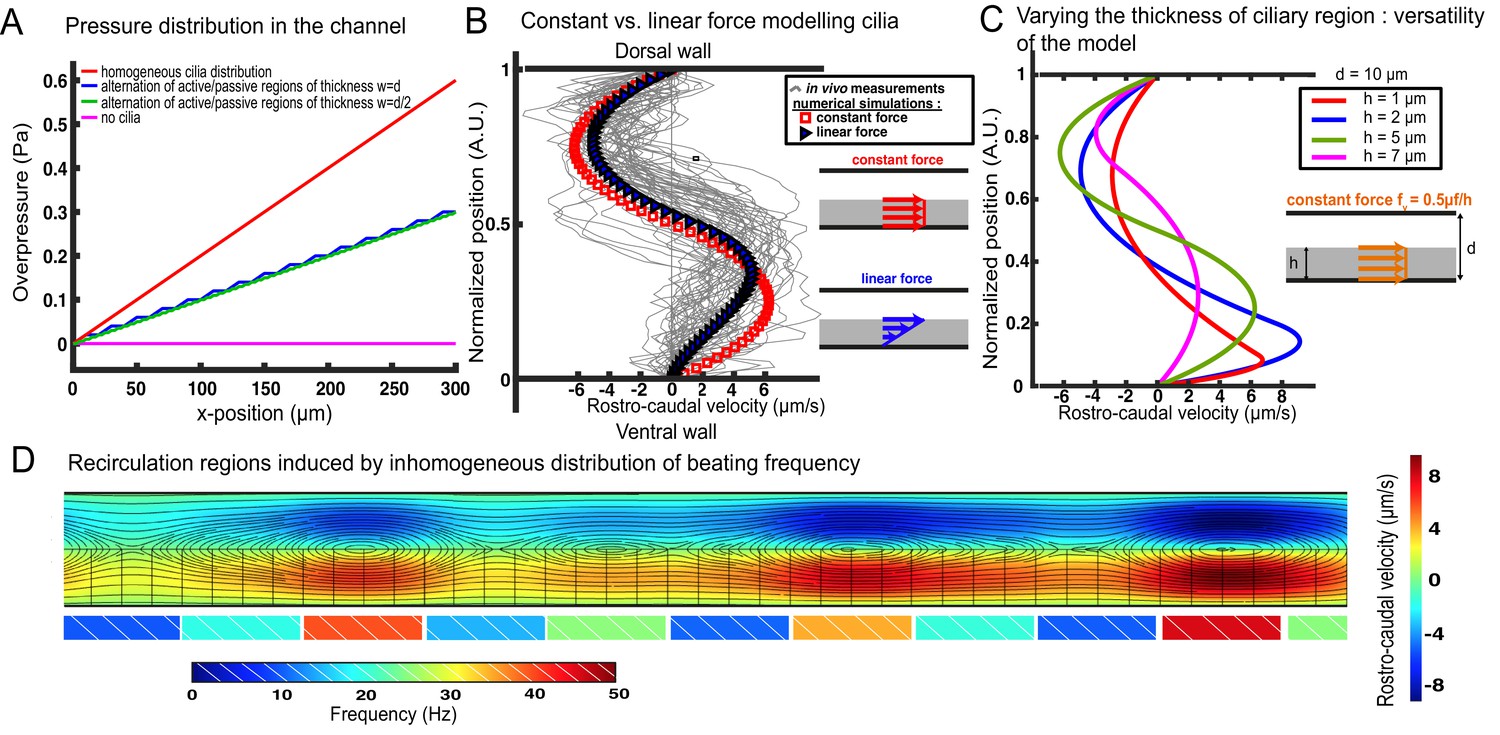
Additional information regarding our cilia-driven model and its consequences on local CSF flow and recirculation spots.
(A) Overpressure distribution in various 2-D central canals of length 300 µm and diameter d = 10 µm. The overpressure represents the excess of pressure with respect to the inlet of the CC (at the junction with the brain ventricle). In the case of a homogeneous cilia distribution (red curve), modeled as a constant force f_v = αμf/h, the pressure increases linearly in the caudal direction. In the case of a loose distribution of cilia, represented by an alternation of active regions with the aforementioned force fv and passive regions without any bulk force, the pressure follows a piecewise linear increase, whose frequency is controlled by the distance between active and passive regions: w = d for the blue curve and w = d = 2 for the green curve. The cilia activity is thus directly correlated to the excess of pressure in the central canal, as dramatically put in evidence by the magenta flat curve in the absence of any cilia activity. This excess of pressure in the central canal induced by the cilia activity could help maintaining the lumen of the channel open, explaining why the central canal is found to be collapsed in cilia mutants (Figure 4C). (B) In the main manuscript, we modeled the contribution of the cilia as a constant bulk force f_v = αμf/h in the ventral region occupied by the cilia. In a prior publication, Siyahhan et al. (2014) modeled it as a force linearly increasing with the distance to the wall (also located in the ciliary region). We show in this figure that this choice (blue triangles) does not substantially alter the velocity profile predicted by our model (red squares), which simply turns into a 3rd degree polynomial in the ventral half of the channel. The y-position for vanishing local velocity is slightly shifted towards the dorsal wall. (C) Our model still holds for variations of the relative thickness of the ciliary region and the dorsal region. Following the derivation detailed in the manuscript, the velocity profiles can be obtained for arbitrary values of h, at fixed t = 10 µm. The green curve corresponds to the zebrafish CC features, and the red curves corresponds to very thin cilia with respect to the diameter of the tube. This situation is representative to that encountered by Shields et al. (2010) with artificial magnetic cilia. They decided to model the effect of cilia as a moving wall entraining fluid. While this moving wall modeling correctly accounted for their observations in these high length ratio conditions, we point out that it would not successfully predict the flow in more common length ratios as it fully neglects the flow in the ciliary region. Conversely, our model accounts for the flow in the whole channel, which renders it very versatile to different geometries. (D) In Figure 3C, we have shown by numerical simulations that the alternation of active and passive regions can give birth to vorticity in the flow profile. Here, we show that recirculation regions can also be obtained from the succession of neighboring cilia with different beating frequencies. And the larger the difference in frequency, the larger the vortices. The black lines correspond to the trajectory of the flow, and the colormap in the channel corresponds to the rostro-caudal velocity. The colored rectangles under the ventral wall indicate the frequency for each spot in the simulation for the bulk force f_v = αμf/h. This choice is consistent with the in vivo measurements detailed in the Figure 2B of the main manuscript.
Figure 4 with 1 supplement
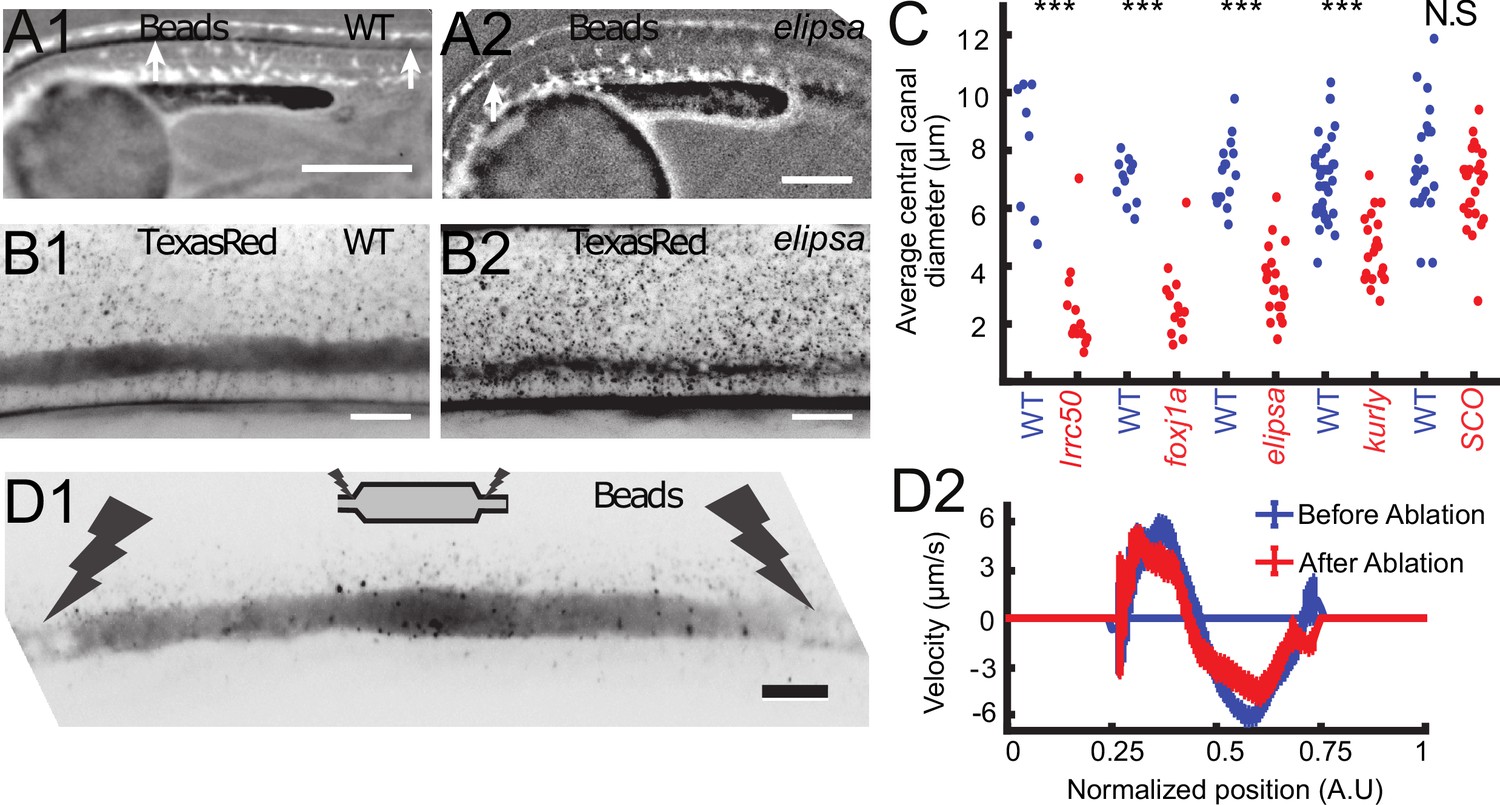
Cilia beating controls long-range transport, CC architecture, and local flow in zebrafish embryos.
(A1, A2) Progression of 20 nm fluorescent beads inside the CC 2 hr post injection (two hpi) in the diencephalic/mesencephalic ventricle in a WT 30 hpf embryo (A1) and in a ciliary mutant (elipsa) sibling (A2). The progression front is demarcated by the rightmost white arrow in (A1) and (A2), showing that beads barely propagate in central canal in ciliary mutants. (B1, B2) Central canal geometry in a WT embryo (B1) and in a ciliary mutant (elipsa) sibling (B2). The central canal was filled with Texas Red, and is displayed as the maximal projection image from a Z-stack of 30 images around CC. The CC appears collapsed in an elipsa mutant. (C) Quantification of CC diameter for different ciliary mutants (lrrc50, foxj1a, elipsa, kurly) and one curled down mutant with intact CSF flow (SCO) (red dots, right side) versus their WT siblings (blue dots, left side). (D1) Time average image of 20 nm fluorescence beads in inverted contrast of a central canal region where photoablation was performed on both sides (dark lightning bolt), closing the canal. (D2) Quantification of local CSF flow in the CC region in (D1) before (blue) and after (red) photoablation. CC geometry remains intact in the central region (D1), as well as the flow profile (D2). Scale bars represent 200 μm in (A1, A2), and 15 μm in panels (B1, B2, D1). P-values in (C) are respectively 2.2 10−6, 3.1 10−9, 3.5 10−6 1.82 10−8, 0.096 from left to right. The values for control WT siblings from all experiments are not statistically different.
Figure 4—figure supplement 1
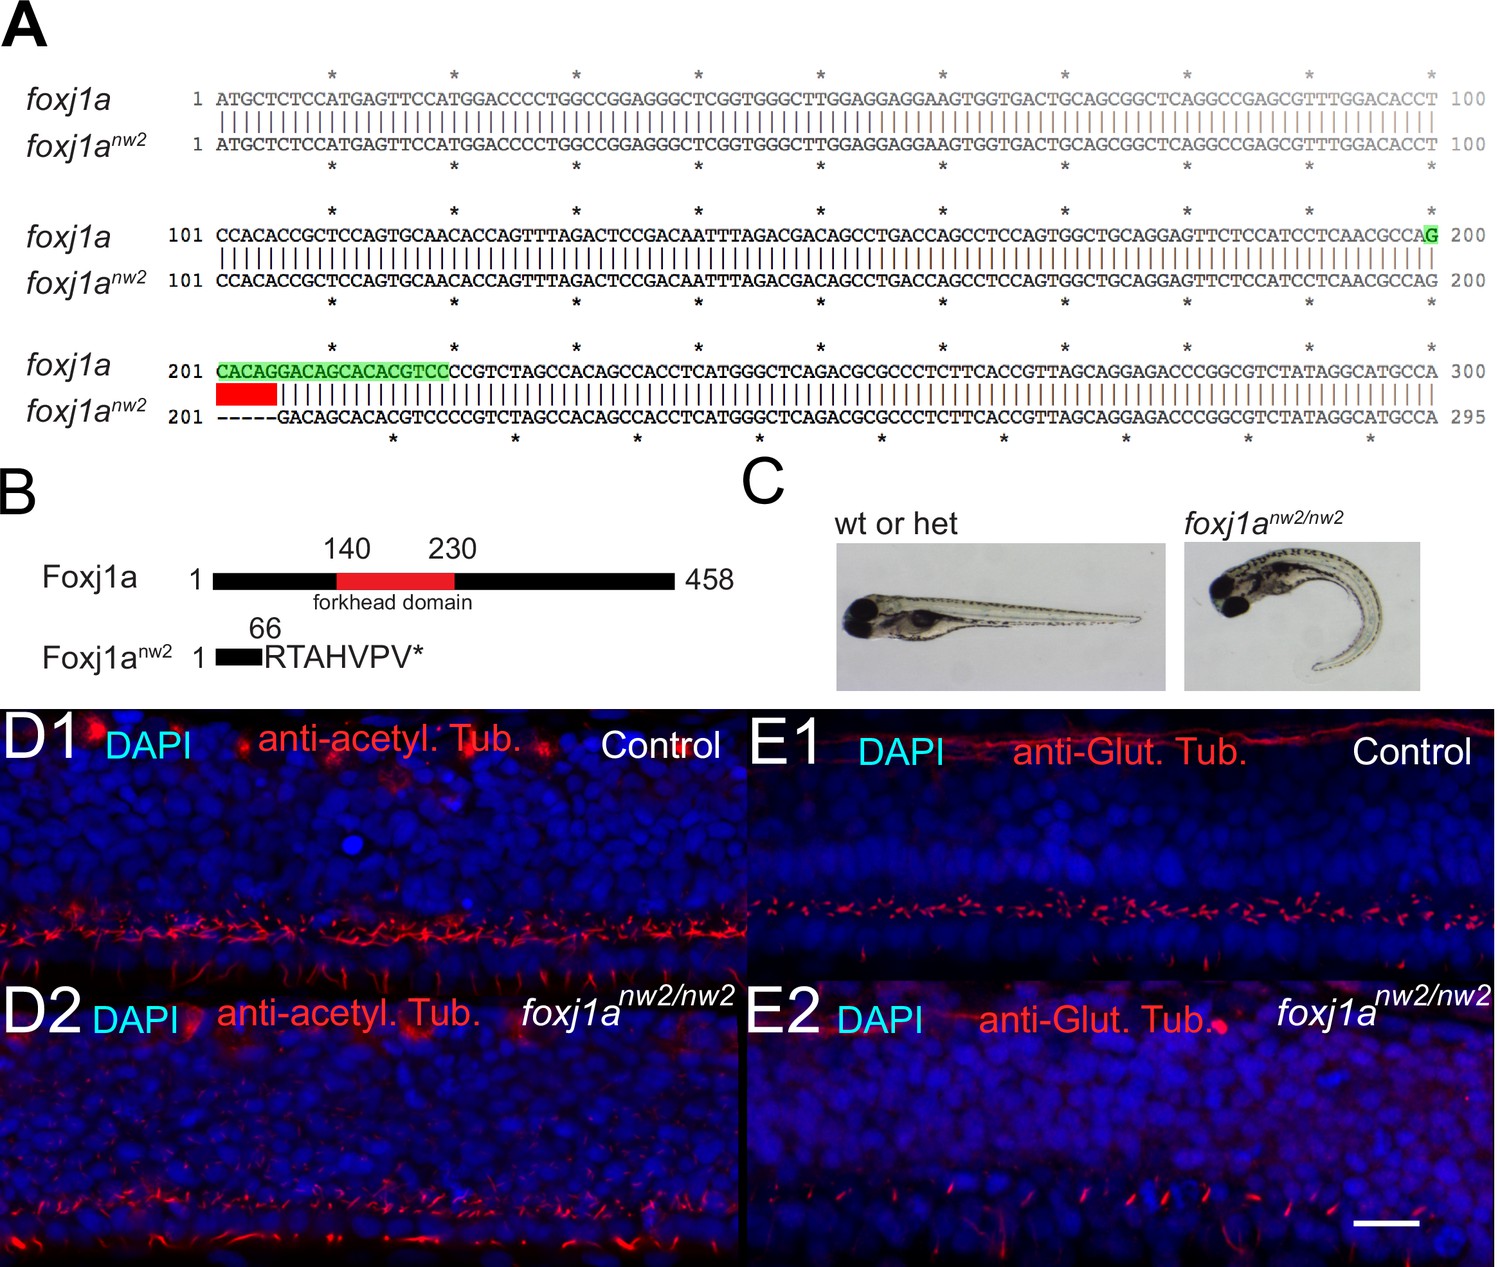
Characterization of cilia in the central canal of foxj1anw2/nw2 mutant embryo.
(A) Alignment of the first 300 base pairs (bp) of the coding sequence of WT and mutant Foxj1anw2 allelle reveals that the Foxj1anw2 mutant allele carries a deletion of 5 bp from base pair 201 to 205. The deletion is indicated in red. The gRNA sequence is highlighted in green. (B) The Foxj1a protein consists of 458 amino acids and includes a DNA-binding forkhead domain (from amino acid 140 to 230, indicated in red). The Foxj1anw2 mutant allele results in a truncated protein due to a frame shift and early stop codon and lacks the forkhead domain. (C) - Foxj1anw2/nw2 homozygous mutant larvae display a curved body axis as seen on images of a control sibling (heterozygous or WT) versus a homozygous mutant larva taken with a stereomicroscope at four dpf. (D) Z-Projection stack of a lateral optical sections (Z-step = 1 µm over three sections) of the spinal cord immunostained with DAPI and against acetylated tubulin in a 30 hpf control sibling embryo (D1) and a foxj1anw2/nw2 curled-down embryo (D2). (E) Z-Projection stack of lateral optical sections (Z-step = 1 µm over three sections) of the spinal cord stained with DAPI and immunostaining against glutamylated tubulin in a 30 hpf control sibling (E1) and a foxj1anw2/nw2 curled-down embryo (E2). Scale bars are 15 µm.
Figure 5
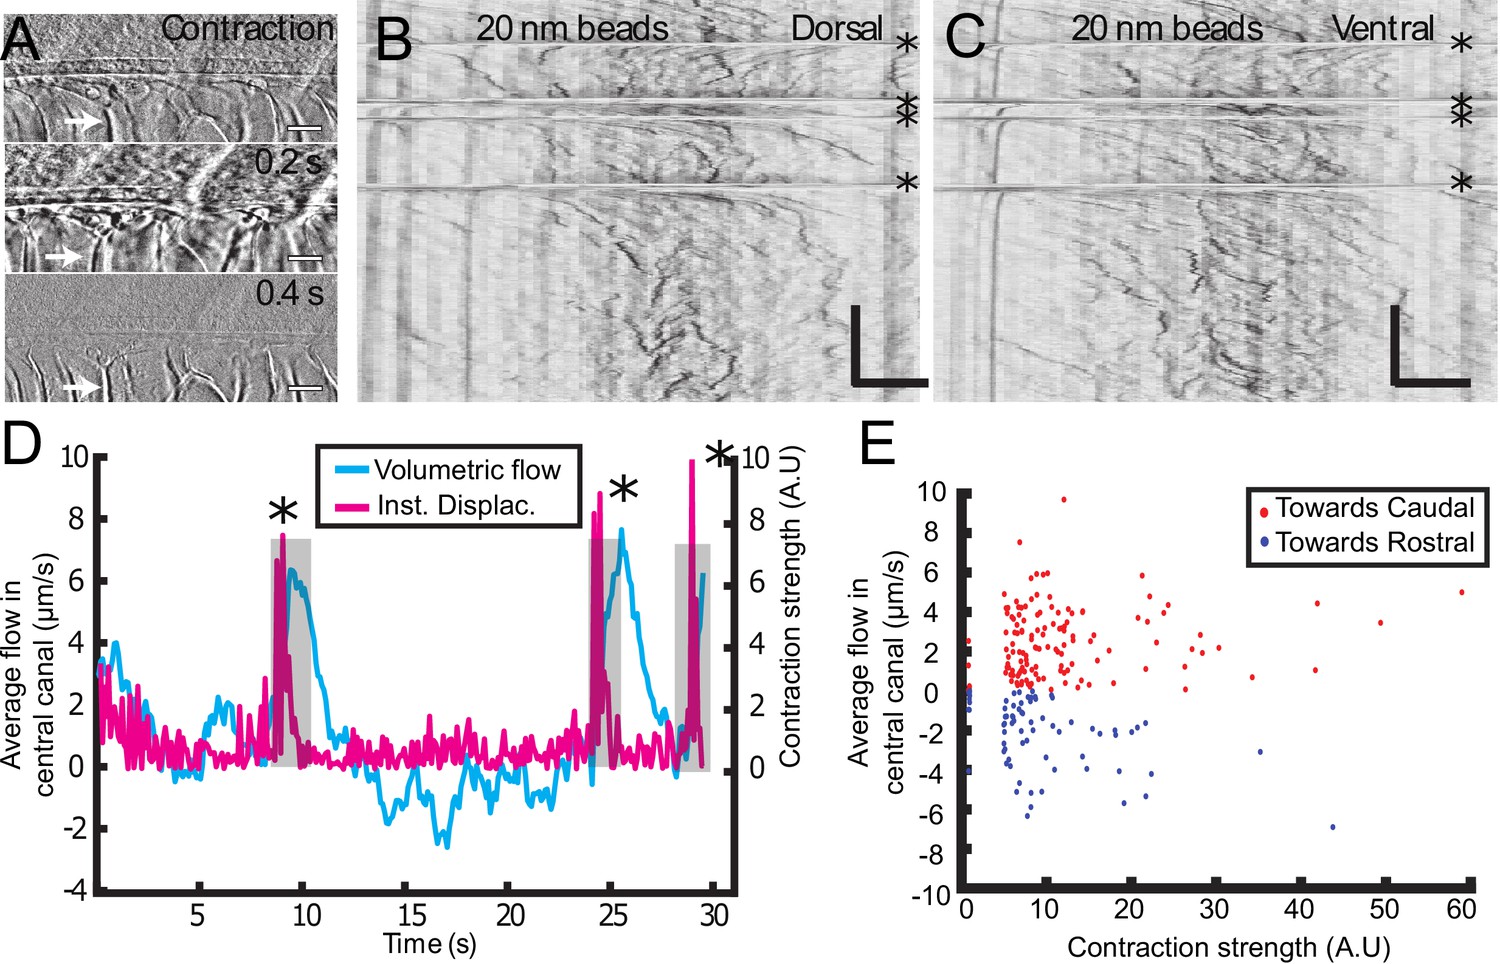
Muscle contraction transiently increases local CSF flow in the central canal.
(A) Three successive images showing the time derivative of the transmitted image of a zebrafish embryo during muscle contraction. A fast contraction in one direction is followed by a slower decay back to the initial position, during which the notochord comes back more slowly to its original position (white arrows). (B, C) Dorsal (B) and ventral (C) kymographs obtained after spinning disk imaging of injected 20 nm beads. Contractions can be identified as the sharp horizontal lines and are emphasized by the four black asterisks. (D) Average volumetric flow across one section of the central canal versus time (cyan) for one representative embryo. The embryo instantaneous displacement (magenta) is superimposed. Contractions are also emphasized by dark asterisks and a gray background. (E) Quantification of the integral of the average volumetric flow during 2.5 s after each of the 204 contractions from n = 22 WT embryos. These values are plotted versus the contraction strength, that is the integral of intensity derivative during the time of contraction. The dataset is separated into positive flows (red dots), in which flow after contraction is directed towards the tail, and into negative flows (blue dots), in which CSF flow is directed towards the head. Horizontal scale bar is 15 μm in (A, B, C). The vertical bar in (B, C) is 4 s.
Figure 6
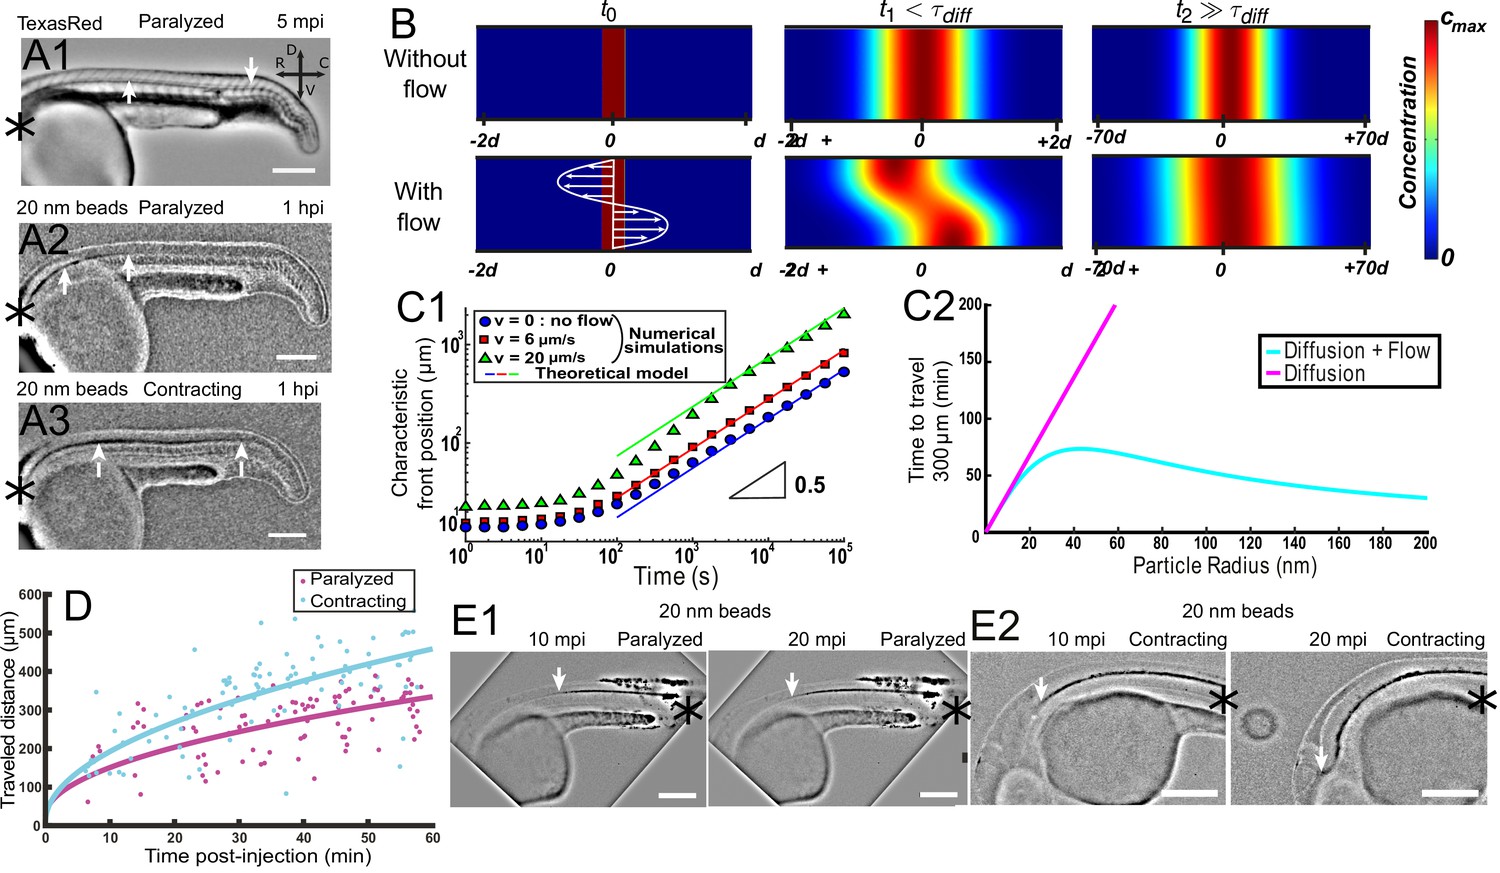
Local CSF flow accelerates bidirectional long-range transport along rostro-caudal axis in 30 hpf zebrafish embryos.
(A1) Inverted contrast fluorescence widefield image of the propagation front of Texas Red 5 min post-injection (mpi). (A2, A3) Inverted contrast fluorescence widefield image of the propagation front of 20 nm beads 1 hr post-injection in the DV/MV of a paralyzed (A2) and contracting (A3) embryo. White arrows in (A1, A2, A3) show CC and the propagation front. (B) Numerical simulation of Taylor Aris diffusion, accounting for long-range transport in central canal. A small region of high concentration is created at the beginning of the simulation (t0 – left column) with (bottom) and without (top) the flow. The propagation front first follows the local flow profile (t1, center column), but a Gaussian distribution is finally recovered with and without flow (t2, right column). However, the concentration front has propagated faster in the presence of flow. The color represents the local concentration in particles. (C1) Characteristic front position of 20 nm radius particles versus time for different bidirectional flow velocities in log scale (v = 0, 6, and 20 μm.s−1 for respectively the blue dots, the red boxes, and the green triangles), as calculated numerically. The colored solid lines correspond to the asymptotic prediction (0.5 line) of pure diffusion. (C2) Theoretical calculation of the average propagation time of a solution of spherical particles to travel 300 μm in central canal versus the particle radius with (cyan) and without (magenta) the bidirectional flow. (D) Experimental propagation front of injected 20 nm beads versus post-injection time, measured in 16 paralyzed (magenta) and 16 contracting (cyan) embryos. (E1, E2) Inverted contrast fluorescence widefield image of the propagation front of 20 nm beads injected in the caudal central canal of a paralyzed (E1) and active zebrafish embryo (E2), showing ‘reverse’ (caudal to rostral) transport between left (10 mpi) and right images (20 mpi). The black asterisks in (A1–A3, E1, E2) show the injection site. Scale bar is 200 μm in (A1, A2, A3, E1, E2).
Figure 7
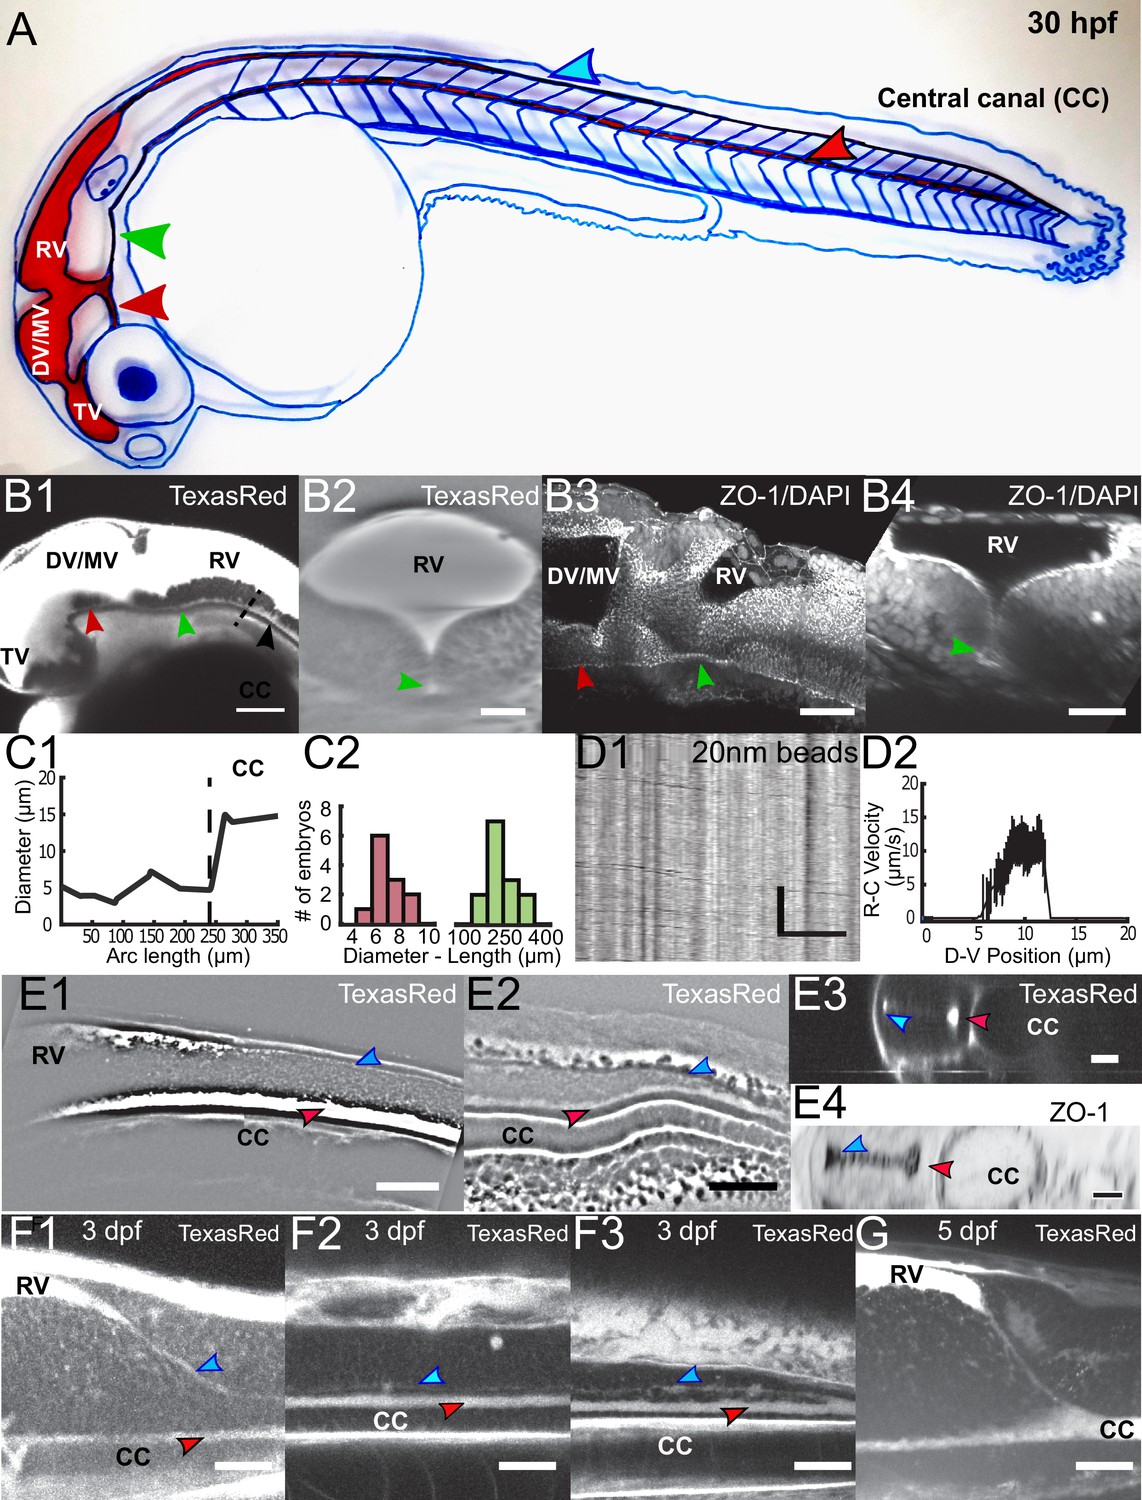
Embryonic CSF circulates between the brain ventricles and the central canal in the spinal cord through a complex circulation system.
(A) Handmade schematic of CSF distribution in a 30 hpf zebrafish embryo with CSF colored in red. A path ventral to the DV/MV and the RV lets CSF flow and merges into the CC. Dorsal to the CC, a path that is continuous to the RV merges with the CC in the filum terminale. (B1, B2) 2-photon imaging of TexasRed injected in the DV/MV of 30 hpf embryos shows the ventral opening of the primitive lumen of DV/MV and RV in lateral (B1) and coronal (B2) views. The path ventral to RV merges into the CC and has a smaller diameter. (B3, B4) two photon imaging of tight junction (ZO-1) and nuclei (DAPI) labeling of fixed 30 hpf embryos in lateral (B3) and coronal (B4) views highlights the complex circulation system of CSF in primitive lumens. (C1) Experimental measurement of the ventral opening of the RV lumen relative to its arc length. The diameter sharply increases at the beginning of the CC (black dashed line). (C2) Histogram of the ventral opening of the RV lumen showing diameter and length measured in 11 WT 30 hpf embryos (diameter of 7.1 ± 0.7 μm, ratio relative to CC diameter of 0.55 ± 0.12, as discussed in Methods, and 233 ± 24 μm long median ± 0.5 s.d.). (D1) Inverse contrast kymograph of 20 nm beads flowing in the path ventral to RV lumen after injection in the DV/MV. (D2) CSF flow profile inside the path ventral to RV, captured with our automatic kymograph analysis. (E1, E2) 2-photon imaging of TexasRed injected in the DV/MV of a 30 hpf embryo showing the dorsal opening of the CC primitive lumen as it leaves the RV (E1) and as it connects to the main opening of the CC lumen in the filum terminale (E2). The dorsal opening of the CC primitive lumen in its rostral part is also shown in coronal view (E3) and in a fixed 30 hpf embryo after a ZO-1 staining (E4). (F1, F2, F3) 2-photon imaging of TexasRed injected in the DV/MV of a three dpf larva showing the CC lumen in rostral (F1), central (F2), and caudal positions (F3). (F4) 2-photon imaging of TexasRed injected in the DV/MV of a five dpf larva indicates that the caudal end of the RV is at this stage directly connected to the single opening of the CC. Scale bar is 100 μm in (B1), 50 μm in (B3, E1, E2), 30 μm in (B2, B4, F1, F2, F3, G), and 15 μm in (D1, E3, E4). The vertical scale bar in (D1) is 3 s.
Figure 8
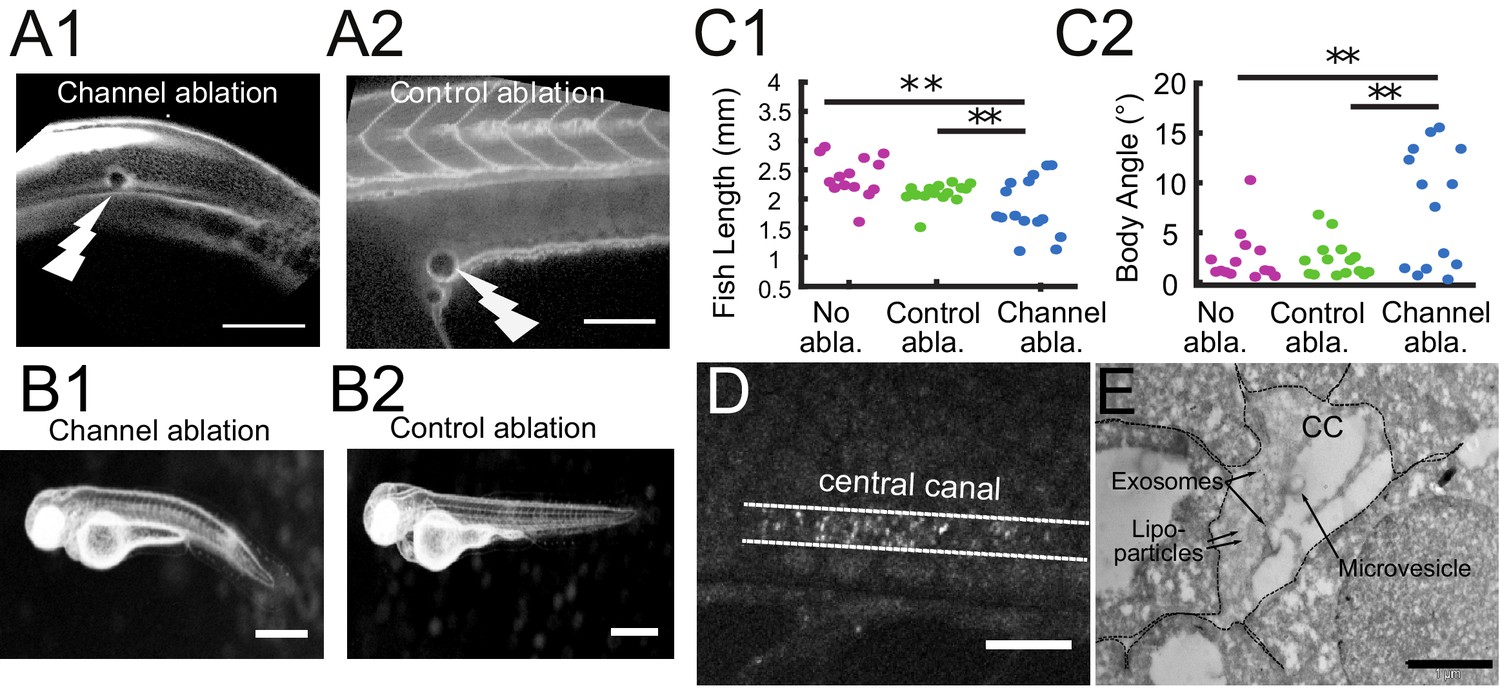
The connection between the brain ventricles and the central canal controls growth during embryogenesis.
(A1, A2) 2-photon image of fluid-filled cavities after Texas Red injection and after optical ablation at the rostral extremity of the CC connecting to the brain ventricles (A1), and in the yolk extension (A2 -control ablation). (B1, B2) Widefield transmitted images of 3 dpf zebrafish larvae 30 hr after the optical ablation of the CC rostral extremity (B1), or control ablation (B2). (C1, C2) Quantification of the fish total length (C1), and the main body angle (C2), 30 hr after Texas Red injection without ablation (magenta), after control (green) and CC rostral extremity l (blue) ablation with 14 larvae per category. P-values for length and angle are 1.3 10−3 and 3.0 10−3 respectively between the CC rostral extremity and no ablation, 9.6 10−3 and 6.4 10−3 between the CC rostral extremity and control ablation, and 0.066 and 0.89 (not significant) between the two controls. (D) Full field optical coherence tomography imaging of 30 hpf embryos reveals high density of secreted vesicles in central canal. (E) Electron microscopy with immunogold labeling of extracellular vesicles (EVs) in the CC of a one dpf zebrafish larva. Scale bar is 100 μm in (A1, A2), 15 μm in (D), and 500 nm in (E).
Appendix 2—figure 1
Additional results from numerical simulations supporting the theoretical model for transport.
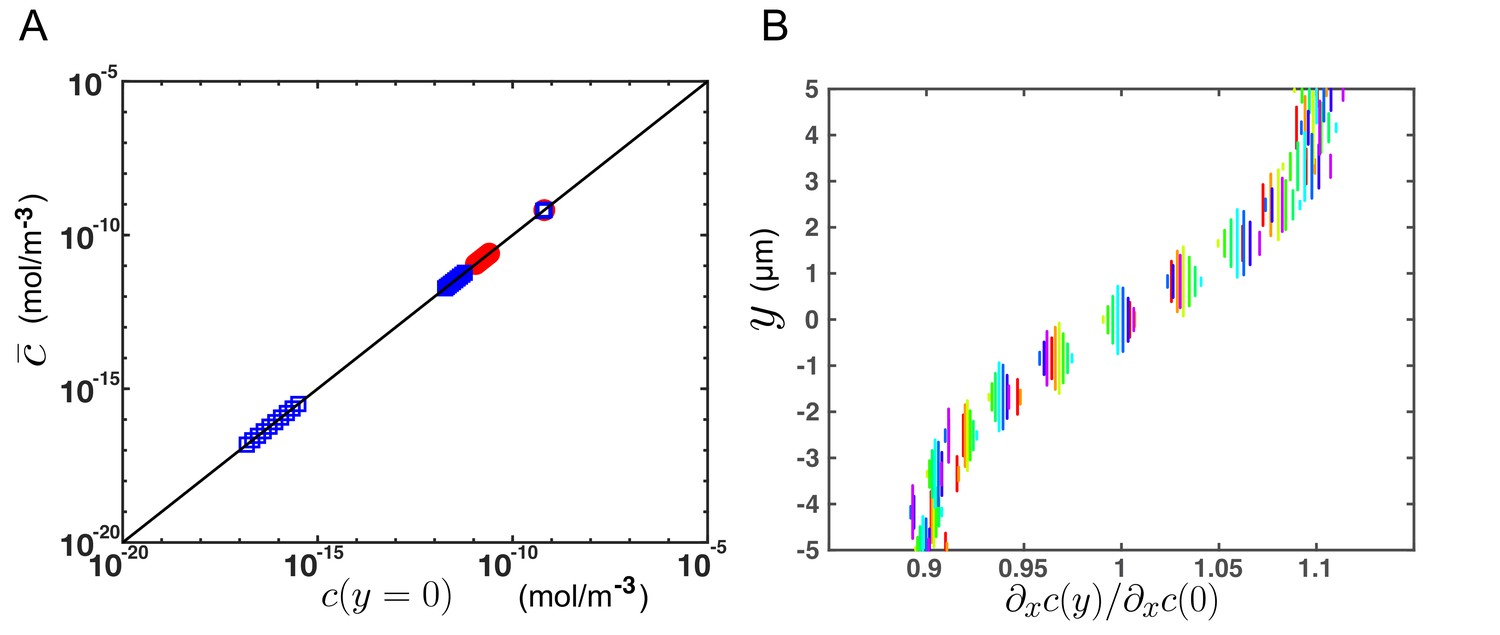
(A) Average concentration over a cross section versus concentration at the center of the CC (y = 0), for different flow velocities (Vmax = 6 or 20 µm/s), at different times and for different x-position in the channel, obtained from numerical simulations (FEM, COMSOL) on a 2-D central canal. The black line corresponds to and confirms the predictions of the theoretical model. (B) Relative variation of the axial gradient of concentration over a cross section (y-position), at various x-positions (corresponding to different colors), from numerical simulations. varies of about 10% around its mean value over a cross section, which justifies the assumptions done in the model (from Equations (A7) and (A8) to Equations (A9) and (A10)) to neglect its variations in comparison with the strong variations of the other integrand .
Author response image 1
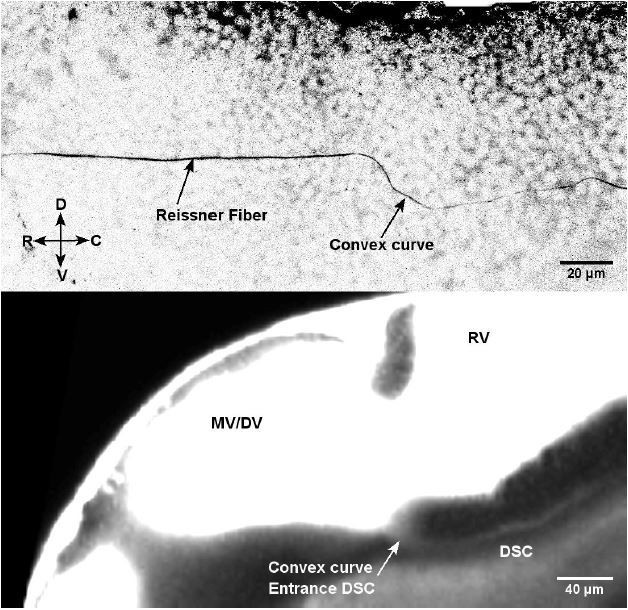
Immunostaining for Reissner material in 30 hpf embryos (Top image) most likely forms through the diencephalospinal canal showing a similar geometry as this canal (TexasRed in living embryo – Bottom image).
Videos
Video 1
Representative example of CSF flow observed in a 30 hpf WT embryo acquired with a spinning disk microscope at 10 Hz.
The video is replayed at 35 frames per second (fps). Rostral (R) is to the left, ventral (V) is bottom.
Video 2
Representative example of the automatic kymograph analysis of CSF flow in the central canal of a 30 hpf WT embryo.
For all successive dorso-ventral positions, the unprocessed kymograph (top left panel) is binarized based on intensity threshold (top right panel). Only traces with adequate length, angle, and eccentricity are kept (bottom left panel) and their orientation was measured, converted in a corresponding bead velocity, and aggregated into a histogram (bottom right panel).
Video 3
100 Hz video of the central canal where cilia are labeled with GFP in Tg (β-actin: Arl13b-GFP) transgenic embryos.
The video is replayed at 10 fps.
Video 4
Representative examples of CSF flow observed in intermediate ciliary mutants (elipsa mutants in the two top rows, and kurly mutant in the bottom row), showing either purely Brownian motion, or bidirectional flow with several vortices.
The raw data were acquired at 10 Hz, and the video is replayed at 20 fps.
Video 5
10 Hz video of 20 nm beads trapped between two ablated regions in central canal of a 30 hpf zebrafish embryo with spinning disk microscopy.
The video is replayed at 35 fps.
Video 6
One representative example of CSF flow change after contraction in the central canal, acquired at 10 Hz with spinning disk microscopy.
The video is replayed at 25 fps.
Video 7
A second representative example of CSF flow change after contraction in the central canal, acquired at 10 Hz with spinning disk microscopy.
The video is replayed at 25 fps.
Video 8
10 Hz video of 20 nm beads in the rhombencephalic ventricle of two 30 hpf zebrafish embryos with (left panel) and without (right) heartbeat with spinning disk microscopy.
The heart was stopped using butanedione. The video is replayed at 10 fps.
Video 9
2-photon 3D imaging of CSF-filled primitive lumens around the brain of a 30 hpf zebrafish embryo.
The left part shows the diencephalic/mesencephalic ventricle (DV/MV), rhombencephalic ventricle (RV) lumens with their respective ventral openings filled with TexasRed injected in the DV/MV. The same structures can be observed in a fixed embryo immunolabeled with ZO-1 (tight junctions) and DAPI at the right part of the movie.
Video 10
10 Hz video of 20 nm beads entering the ventral opening of the RV lumen of a 30 hpf zebrafish embryo with spinning disk microscopy.
The video is replayed at 35 fps.
Video 11
2-photon 3D imaging of CSF-filled structures in the spinal cord of a 30 hpf zebrafish embryo.
The left part shows the lumen of the central canal (CC), with its large opening and a smaller dorsal opening (blue arrow). The two openings can be observed at the right part of the movie in a live 30 hpf Tg(beta-actin:Arl13b-GFP) embryo with labeled cilia, as characterized by a higher density of cilia.
Video 12
100 Hz video of the fork where the two openings of the CC primitive lumen merge in the filum terminale in the tail.
Cilia are labeled with GFP in Tg (β-actin: Arl13b-GFP) transgenic embryos. The video is replayed at 20 fps.
Video 13
10 Hz video of lateral view of a 30 hpf zebrafish embryo with full field optical coherence tomography.
The video is replayed at 15 fps.
Video 14
Real-time video of the central canal of a one dpf zebrafish embryo expressing CD63-pHluorin in the YSL.
The video is replayed at 35 fps.
Tables
Key resources table
| Reagent type (species) or resource | Designation | Source or reference | Identifiers | Additional information |
|---|---|---|---|---|
| Genetic reagent (D. rerio) | hsc5Tg | (Borovina et al., 2010) | RRID: ZFIN_ZDB-ALT-100721-1 | referred to as Tg(β-actin: Arl13b-GFP) |
| Genetic reagent (D. rerio) | dnaaf1tm317b/tm317b | (van Rooijen et al., 2008) | ZDB-FISH-150901–13987 | referred to as lrrc50 |
| Genetic reagent (D. rerio) | foxj1anw2/nw2 | This paper | Generated and characterized by N. Jurisch-Yaksi. See Material and methods,'CRISPR/Cas9-mediated mutagenesis for foxj1anw2 mutants' | |
| Genetic reagent (D. rerio) | traf3iptp49d | (Omori et al., 2008) | RRID: ZFIN_ZDB-ALT-980413-466 | referred to as elipsa |
| Genetic reagent (D. rerio) | cfap298tm304 | (Brand et al., 1996; Jaffe et al., 2016) | RRID: ZFIN_ZDB-ALT-980413-707 | referred to as kurly |
| Genetic reagent (D. rerio) | scospondinicm15 | (Cantaut-Belarif et al., 2018) | RRID: ZFIN_ZDB-ALT-181113-4 | referred to as SCO |
| Antibody | mouse monoclonal IgG1 anti–ZO-1 | ThermoFisher | RRID: AB_2533147 | 1/200 Catalog # 33–9100 |
| Chemical compound, drug | FluoSpheresTM size kit #2, carboxylate-modified microspheres, yellow-green fluorescent (505/515), 2% solids, six sizes | Molecular Probes | F8888 | 20 nm beads were mostly used |
| Chemical compound, drug | TexasRed, dextran 3,000 MW, Neutral | ThermoFisher | D3329 | |
| Chemical compound, drug | α-Bungarotoxin | TOCRIS | 2133 | |
| Software, algorithm | Matlab | The MathWorks | RRID:SCR_001622 | |
| Software, algorithm | ImageJ | PMID: 22930834 | RRID:SCR_003070 | |
| Software, algorithm | COMSOL, Multiphysics | RRID:SCR_014767 |
Additional files
Download links
A two-part list of links to download the article, or parts of the article, in various formats.
Downloads (link to download the article as PDF)
Open citations (links to open the citations from this article in various online reference manager services)
Cite this article (links to download the citations from this article in formats compatible with various reference manager tools)
Origin and role of the cerebrospinal fluid bidirectional flow in the central canal
eLife 9:e47699.
https://doi.org/10.7554/eLife.47699


