Free circular introns with an unusual branchpoint in neuronal projections
- University of Massachusetts Medical School, United States
- Howard Hughes Medical Institute, Harvard University, United States
- Harvard University, United States
Figures
Figure 1 with 3 supplements
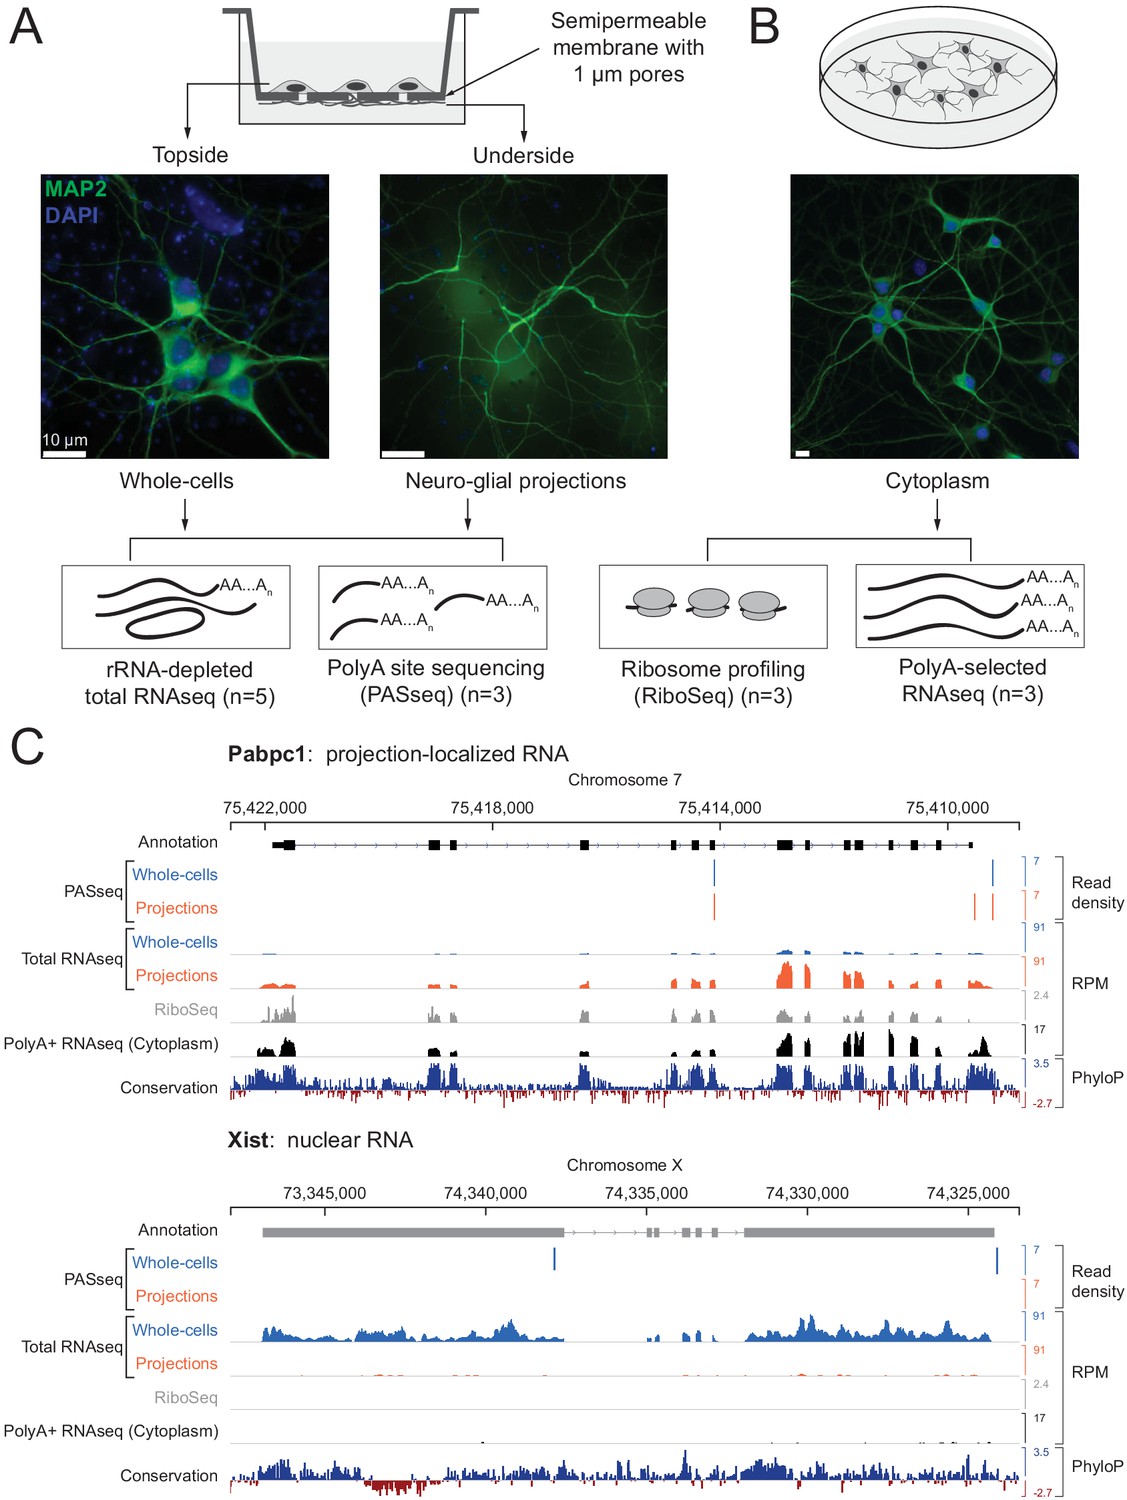
Experimental design and data validation.
(A) Imaging of MAP2 protein immunostaining (neuronal marker, green) and DAPI fluorescence (nuclear marker, blue) confirms that the bottom surface of neuronal cultures on a semipermeable membrane (cartoon, top) consists only of neuro-glial projections. Total RNAseq and polyA site RNAseq (PASseq) datasets were generated from the top surface (‘whole cell’) and bottom surface (‘projection’) lysates. (B) Standard plate cultures, fractionated to remove nuclei, were used to prepare ribosome profiling and cytoplasmic polyA+ RNAseq datasets. (C) Genome browser plots of read densities (sum of three replicates) and sequence conservation (PhyloP scores on 20 aligned vertebrate genomes, Pollard et al., 2010) for a projection-localized mRNA and a nuclear noncoding RNA (RPM = Reads per million mapped).
-
Figure 1—source data 1
Number of reads sequenced and alignment statistics for each library.
- https://cdn.elifesciences.org/articles/47809/elife-47809-fig1-data1-v2.xlsx
Figure 1—figure supplement 1
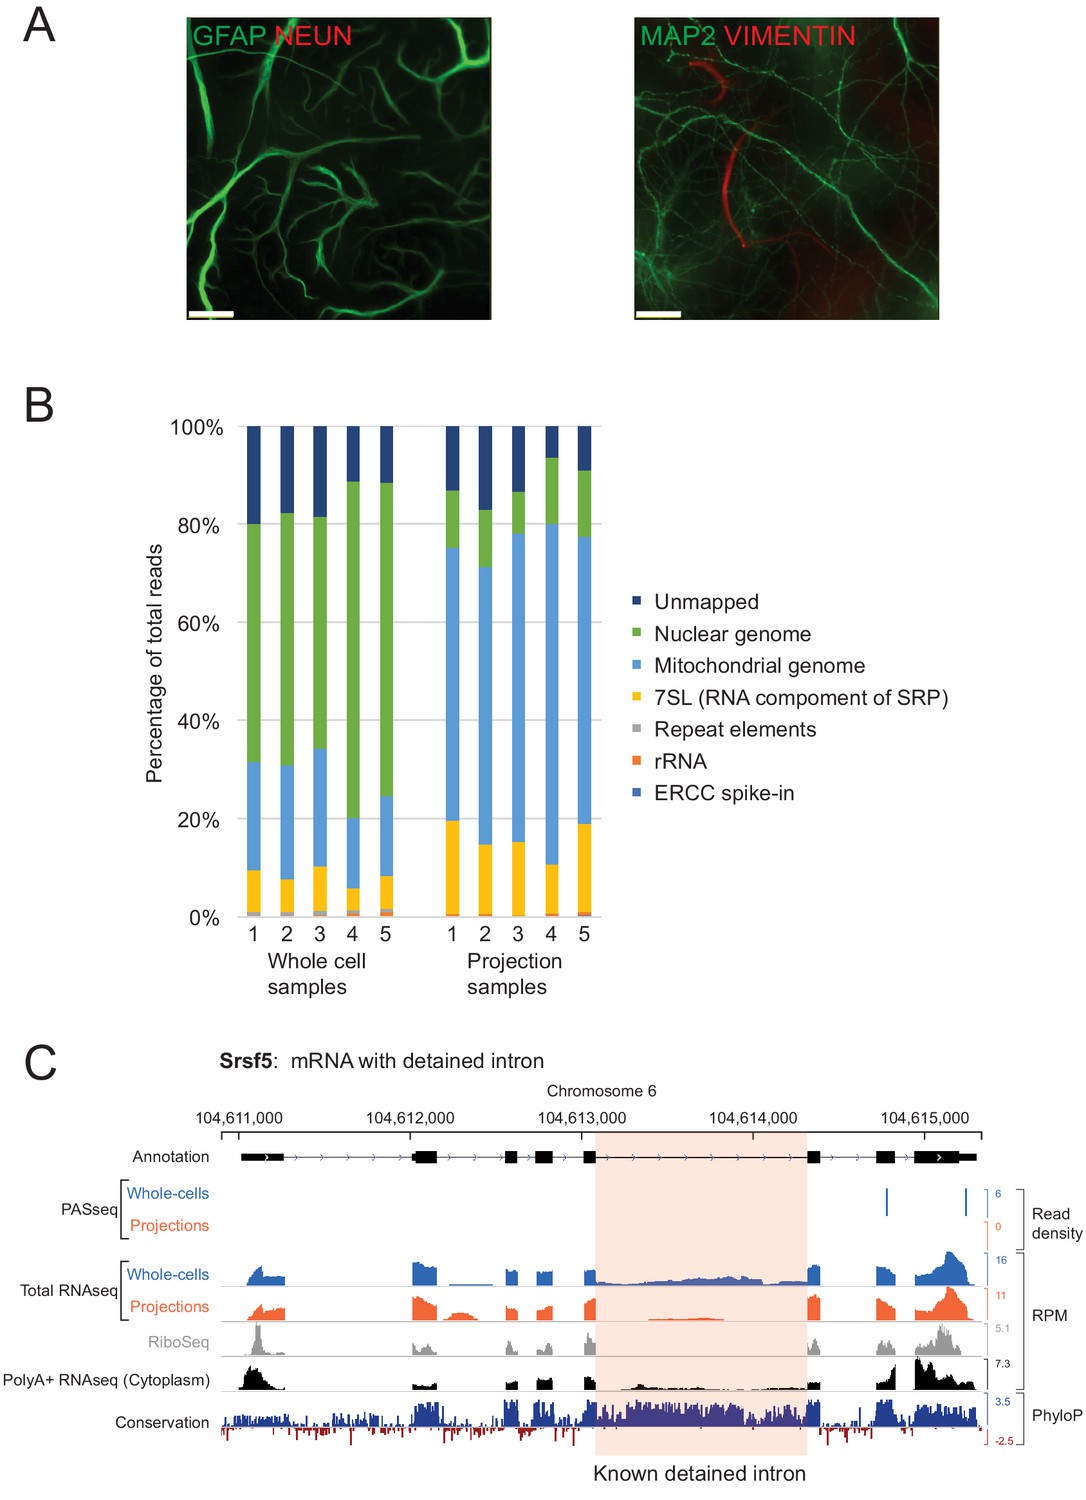
Separation of neuro-glial projections from cell bodies.
(A) GFAP and Vimentin (VIM) immunopositive projections pass through the semipermeable membrane and are visible on the bottom surface by immunofluorescence imaging. (B) Percentage of total RNAseq reads from whole-cells and projections aligning to various genomic regions. A majority of reads from projection RNAseq data align to the mitochondrial genome. (C) Genome browser plot of read densities and sequence conservation for Srsf5, an mRNA with a known detained intron (highlighted in pink).
Figure 1—figure supplement 2
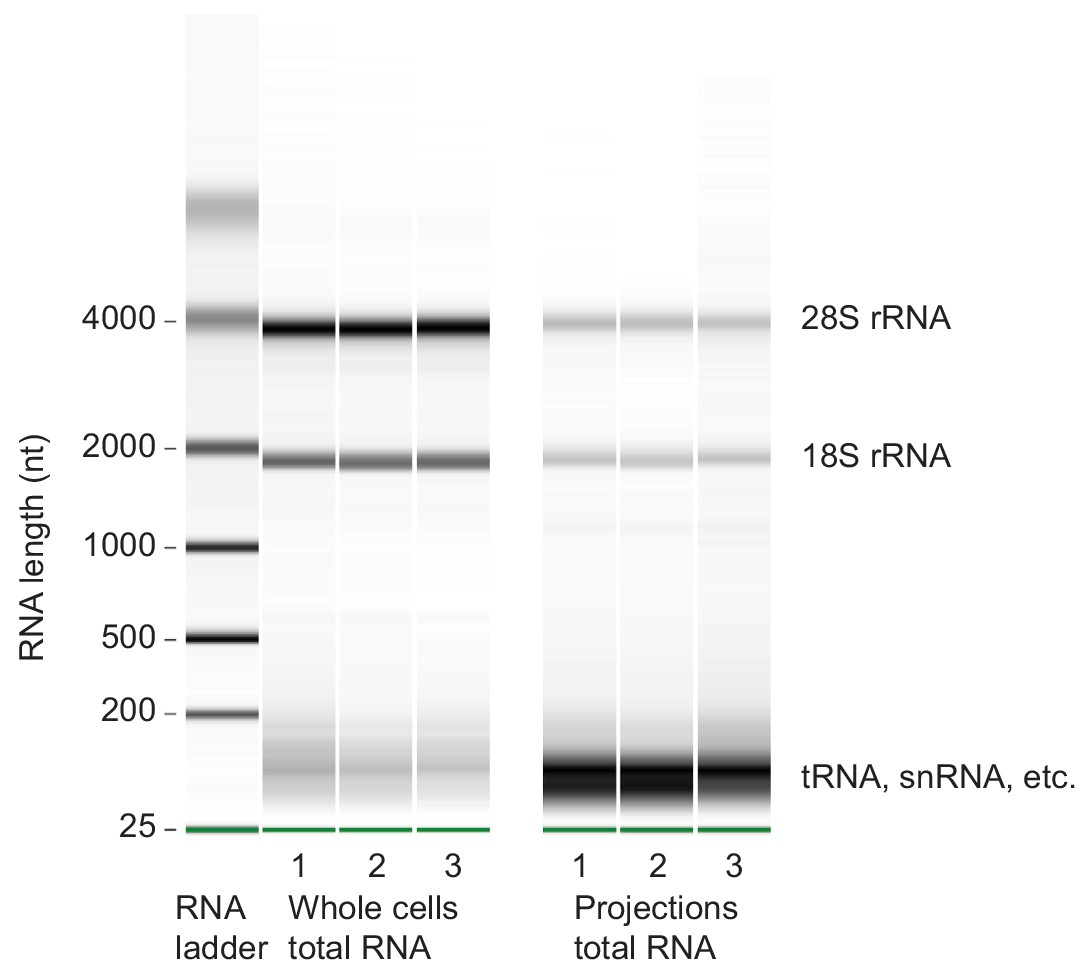
Microcapillary electrophoresis of total RNA from whole cells and projections.
Microcapillary electrophoresis of total RNA (Bioanalyzer RNA pico assay) from whole cells and projections of three biological replicates. Only RNAs >~150 nt were sequenced for this study. In projections, the band at ~100 nt was striking. By sequencing RNAs within 20–150 nt size range, we found that they were mostly full length and fragmented tRNAs (unpublished data).
Figure 1—figure supplement 3
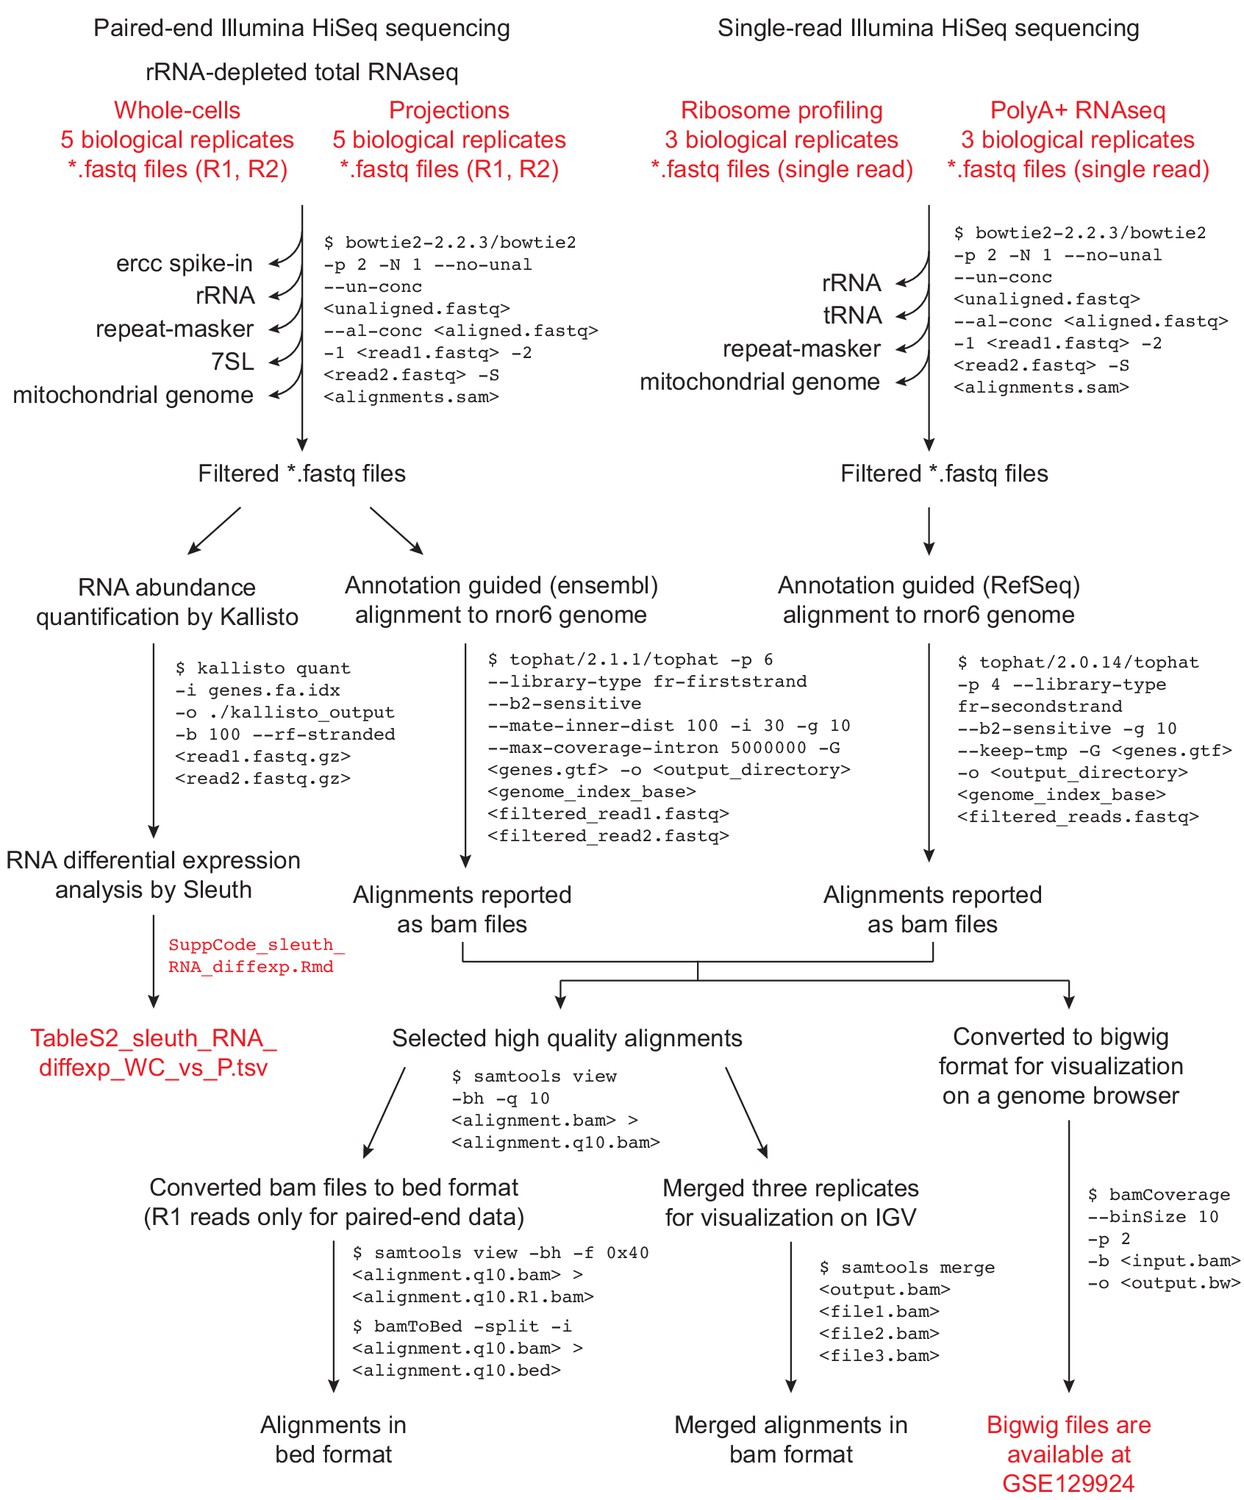
Data analysis workflow.
Data analysis workflow for sequence alignments and RNA abundance quantitation. Files provided as supplementary data or available at GSE129924 are in red text.
Figure 2 with 2 supplements
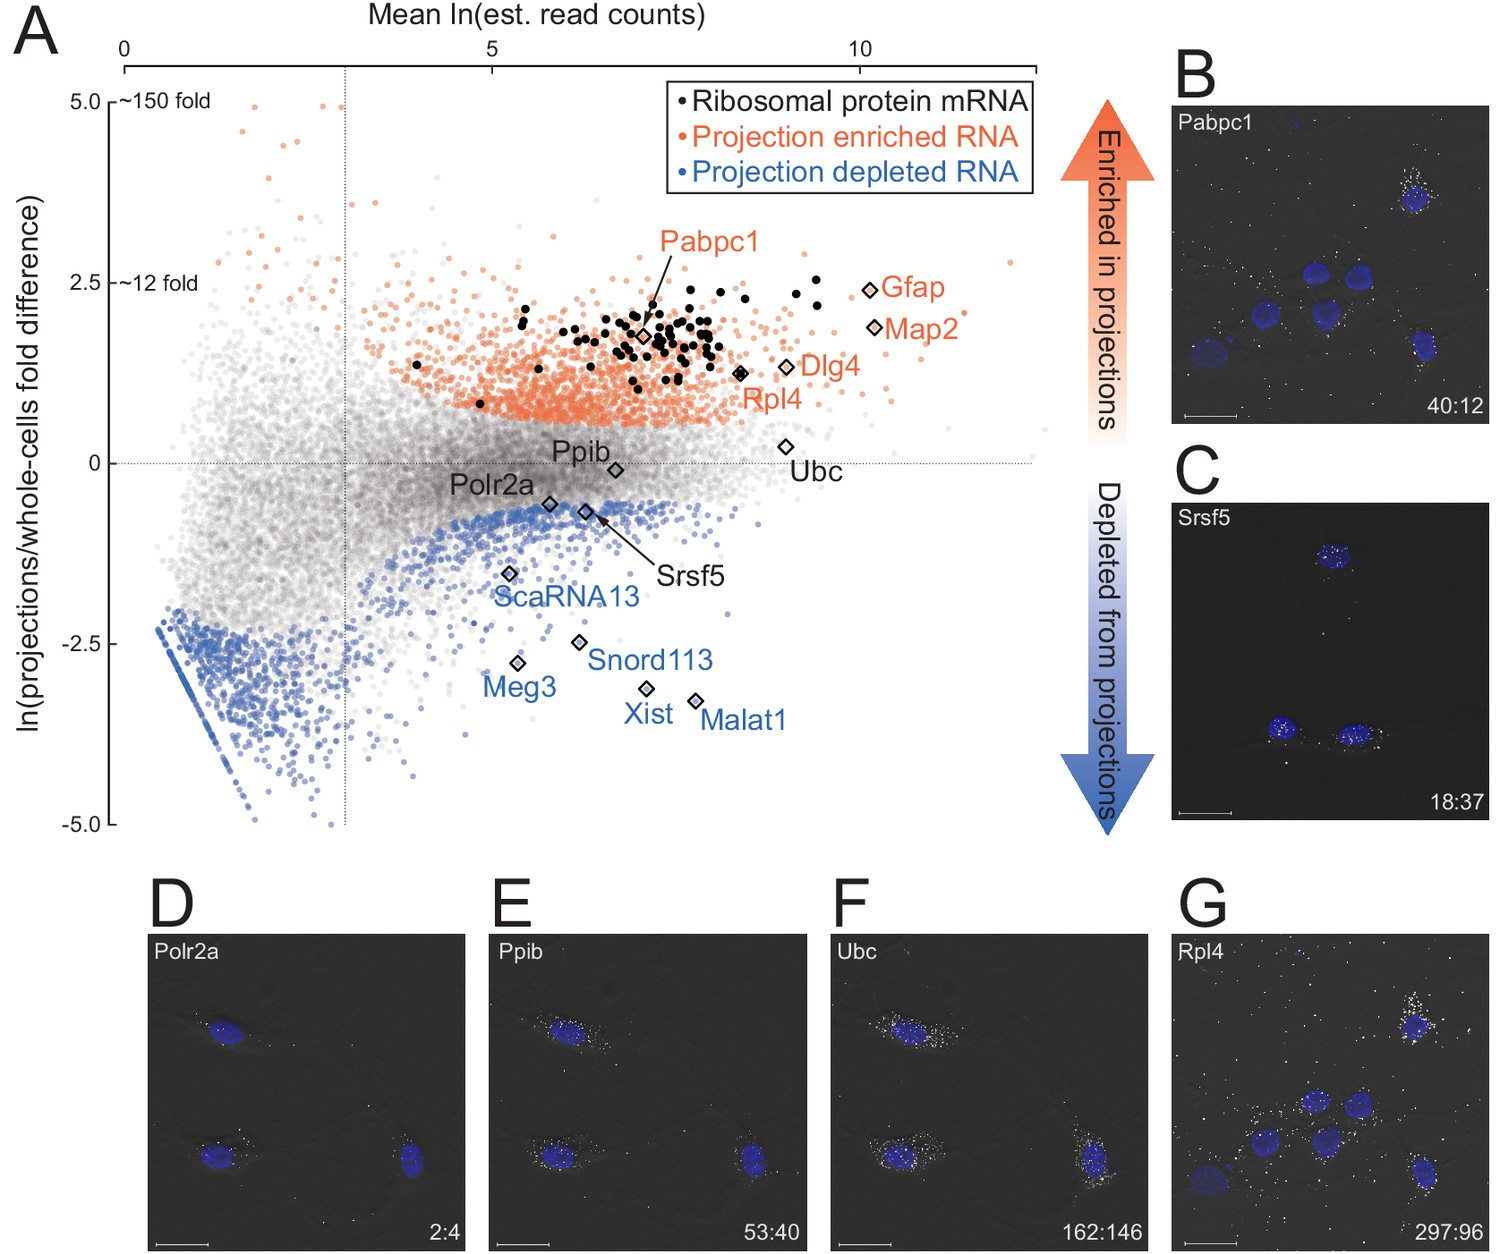
Quantitative analysis of RNA localization.
(A) Scatter plot comparing log mean read counts and log fold difference in projections versus whole cells, for 19,815 RNA transcripts with non-zero read counts. 1440 (orange dots) are significantly enriched (q-value < 0.01 and fold-change > 1.5) in projections, 1486 (blue dots) are enriched in whole cells, and 16,899 (gray dots) show no significant enrichment in either sample. Ribosomal protein encoding RNAs are shown as black dots; rhombi enclose labeled RNAs. (B–G) smFISH validation of examples of projection-localized (B) versus projection-depleted (C), and low (D), medium (E), high (F), and higher (G) abundance mRNAs. Upper left corner shows gene name, lower right corner shows projection:whole cell TPM. Scale bars = 20 μm.
-
Figure 2—source data 1
Isoform abundances and differential expression analysis output.
- https://cdn.elifesciences.org/articles/47809/elife-47809-fig2-data1-v2.tds
-
Figure 2—source data 2
Sequences targeted by smFISH probes.
- https://cdn.elifesciences.org/articles/47809/elife-47809-fig2-data2-v2.xlsx
Figure 2—figure supplement 1
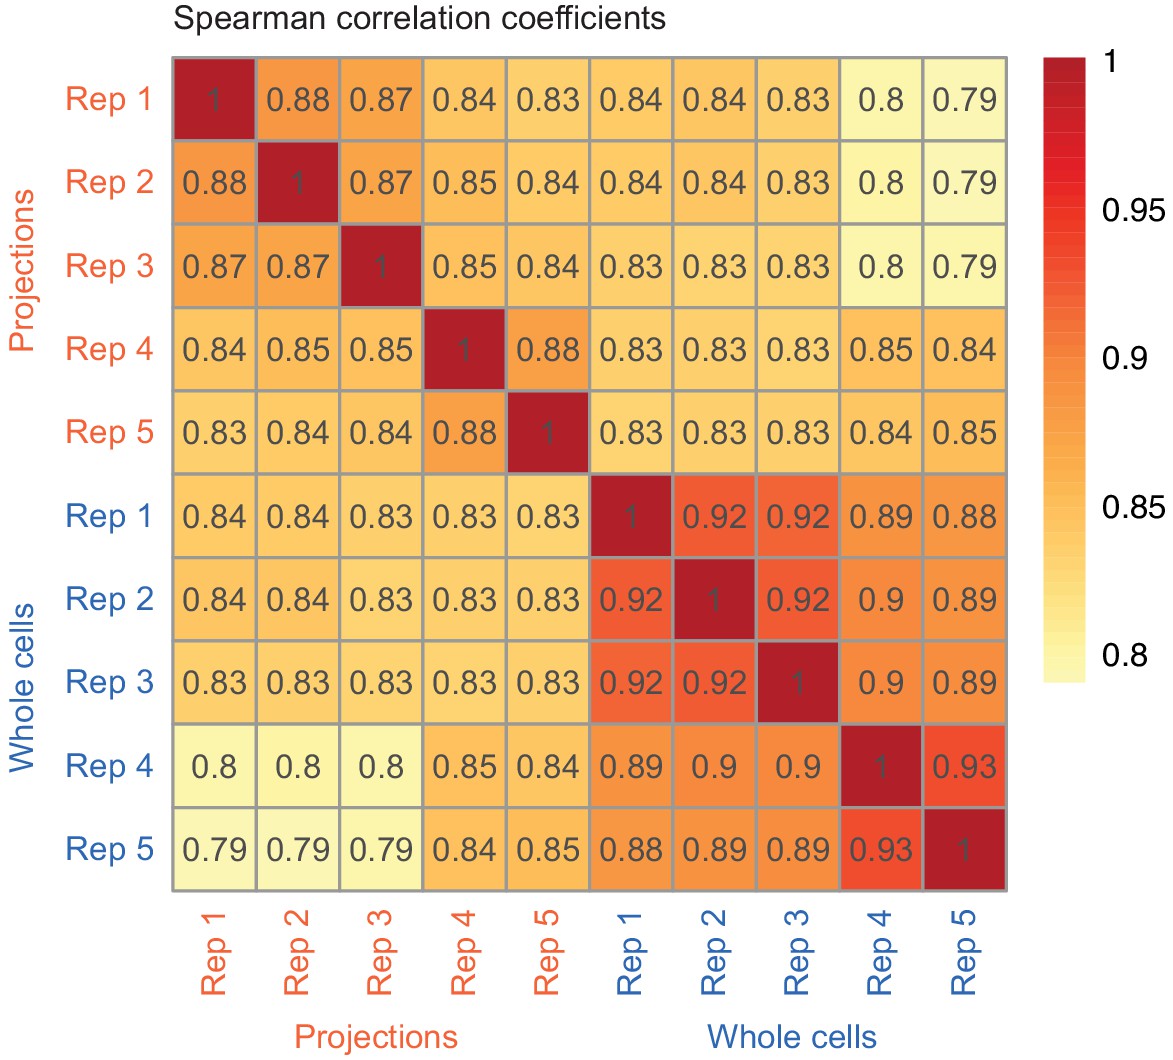
Correlation between RNAseq from biological replicates.
Correlation between biological replicates (TPM values) of whole cell and projection RNAseq datasets. The color gradient corresponds to the value of Spearman’s correlation coefficient shown in each cell of the heatmap.
Figure 2—figure supplement 2

Gene ontology classes enriched in projections and whole cells.
Gene ontology classes significantly represented by genes enriched in projections or whole cells. CC = Cellular Component sub-ontology classification.
Figure 3 with 2 supplements

A subset of introns localize to projections.
(A) Cartoon illustrating how we define intron regions as the intersection of all annotated introns. For two mock alternatively spliced isoforms, black rectangles are exons, lines are introns; vertical dotted lines mark the intron region boundaries. (B) Inset: Venn diagram showing the number of intron regions that we consider to show reliable read coverage (at least one read in each replicate and mean read density > 0.005 reads/nucleotide). Scatter plot comparing mean mapped reads per intron region (+1 pseudocount) from five biological replicates of projections versus whole cell RNAseq data. Out of 190,180 intron regions (gray), 57,432 pass the detectability threshold in whole cell (blue overlay) and 1632 in projection (red overlay) libraries. Rhombi enclose labeled RNAs.
-
Figure 3—source data 1
Compilation of observations on all 190,180 intron regions.
- https://cdn.elifesciences.org/articles/47809/elife-47809-fig3-data1-v2.tds
Figure 3—figure supplement 1
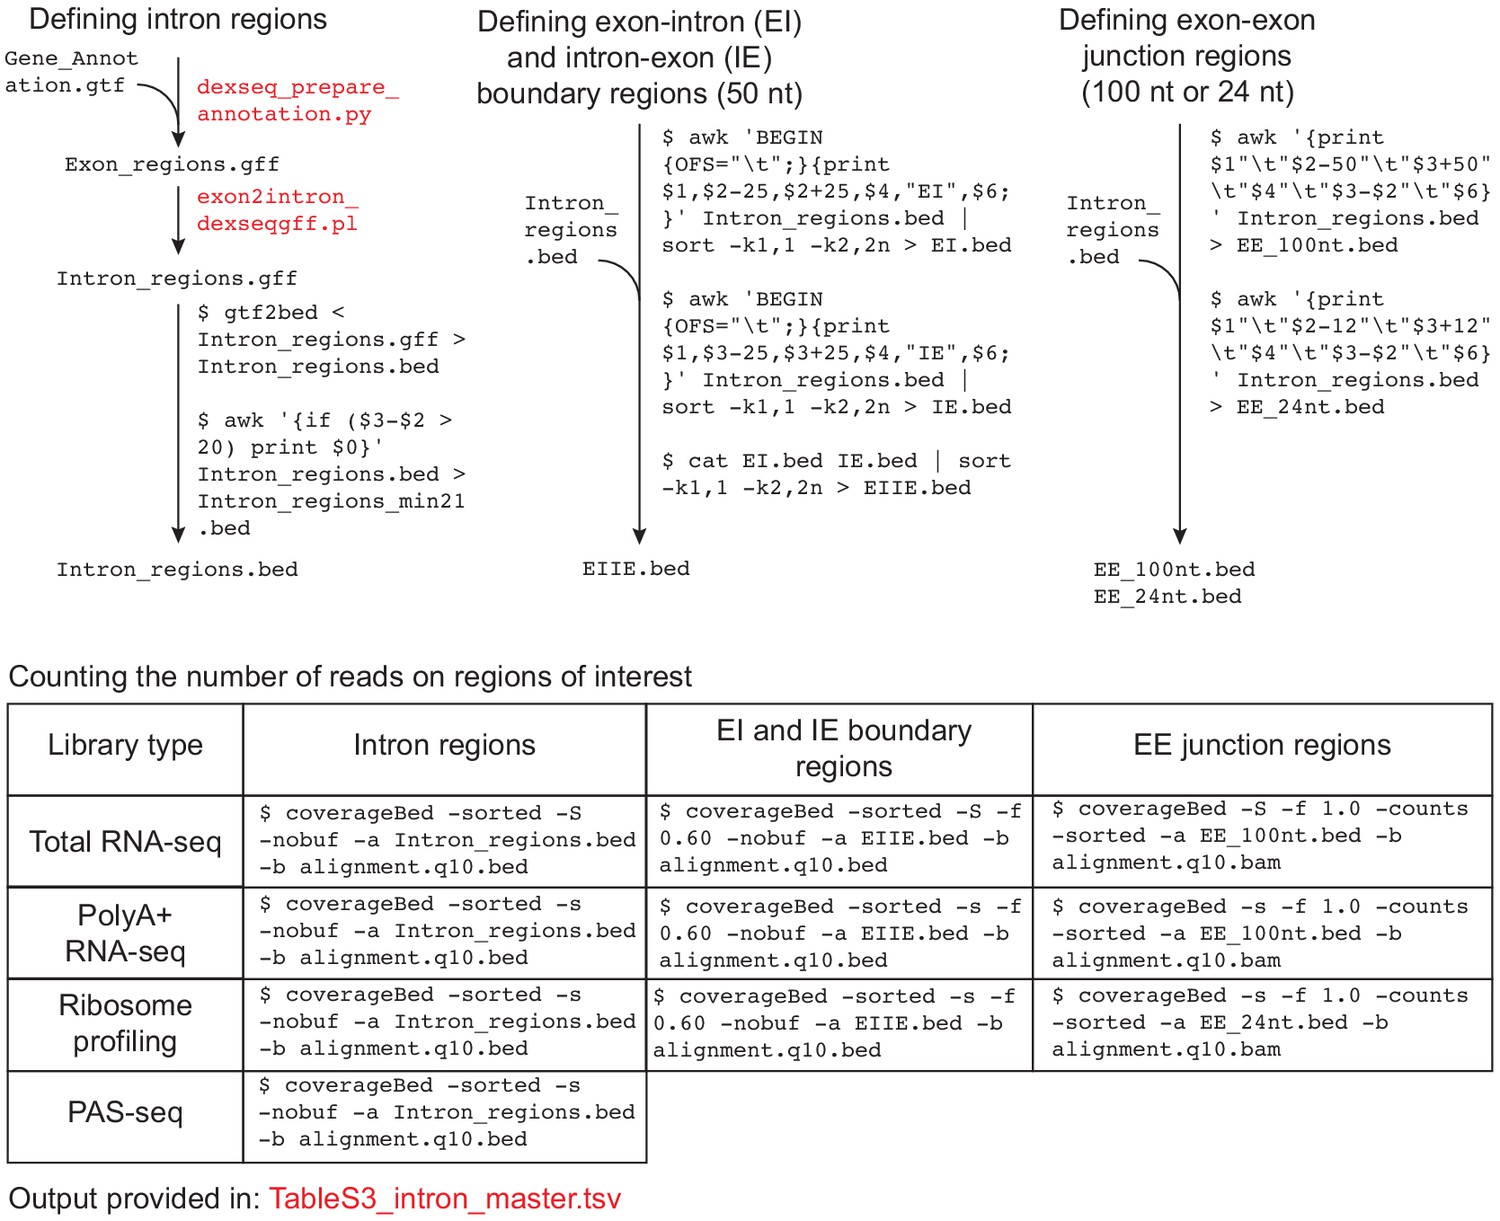
Data analysis workflow to count reads on intron regions.
Data analysis workflow to count reads on intron regions. Files provided as supplementary data or available at GSE129924 are in red text.
Figure 3—figure supplement 2
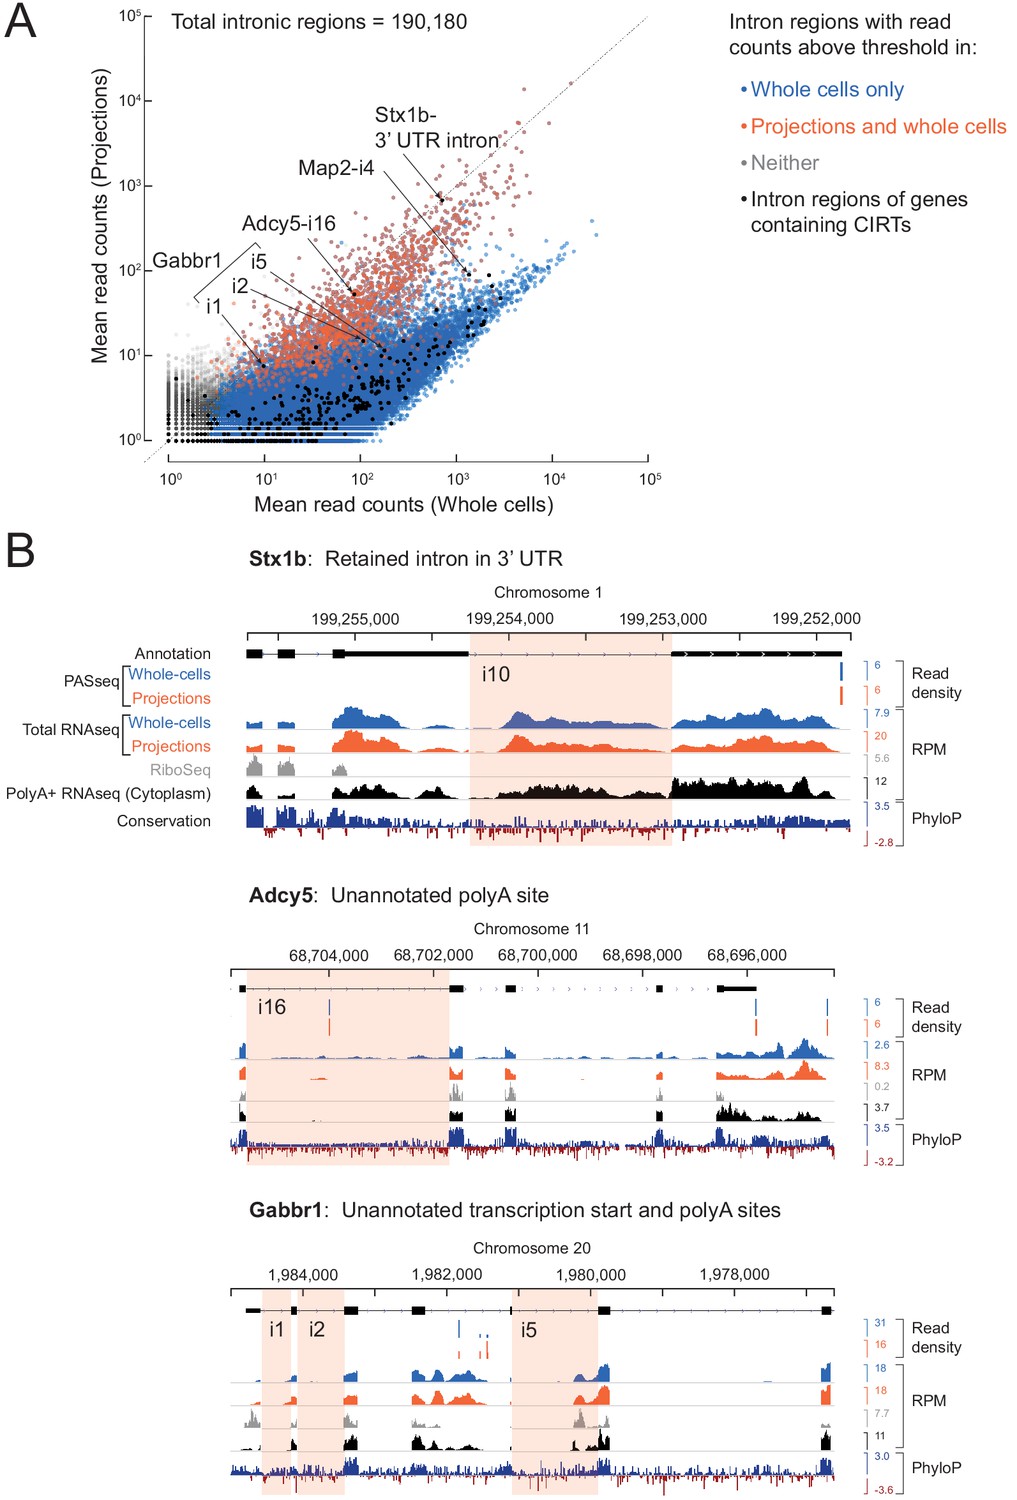
Comparison with previously reported retained introns in dendrites.
(A) In Buckley et al. (2011), 27 genes with cytoplasmic intron retaining sequences (CIRTs) were reported. All introns (n = 436, black dots) of genes containing CIRTs (n = 25) are overlaid on the scatter plot from Figure 3. Six intron regions pass the detection threshold in our projection RNAseq data and are labeled. (B) Genome browser plots for introns labeled in (A) with the relevant intron highlighted in pink. A retained intron in the 3’ UTR of Stx1b was also observed by Yap et al. (2012). Gabbr1 has multiple annotated isoforms, of which only one is shown. RNAseq reads on Map2-i4 (not shown here) come from an unannotated exon.
Figure 4 with 4 supplements
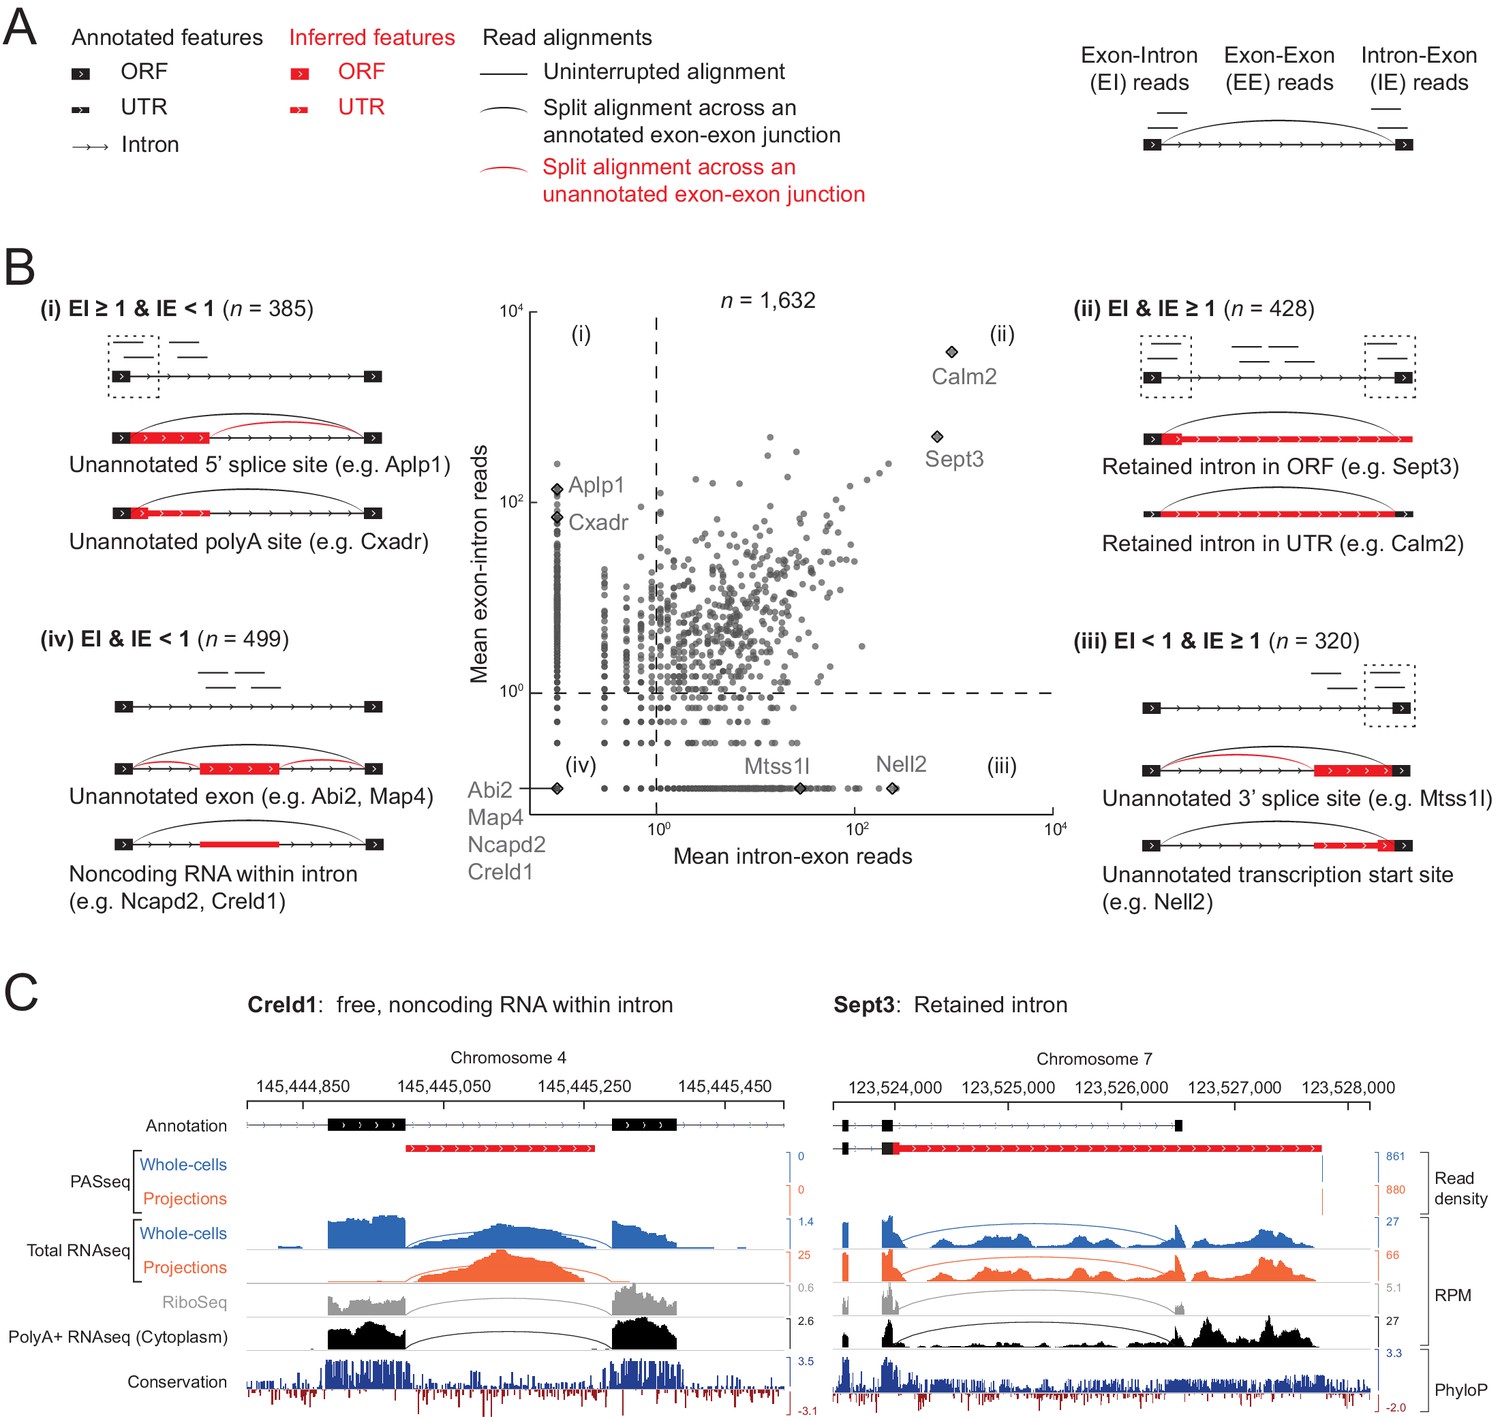
Classification of 1632 projection-localized intron regions.
(A) Description of symbols used to show annotated gene structure and types of read alignments. Rectangles represent annotated (black) or inferred (or unannotated, red) coding (ORF, Open Reading Frame) and noncoding (UTR, UnTranslated Region) exons. Lines represent introns and arrows point in the 5’ to 3’ direction of the transcript. Uninterrupted read alignments are shown as lines whereas arcs depict split reads connecting spliced exon-exon junctions. (B) Scatter plot of mean read coverage (+0.1 pseudocount) of 50 nt exon-intron (EI) versus intron-exon (IE) boundary regions in projection RNAseq samples. Dashed lines indicate thresholds set to EI = 1 and IE = 1 that divide introns into four quadrants (i-iv). Representative sketches depicting the situations within each quadrant are shown. n shows the number of intron regions in each quadrant. (C) Genome browser views of read coverage (sum of three biological replicates) and phyloP conservation for a free (Creld1-intron 5) and retained intron (Sept3 - 3’ terminal intron). RPM = reads per million mapped.
Figure 4—figure supplement 1
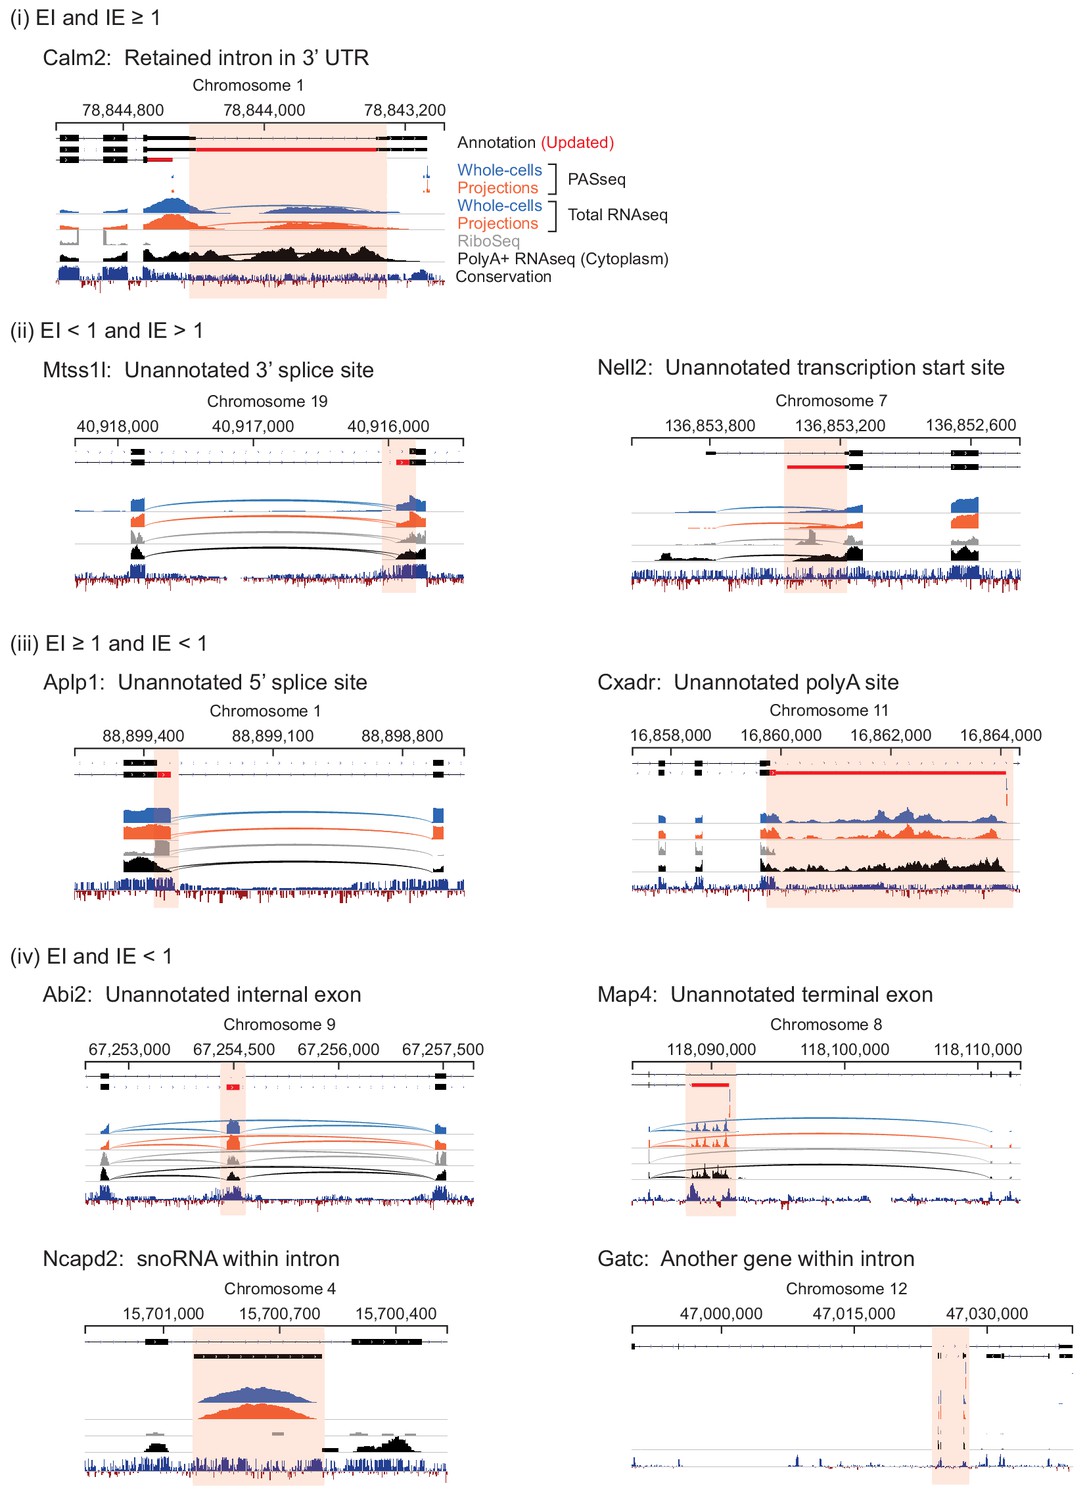
Genome browser views of introns labeled in Figure 4.
Figure 4—figure supplement 2

Comparison of intron enrichment versus mRNA enrichment in projections.
Figure 4—figure supplement 3
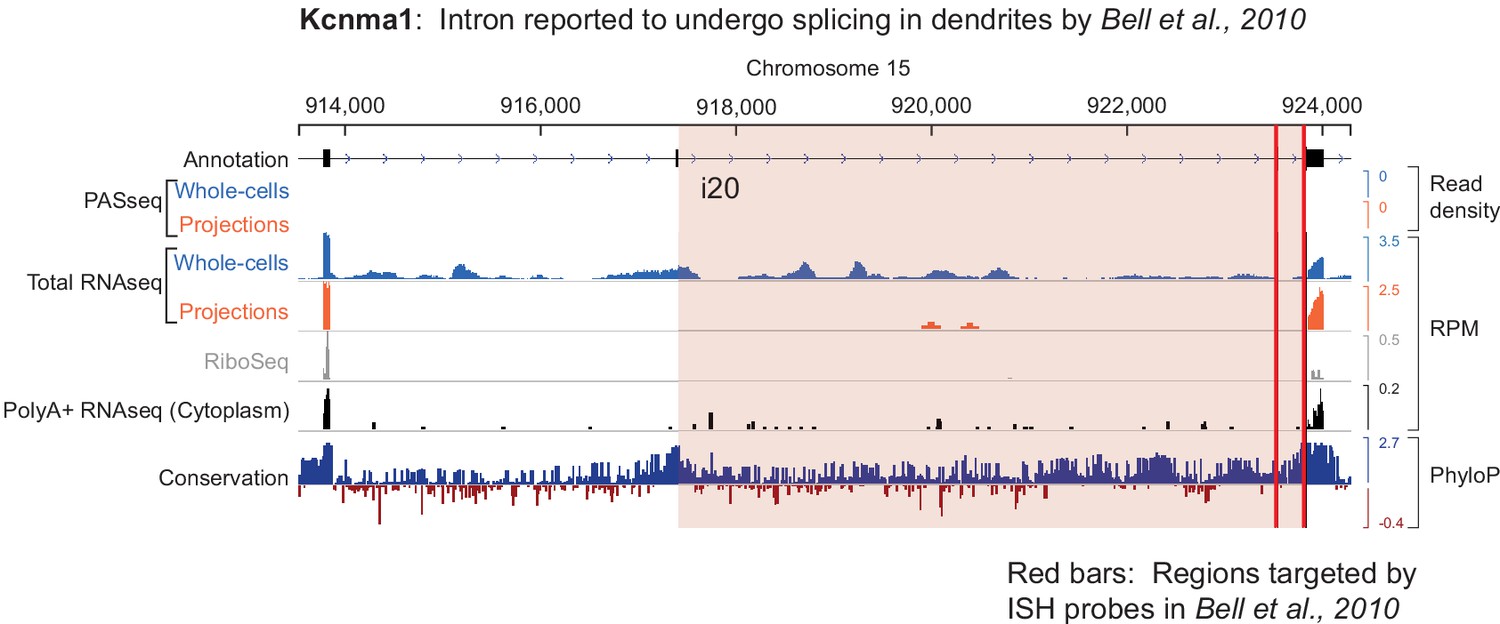
Genome browser view of Kcnma1 shows only the spliced isoform in projections.
The intron reported to undergo splicing in dendrites is highlighted in pink, and red bars indicate the genomic locus targeted by ISH probes in the study by Bell et al. (2010).
Figure 4—figure supplement 4
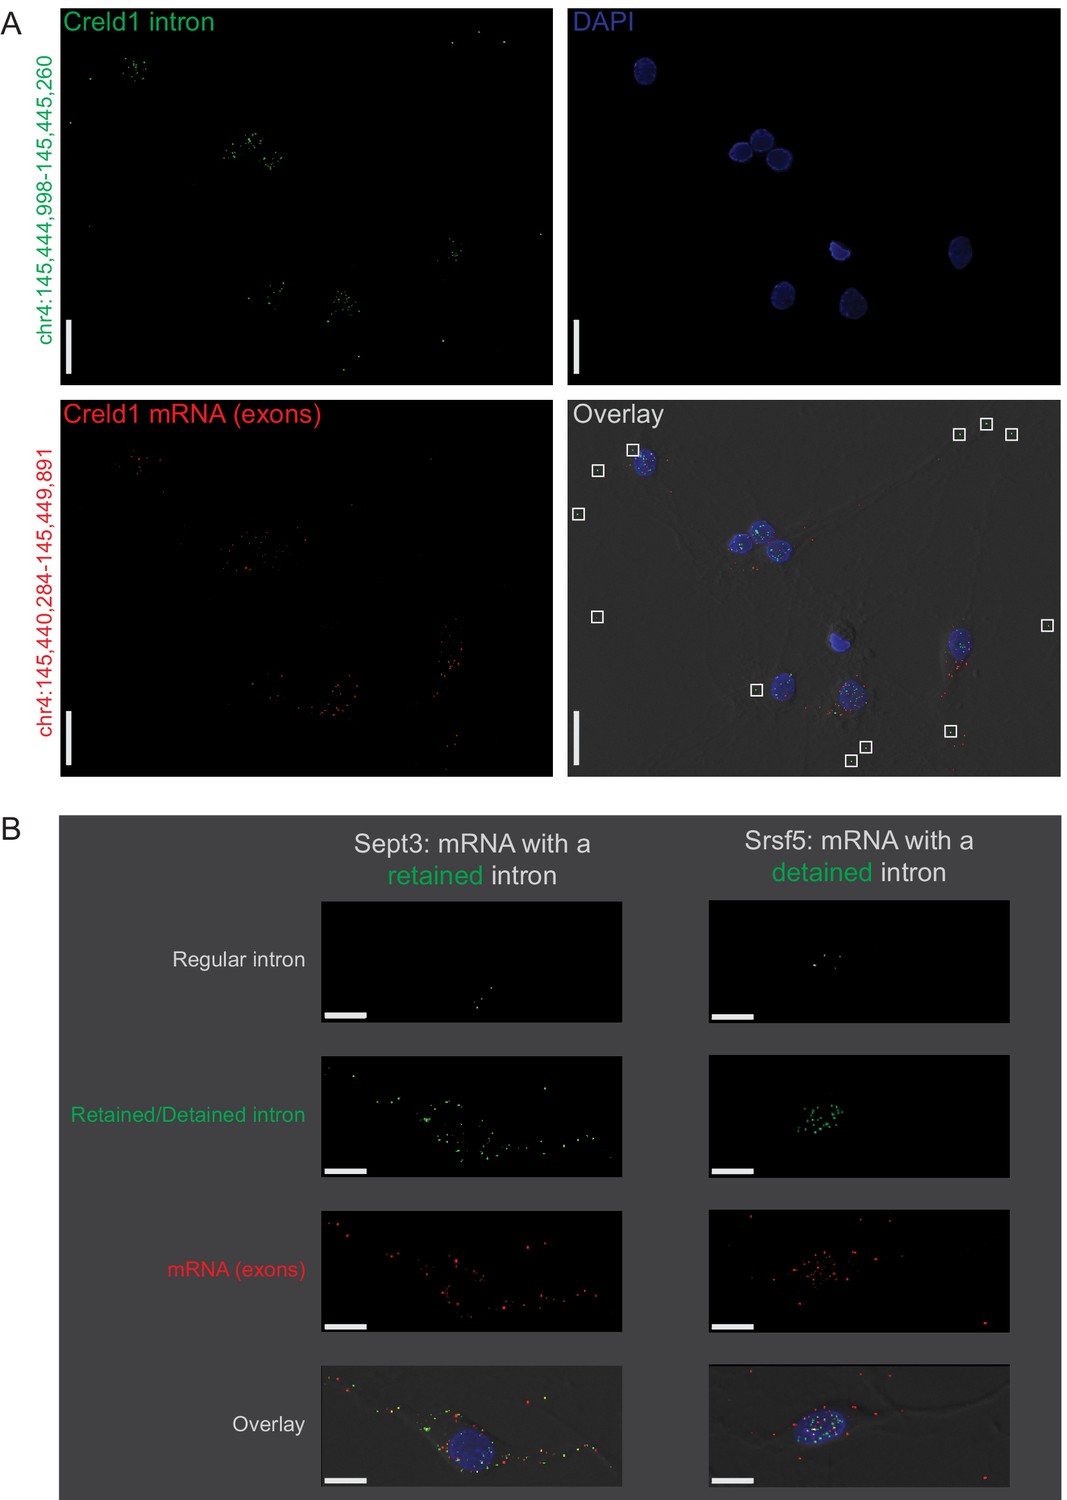
Subcellular location of constitutively spliced, retained, detained, and free introns validated by smFISH.
(A) Creld1 free intron (green) is detectable in distal neuronal projections and does not appear to colocalize with Creld1 exons (red). The chromosomal coordinates of the intron and exon regions targeted by smFISH probes are shown along the left margin of the images. Scale bars = 20µ m. (B) Retained intron (green; left) of Sept3 is detectable in neuronal projections whereas detained intron (green; right) of Srsf5 is predominantly detectable in the nucleus. Constitutively spliced introns (regular intron; white) of both genes are detectable only in the nucleus whereas exons (red) can be observed in the cytoplasm/projections. Scale bars = 10µ m. Chromosomal coordinates and sequences of regions targeted by smFISH probes are provided in Figure 2—source data 2.
Figure 5 with 1 supplement
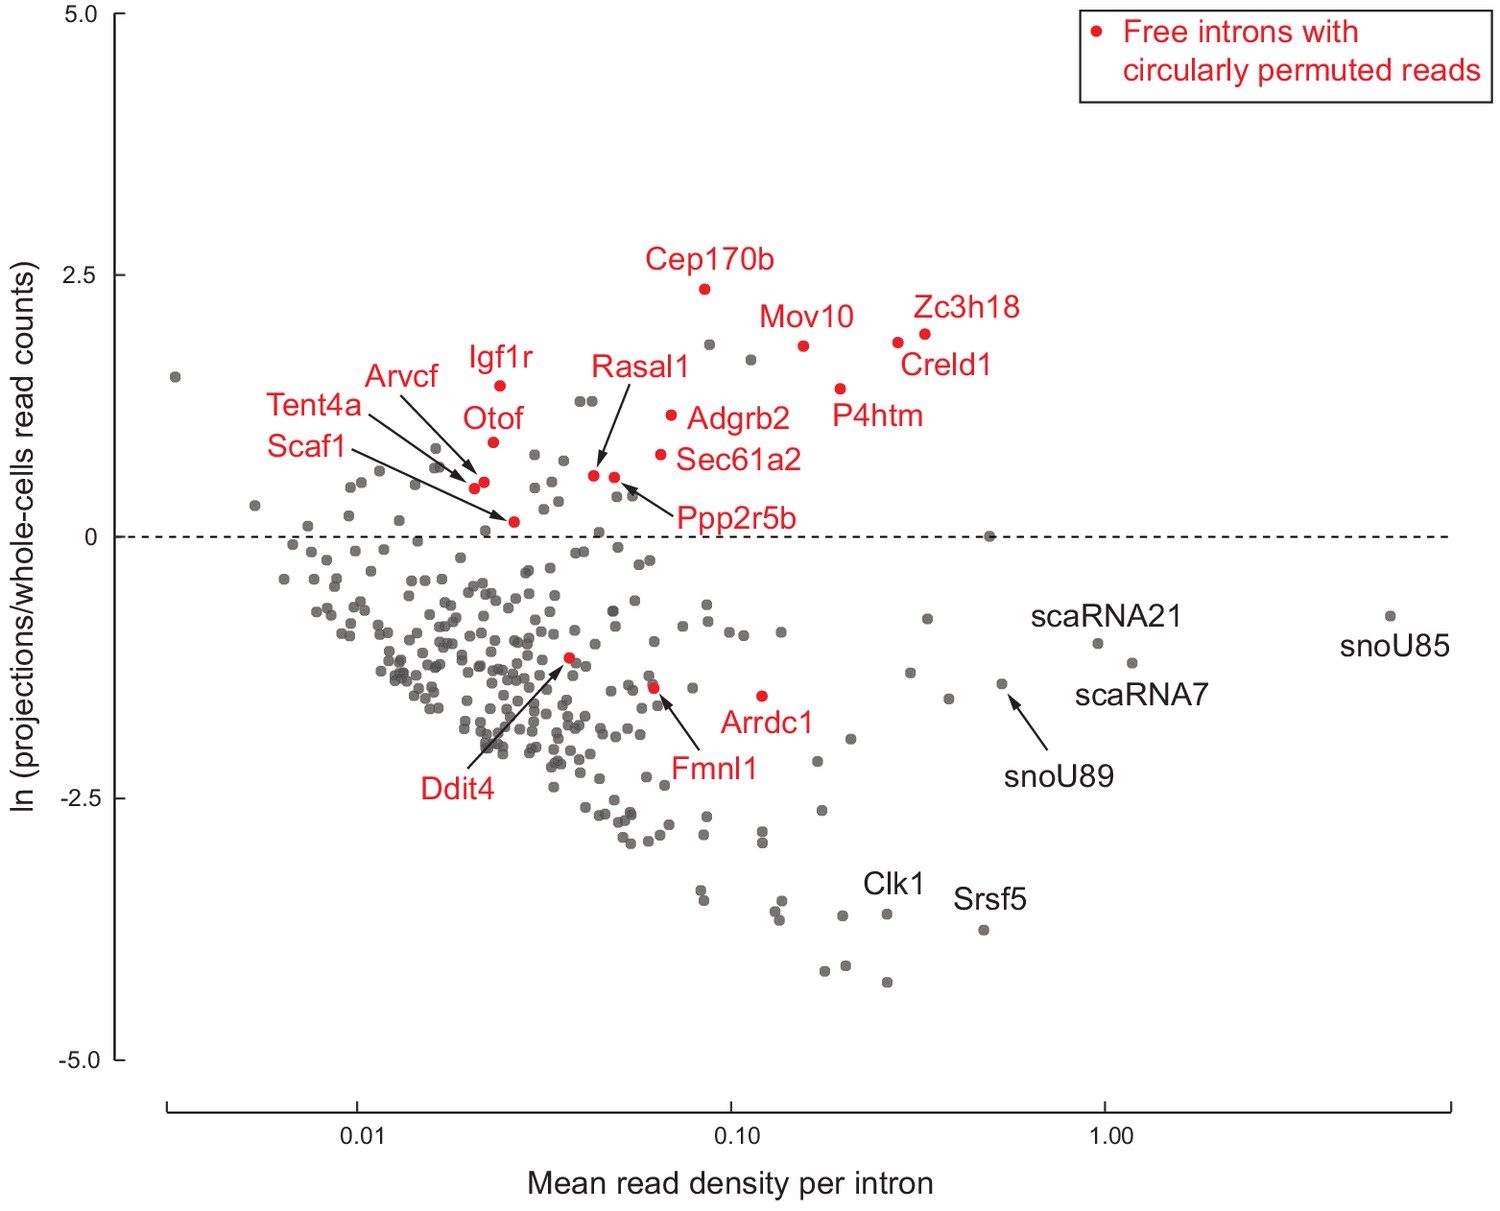
278 free introns detected in projections.
Scatter plot of log ratio of mean read density per intron region in projections versus whole cells, and read density averaged across all replicates of projections and whole cells. Examples of previously known detained introns and intronic snoRNAs/scaRNAs are labeled in black. Introns with circularly permuted reads and without known functional annotation are labeled in red.
Figure 5—figure supplement 1
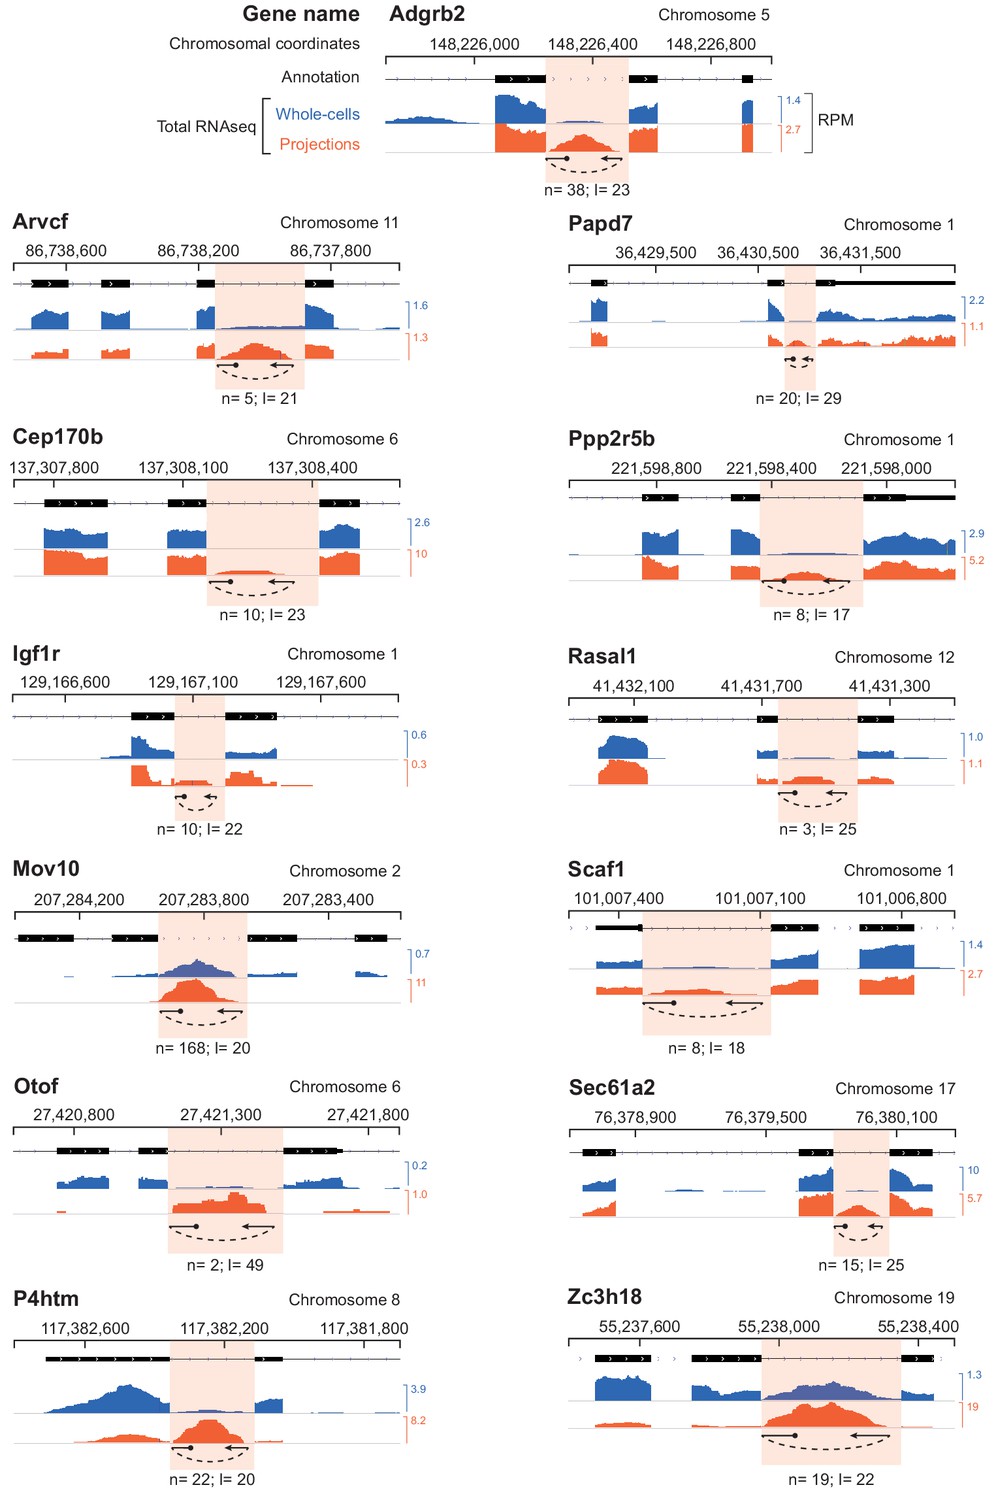
Genome browser plots of projection-localized free introns with circularly permuted reads.
Genome browser plots of projection-localized free introns with circularly permuted reads are shown. The total number of circularly permuted reads, ‘n’, in projection libraries as well as the distance of the branchpoint from the 3’ splice site, ‘l’ are shown below each intron. RPM = Reads per million mapped. More details about circularly permuted read alignments are provided in Figure 6—source data 1.
Figure 6
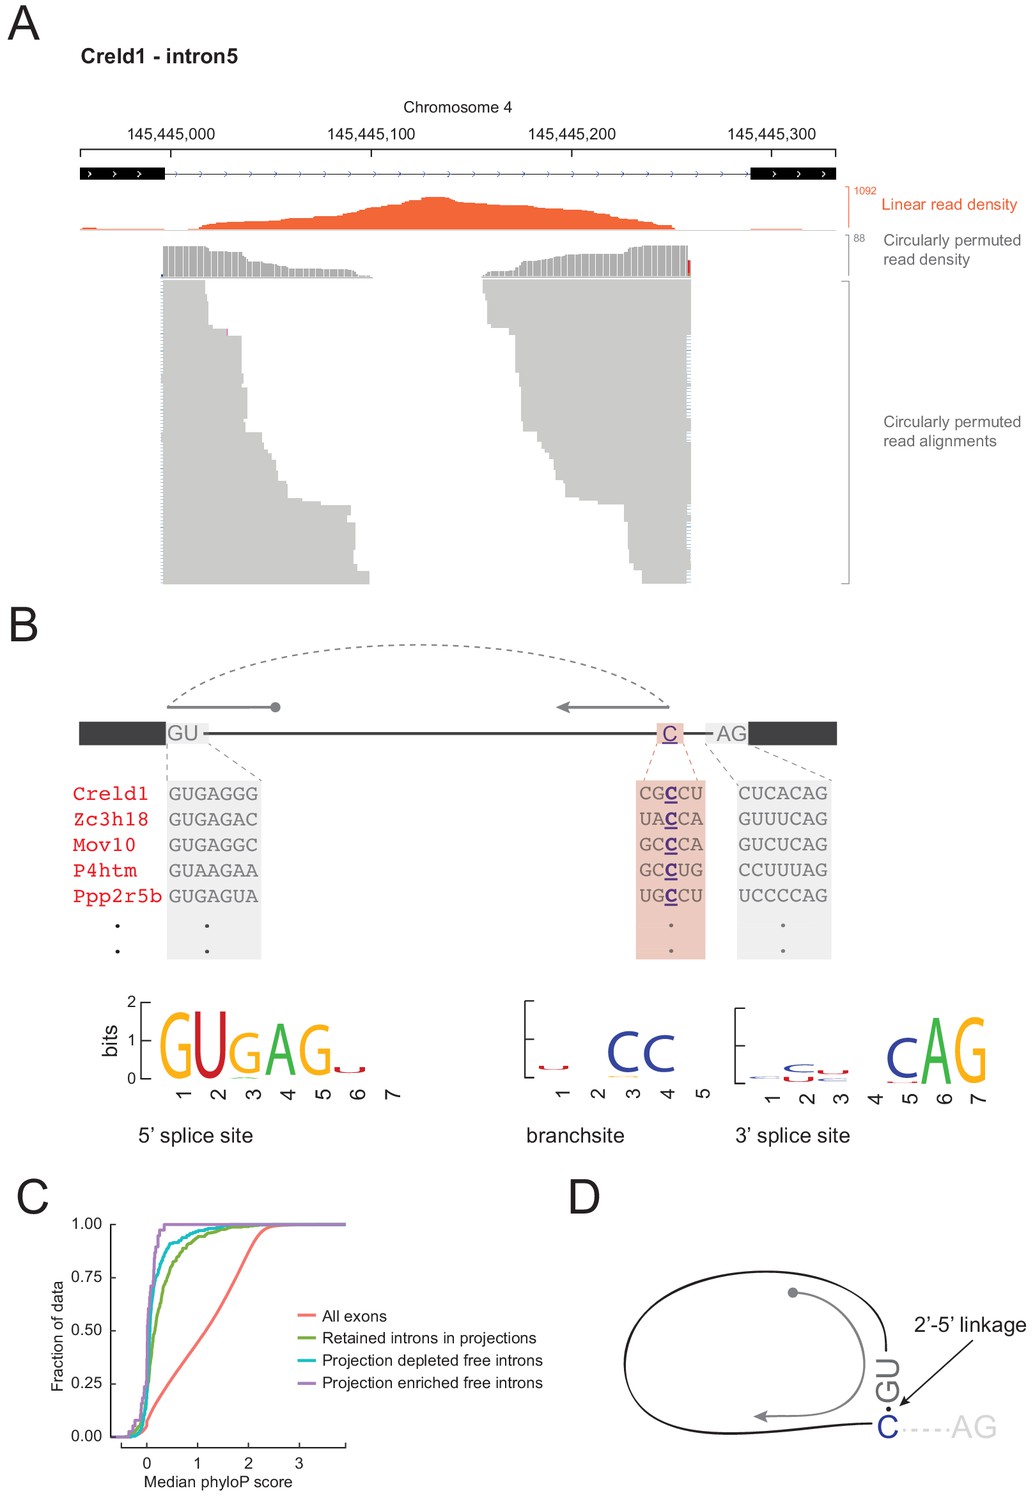
Free circular introns with a noncanonical branchpoint.
(A) Projection RNAseq read density for linearly mapped (orange) and circularly permuted (gray) reads across Creld1 - intron5. Alignment mismatches at the junction of circularly permuted reads are colored. Individual circularly permuted read alignments are shown as horizontal gray bars, with each bar representing one read. (B) Schematic of circularly permuted read alignment and sequence composition at 5’ splice sites, branch sites (the branchpoint nucleotide is underlined), and 3’ splice sites of five example introns. (C) Cumulative distribution function plots for phyloP sequence conservation showing lack of conservation in projection-enriched free introns relative to exons, or even to retained introns. x-axis represents median phyloP score over a 50 nt sliding window with 10 nt step size. (D) Inferred molecular structure of projection-localized free circular introns.
-
Figure 6—source data 1
Characteristics of circularly permuted read alignments on free introns.
- https://cdn.elifesciences.org/articles/47809/elife-47809-fig6-data1-v2.xlsx
Additional files
-
Source code 1
A tarball of supplementary tables and code.
- https://cdn.elifesciences.org/articles/47809/elife-47809-code1-v2.gz
-
Transparent reporting form
- https://cdn.elifesciences.org/articles/47809/elife-47809-transrepform-v2.pdf
Download links
A two-part list of links to download the article, or parts of the article, in various formats.
Downloads (link to download the article as PDF)
Open citations (links to open the citations from this article in various online reference manager services)
Cite this article (links to download the citations from this article in formats compatible with various reference manager tools)
Free circular introns with an unusual branchpoint in neuronal projections
eLife 8:e47809.
https://doi.org/10.7554/eLife.47809


