Persistent epigenetic memory impedes rescue of the telomeric phenotype in human ICF iPSCs following DNMT3B correction
- Rappaport Faculty of Medicine, Technion, Israel
- Rambam Health Care Campus, Israel
- Institute of Genetics and Biophysics, ABT CNR, Italy
Figures
Figure 1 with 4 supplements
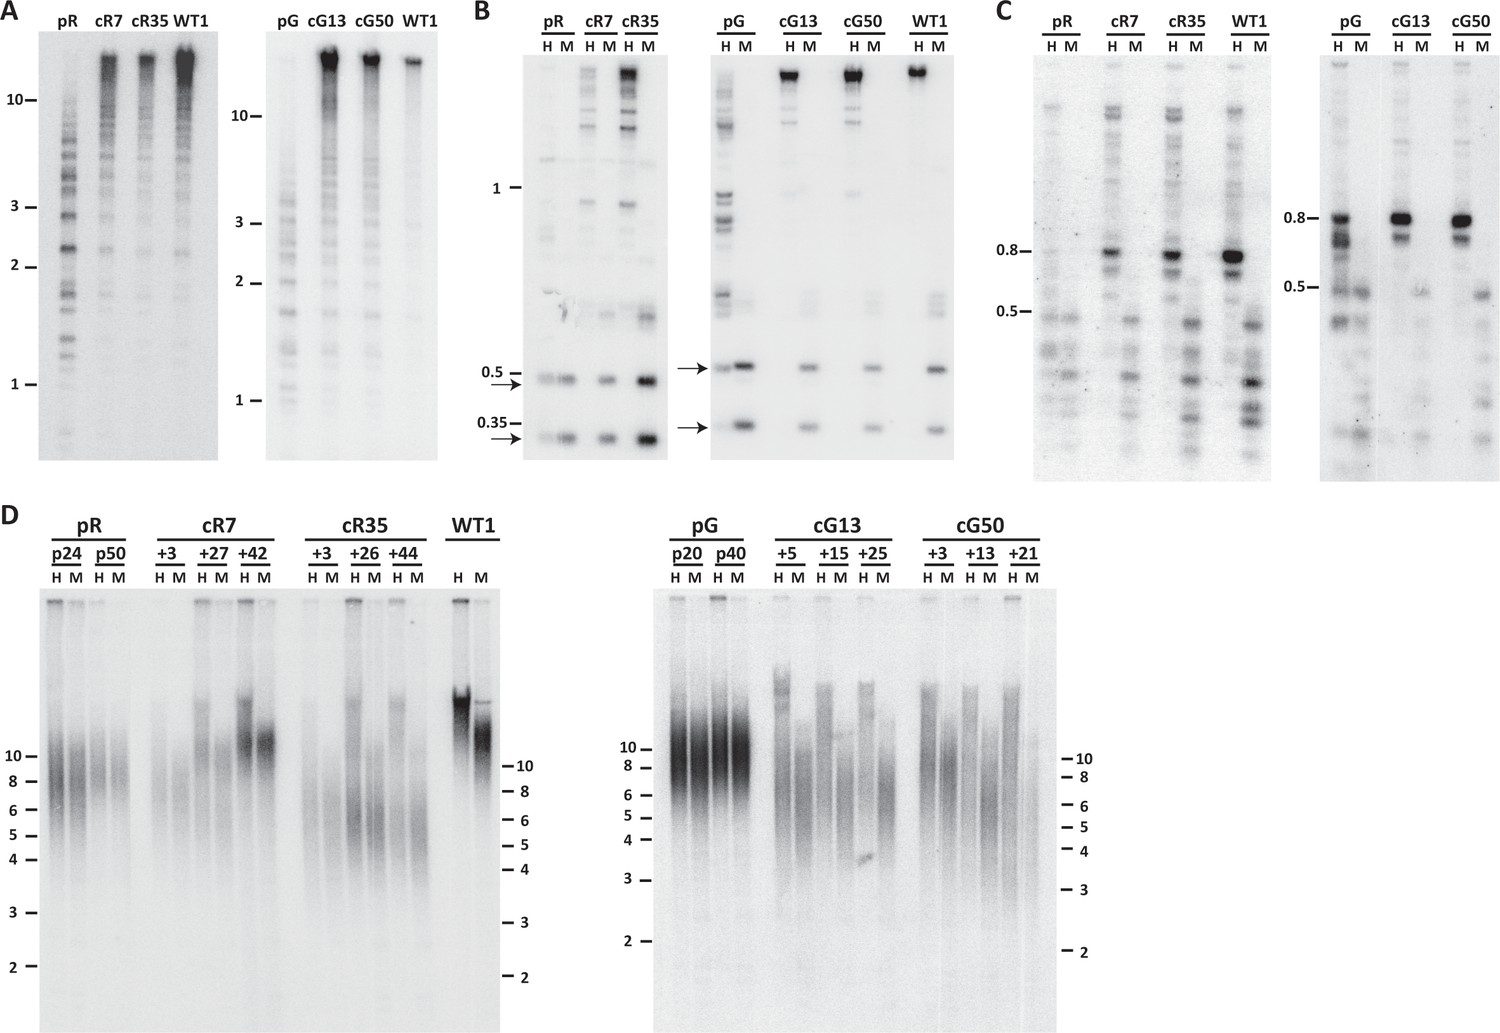
Pericentromeric regions are methylated de novo following DNMT3B correction, while subtelomeres are only partially methylated in corrected-ICF iPSCs.
Following correction of at least one allele of DNMT3B in ICF iPSCs pR and pG (see Figure 1—figure supplement 1), the activity of the restored DNMT3B was determined, as shown in (A–D). (A) DNA methylation of pericentromeric satellite 2 repeats determined by Southern analysis. DNA from ICF iPSCs (pR and pG), their corrected clones (cR7, cR35 and cG13, cG50, respectively) and WT iPSCs UN1-22 (WT1) was digested with the methylation-sensitive restriction enzyme BstBI and hybridized to a satellite 2 probe. Size markers in kilobases (kb) appear on the left. Additional analysis of satellite 2 repeats was done by targeted bisulfite analysis (Figure 1—figure supplement 3B). (B) Methylation analysis of pericentromeric NBL-1 repeat. DNA extracted at similar passages as in (A) was digested with either MspI (M) or HpaII (H). The presence of the two lower molecular bands in the HpaII-digested DNA (arrows) indicates hypomethylation of this repeat. Additional analysis of NBL1 repeats, as well as other pericentromeric repeats was carried out by WGBS analysis (Figure 1—figure supplement 3A, Figure 1—figure supplement 4). (C) Methylation analysis of pericentromeric p1A12 repeat. DNA extracted at similar passages as in (A) was digested with either MspI (M) or HpaII (H). Hybridization bands below 0.5 kb in the HpaII-digested DNA indicate that this repeat is hypomethylated. Additional analysis of p1A12 repeats, as well as other pericentromeric repeats was carried out by WGBS analysis (Figure 1—figure supplement 3A, Figure 1—figure supplement 4). (D) Methylation analysis of subtelomeric regions. DNA of ICF iPSCs pR and pG, their corrected clones cR7, cR35 and cG13, cG50, respectively, and WT iPSCs UN1-22 (WT1) was digested with the isoschizomeric MspI (M) and HpaII (H) enzymes at three time points following corrected colony isolation. The passage at which DNA was extracted for analysis appears above the lanes. The plus (+) indicates the number of passages since the corrected clones were isolated. Southern analysis was performed using a C-rich telomeric probe, as described (Yehezkel et al., 2008). Size markers in kb appear both on the left and on the right to depict the degree of separation at each side.
Figure 1—figure supplement 1
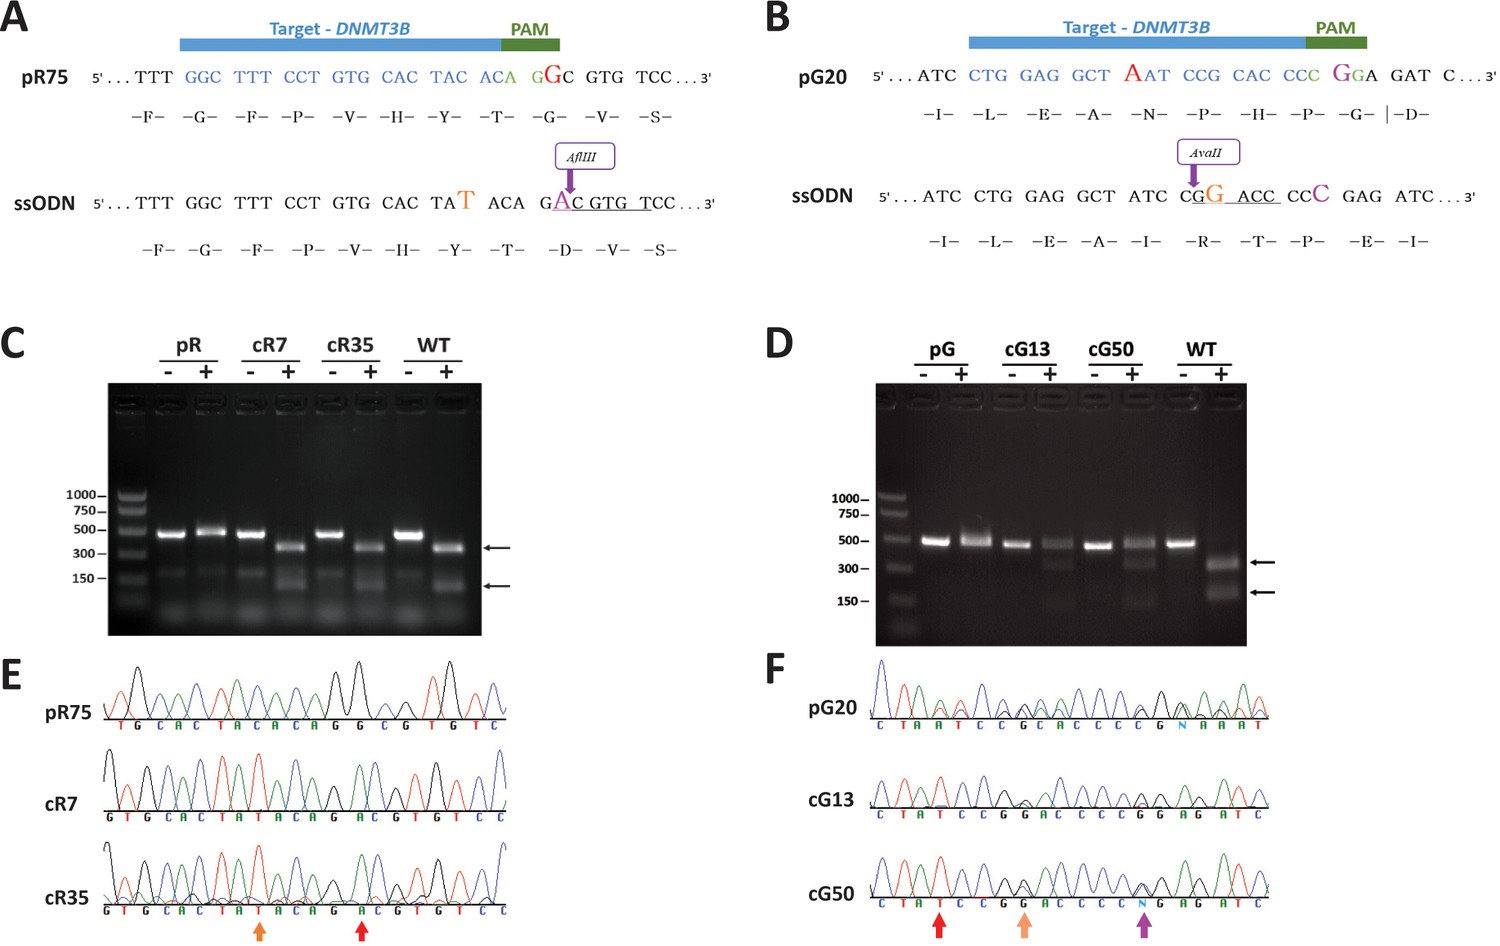
CRISPR/Cas9–mediated DNMT3B correction in ICF iPS cells.
The ICF iPSCs corrected by HDR included pR, carrying a homozygous missense mutation in exon 23 that leads to an amino acid substitution in the catalytic domain of DNMT3B, and pG, carrying a missense mutation in exon 22 that also affects the catalytic domain, as well as a one base-pair (bp) insertion in exon three leading to a frameshift and a premature stop codon 41 amino acids downstream (Xu et al., 1999; Yehezkel et al., 2013). (A) The sequence of iPSC clone pR75 in vicinity of the homozygous missense mutation in DNMT3B (red G, exchanging the WT A). The 20-nucleotide guide sequence in blue and the PAM sequence in green appear above. The PAM sequence contains the missense mutation. A single stranded oligonucleotide (ssODN) containing a total of 90 base pairs (bp) of sequence homology flanking the target site (30 nucleotides upstream and 60 nucleotides downstream to the mutation), served as the HDR template. Correction of the mutation (magenta A) in the ssODN cancels the PAM recognition sequence and generated an AflIII restriction site (underlined), enabling colony screening by restriction fragment length polymorphism (RFLP). The ssODN also included a C > T transition (orange) resulting in a silent mutation, thus additionally preventing guide annealing following successful HDR. (B) Sequence of iPSC clone pG20 in vicinity of the insertion mutation (red A) leading to frameshift and a premature stop codon 41 amino acids downstream. The 20-nucleotide guide sequence (in blue) includes the insertion and therefore is allele specific. The HDR template incorporated three sequence changes compared to the original pG20 sequence: a. The elimination of the insertion mutation, b. A G > C transition (magenta) that results in a silent mutation that cancels the PAM motif, c. A C > G transition (orange) that results in a silent mutation that generates an AvaII restriction site (underlined), thus enabling colony screening by RFLP. (C) RFLP validation of corrected clones of pR iPSCs. Correction of the missense mutation in pR75 clones generated an AflIII restriction site. A region surrounding the missense mutation was amplified by PCR and analyzed by RFLP to detect corrected clones. Analysis of pR75 iPSC, clones pR7 and pR35 and WT iPSCs, demonstrates the homozygous correction of the missense mutation in cR7 and cR35. (-) PCR product without digestion, (+) PCR followed by digestion with AflIII. Arrows point to the two digestion products. (D) RFLP validation of corrected clones of pG iPSCs. HDR in pG20 clones generated a heterozygous AvaII restriction site. A genomic region surrounding the insertion mutation was amplified from pG20 iPSCs, and clones pG13 and pG50, and the PCR product was digested with AvaII. (-) PCR product without digestion, (+) PCR followed by digestion with AvaII. Arrows point to the two digestion products. Because only one allele was corrected following HDR, the non-digested PCR product is present in addition to the two digestion products of the corrected allele in cG13 and cG50. A positive control for AvaII digestion was generated by amplifying from WT DNA a genomic region in intron 1 of the DNMT3B gene which contains an AvaII restriction site and digesting with AvaII under similar conditions. (E) Sanger sequence validation of HDR in pR clones cR7 and cR35. Sequence of the original pR75 iPSC compared to the two corrected clones indicates the homozygous G > A correction (red arrow) and the insertion of the silent C > T mutation (Orange arrow). (F) Sanger sequence validation of HDR in pG clones cG13 and cG50. Sequence of the original pG20 iPSC compared to the two corrected clones indicates the removal of the insertion that caused frameshift (red arrow), and heterozygous insertion of two silent mutations (orange and purple arrows).
Figure 1—figure supplement 2
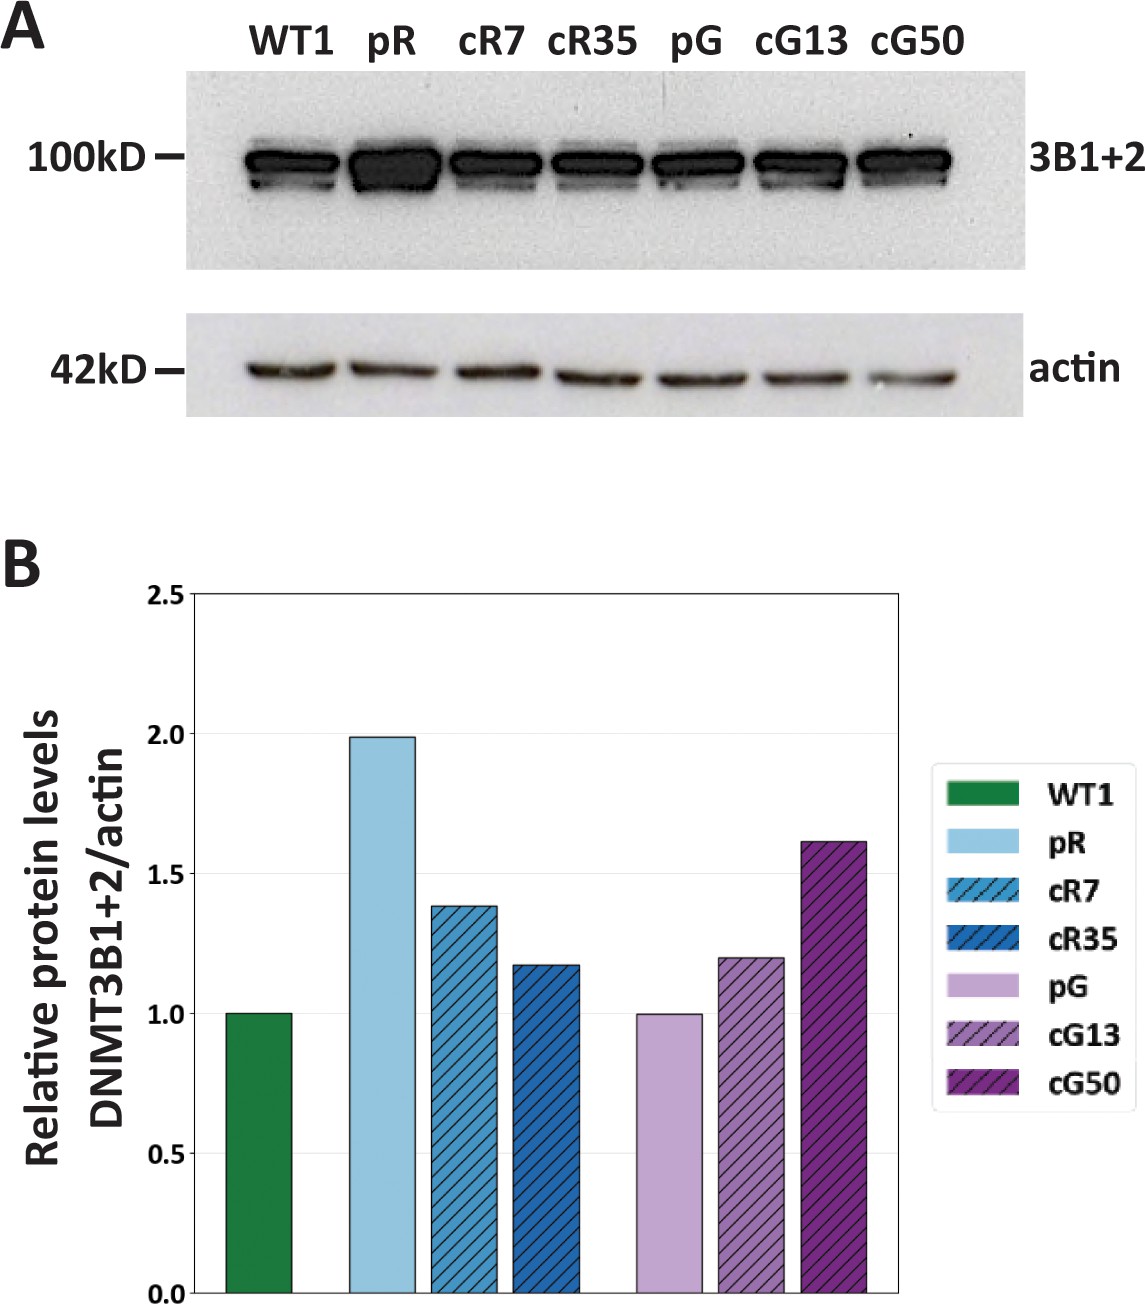
Expression of catalytically active isoforms DNMT3B1 and DNMT3B2 in WT and isogenic ICF iPSCs.
(A) Western analysis of DNMT3B expression was carried out on WT1 iPSCs and on the ICF patient iPSCs pR and pG, and their corrected clones. Samples were normalized based on total actin protein levels. The catalytically active isoforms of DNMT3B: DNMT3B1 and DNMT3B2 (3B1+2) are marked on the blot. (B) A histogram showing DNMT3B1+2 protein levels relative to those of WT1 iPSCs.
Figure 1—figure supplement 3
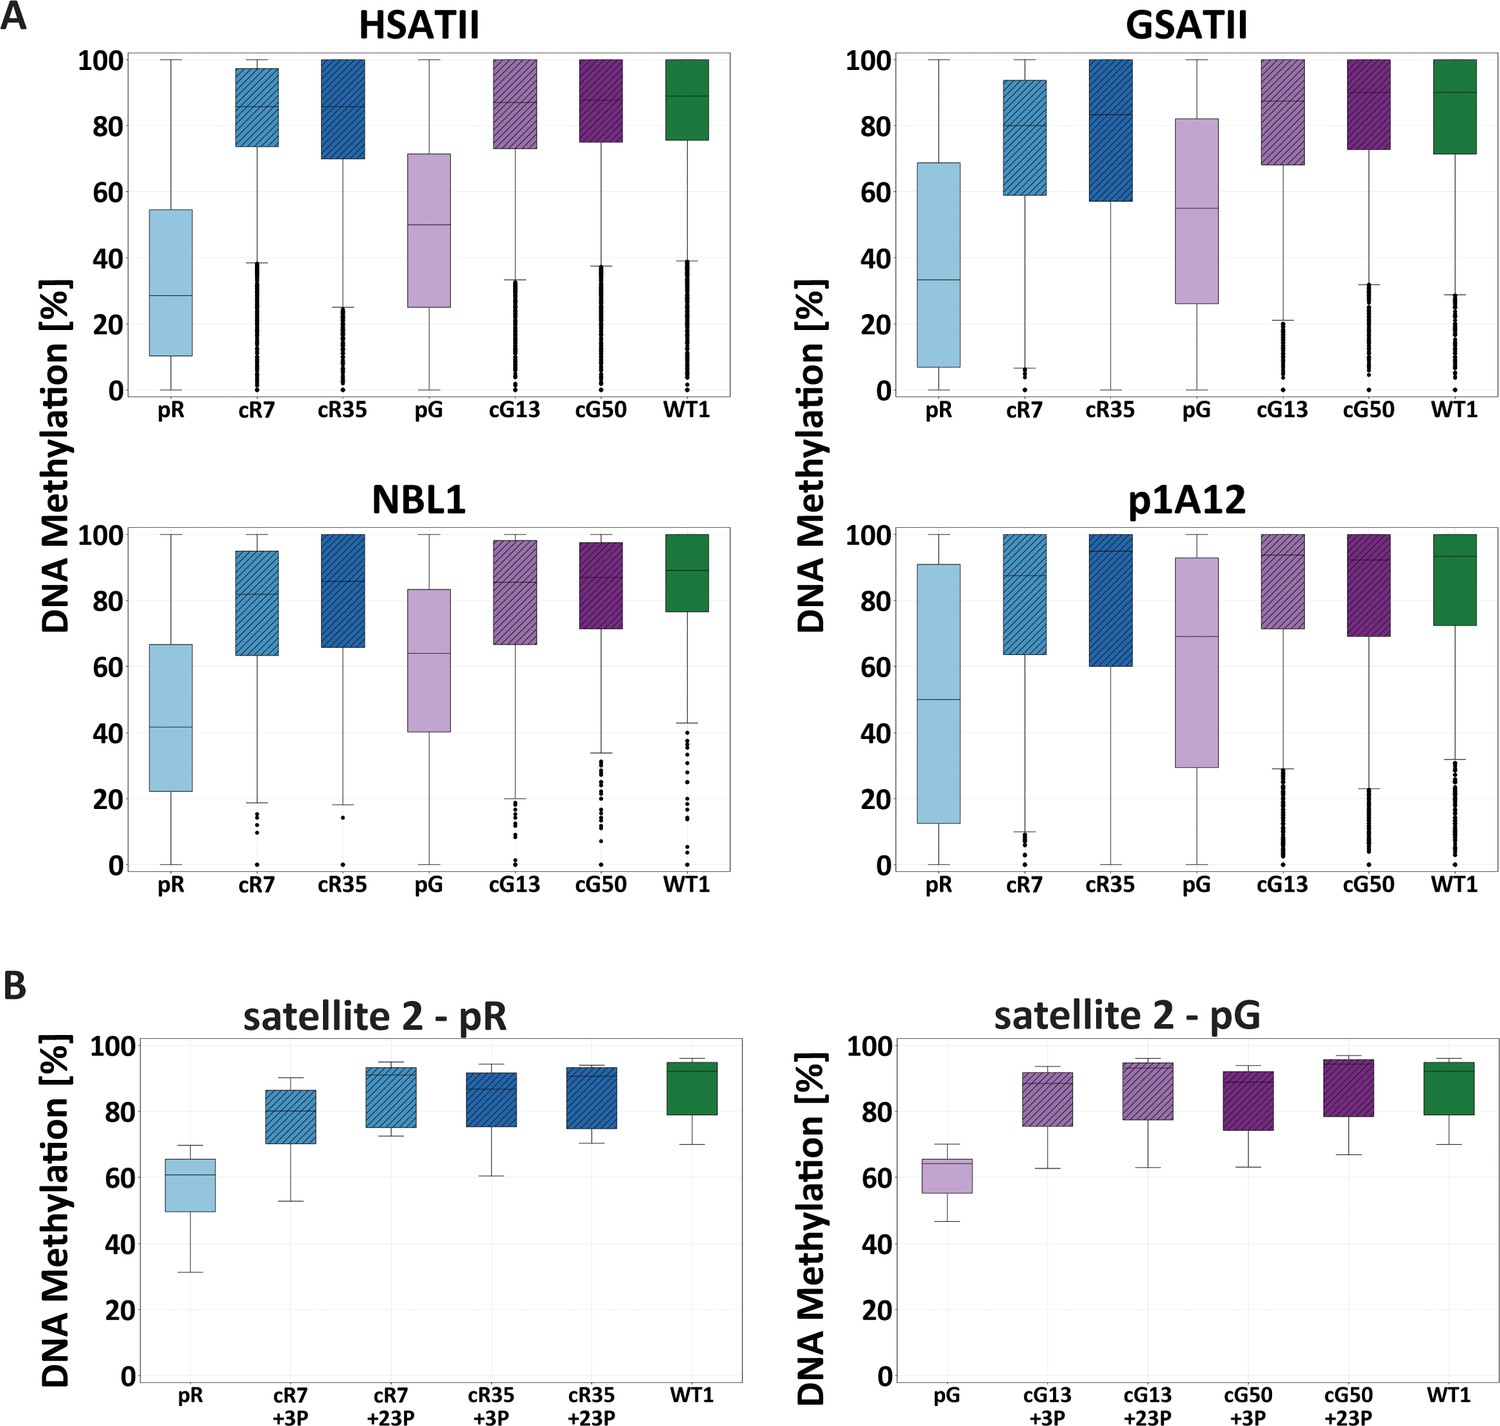
Restored DNA methylation at pericentromeric repeats.
(A) Boxplots showing the DNA methylation level (%) of the pericentromeric repeats, HSATII, GSATII, NBL1 and p1A12, examined by WGBS of the WT1 iPSCs, the ICF iPSCs, pR and pG, and the corrected clones, cR7, cR35, cG13 and cG50. Comparison of methylation data between sample pairs was done by calculating the Cohen’s d effect size (Figure 1—figure supplement 4). (B) Boxplot showing the DNA methylation level (%) of chromosome 1-specific satellite 2 repeats at two time points following correction (3 and 23 passages; +3P and +23P, respectively). Bisulfite-converted DNA samples of ICF iPSCs pR and pG, corrected clones (cR7, cR35, cG13 and cG50) and WT1 iPSCs were subjected to amplification with primers directed to the satellite 2 repeat and sequenced by Ion Torrent Personal Genome Machine (PGM). The methylation mean of the various samples was compared by an Anova test followed by a Tukey‘s HSD test (p-value<0.05). Significant differences were found between the two ICF iPSCs and all other iPSCs (corrected clones at both time points and WT samples). Primer sets for targeted bisulfite analysis appear in Supplementary file 1.
Figure 1—figure supplement 4
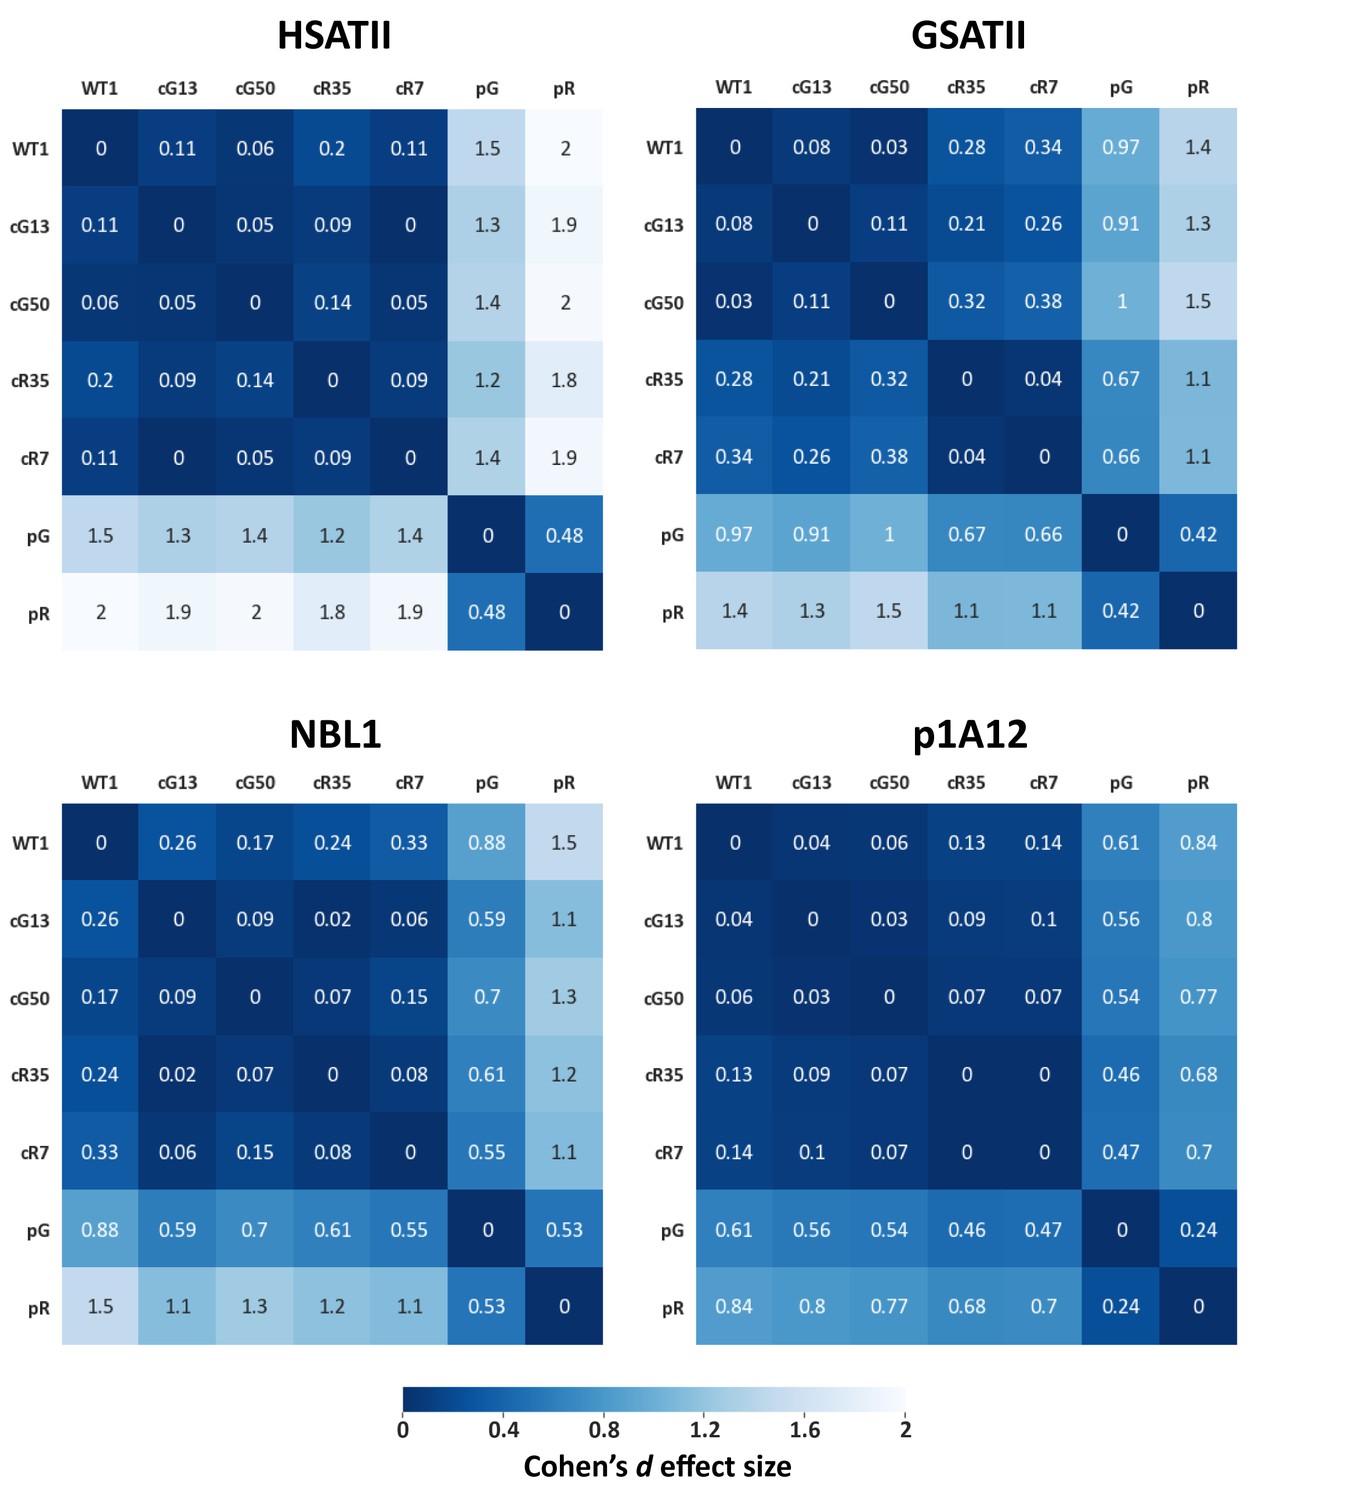
Effect size values measured for pericentromeric repeats.
Methylation means of pericentromeric repeats (described in Figure 1—figure supplement 3A) were compared between samples, and effect size values were calculated. Each matrix contains the distances between the samples based on the methylation means. The statistical test used to calculate the distances is Cohen’s d effect size (Sawilowsky, 2009). The magnitude of distance is classified as follows: Very small = 0.01, Small = 0.20, Medium = 0.50, Large = 0.80, Very large = 1.20, Huge = 2.0..
Figure 2
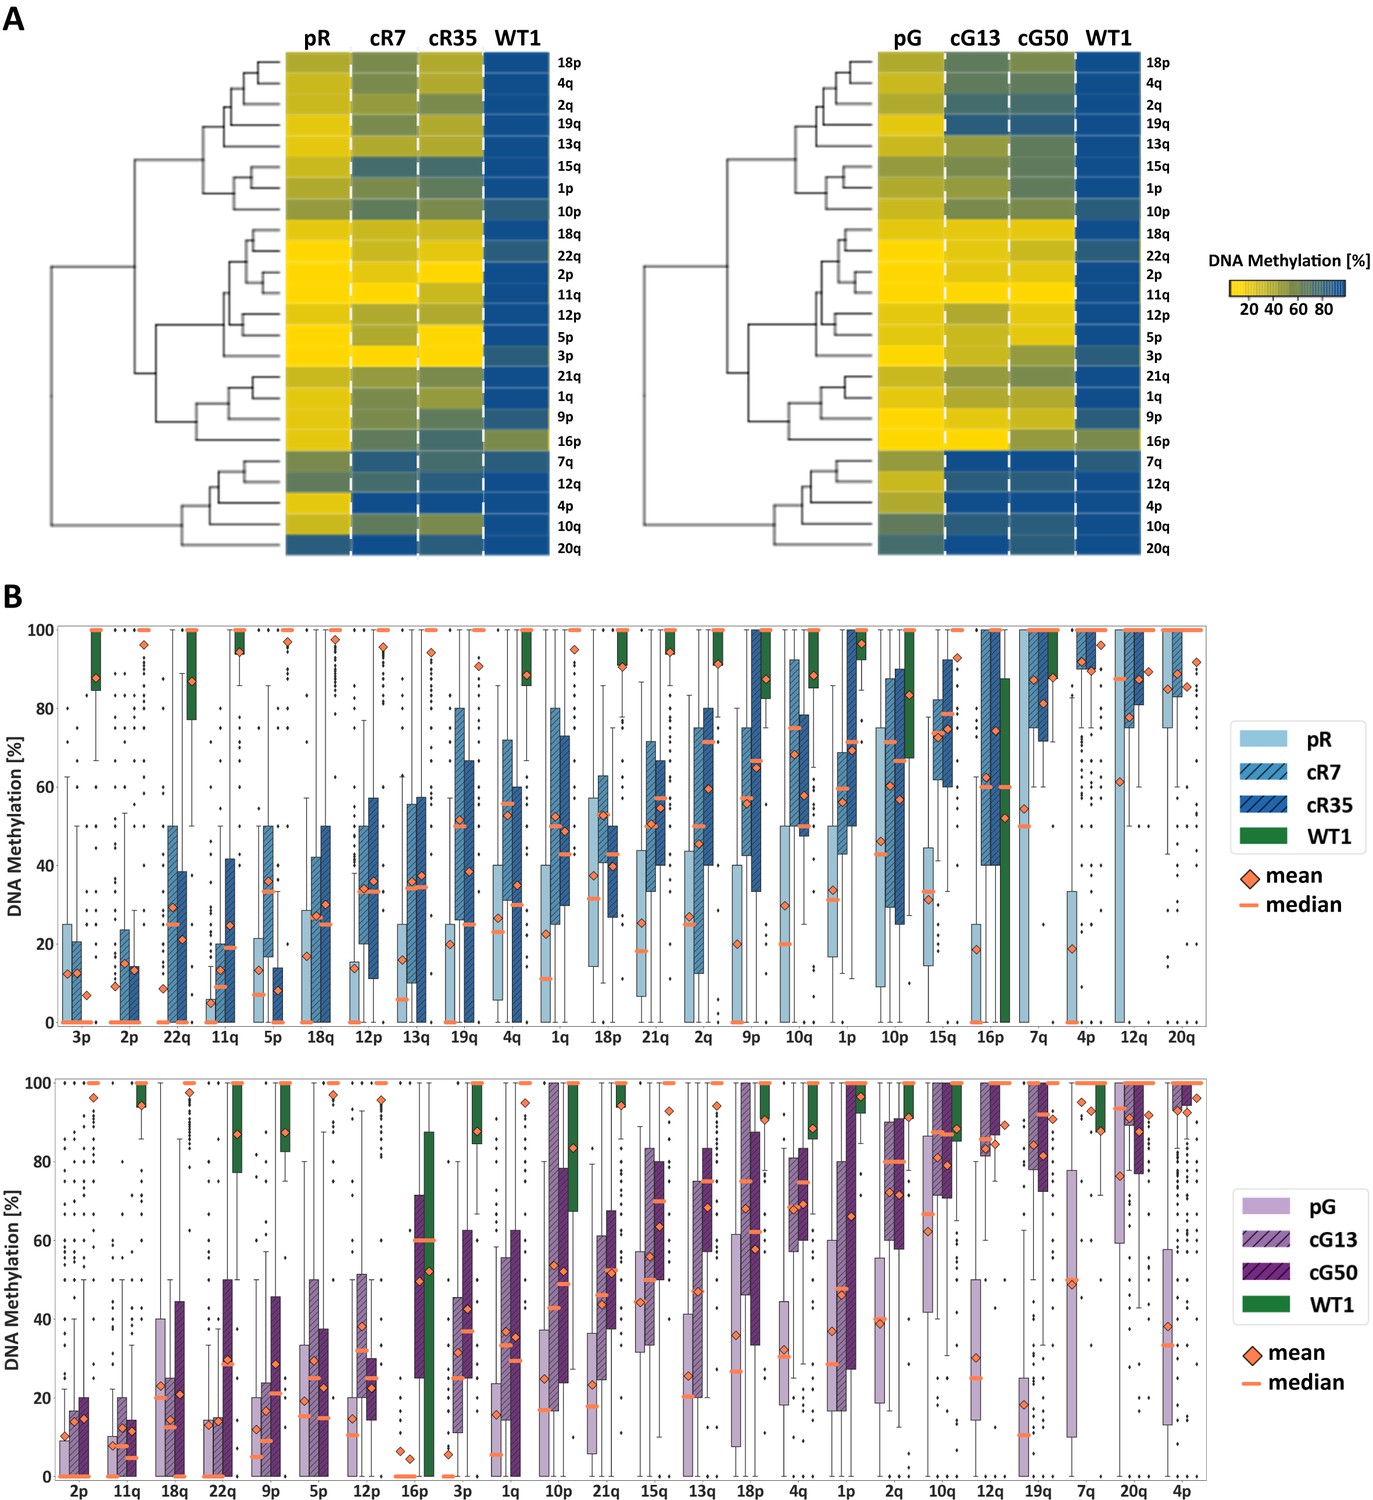
Subtelomeric methylation is differentially restored following DNMT3B correction.
(A) Subtelomeric methylation analysis by whole genome bisulfite sequencing (WGBS). DNA of ICF iPSCs pR and pG, their corrected clones cR7, cR35 and cG13, cG50 respectively, and WT iPSCs UN1-22 (WT1) was subjected to WGBS sequencing. DNA from corrected clones was analyzed 35 and 12 passages following correction of pR and pG iPSCs, respectively. The heatmaps display the mean methylation of all CpGs within the most distal 2 kb prior to the telomere tract of 24 subtelomeres. Hierarchical clustering of samples appears to the left of the heatmaps. (B) DNA methylation level distribution of the analyzed subtelomeres based on the degree of restored methylation following correction. Methylation level distribution is presented by boxplots for each of the 24 analyzed subtelomeres, with mean and median values indicated as orange diamonds and bars, respectively. Upper plot - pR and corrected clones, lower plot - pG and corrected clones. Subtelomeres are ranked from left to right based on averaging of the methylation level medians of both corrected clones.
Figure 3 with 3 supplements
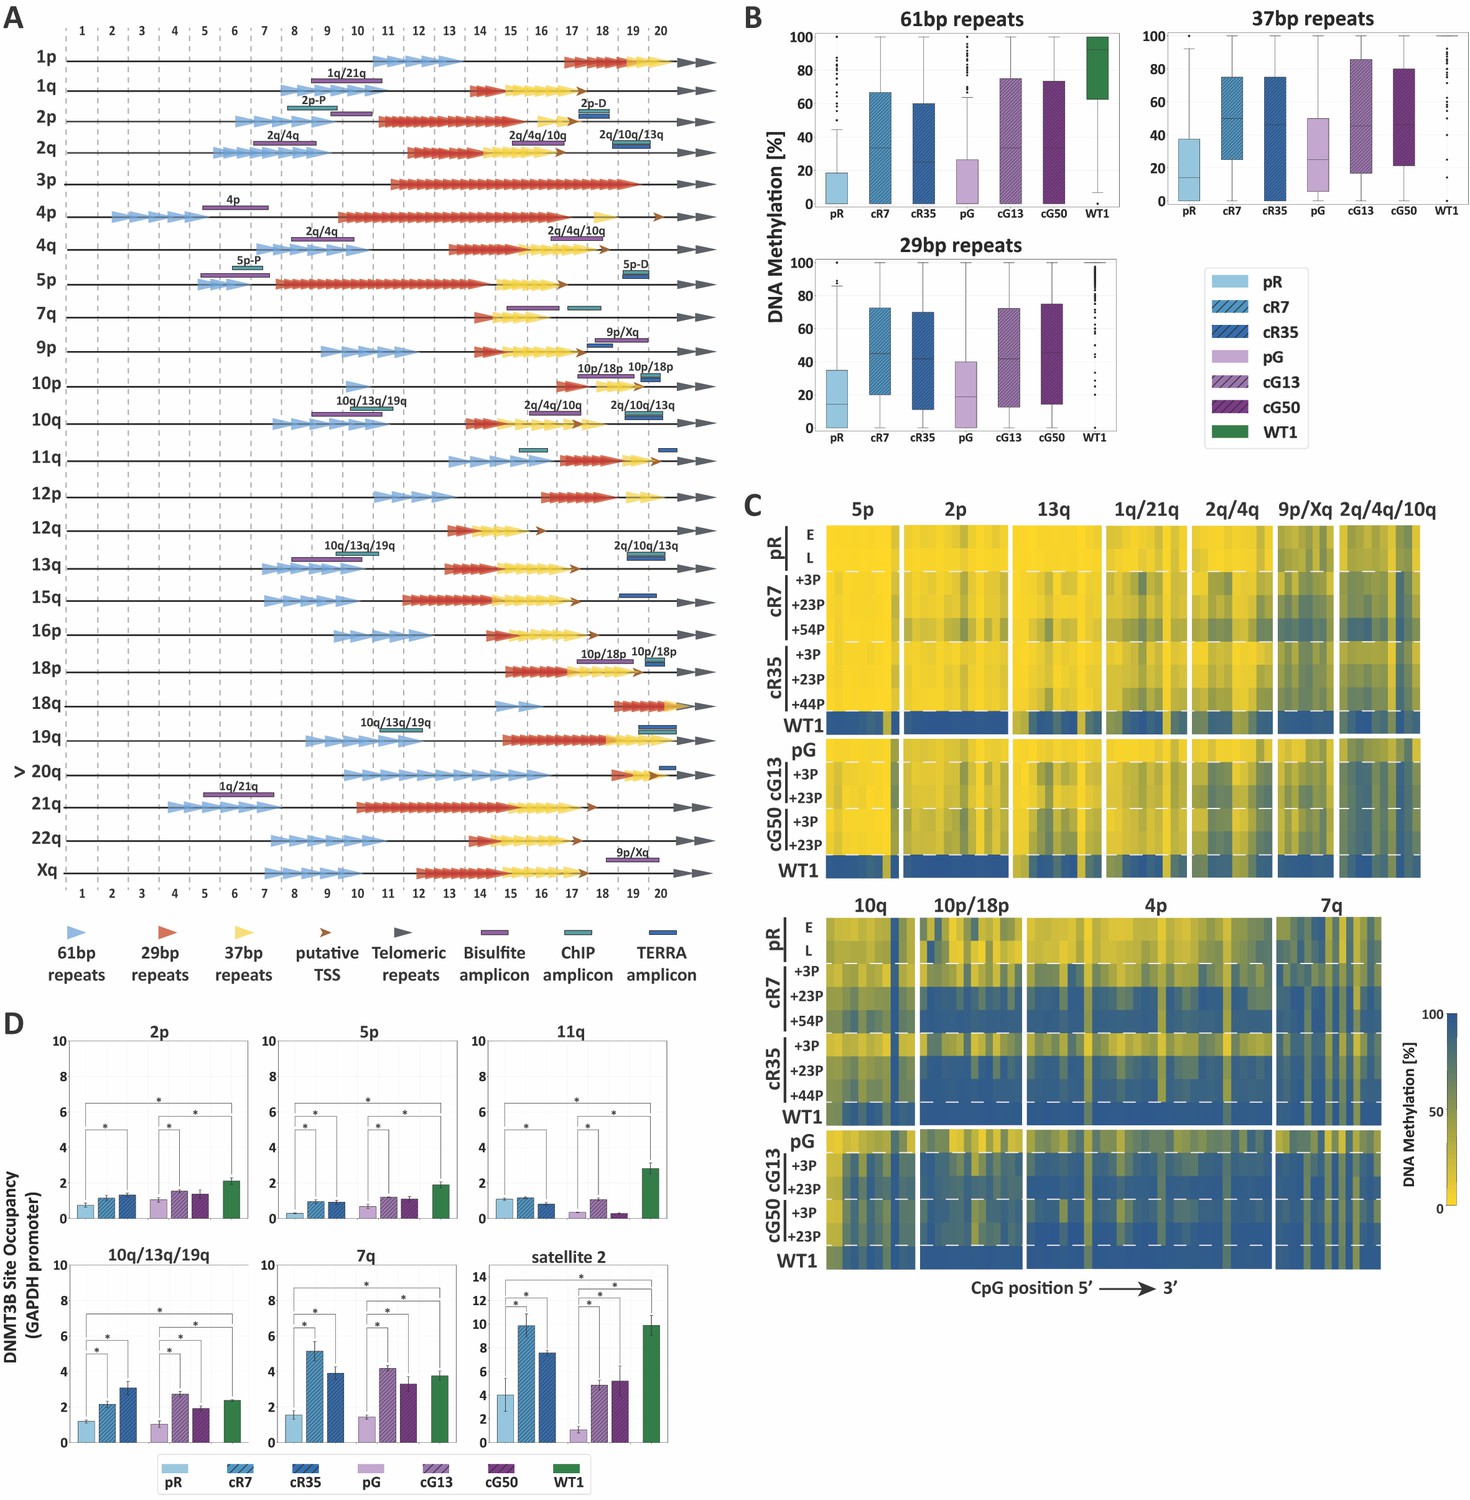
TERRA promoter repeats are variably resistant to de novo methylation following DNMT3B correction in correlation with DNMT3B enrichment.
(A) TERRA promoter components along human subtelomeres. The positions of the 61-, 29- and 37 bp repeats comprising TERRA promoters are depicted along the distal 2 kb of a subset of human telomeres. Putative transcription start sites (TSS) are based on Diman et al. (2016). The distal ends of the subtelomeres are depicted by the gray arrows on the right. The arrow to the left of telomere 20q indicates that this telomere lacks a clear telomeric tract at its distal end. The regions amplified in the various analyses, are indicated on the maps. The 2 kb regions are divided into100 bps bins, marked at both top and bottom of the maps. TERRA promoter elements on additional subtelomeres appear in Figure 3—figure supplement 1. (B) Distribution of DNA methylation levels at the TERRA promoter repeats. The boxplots demonstrate the DNA methylation levels as determined by WGBS of the 61-, 29- and 37 bp repeats from many subtelomeres collectively, in ICF iPSCs pR and pG, their corrected clones cR7, cR35 and cG13, cG50 respectively, and WT iPSCs (WT1) (See also Figure 3—figure supplements 1 and 2 and Supplementary file 2. (C) DNA methylation at specific TERRA promoter regions following DNMT3B correction. Targeted bisulfite analysis of specific TERRA promoter regions from 14 subtelomeres in ICF iPSC, their corrected clones at two or three time points following isolation, and WT UN1-22 iPSCs (WT1). The passage (P) at which DNA was extracted for analysis appears to the left of the heatmaps. The plus (+) indicates the number of passages since the corrected clones were isolated. The heatmaps display the methylation percentage across the various amplicons. Each subtelomeric region consists of several columns, each representing a specific CpG site, in the 5′ to 3′ direction of the sequence (left to right). (See also Figure 3—figure supplement 3 and Supplementary file 1. (D) DNMT3B binding at various subtelomeres prior and post correction. Corrected clones were analyzed at passages 35–45 following isolation. Subtelomeres 2p and 5p were analyzed with the upstream 2p-P and 5p-P primer sets (Figure 3A, and Supplementary file 3. Two-tailed Mann-Whitney U-tests were performed to determine statistical differences between WT and ICF samples and between the original ICF iPSCs and their corrected clones (*=p value<0.05). Bars and error bars represent means and SEM of at least three experimental repeats.
Figure 3—figure supplement 1
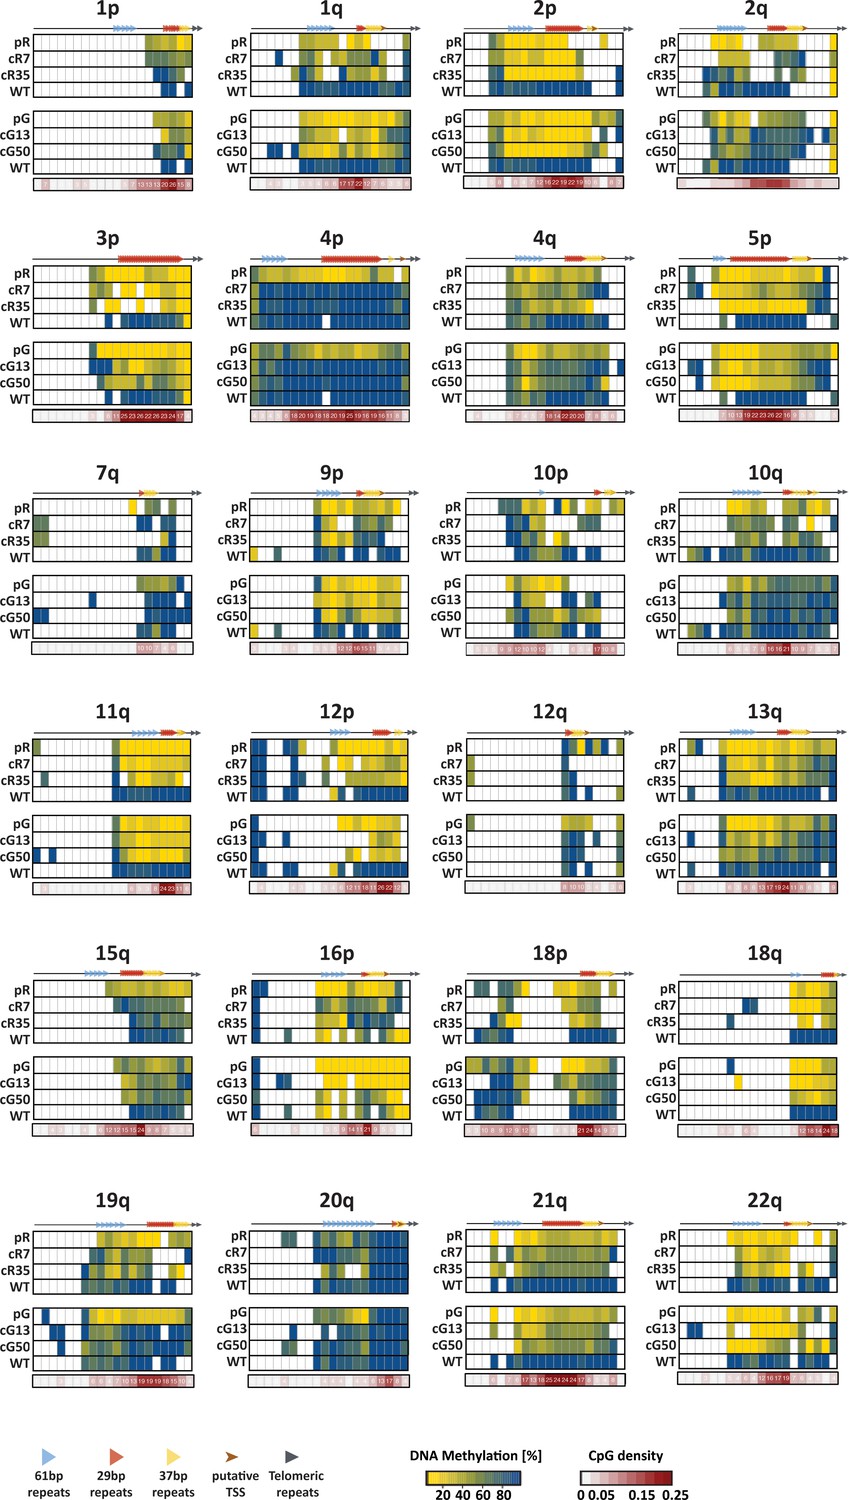
DNA methylation profile of the 2 kb distal regions of several subtelomeres.
The DNA methylation profile of the 2 kb distal end prior to the telomere tract of 24 human subtelomeres, was obtained by WGBS of the WT1 iPSCs, the ICF iPSCs, pR and pG, and the corrected clones, cR7, cR35, cG13 and cG50. The analyzed regions were divided into 100 bp bins and the CpG methylation mean in each bin was calculated. The positions of the 61-, 29- and 37 bp repeats within the putative TERRA promoters are depicted on the top of each methylation heatmap. The number of CpG dinucleotides included in each bin, along with a color code, appear in the CpG density maps below each methylation heatmap. White bins within the methylation heatmaps correspond to non-informative regions either due to low sequencing coverage, or due to lack or paucity of CpG dinucleotides within the bin.
Figure 3—figure supplement 2
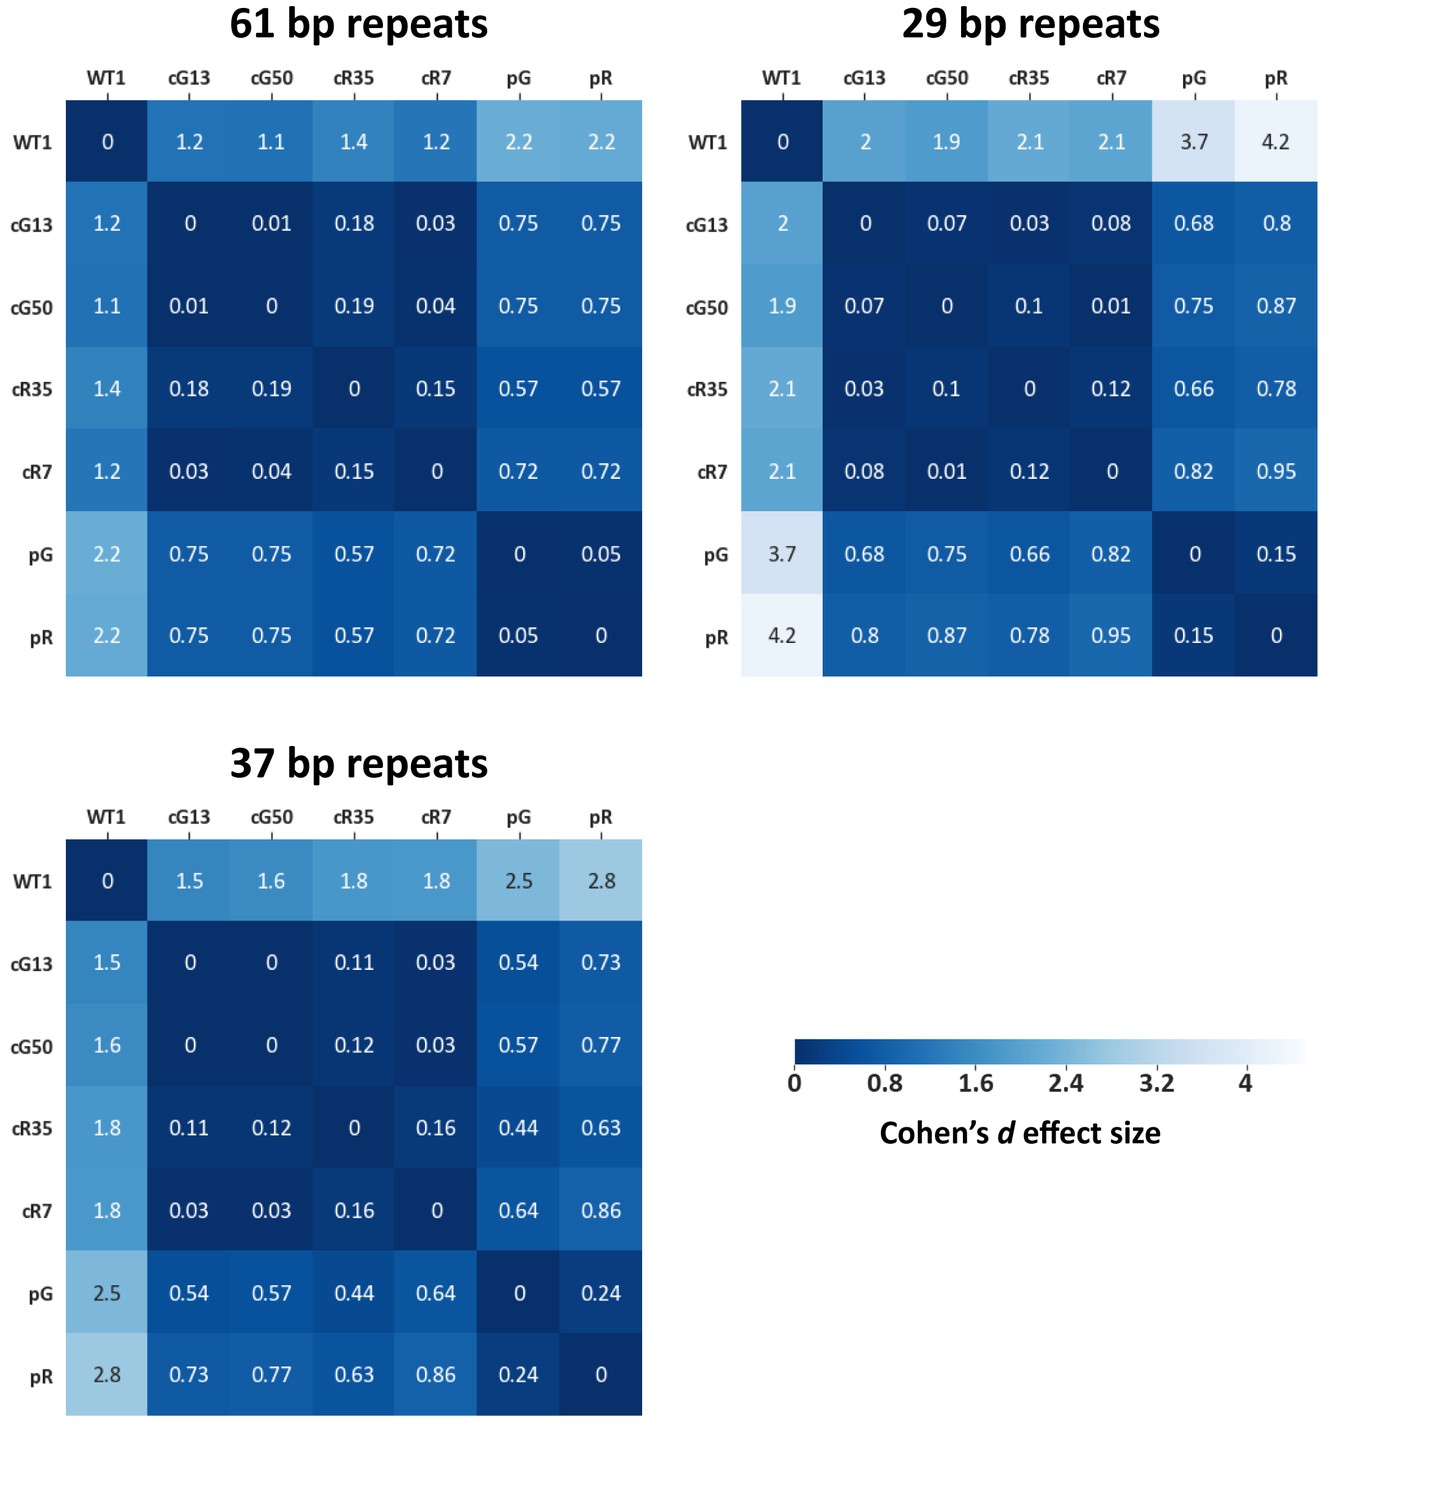
Effect size values measured for subtelomeric TERRA promoter repeats.
Methylation means of subtelomeric TERRA promoter repeats as described in Figure 3B, were compared between samples and effect size values were calculated (See TERRA promoter consensus repeats used for alignment in Supplementary file 2. Each matrix contains the distances between the samples based on the methylation means. The statistical test used to calculate the distances is Cohen’s d effect size (Sawilowsky, 2009). The magnitude of distance is classified as follows: Very small = 0.01, Small = 0.20, Medium = 0.50, Large = 0.80, Very large = 1.20, Huge = 2.0.
Figure 3—figure supplement 3
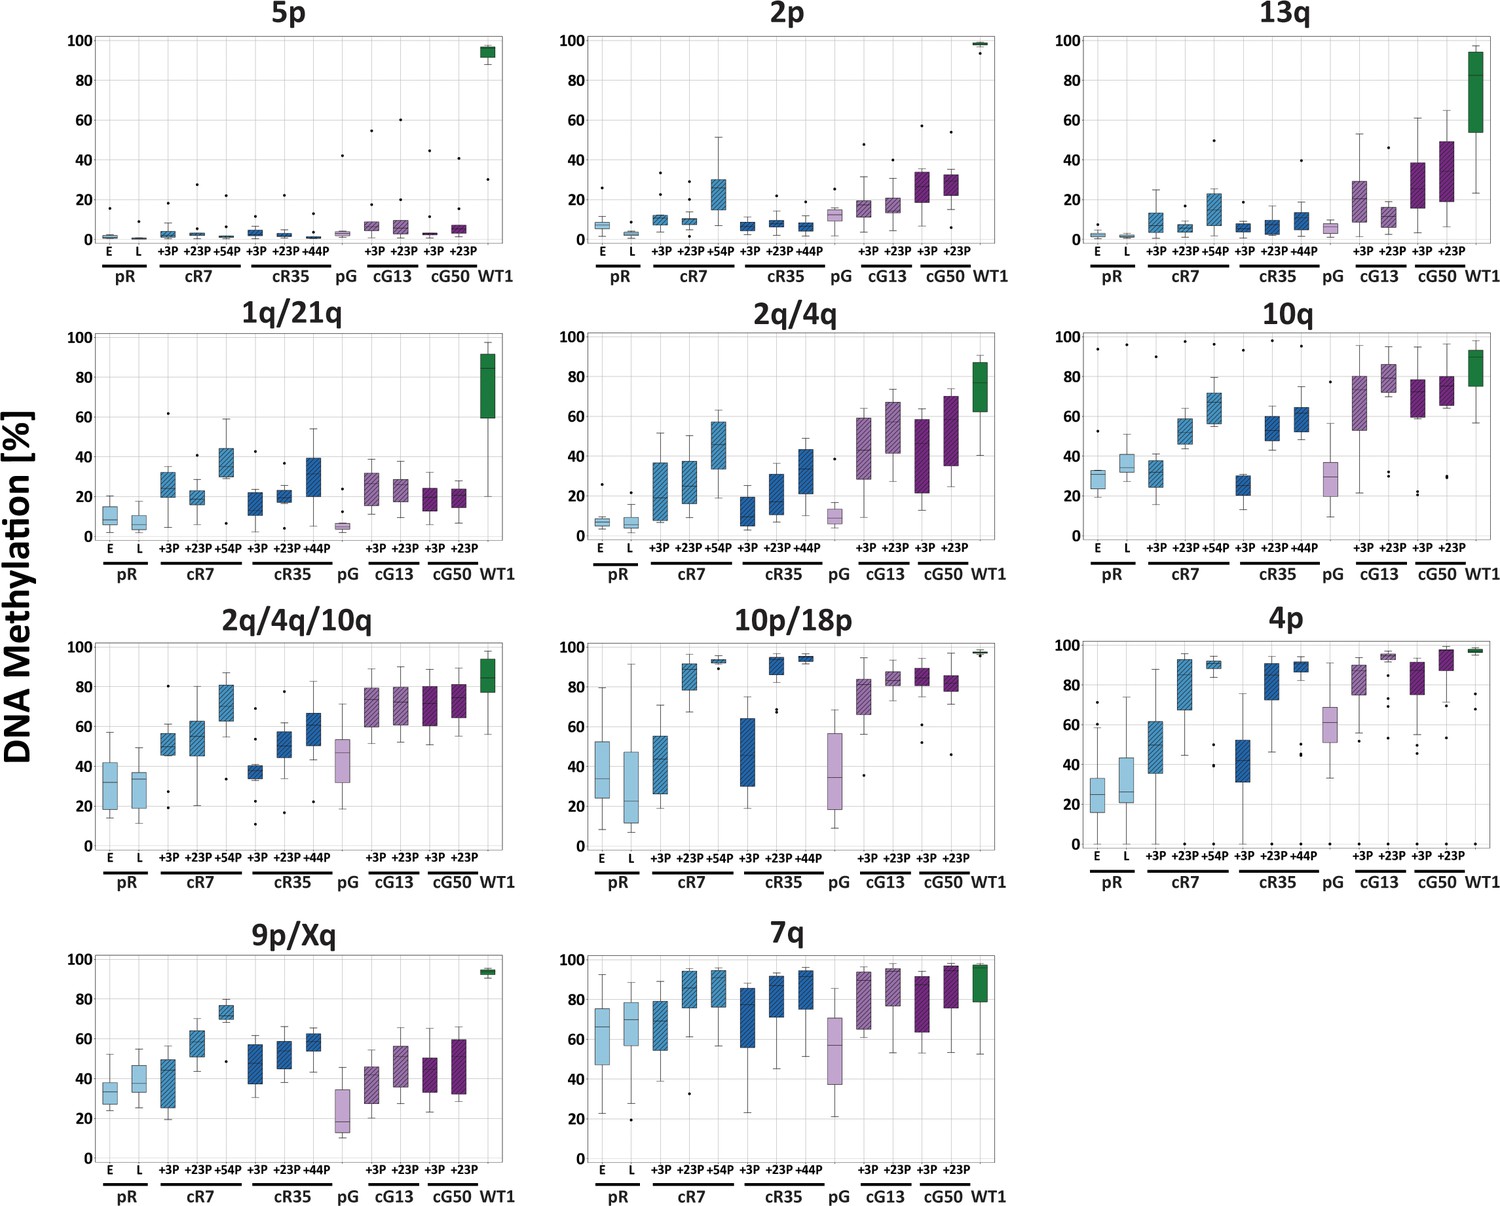
Methylation percentage distribution of all CpG sites per amplicon for ICF, corrected-ICF and WT iPSCs.
DNA methylation at TERRA promoter regions was determined by targeted high throughput sequencing of amplicons from bisulfite converted DNA, as described in Figure 3C. The boxplots represent the methylation percentage distribution of all CpG sites collectively for each amplicon. iPSCs subjected to analysis include ICF pR and pG, their corrected clones cR7, cR35 and cG13, cG50, respectively at two or three time points following isolation of corrected clones, and WT UN1-22 (WT1). The passage (P) at which DNA was extracted for analysis from the corrected clones appears on the X-axis. The plus (+) indicates the number of passages since the corrected clones were isolated.
Figure 4
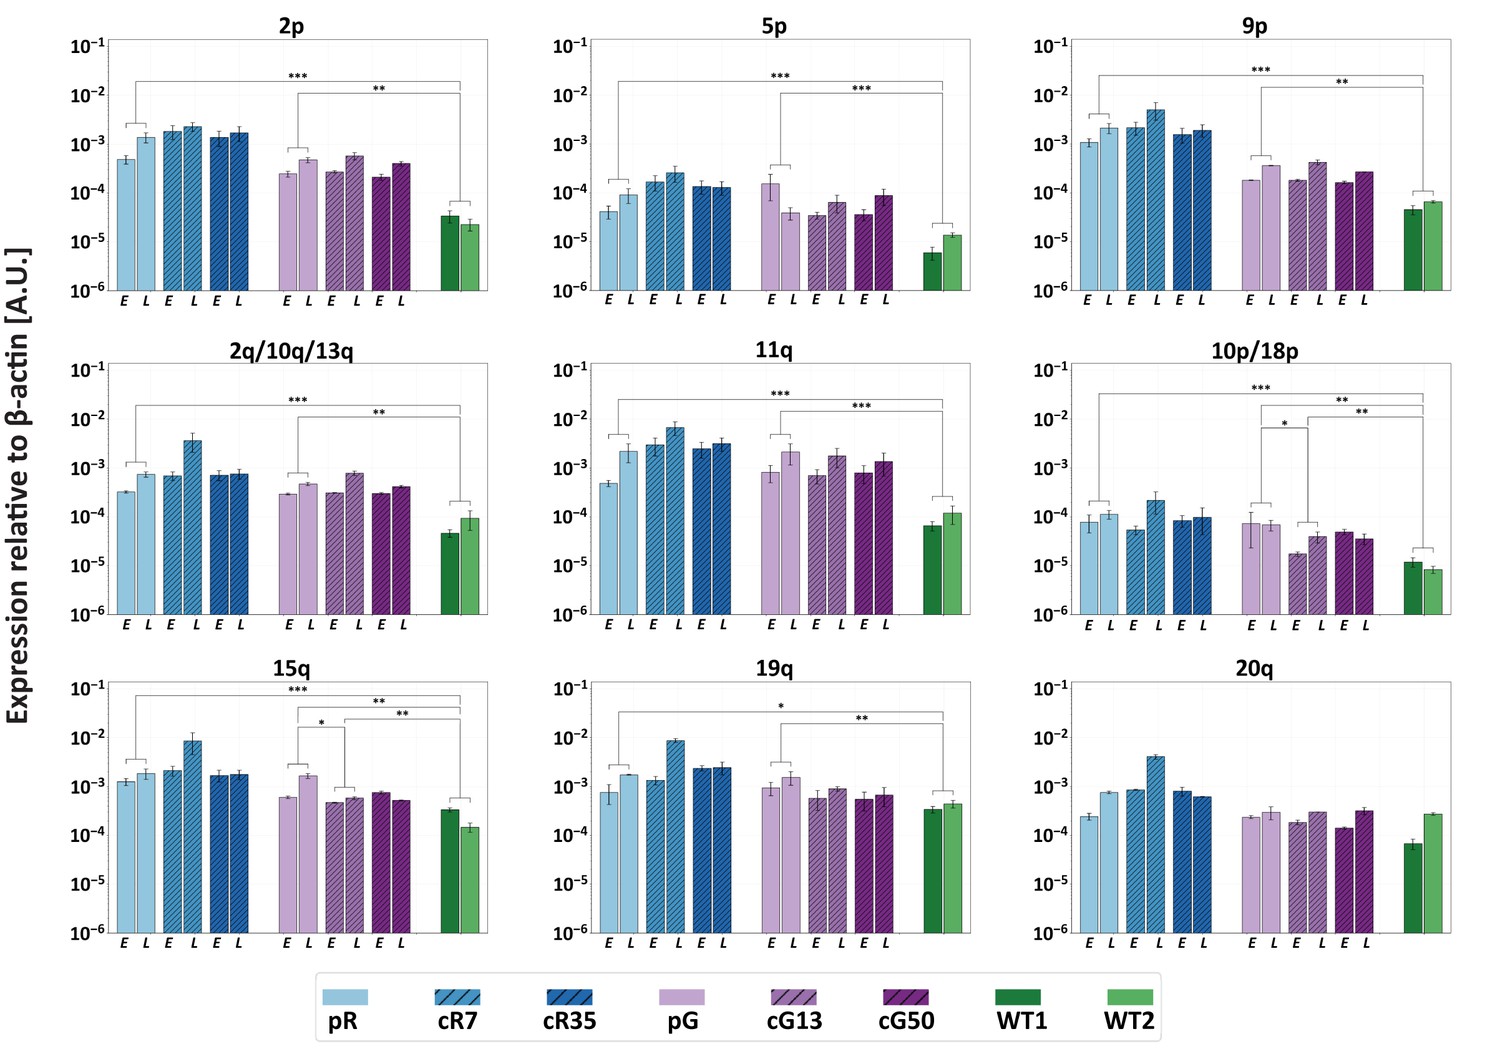
Restoration of DNMT3B activity is insufficient to repress TERRA expression.
TERRA expression from various telomeres depicted above the graphs, was determined for uncorrected ICF iPSCs, corrected clones and control WT iPSCs (UN1-22 and FSE-5m; WT1 and WT2, respectively), using primers described in Supplementary file 3. TERRA was determined for the ICF iPSCs at an early (E) and late (L) passage. The time points at which TERRA levels were determined: pR- passages 30 and 66, cR7 – 14 and 54 passages following isolation, cR35 –14 and 47 passages following isolation, pG- passages 27 and 44, cG13 – 10 and 30 passages following isolation, cG50 – 7 and 28 passages following isolation, WT1 – passage 48, WT2 – passage 64. Each bar represents the mean of the relative TERRA expression compared to expression of β-actin in the same sample. Error bars represent SEM of at least three experimental repeats. A one-tailed Mann-Whitney U-test was performed to determine statistical differences between WT and ICF samples and between the original ICF and its corrected clones (*=p value<0.05, **=p value<0.01, ***=p value<0.001).
Figure 5 with 2 supplements
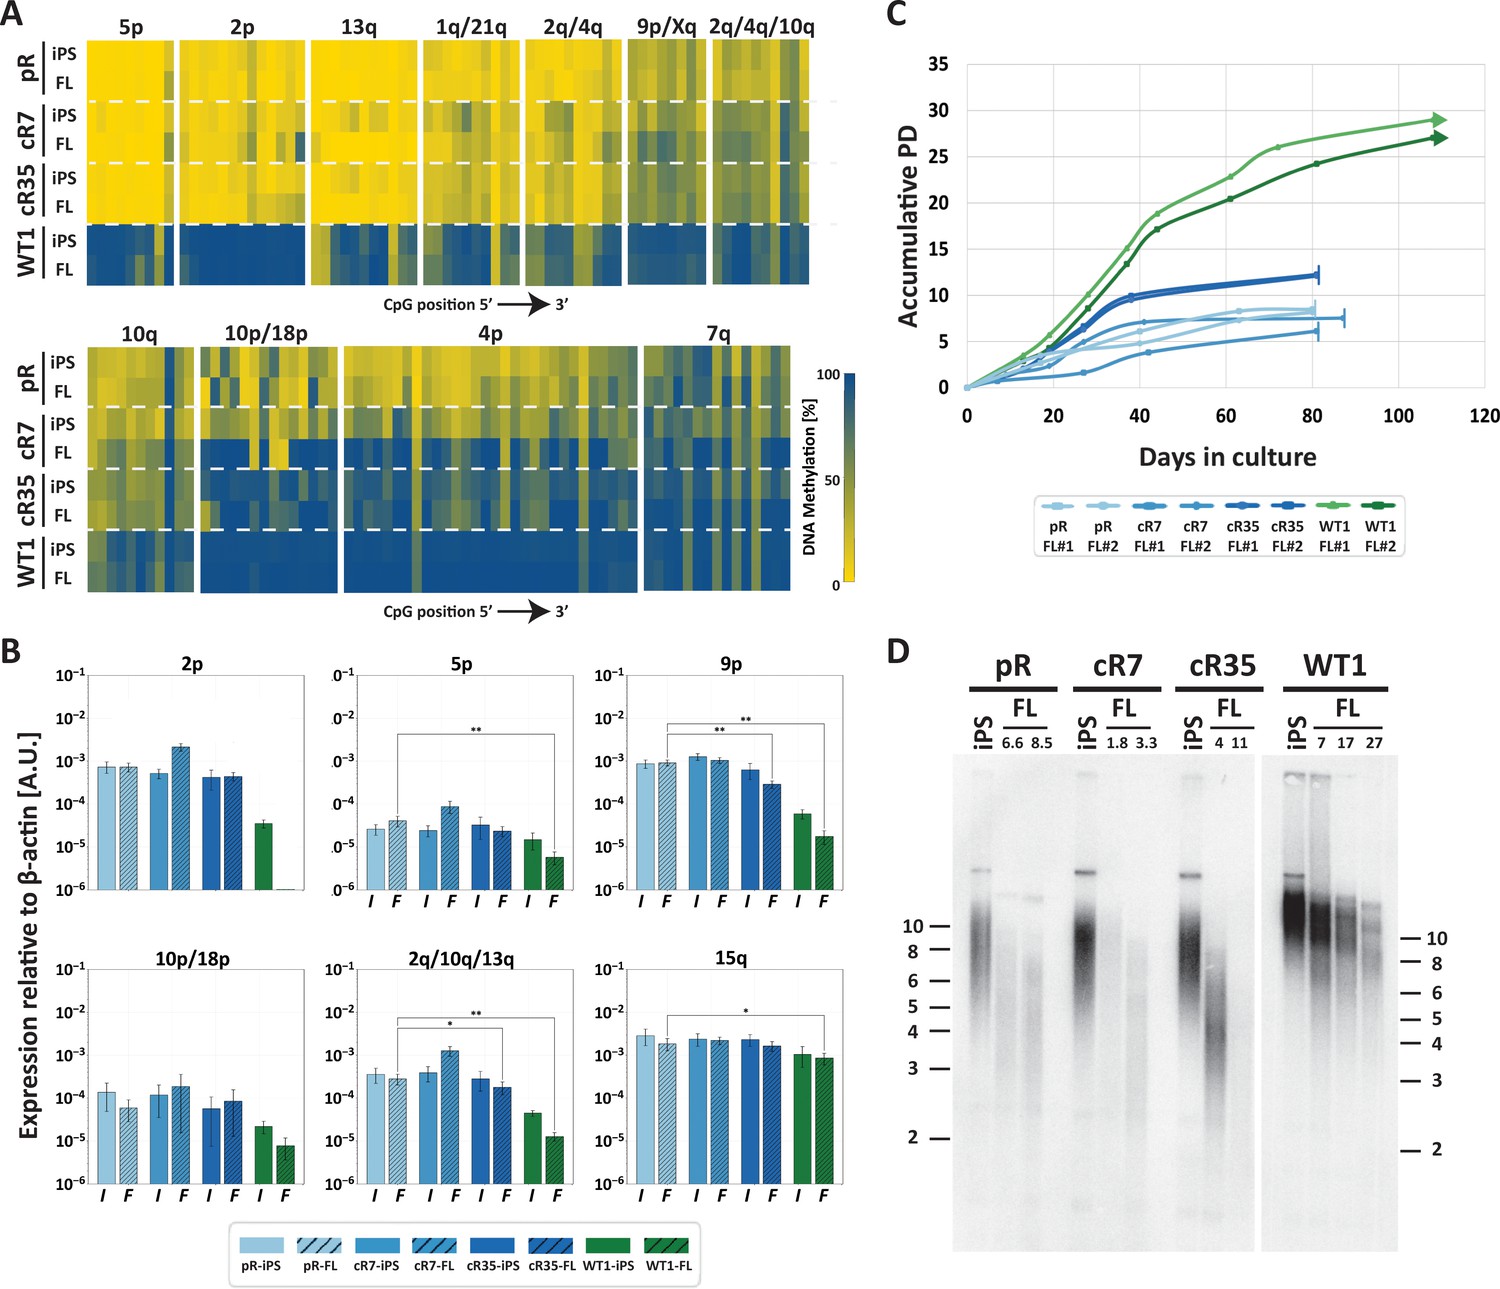
Fibroblast-like cells derived from DNMT3B-corrected ICF iPSCs enter premature senescence.
(A) Subtelomeric DNA methylation in fibroblast-like cells (FLs) derived from DNMT3B-corrected ICF iPSCs. DNA methylation was determined as described in Figure 3C, for iPSCs and FLs of pR, cR7, cR35 and WT1, using primers reported in Supplementary file 1. The analyzed amplicons for targeted bisulfite sequencing are depicted in the map in Figure 3A. (B) TERRA expression levels at nine subtelomeres were determined by RT-qPCR of iPSCs and their derived clones, using primers reported in Supplementary file 3. Samples were compared by a one-tailed Mann-Whitney U-test (*=p value<0.05, **=p value<0.01, ***=p value<0.001). Bars and error bars represent means and SEM of at least three experimental repeats. No transcription was detected for subtelomere 2p in WT FLs, therefore no values are displayed for this sample. (C) Growth curves of pR, cR7, cR35 and WT1-derived FLs. The FLs of pR, cR7 and cR35 were passaged twice until senescence (depicted by a vertical line at the end of the growth curve), and the WT1 FLs were passaged until approximately PD 30 and were still actively dividing at that point (depicted by an arrow at the end of the growth curve). Senescence was also determined by positive SA-β-GAL staining (Figure 5—figure supplement 1). (D) Telomere lengths of the original iPSCs and their derived FLs were determined by Terminal Restriction Fragment (TRF) analysis. PDs at which samples were analyzed appear above the lanes of FLs. Size markers in kb appear both on the left and on the right to depict the degree of separation at each side.
Figure 5—figure supplement 1
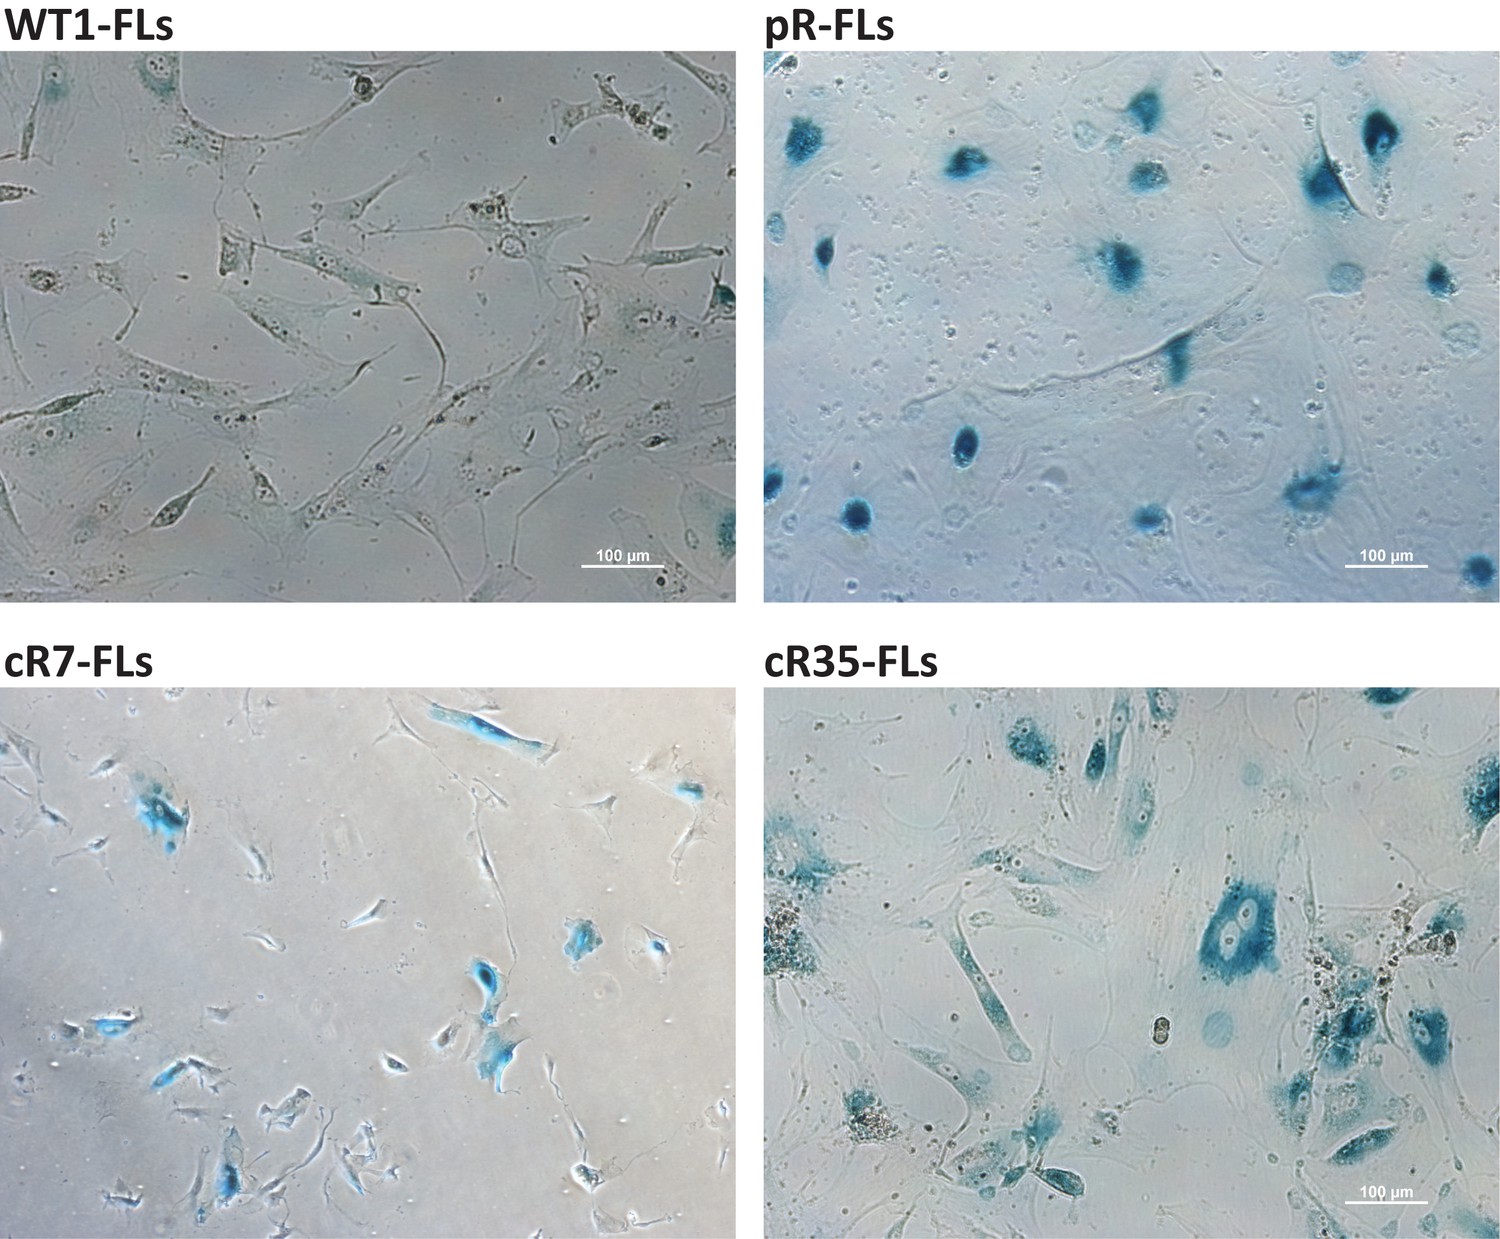
FLs derived from DNMT3B-corrected ICF iPSCs display the SA-β-Gal senescence marker at an abnormally low PD.
FLs were isolated following differentiation of the original and corrected pR iPSCs and cultured until they entered senescence. Cells were stained for the SA-β-Gal senescence marker at a population doubling (PD) close to senescence: pR FLs at PD 8.5, cR7 FLs at PD 6.1 and cR35 FLs at PD 12.9. All isogenic ICF FLs displayed high levels of SA-β-Gal at these low PDs while WT1 FLs at PD 28.7 did not show any staining of this senescence marker. Bar - 100 μm.
Figure 5—figure supplement 2
Ectopic expression of hTERT rescues premature senescence of corrected ICF FLs.
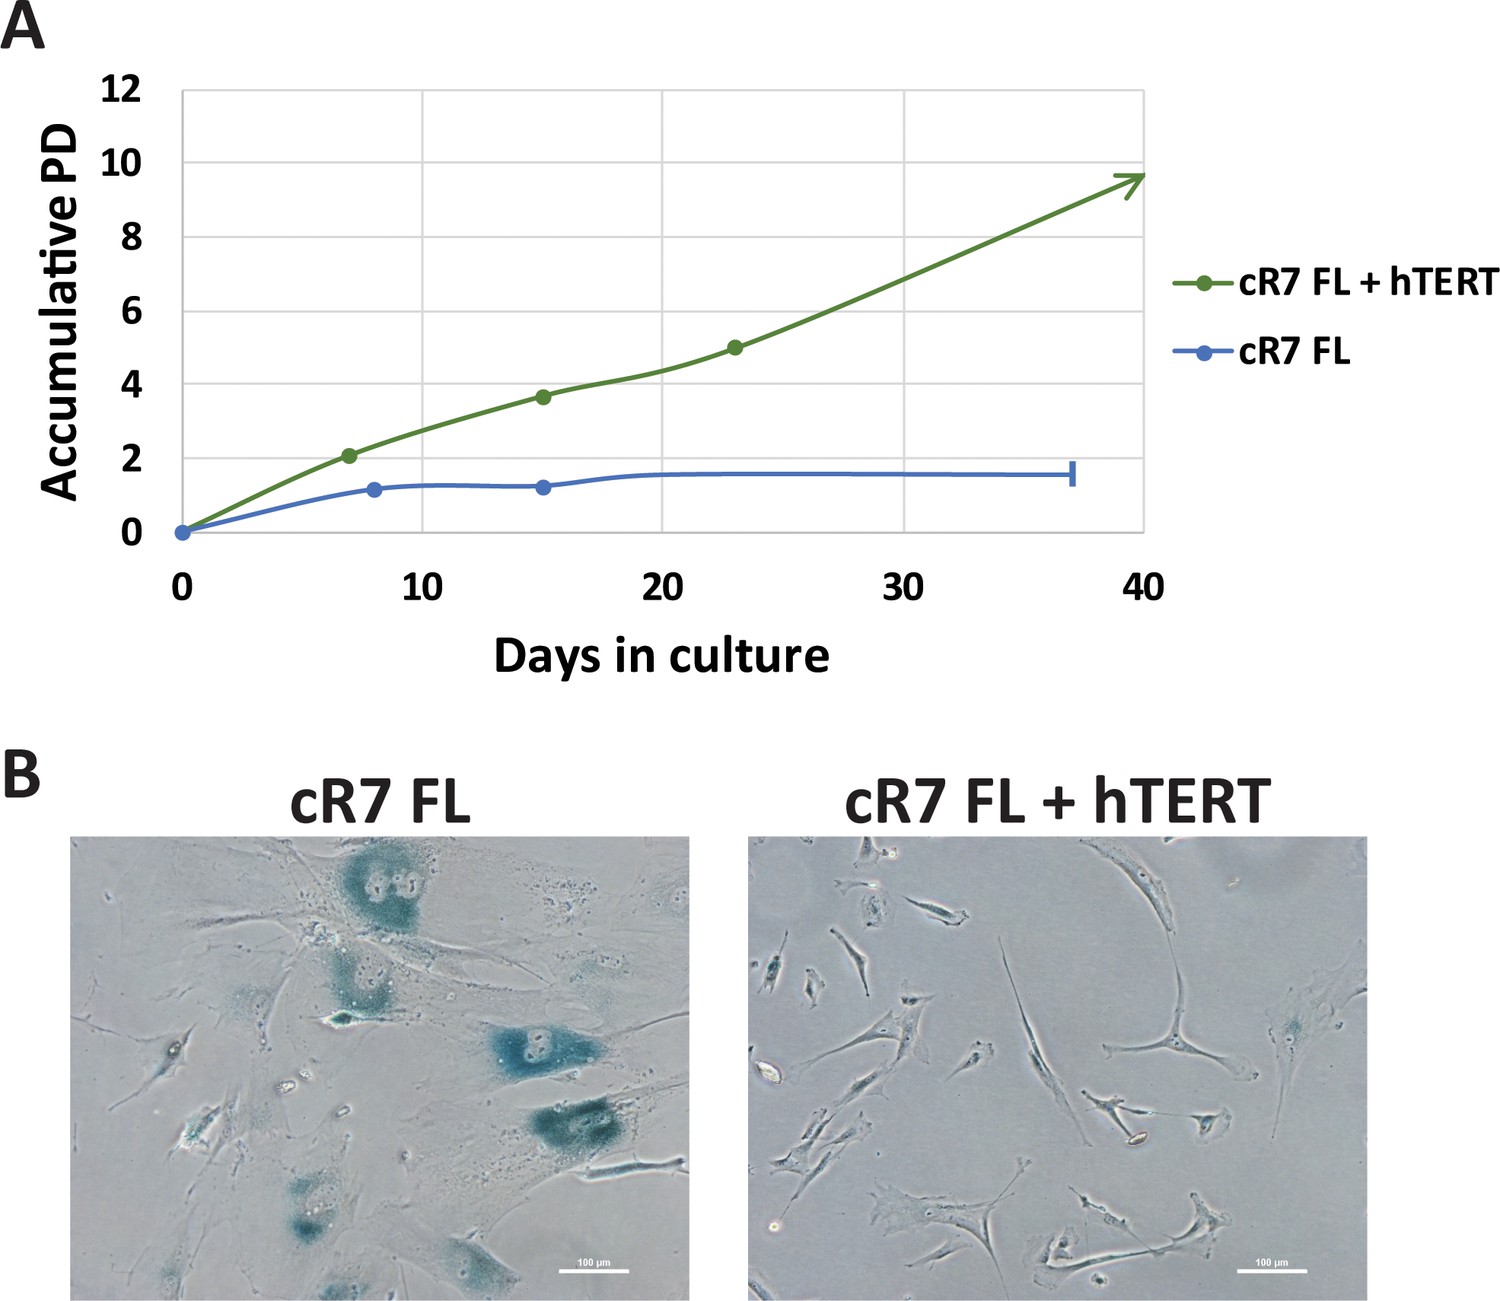
(A) Growth curves of cR7 FLs without and with (+hTERT) expression of ectopic hTERT. Cells were infected at passage 6 plus 2.2 population doublings (PDs). From that time point, PDs were determined for both infected and non-infected cells. The graph displays accumulative PDs and days in culture following infection with pLOX-TERT-ires TK lentiviral plasmid. cR7 FLs which did not express hTERT stopped dividing at approximately 1.5PDs following the time point at which their counterparts were infected, while those expressing hTERT continue to divide. (B) Twenty six days following infection, SA-β-Gal assay was performed on the infected (cR7 FLs + hTERT) and the non-infected cR7 control FLs. The latter display high levels of SA-β-Gal staining and large cell surfaces.
Figure 6
The abnormal epigenetic landscape at subtelomeres is set in the original ICF fibroblasts.
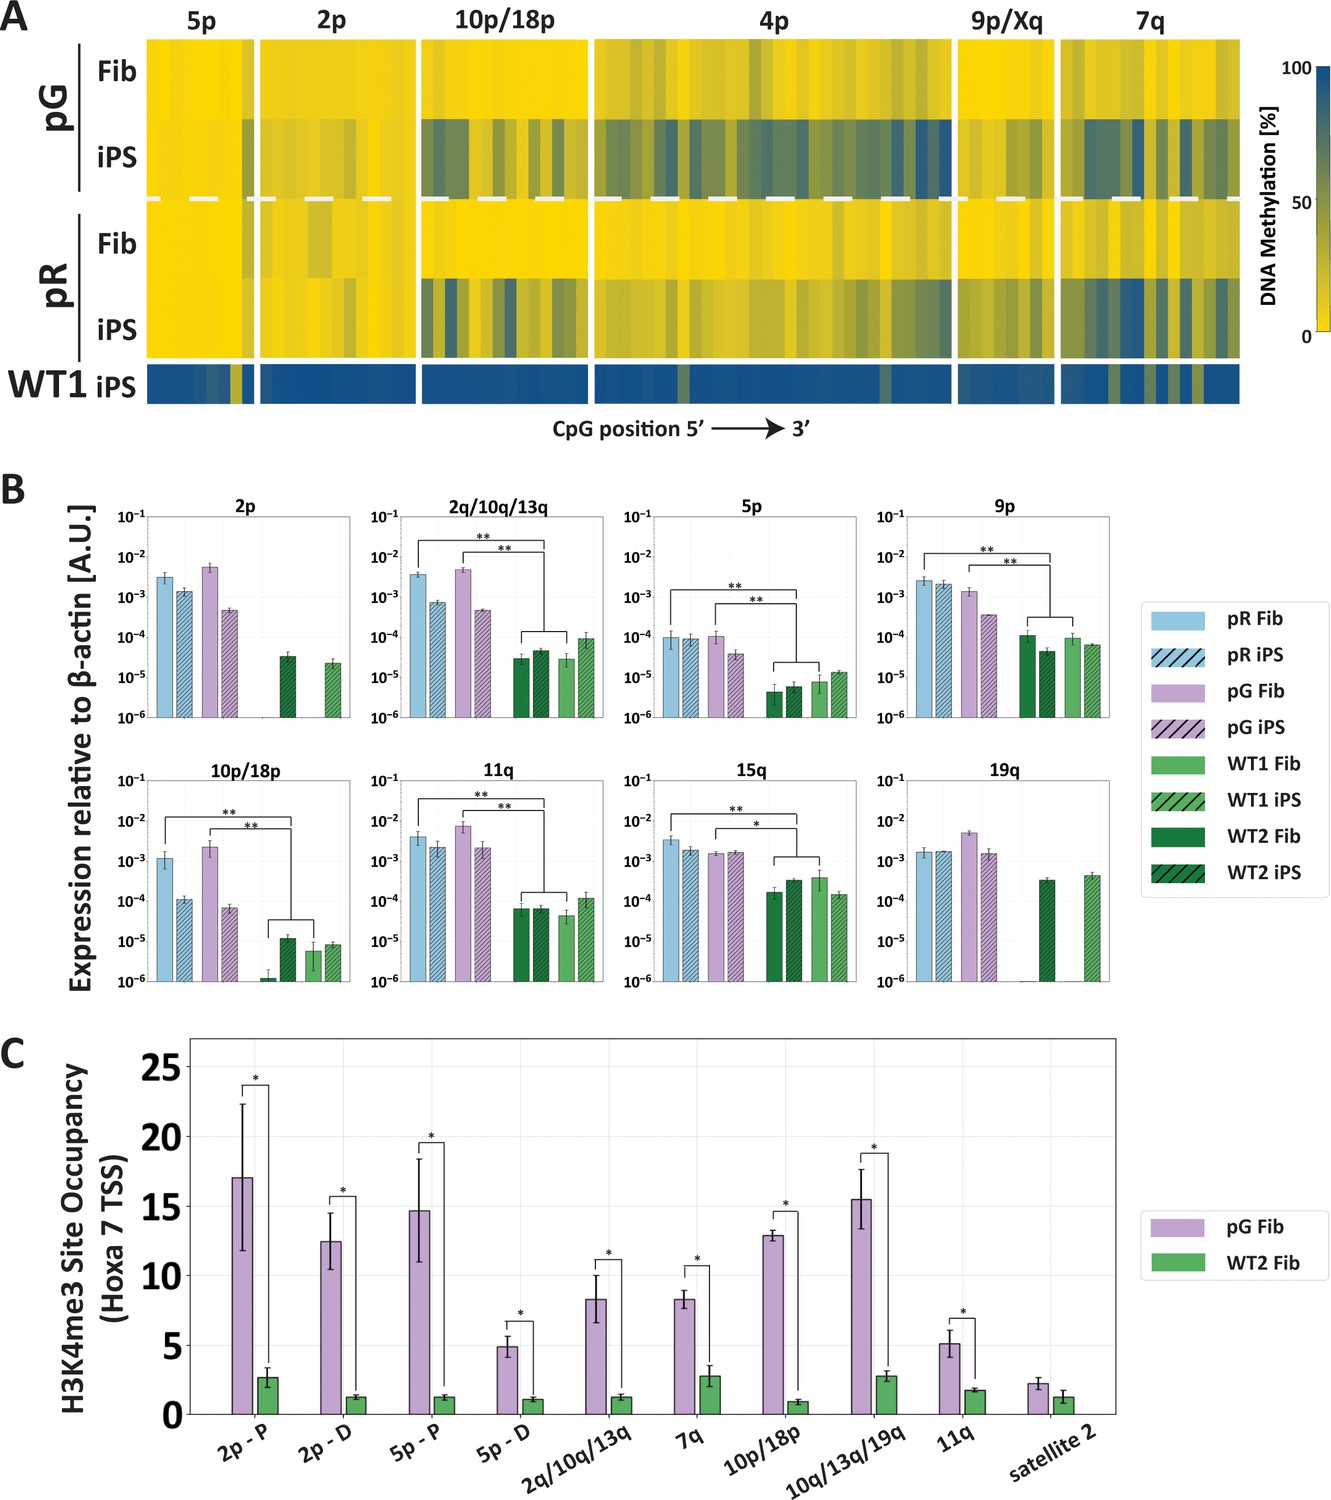
(A) Subtelomeres are de novo methylated to various degrees during reprogramming of ICF fibroblasts into iPSCs. Methylation analysis of various subtelomeres indicates that during reprogramming subtelomeres were partially de novo methylated. However, subtelomeres in ICF iPSCs remained markedly hypomethylated in comparison to WT iPSCs. DNA methylation was determined as described in Figure 3C, using primers reported in Supplementary file 1. The analyzed amplicons for targeted bisulfite sequencing are depicted in the map in Figure 3A. (B) TERRA is highly expressed in ICF fibroblasts. TERRA expression levels were compared between fibroblasts and the generated iPSCs in pR, pG and two normal WT controls, UN1-22 (WT1) and FSE-5m (WT2). TERRA levels for each subtelomere are expressed relative to β-actin expression in the sample. No transcription was detected for subtelomeres 2p and 19q in WT fibroblasts, therefore no values are displayed for these samples. TERRA expression levels were compared between samples by a two-tailed Mann–Whitney U-test (*=p-value<0.05, **=p-value<0.01). Bars and error bars represent means and SEM of at least three experimental repeats. (C) H3K4me3 enrichment at selected subtelomeres in ICF (pG) and WT (WT2) fibroblasts. ChIP amplicon regions are reported in the map in Figure 3A. Fold change in site occupancy at each specific region was determined in relation to the negative control region Hoxa 7 TSS amplified in the same sample (*=p-value<0.05, two-tailed Mann–Whitney U-test). Bars and error bars represent means and SEM of at least three experimental repeats. Primer sets used for ChIP analysis are reported in Supplementary file 3.
Figure 7 with 1 supplement
H3K4me3 enrichment influences de novo methylation at subtelomeric regions.
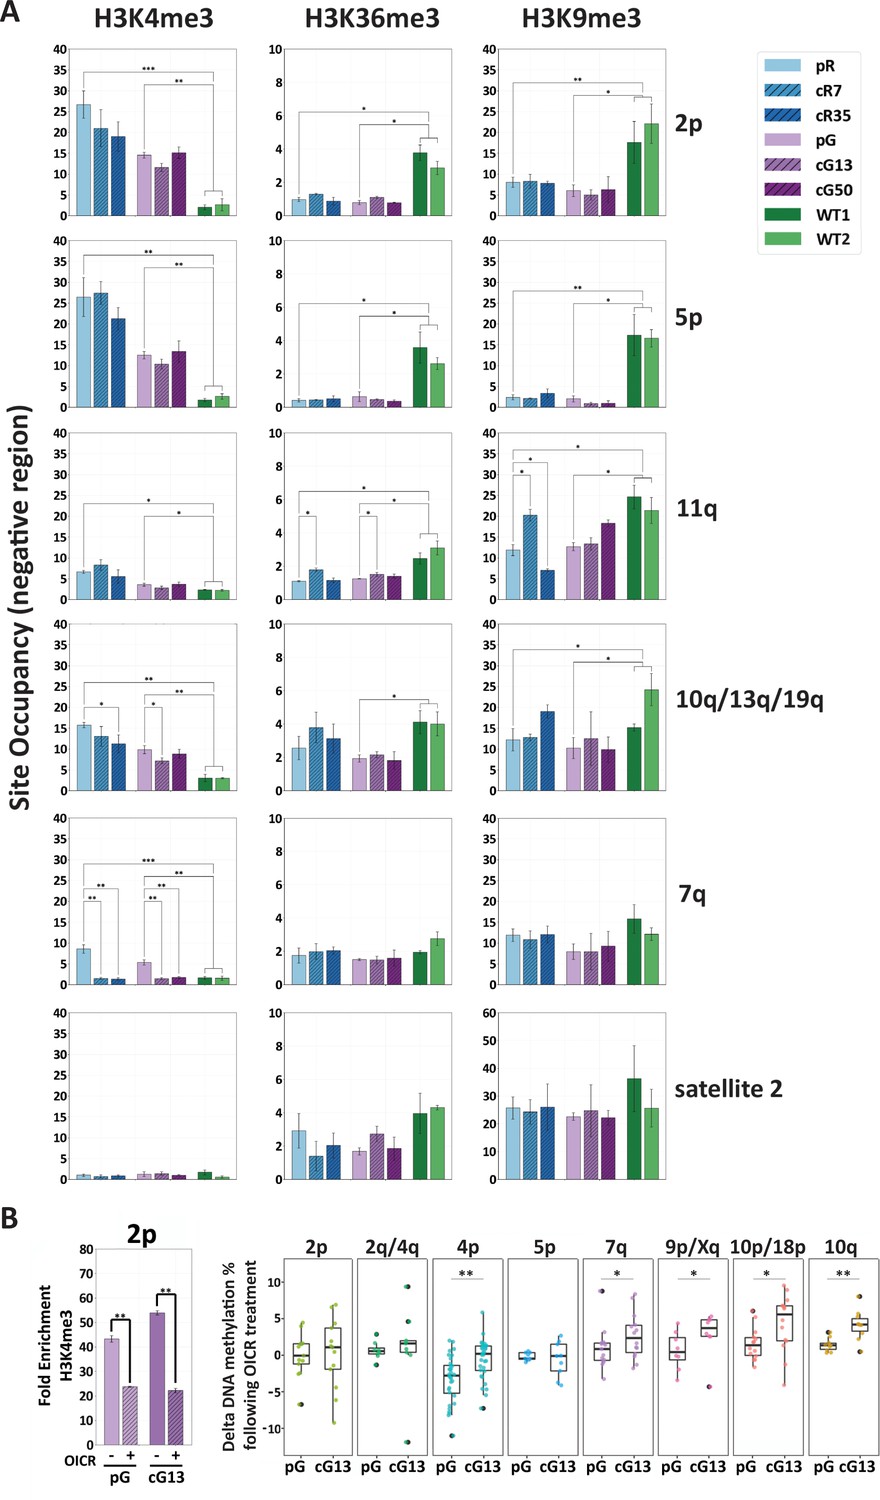
(A) Enrichment for H3K4me3, H3K36me3 and H3K9me3 at subtelomeres was determined by ChIP assay for ICF original and corrected iPSCs and WT iPSCs. Enrichment of these histone marks was assayed at TERRA promoters depicted on the right, as well as at satellite 2 repeats. Subtelomeres 2p and 5p were analyzed with the upstream 2p-P and 5p-P primer sets (Figure 3A and Supplementary file 3. Fold change in site occupancy was determined in relation to the following control regions amplified in the same samples: Hoxa7 TSS, Myoglobin exon 2 and GAPDH promoter for H3K4me3, H3K36me3 and H3K9me3 marks, respectively (See also Figure 7—figure supplement 1). Bars and error bars represent means and SEM of at least three experimental repeats. (B) Pharmacological inhibition of H3K4 MLL methyltransferase with OICR-9429 treatment. Left panel: H3K4me3 enrichment at subtelomere 2p (analysis of region 2p-P) determined by ChIP in uncorrected (pG) and corrected (cG13) iPSCs, either with (+) or without (-) OICR-9429 treatment. Fold enrichment was calculated by normalizing the percentage of input to the IgG negative control. Right panel: Boxplots showing the distribution of delta values calculated by comparing the CpG methylation levels obtained by targeted bisulfite sequencing in treated vs. untreated samples for subtelomeres 2p, 2q/4q, 4p, 5p, 7q, 9p/Xq, 10p/18 p and 10q. Note that a unique primer set, designated by d in Supplementary file 1, was used in this experiment to amplify subtelomeres 10q, 2q and 4q. Statistical analysis for ChIP was performed using a two-tailed Student’s t-test. Statistical analysis of methylation data was performed by two-tailed Mann-Whitney U-tests (*=p value<0.05, **=p value<0.01).
Figure 7—figure supplement 1

Chromatin marks at proximal and distal regions of specific subtelomeres.
H3K4me3, H3K36me3 and H3K9me3 enrichments were examined at both proximal and distal regions in the case of subtelomeres 2p, 5p, 10q, 13q, and regions in proximity of the telomere tract in the case of subtelomeres 2q, 10p and 18p. The regions amplified are indicated on the maps depicted above the graphs, including the repeat families of the TERRA promoter and the putative TSS. Fold change in site occupancy was determined in relation to the following control regions amplified in the same samples: Hoxa7 TSS, Myoglobin exon 2 and GAPDH promoter for H3K4me3, H3K36me3 and H3K9me3 marks, respectively. Two-tailed Mann-Whitney U-tests were performed to determine statistical differences between WT and ICF samples and between the original ICF iPSCs and their corrected clones (*=p-value<0.05, **=p value<0.01, ***=p value<0.001). Bars and error bars represent means and SEM of at least three experimental repeats.
Tables
Key resources table
| Reagent type (species) or resource | Designation | Source or reference | Identifiers | Additional information |
|---|---|---|---|---|
| Gene (human) | DNMT3B1 | www.ensembl.org | ENST00000328111.6 | |
| Cell line (human; Female – pR, cR7, cR35; Male – pG, cG13, cG50, UN1-22, FSE-5m) | iPSC lines | This paper; Shinnawi et al., 2015; Sagie et al., 2014; Yehezkel et al., 2011 | Cell lines maintained in S. Selig and M. Matarazzo labs | |
| Cell line (human; Female – pR, cR7, cR35; Male – pG, cG13, cG50, UN, FSE) | Fibroblasts and Fibroblast-like cells (FLs) | This paper; Sagie et al., 2014 | Cell lines maintained in S. Selig lab | |
| Antibody | H3K4me3 (Rabbit polyclonal) | Abcam, Cambridge, UK | Cat# ab8580 | ChIP (3.5 μg per sample) |
| Antibody | H3K9me3 (Rabbit polyclonal) | Abcam, Cambridge, UK | Cat# ab8898 | ChIP (3.5 μg per sample) |
| Antibody | H3K36me3 (Rabbit polyclonal) | Abcam, Cambridge, UK | Cat# ab9050 | ChIP (5 μg per sample) |
| Antibody | anti-DNMT3B (Rabbit polyclonal) | Diagenode | Cat# C15410218 | ChIP (5 μg per sample) Western (1:3000) |
| anti-DNMT3B (Rabbit polyclonal) | Diagenode | Cat# C15410218 | Western (1:1000) | |
| Antibody | anti-actin (Rabbit polyclonal) | Sigma | Cat# a2066 | Western (1:5000) |
| Recombinant DNA reagent | pSpCas9 (BB)−2A-Puro (PX459) V2.0 | Addgene plasmid #62988;http://www.addgene.org/62988/; RRID:Addgene_62988 | Ran et al., 2013 | sgRNAs were designed using the Optimized CRISPR Design online tool (http://crispr.mit.edu) and cloned into this plasmid |
| Recombinant DNA reagent | lentiviral vector pLOX-TERT-iresTK | Addgene plasmid # 12245; http://www.addgene.org/12245/; RRID:Addgene_12245 | Salmon et al., 2000 | |
| Sequenced-based reagent | pR screening primers | This paper (IDT) | PCR primers | Forward5’-ATGGCGAG GGCAGAAAGAGT-3', Reverse-5’-GCACCGTG TTAGGCTGCTCC-3' |
| Sequence-based reagent | pG screening primers | This paper (IDT) | PCR primers | Forward- 5’-GCCTGTCCA CATGGAACC-3', Reverse-5’-CTAGAGCTC TCTTCCCTCC-3' |
| Sequenced-based reagent | The template ssODNs of pR | This paper (IDT) | Oligonucleotides | pR: 5’- ACGCTCCAGG ACCTTCCCA GCAGCTTCTGGCGGGC ACCACGGCCCATGTTGG ACACGTCTGTATAGTGC ACAGGAAAGCCAAAGATCCTG-3’ |
| Sequenced-based reagent | The template ssODNs of pG | This paper (IDT) | Oligonucleotides | pG: 5’-CGCTCACTATGTCAGCG CCTGACACCACCCCAGTCCCCA CTGCCCAGCCACCTCTGA TCTCGGGGGTCCGGATAG CCTCCAGGATTGGGG-3’ |
| Peptide, recombinant protein | protease inhibitor cocktail | MERCK, Darmstadt, Germany | Cat. #: 11697498001 | |
| Peptide, recombinant protein | proteinase K | MERCK, Darmstadt, Germany | Cat. #: 03115828001 | |
| Peptide, recombinant protein | RNA purification with TURBO DNA-free TM Kit | Thermo Fisher Scientific | Cat. #: AM2238 | |
| Peptide, recombinant protein | SuperScript III reverse transcriptase | ThermoFisher Scientific | 18080044 | |
| Commercial assay or kit | DNA bisulfite- conversion | EPIGENTEK, NY, USA | Methylamp DNA Modification kit | |
| Commercial assay or kit | DNA amplification using FastStart Taq DNA Polymerase, dNTPack | MERCK, Darmstadt, Germany | Cat. #: 04738314001 | |
| Commercial assay or kit | Magna ChIP | MERCK, Darmstadt, Germany | Cat. #: 17–610 | |
| Commercial assay or kit | Senescence beta-Galactosidase Staining Kit | Cell Signaling Technology | Cat. #: 9860S | |
| Chemical compound, drug | ROCK inhibitor | StemCell Technologies | Cat. #: Y-27632 | (5 µM) |
| Chemical compound, drug | L-755507 | StemCell Technologies | Cat. #: 73992 | Yu et al., 2015 (5 µM) |
| Chemical compound, drug | Accutase | StemCell Technologies | Cat. #: 07920 | |
| Chemical compound, drug | recombinant Human FGF-basic | PeproTech | Cat. #: 100-18B | |
| Chemical compound, drug | Opti-MEM | ThermoFisher Scientific | Cat. #: 31985070 | |
| Chemical compound, drug | Puromycin | MERCK, Darmstadt, Germany | Cat. #: P7130 | (1 µg/ml) |
| Chemical compound, drug | OICR-9429 | MERCK Darmstadt, Germany | Cat. #: SML1209 | dissolved in DMSO (1 μM) |
| Chemical compound, drug | Fast SYBR Green Master Mix | ThermoFisher Scientific | Cat. #: 4385612 | |
| Chemical compound, drug | Phenylmethanesulfonyl fluoride | MERCK, Darmstadt, Germany | Cat. #: P7626 | (1 mM) |
| Software, algorithm | Python libraries: 'numpy', 'scipy', 'statsmodels', 'pandas', 'jupyter' and 'notebook' | Python | Python 2.7 | |
| Software, algorithm | ImageQuant software | GE Healthcare Life Science | ||
| Software, algorithm | FastQC tool | https://www.bioinformatics.babraham.ac.uk/projects/fastqc/ | ||
| Software, algorithm | Bismark | https://www.bioinformatics.babraham.ac.uk/projects/bismark/ | ||
| Software, algorithm | BLAT software | University of California, Santa Cruz [UCSC] Genome Browser, http://genome.ucsc.edu | ||
| Software, algorithm | MAFFT v7 | https://mafft.cbrc.jp/alignment/software/ | ||
| Software, algorithm | Repitools R package | http://bioconductor.org/packages/release/bioc/html/Repitools.html | ||
| Software, algorithm | heatmap2 function in R 3.03 | https://www.rdocumentation.org/packages/gplots/versions/3.0.1.1/topics/heatmap.2 | ||
| Software, algorithm | Bedtools v2.17.0 | https://github.com/arq5x/bedtools2 |
Table 1
Induced pluripotent stem cells (iPSCs) utilized in this study
| iPSC name | Additional information | Reference |
|---|---|---|
| pR | pR75 – original ICF1 iPSC | (Sagie et al., 2014) |
| cR7 | cR7 – CRISPR corrected pR clone | this manuscript |
| cR35 | cR35 – CRISPR corrected pR clone | this manuscript |
| pG | pG20 – original ICF1 iPSC | (Sagie et al., 2014) |
| cG13 | cG13 – CRISPR corrected pG clone | this manuscript |
| cG50 | cG50 – CRISPR corrected pG clone | this manuscript |
| WT1 | UN1-22 – derived from a healthy individual | (Shinnawi et al., 2015) |
| WT2 | FSE-5m – derived from a healthy individual | (Yehezkel et al., 2011) |
Author response table 1
| Mean Telomere Length | ||
|---|---|---|
| MspI-digested (Figure 1D) | HinfI-digested (Figure 5D) | |
| pR | Left marker – 7.2 Kb | Left marker – 7.00 Kb |
| cR7 | Left marker – 6.4 Kb | Left marker – 6.9 Kb |
| cR35 | Right marker – 6.6 Kb | Left marker – 6.7 Kb |
| WT1 | Right marker – 10.0 Kb | Right marker – 10.4 Kb |
Additional files
-
Supplementary file 1
Primers for bisulfite analysis by Ion torrent PGM.
- https://cdn.elifesciences.org/articles/47859/elife-47859-supp1-v3.docx
-
Supplementary file 2
TERRA promoter consensus repeats utilized for alignments with WGBS data.
- https://cdn.elifesciences.org/articles/47859/elife-47859-supp2-v3.docx
-
Supplementary file 3
Primers for RT-qPCR and ChIP analyses.
- https://cdn.elifesciences.org/articles/47859/elife-47859-supp3-v3.docx
-
Transparent reporting form
- https://cdn.elifesciences.org/articles/47859/elife-47859-transrepform-v3.docx
Download links
A two-part list of links to download the article, or parts of the article, in various formats.
Downloads (link to download the article as PDF)
Open citations (links to open the citations from this article in various online reference manager services)
Cite this article (links to download the citations from this article in formats compatible with various reference manager tools)
Persistent epigenetic memory impedes rescue of the telomeric phenotype in human ICF iPSCs following DNMT3B correction
eLife 8:e47859.
https://doi.org/10.7554/eLife.47859


