Screening identifies small molecules that enhance the maturation of human pluripotent stem cell-derived myotubes
- University of Minnesota, United States
- Centro de Investigación y de Estudios Avanzados del IPN (CINVESTAV-IPN), Mexico
- Sorbonne Universités, Faculté de Médecine site Pitié-Salpêtrière, France
- Bio-Techne, United States
Figures
Figure 1 with 3 supplements
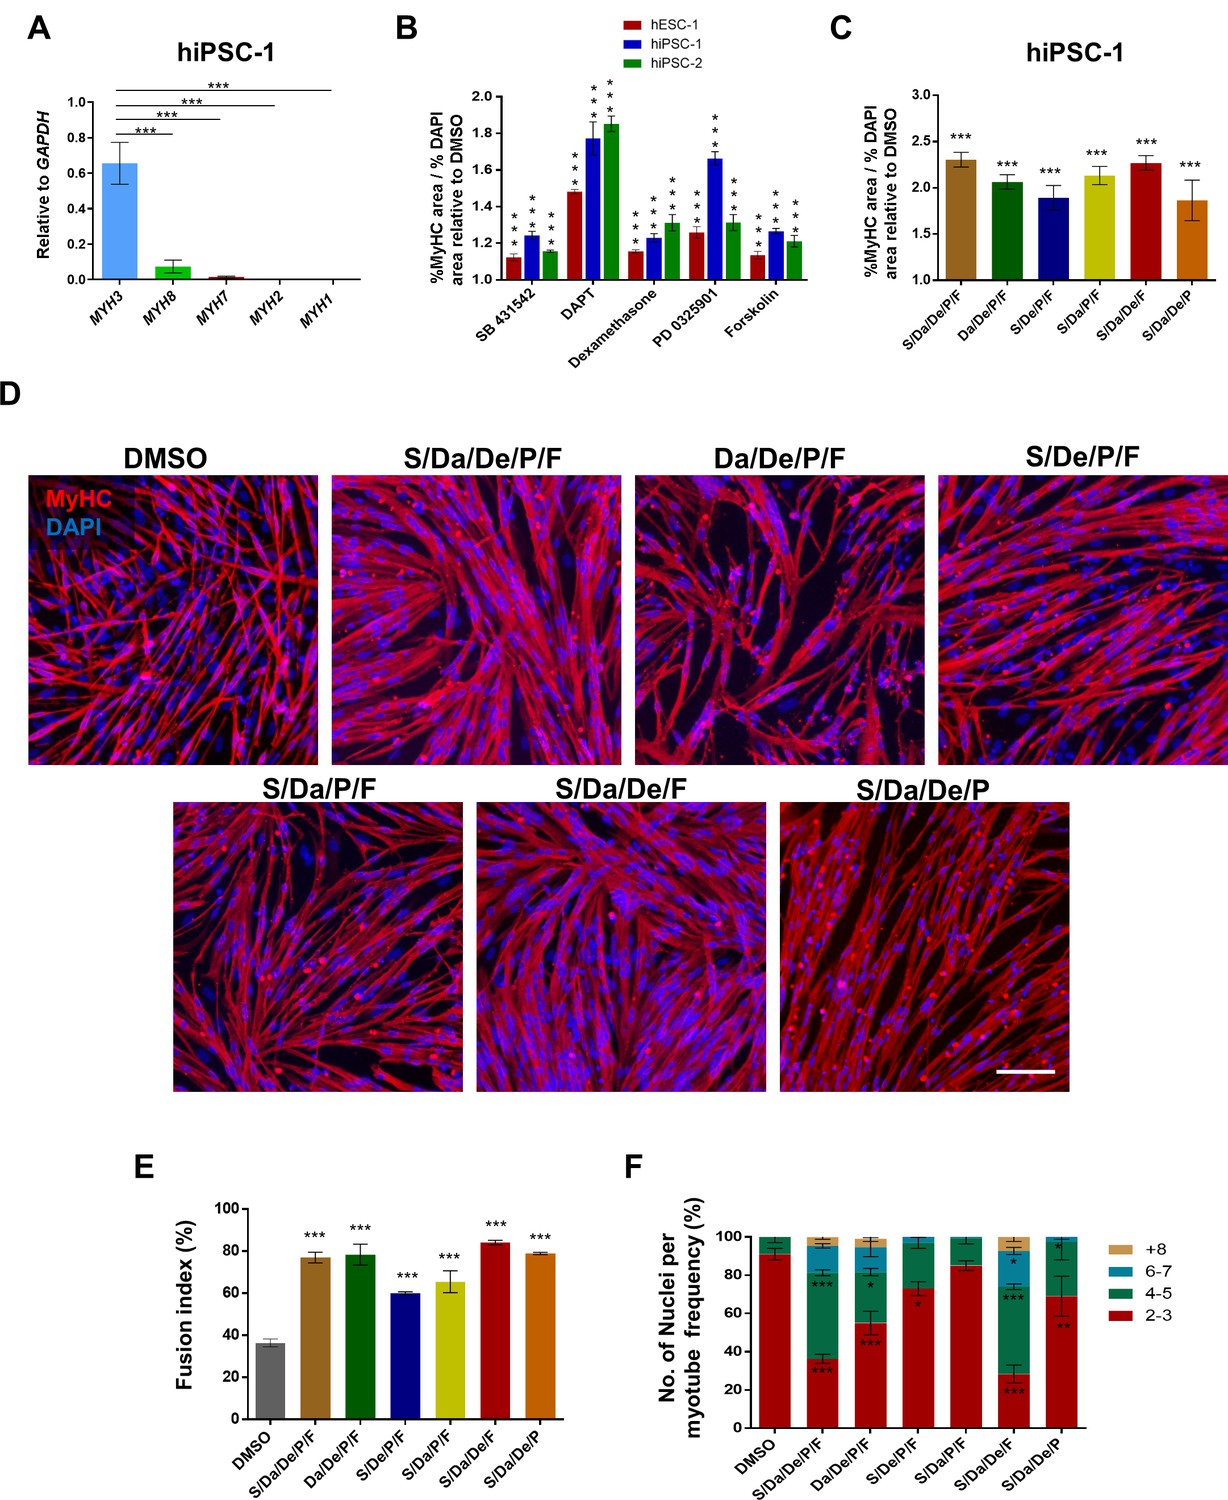
Combinatorial treatment with four small molecules augments myotube generation from human PS cells and their fusion ability.
(A) Bar graph shows expression profile of MYH isoforms in hiPSC-1-derived myotubes. Data are shown as mean ± S.E.M.; n = 3, ***p<0.001. (B) Bar graph shows the ratio of % MyHC-stained area to % DAPI area in myotubes resulting from treatment with five candidates identified by the small molecule screening. Data show significant increase (***p<0.001) compared to DMSO in all three PS cell lines analyzed (hESC-1, hiPSC-1 and hiPSC-2). Data from three independent replicates are shown, normalized to DMSO, as mean ± S.E.M. (C) Bar graph shows the ratio of % MyHC-stained area to % DAPI area in iPS cell-derived myotubes that had been differentiated in the presence of all candidates combined, or with individual candidates excluded from the overall combination. Data from three independent replicates are shown normalized to DMSO. Values are shown as mean ± S.E.M. ***p<0.001. (D) Representative images show immunostaining for MyHC (in red) in hiPSC-1 myotubes differentiated with combinatory treatments of small molecules or DMSO. DAPI stains nuclei (in blue). Scale bar is 100 μm. (E) Bar graph shows fusion index analysis of myotubes that were differentiated with small molecule combinations or DMSO. Data are shown as mean of three independent replicates ± S.E.M. ***p<0.001. (F) Stacked bar graph shows the frequency of number of nuclei per myotube upon differentiation with combinatory treatments or DMSO. Data are shown as mean of three independent replicates ± S.E.M. Statistical analysis compares each combination to DMSO. *p<0.05 **p<0.01 ***p<0.001.
-
Figure 1—source data 1
Tocriscreen Stem Cell Toolbox compounds tested during myogenic terminal differentiation of PS cell lines.
- https://doi.org/10.7554/eLife.47970.006
Figure 1—figure supplement 1
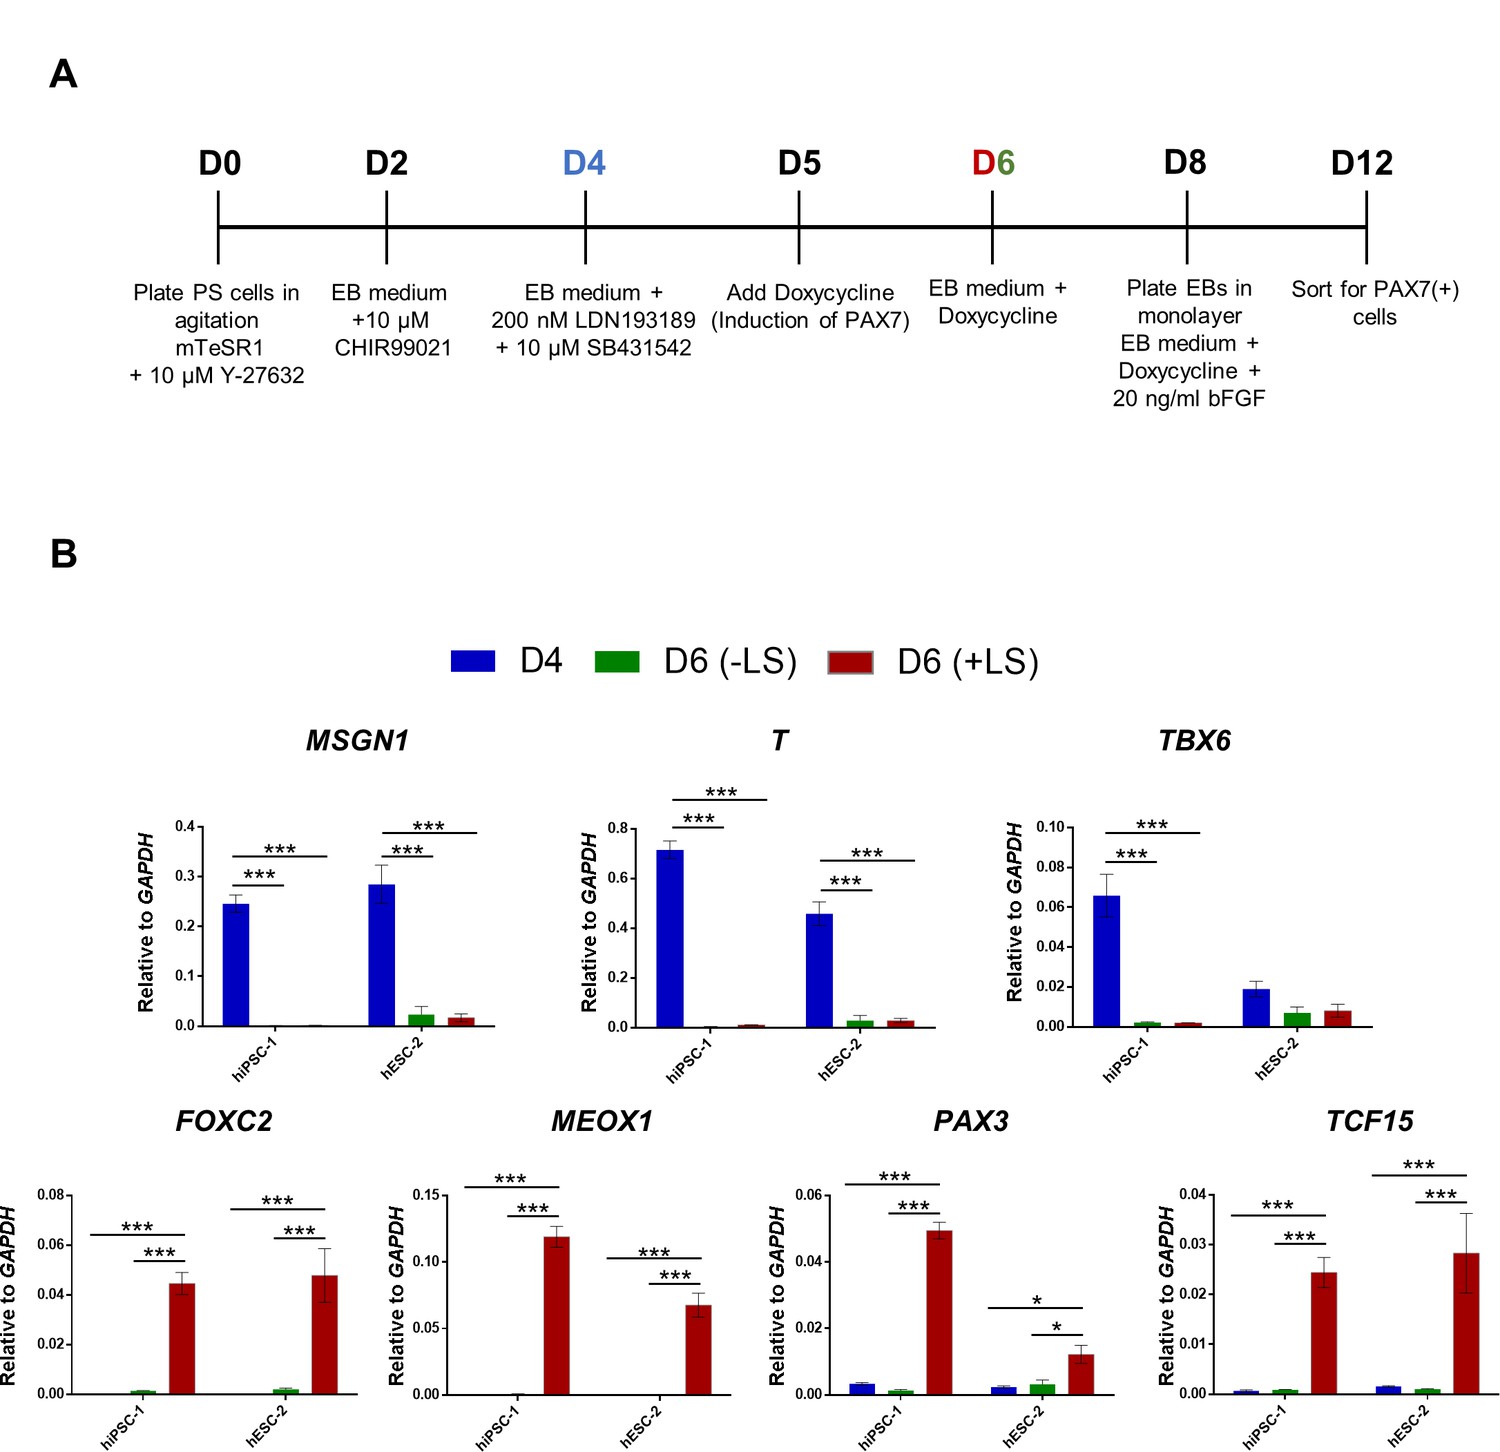
BMP and TGFβ signaling inhibition induce somite-like specification during the in vitro muscle differentiation of iPAX7 PS cells.
(A) Schematic representation of the modified EB-iPAX7 protocol, which includes incubation with LDN193189 and SB431542, BMP and TGFβ signaling inhibitors, respectively, addition of Doxycycline on day 5, and sorting of myogenic progenitors on day 12. (B) Bar graphs show expression analysis of paraxial mesoderm (MSGN1, T and TBX6) and somite (FOXC2, MEOX1, PAX3 and TCF15) genes relative to GAPDH in hESC-1 and hiPSC-1 lines at day 4 and day 6 of the EB-iPAX7 protocol (A) with or without addition of LDN193189 and SB431542 (LS). Data are shown as mean of three independent replicates ± S.E.M. *p<0.05 ***p<0.001.
Figure 1—figure supplement 2
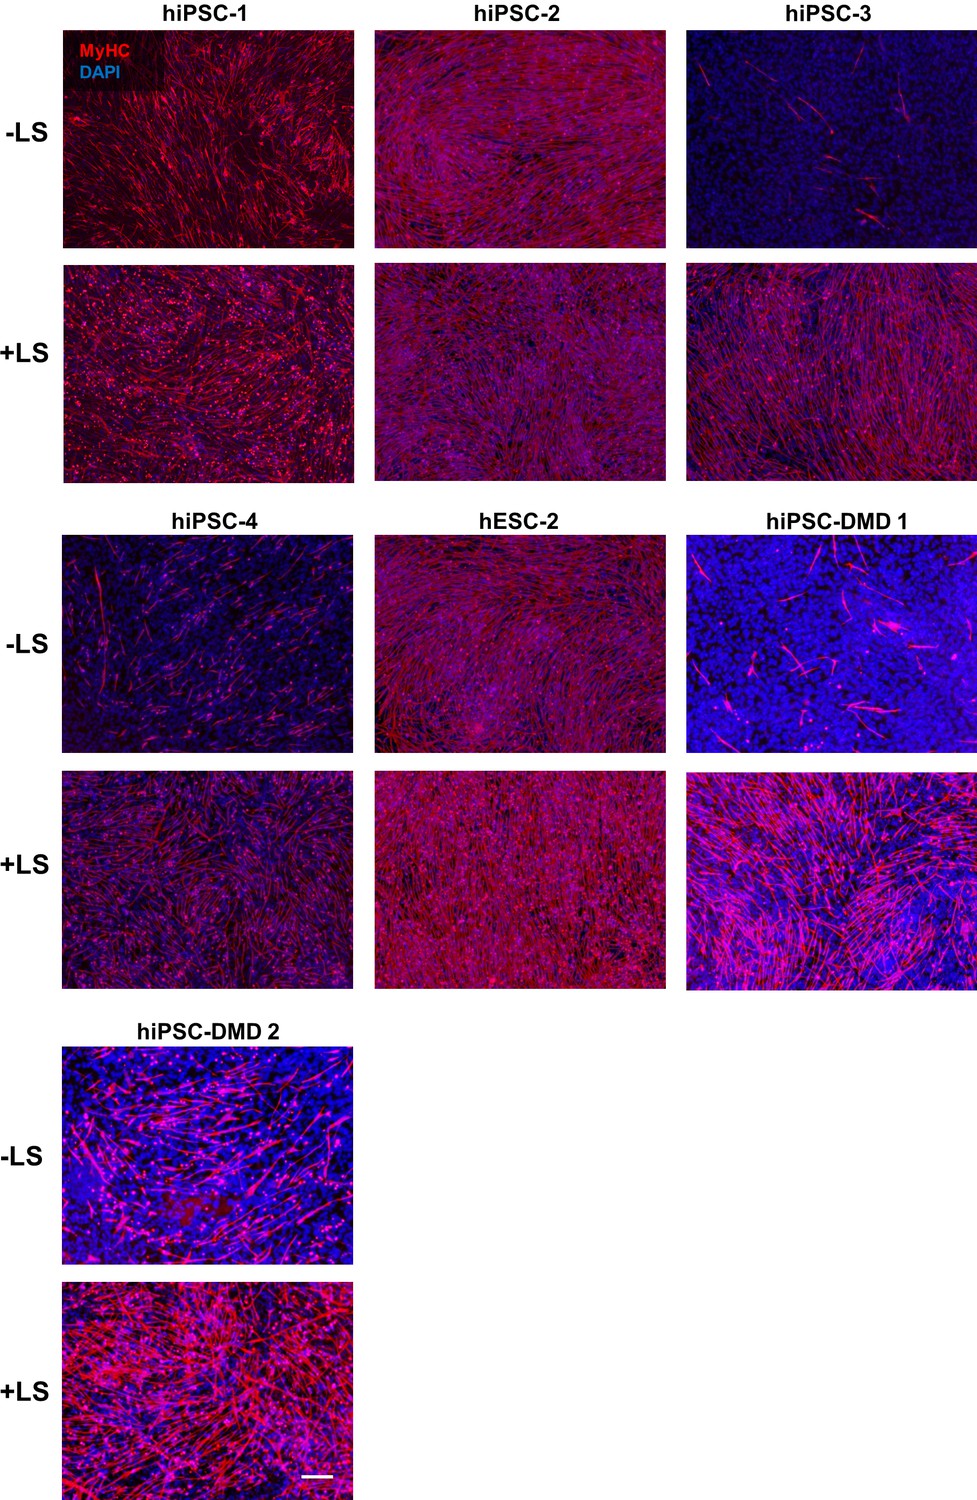
Induction of somite-like stage enhances iPAX7 PS cell-derived myogenic differentiation into myotubes.
Representative images show immunostaining for MyHC (in red) in myotubes derived from four iPS cell control (1, 2, 3 and 4), one ES cell control and two patient-specific (DMD one and DMD 2) iPS cell lines differentiated under the standard EB-iPAX7 protocol (-LS) or including LDN193189 and SB431542 treatment (+LS) for somite-like specification. DAPI stains nuclei (in blue). Scale bar is 200 μm.
Figure 1—figure supplement 3

Small molecule screening reveals compounds that enhance myogenic differentiation efficiency.
(A) Schematic representation of the small molecule screening procedure. Each well from a 96-well plate contained an individual compound from the Tocriscreen Stem cell toolbox added in the differentiation medium. (B) Representative images of MyHC (red) immunostaining in myotubes differentiated with selected candidates upon small molecule screening (A). DAPI stains blue. Scale bar is 100 μm. (C) Bar graph shows ratio of % MyHC-stained area to % DAPI area from hiPSC-1 myotubes differentiated with compounds candidates at 5, 10 or 20 μm relative to DMSO. Data are shown as mean of three independent replicates ± S.E.M. Statistical analyses showed no significant differences among concentrations for each compound. (D) Bar graphs show gene expression analysis of MYOG and MYH isoforms relative to GAPDH of hiPSC-1 myotubes differentiated with compound candidates. Data are shown as mean of three independent replicates ± S.E.M. *p<0.05 **p<0.01 ***p<0.001.
Figure 2 with 3 supplements
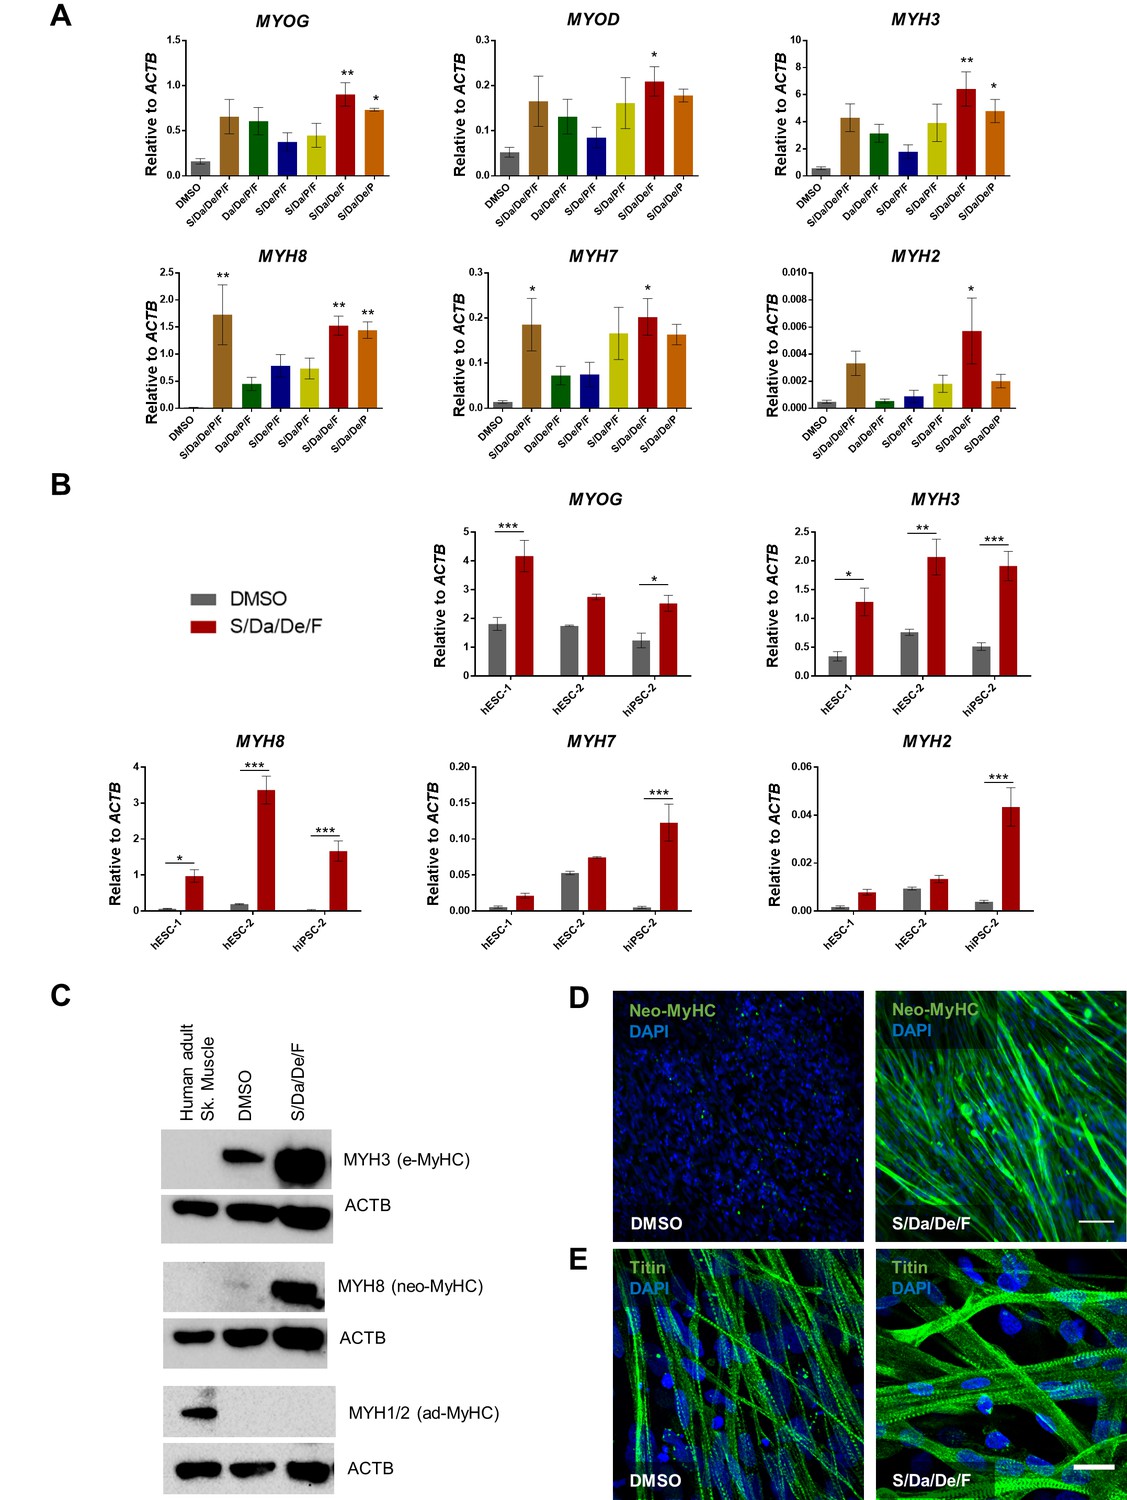
Combinatorial treatment with S/Da/De/F enhances the maturation of PS cell-derived myotubes.
(A) Bar graphs show the expression profile of MYOG, MYOD and MYH isoforms normalized to ACTB in hiPSC-1 myotubes differentiated with small molecule combinatorial treatment or DMSO. Data are shown as mean of three independent replicates ± S.E.M. *p<0.05 **p<0.01. (B) Bar graphs show expression levels of MYOG, and MYH isoforms normalized to ACTB in hESC-1, hESC-2 and hiPSC-1 myotubes differentiated with combinatory treatment or DMSO. Data are shown as mean of three independent replicates ± S.E.M. *p<0.05 **p<0.01. (C) Western blot shows protein expression for MYH3 (e-MyHC), MYH8 (neo-MyHC) and MYH1/2 (ad-MyHC) in hiPSC1 myotubes that had been subjected to treatment with S/Da/De/F or DMSO. Human adult skeletal muscle is shown as a reference. ACTB is used as loading control. (D, E) Representative images show immunostaining for neo-MyHC (in green) (D) and Titin (in green) (E) in hiPSC-1 myotubes differentiated in the presence of DMSO or S/Da/De/F. DAPI stains nuclei (blue). Scale bars are 100 μm (D) and 20 μm (E).
Figure 2—figure supplement 1
Combinatorial treatment promotes neo-MyHC protein expression.
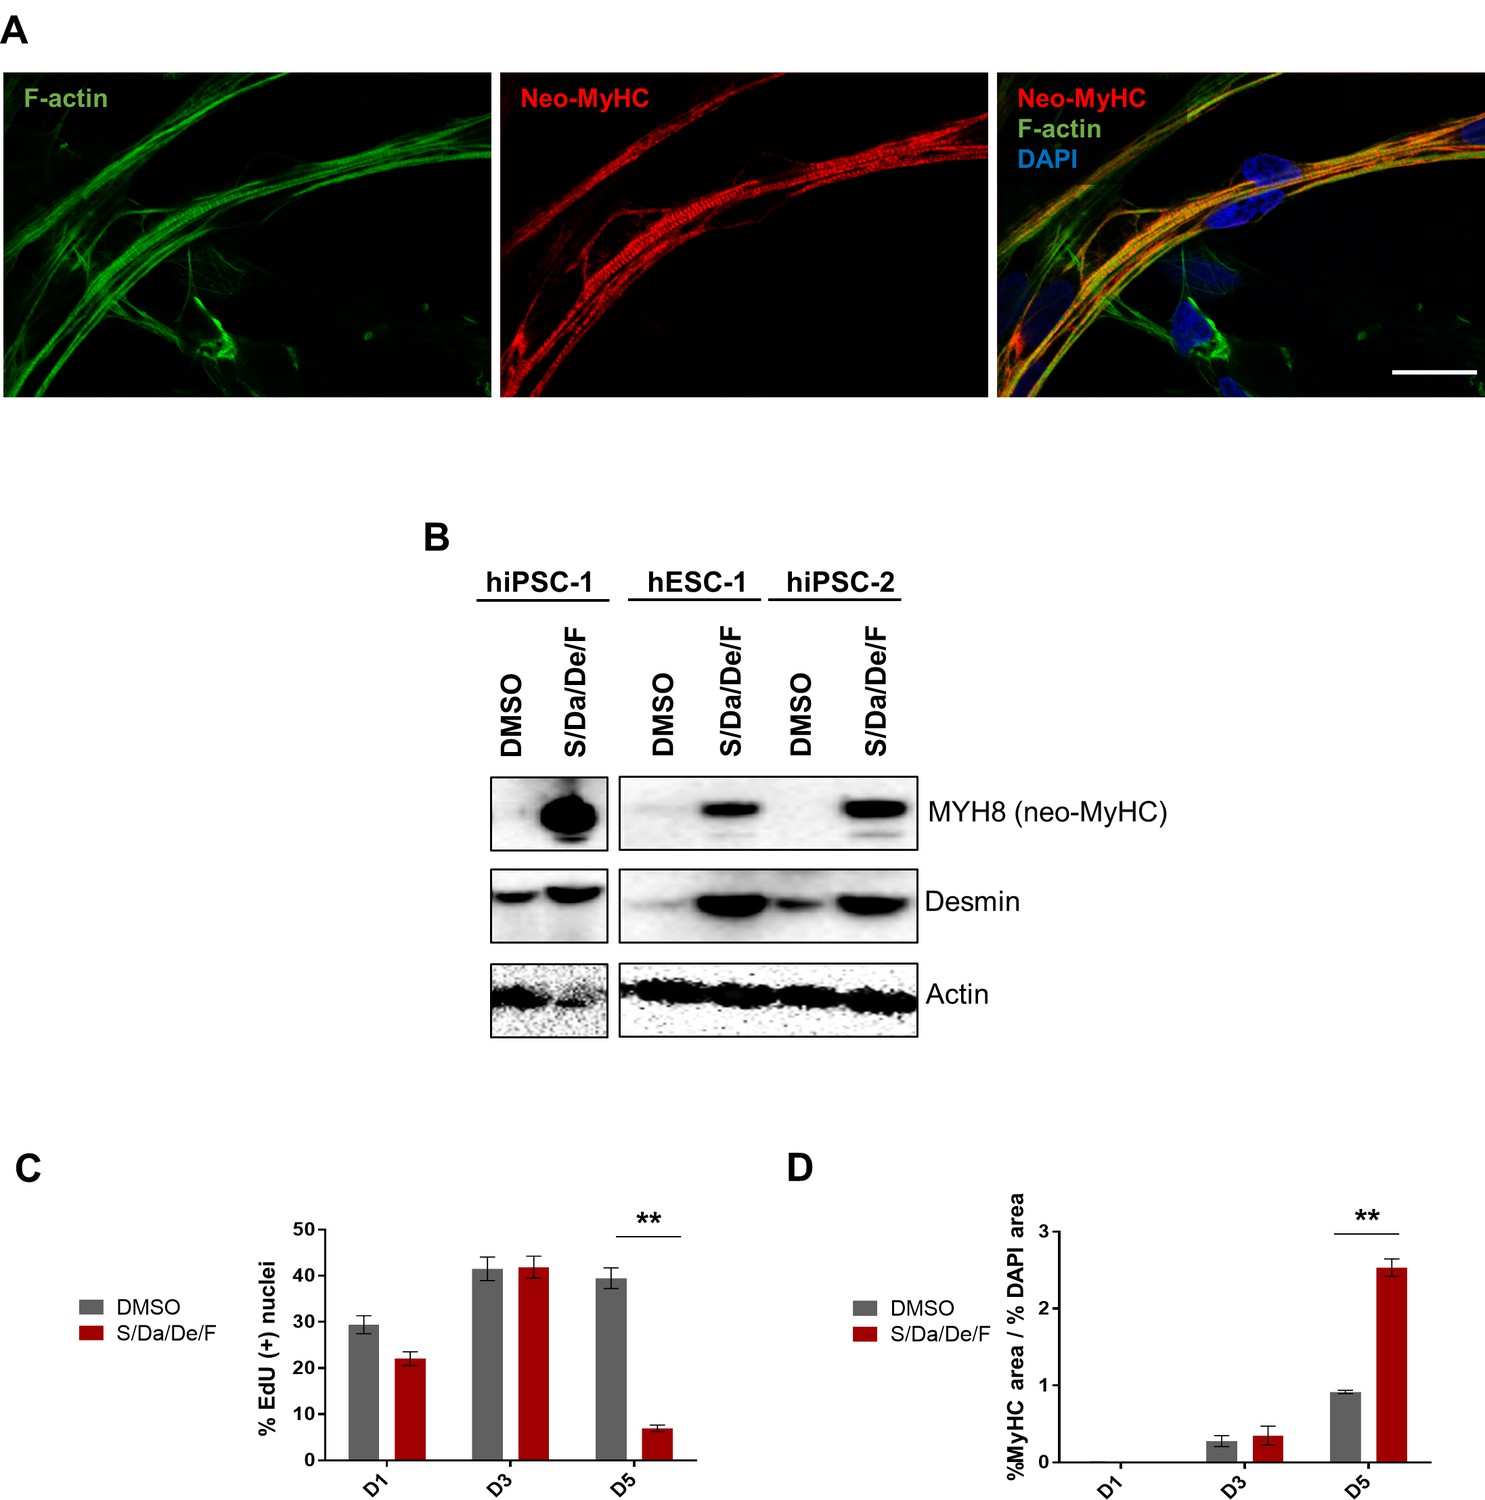
(A) Representative image of F-actin (green) and neo-MyHC (red) immunostaining analyzed by confocal microscopy in hiPSC-1 myotubes differentiated with combinatorial treatment. DAPI stains nuclei. Mid Z section is shown. Scale bar is 20 μm. (B) Protein expression analysis for neo-MyHC and Desmin by western blot of hiPSC-1, hiPSC2 and hESC-1 myotubes differentiated in the presence of combinatorial treatment (S/Da/De/F) or DMSO. Actin is used as loading control. (C and D) Bar graph shows percentage of EdU (+) nuclei (C) and ratio of % MyHC-stained area to % DAPI area (D) at days 1, 3 and 5 of hiPSC-1 myotube differentiation in the presence of combinatorial treatment or DMSO. **p<0.01.
Figure 2—figure supplement 2
Combinatorial treatment targets pathways associated with its individual components.
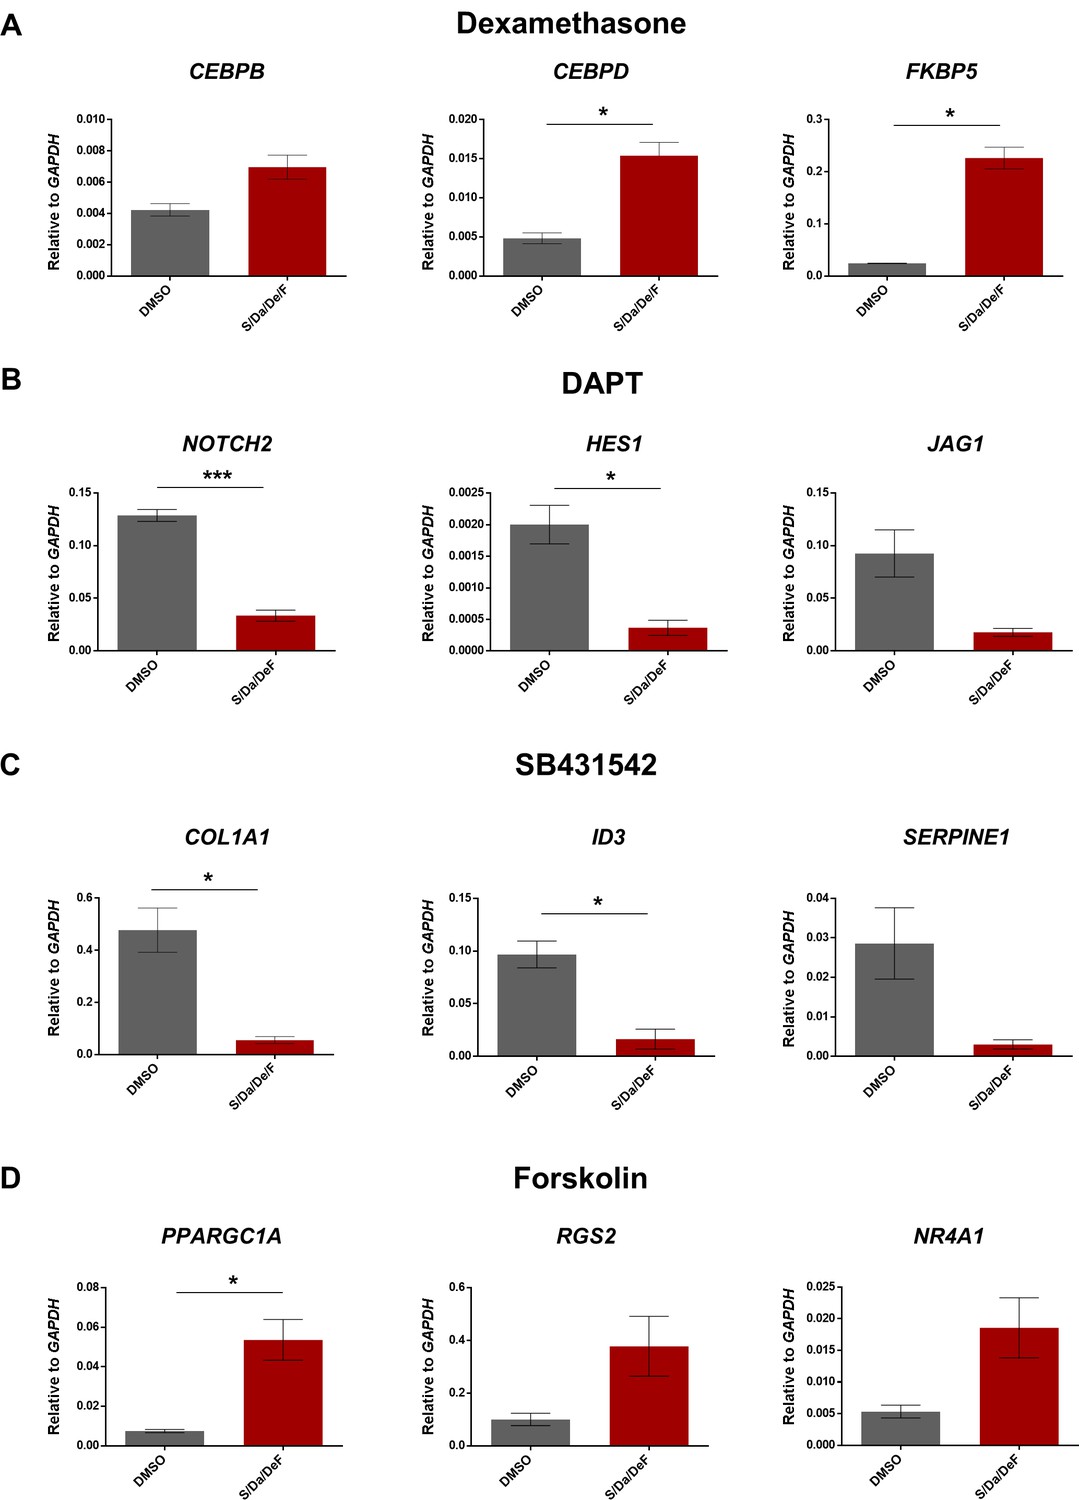
(A–D) Bar graphs show gene expression analysis, relative to GAPDH, of genes related with Dexamethasone (CEBPB, CEBPD and FKBO5, (A), DAPT (NOTCH2, HES1 and JAG1, (B), SB431542 (COL1A1, ID3 and SERPINE1, (C) and Forskolin (PPARGC1A, RGS2 and NR4A1, (D) targeted-pathways in hiPSC-1 myotubes differentiated in presence of combinatorial treatment or DMSO. Data are shown as mean of three independent replicates ± S.E.M. *p<0.05 ***p<0.001.
Figure 2—figure supplement 3
Combinatorial small molecule treatment enhances the maturation of hiPS cell-derived myotubes generated under transgene-free differentiation conditions.
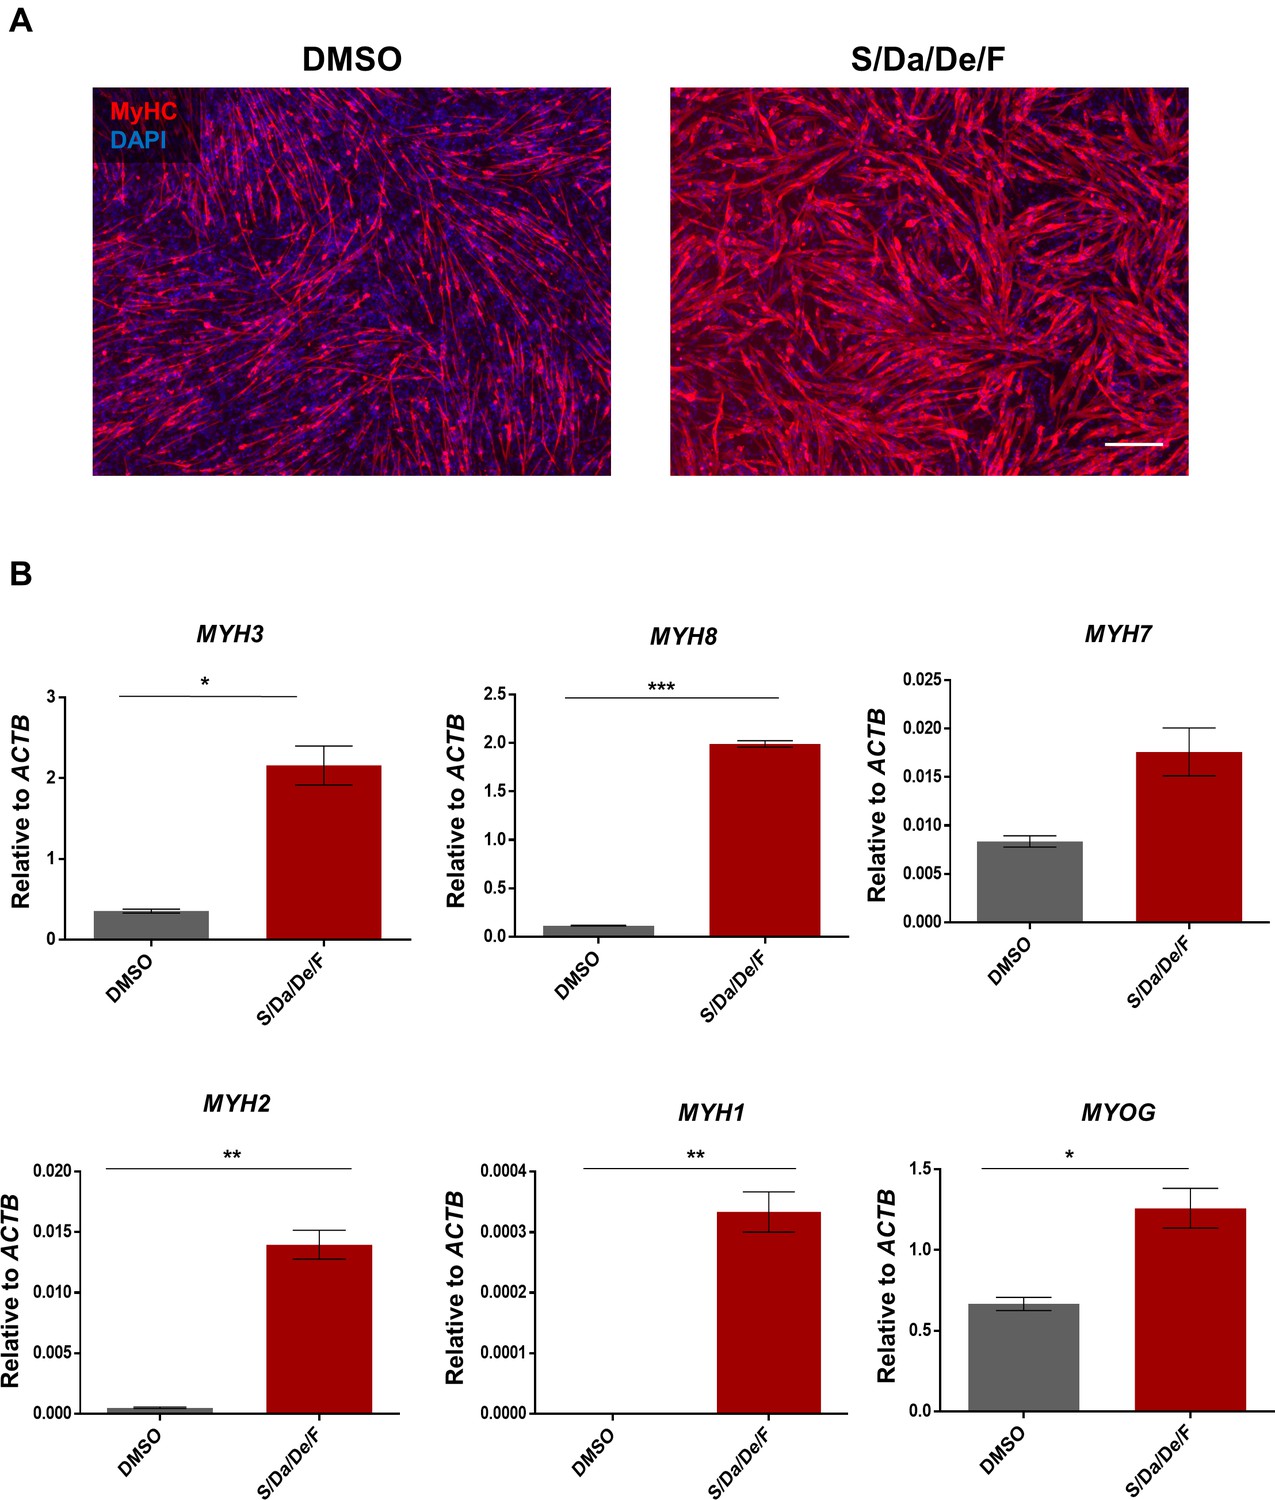
(A) Representative images of MyHC (in red) immunostaining of transgene-free hiPSC-1 myotubes differentiated in the presence of DMSO or S/Da/De/F. DAPI stains nuclei (blue). Scale bar is 200 μm. (B) Bar graphs show gene expression analysis of MYH isoforms and MYOG relative to ACTB of transgene-free hiPSC-1 myotubes differentiated in the presence of DMSO or S/Da/De/F. Data are shown as mean of three independent replicates ± S.E.M. *p<0.05 **p<0.01.
Figure 3 with 1 supplement
Combinatorial treatment with S/Da/De/F enhances the maturation of MD patient-specific hiPS cell-derived myotubes.
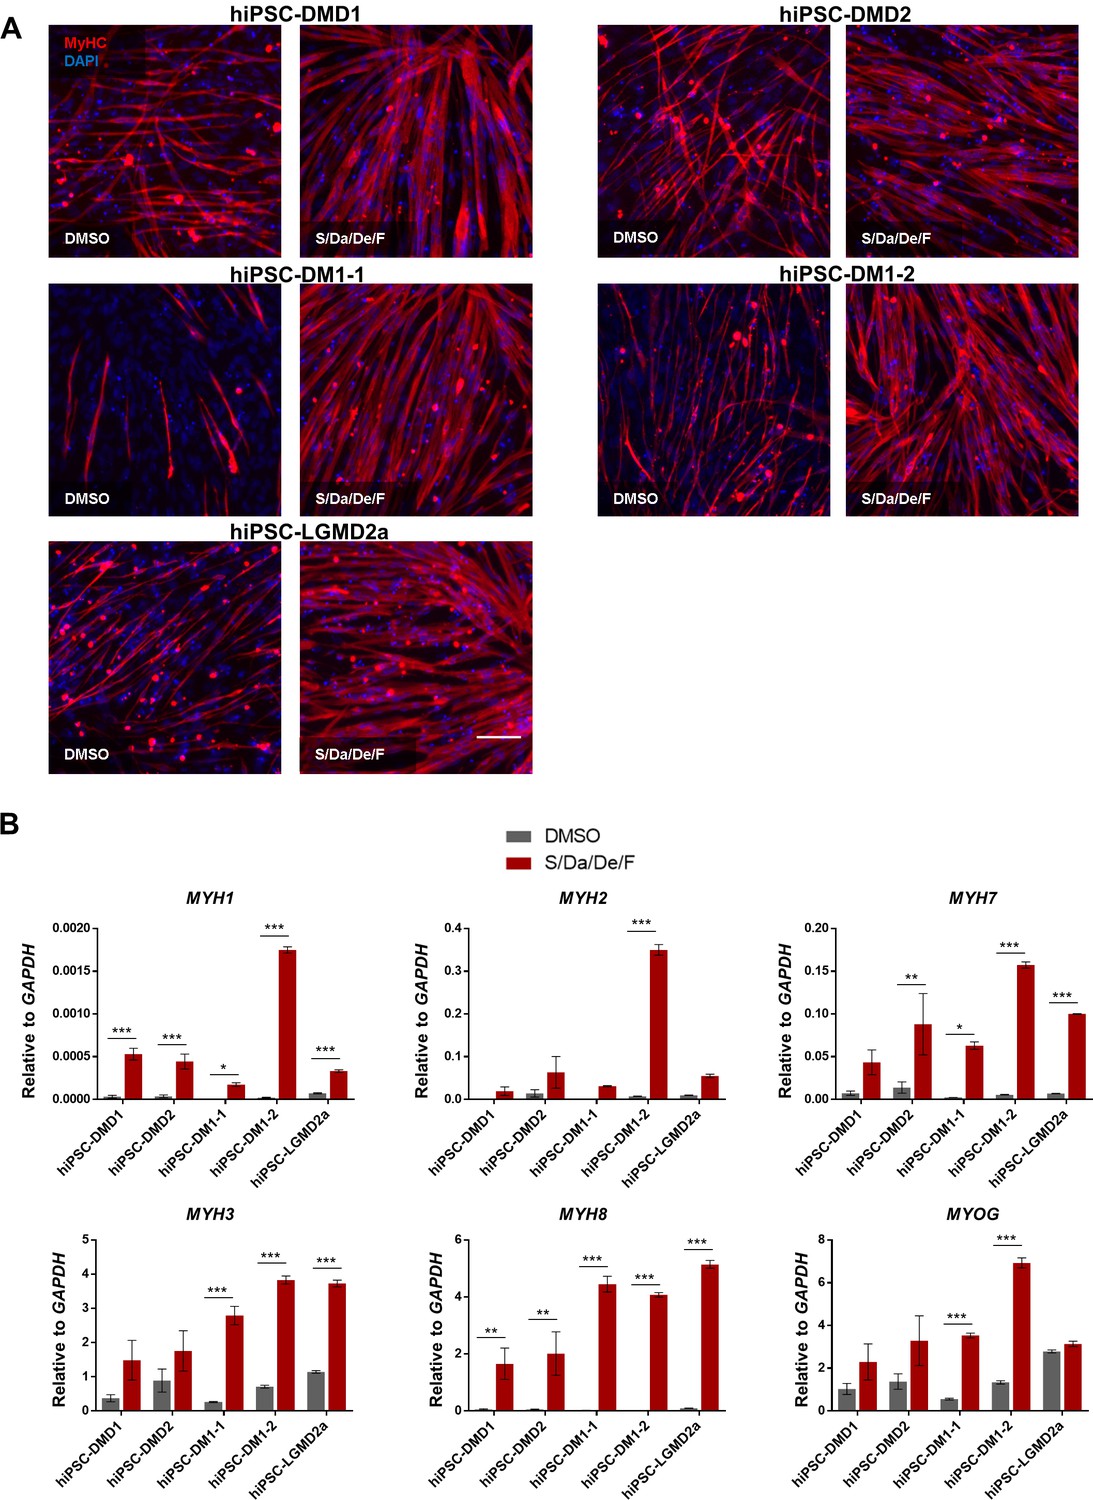
(A) Representative images show immunostaining for MyHC (in red) in hiPS cell-derived myotubes from two DMD (DMD1 and DMD2), two DM1 (DM1-1 and DM1-2) and one LGMD2A patients differentiated with small molecule combinatorial treatment or DMSO. DAPI stains nuclei (blue). Scale bar is 100 μm. (B) Bar graphs show the expression profile of MYH isoforms and MYOG isoforms normalized to GAPDH in hiPS cell-derived myotubes from two DMD (DMD one and DMD 2), two DM1 (DM1-1 and DM1-2) and one LGMD2A patients differentiated with small molecule combinatorial or DMSO treatments. Data are shown as mean of three independent replicates ± S.E.M. *p<0.05 **p<0.01 ***p<0.001.
Figure 3—figure supplement 1
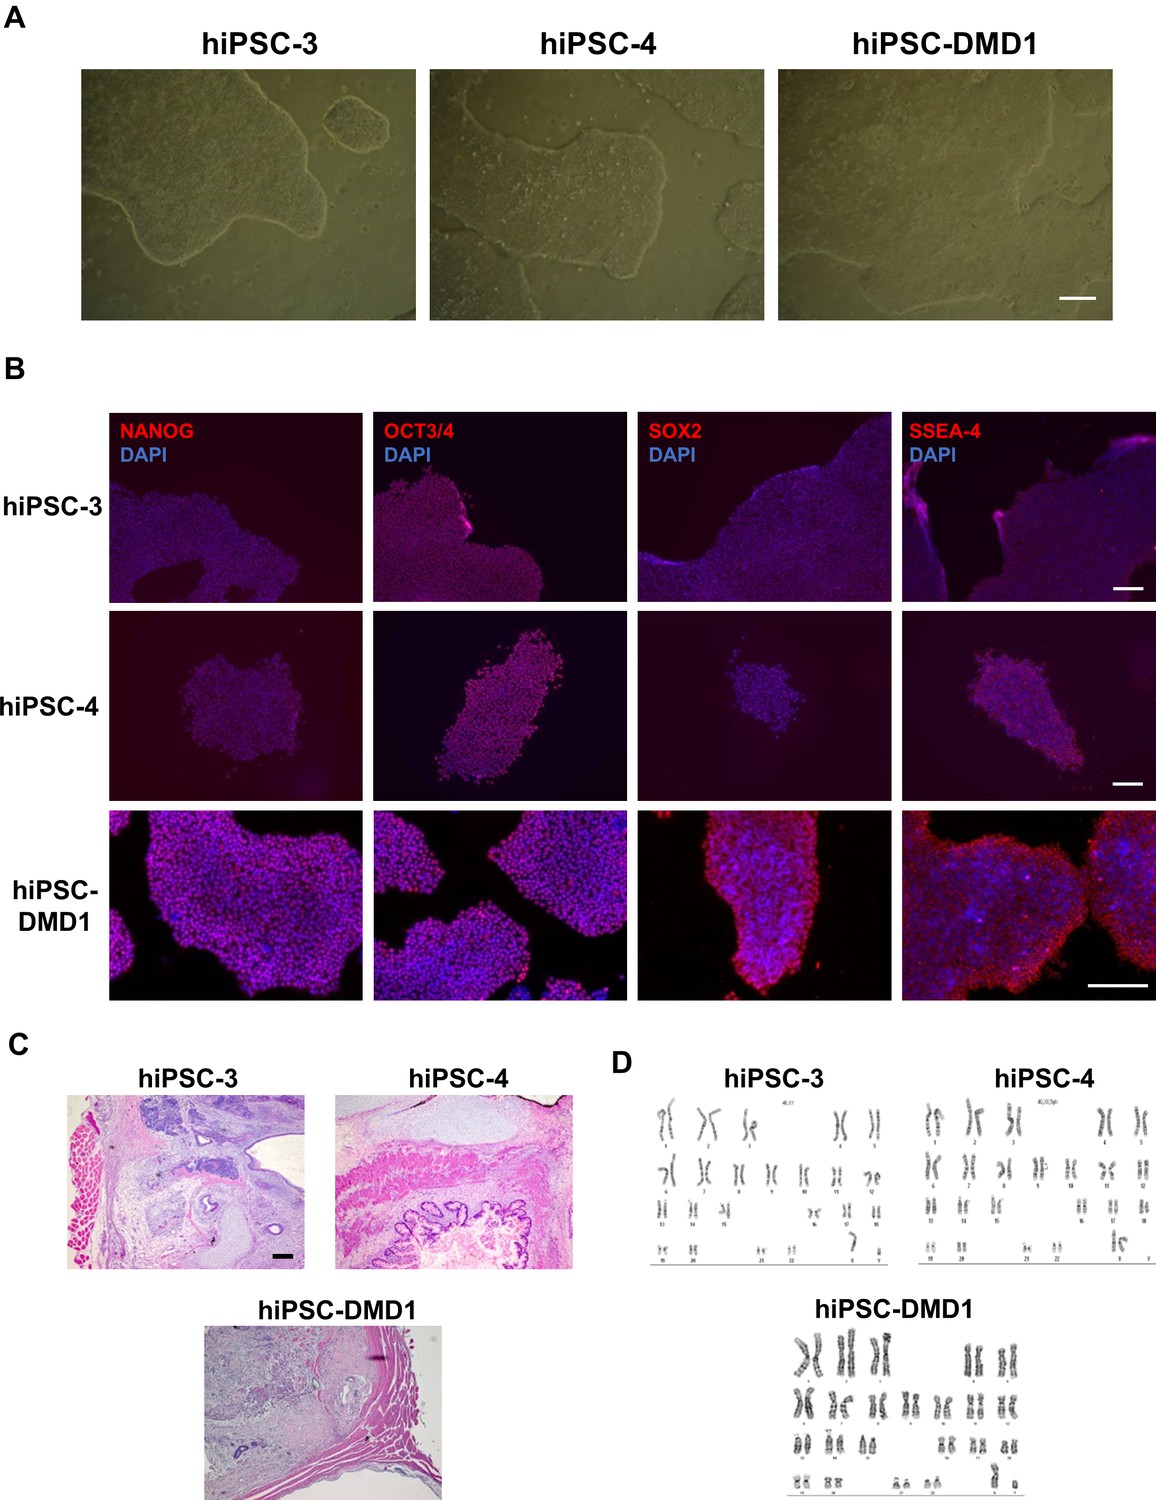
Characterization of hiPSC-3, hiPSC-4 and hiPSC-DMD1 reprogrammed cell lines.
(A) Representative images show typical pluripotent colony morphology for each reprogrammed iPS cell line. Scale bar is 200 μm. (B) Representative images show immunostaining of NANOG, OCT3/4, SOX2 and SSEA-4 (in red) in reprogrammed iPS cell lines. DAPI stains nuclei (in blue). Scale bar is 200 μm. (C) Images show H and E staining of teratomas generated by reprogrammed iPS cell lines. (D) Cytogenetic analyses show normal karyotypes of reprogrammed iPS cell lines.
Figure 4 with 1 supplement
Ultrastructural differences between S/Da/De/F- and DMSO-treated myotubes.
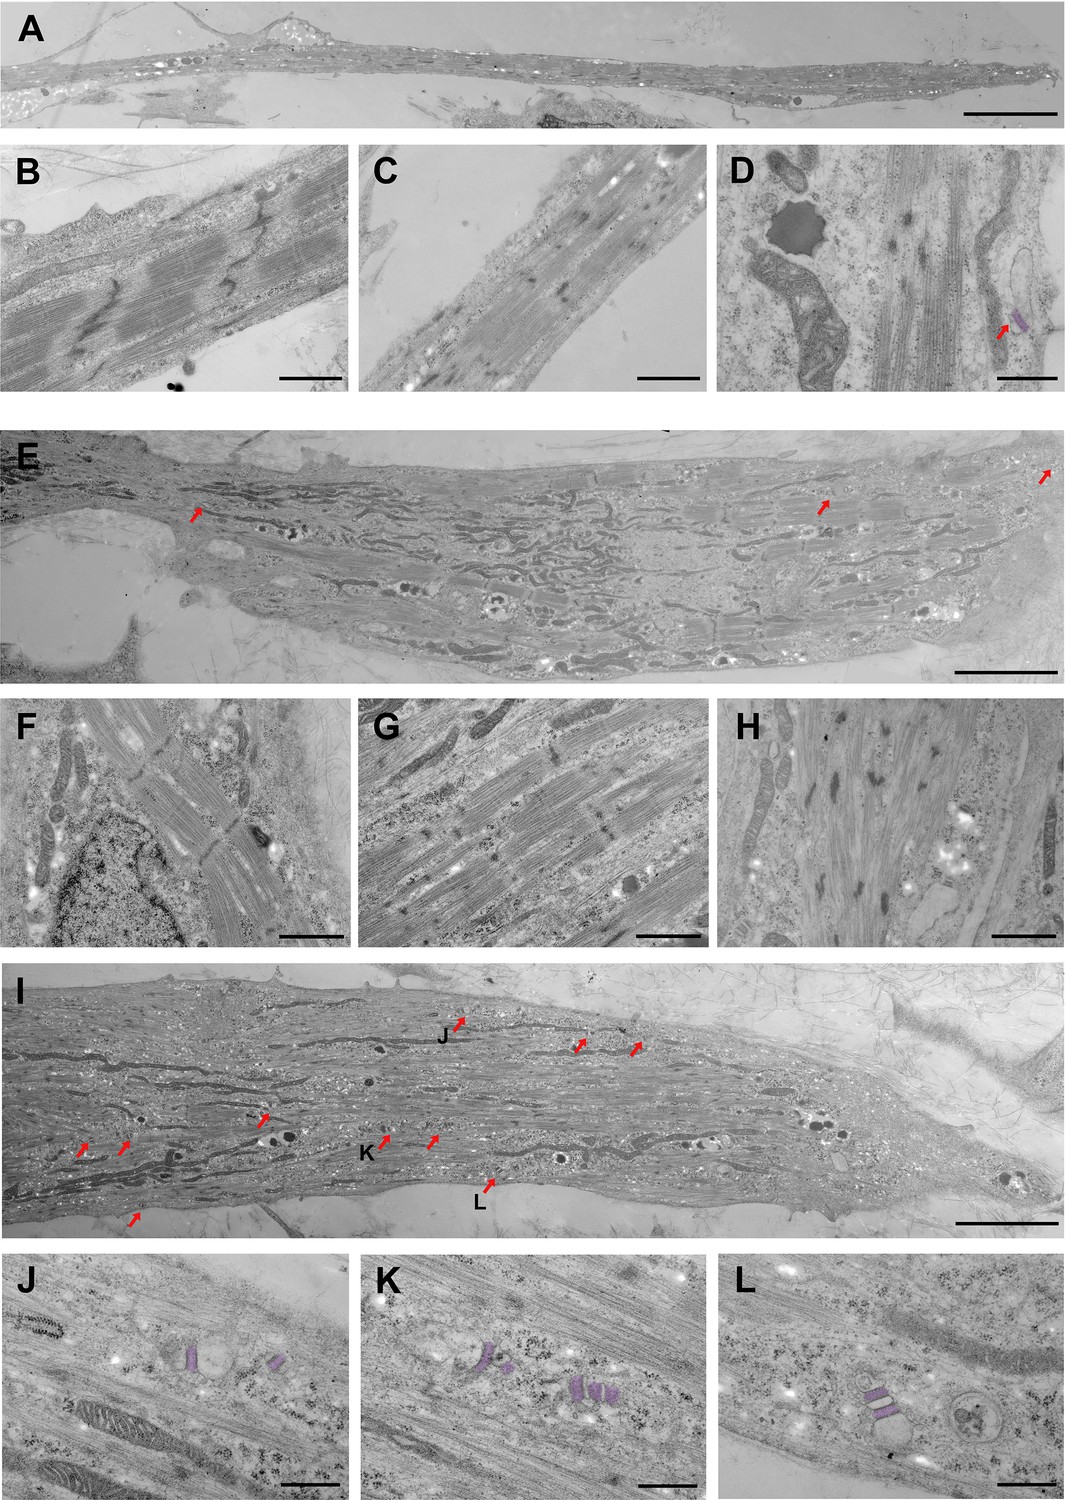
(A–D) DMSO-treated myotubes (control) are shown at different magnifications. (A) Low magnification shows a thin and elongated myotube. (B, C) Myofibrils from control myotubes display different degrees of sarcomeric organization. (B) Discernable A-I bands, M line, and winding Z-bands, (C) Incomplete banding pattern and Z-bodies. (D) High magnification shows one SR-TT junction at the periphery of the cell. The SR has been highlighted by artificial post-coloring. (E–H) S/Da/De/F treated myotubes are shown at different magnifications. (E) Large myotube with relatively well-organized myofibrils located at the periphery or in close proximity to large bundles of mitochondria; red arrows indicate SR-TT junctions. (F–H) Myotubes subjected to S/Da/De/F treatment also display myofibrils with various degrees of sarcomeric organization. (F) Well defined A-I pattern, well delineated Z bands and visible M lines. (G) Alternating A and I bands, but discontinuous Z-band. (H) Nascent sarcomere with undefined banding patterned and Z–bodies. (I) Large myotube with a great number of SR-TT junctions (red arrows). Notice the presence of numerous mitochondria. The junctions identified by J, K and L letters are enlarged below (J–L) Different examples of representative SR-TT junctions; the SR is highlighted by artificial post-coloring. Scale bars: 5 µm in A, E and I; 1 µm in B, C and F-H; 500 nm in D and J-L.
Figure 4—figure supplement 1
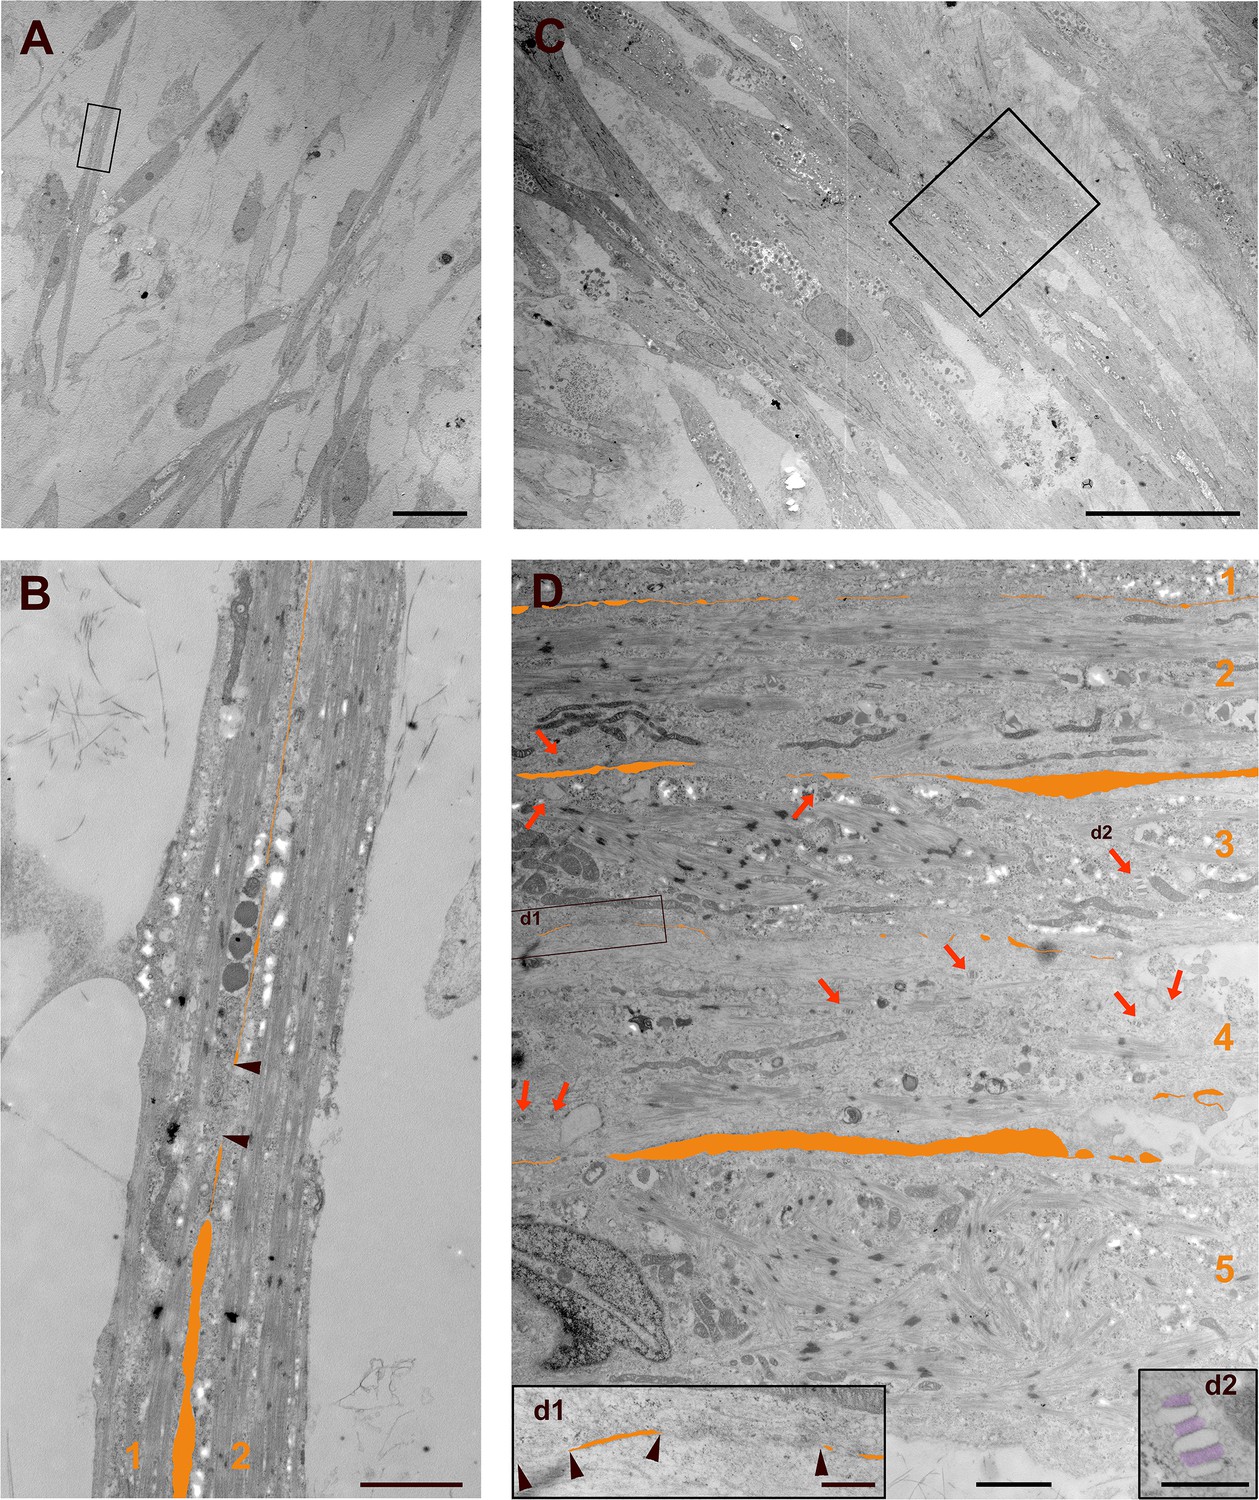
Transmission electron microscopy reveals an enhanced fusion process and numerous SR-TT junctions in S/Da/De/F-treated PS cell-derived myotubes.
(A, B) Myotubes treated with DMSO shown at low (A) and high (B) magnifications. (C, D) Myotubes treated with S/Da/De/F shown at low (C) and high (D) magnifications. These microphotographs reveal ongoing fusion processes between apposed plasma membranes of two untreated (B, numbered 1,2), and five treated myotubes (D, numbered 1–5). The fusion path is highlighted by artificial post-coloring (orange). Black arrow heads in B and d1 delimit regions of full cell fusion. Red arrows show SR-TT junctions, which are abundant in treated myotubes (D), and generally scarce in the control; they were undetectable in the present untreated myotube (B). Bars = 20 µm in A, C; 2 µm in B, D; 500 nm in d1, d2.
Figure 5 with 1 supplement
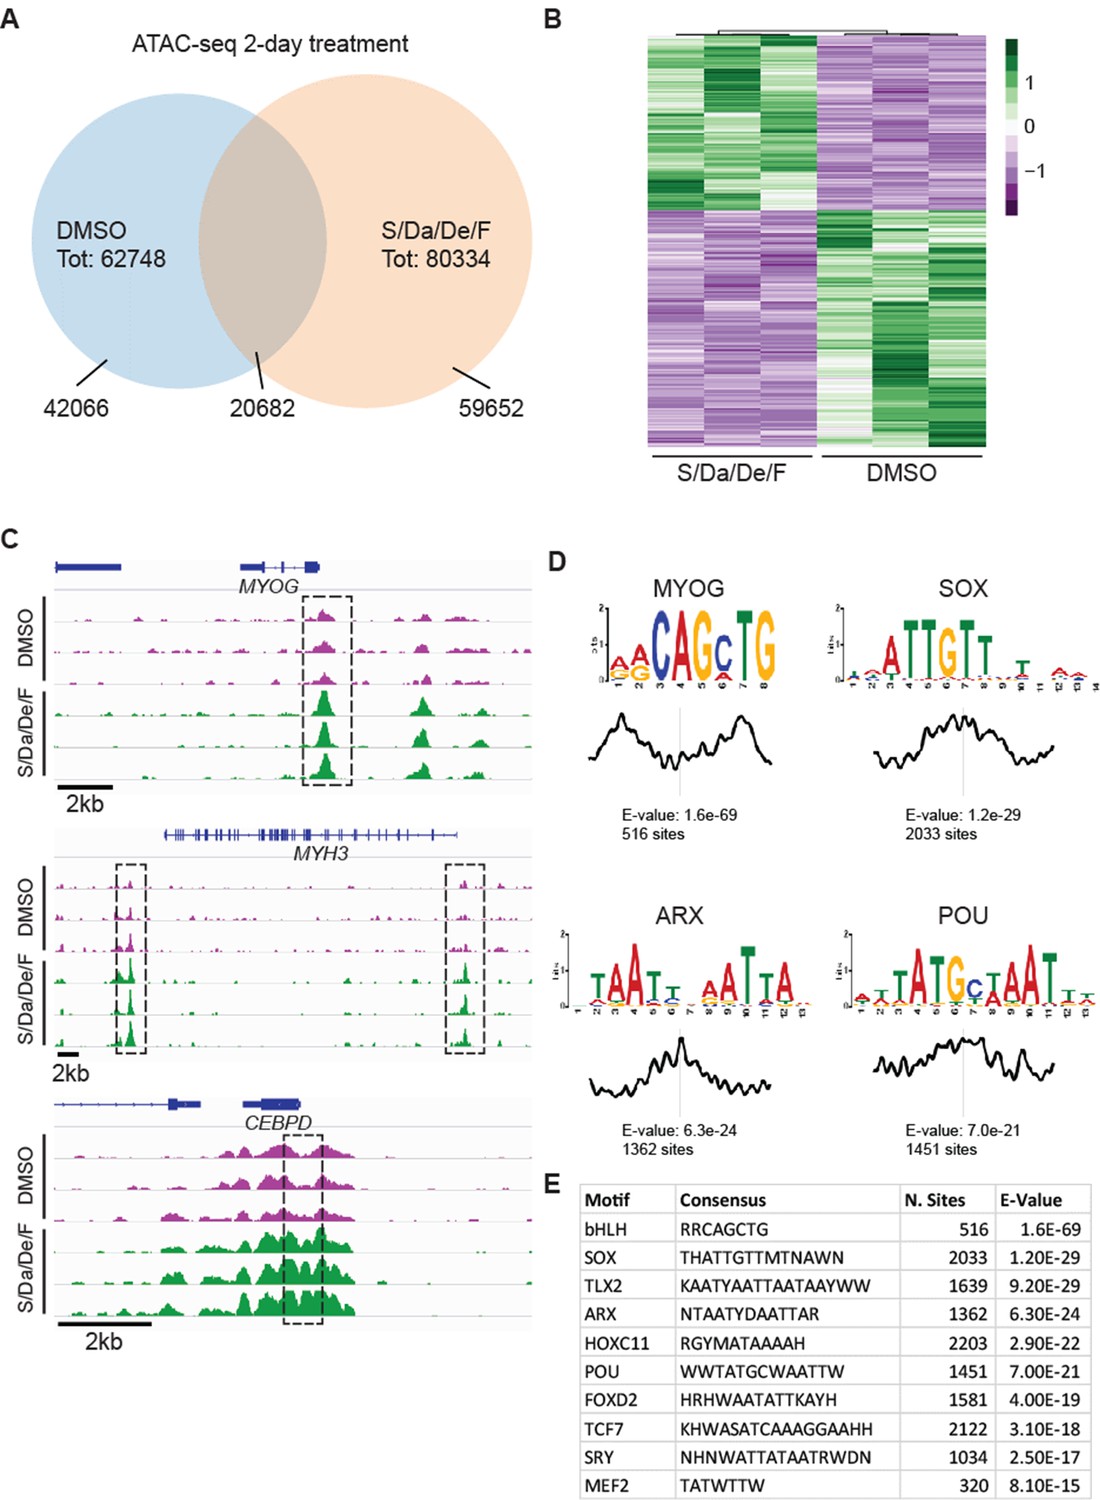
Combinatorial treatment increases chromatin accessibility at myogenic loci.
(A) Venn diagram displaying overlap between loci detected in 2-day S/Da/De/F- and DMSO-treated cells. (B) Heatmap shows changes in chromatin accessibility between DMSO- and S/Da/De/F-treated cells (three independent biological replicates). Loci were selected based on adjusted p-value<0.05 and log2FoldChange > 1. Loci overlapping to blacklist regions are included in this heatmap. (C) Chromatin accessibility at the genomic loci proximal to MYOG, MYH3 and CEBPD genes. Dashed black boxes indicate loci characterized by significant change in chromatin accessibility. Tracks represent snapshots from the IGV browser. (D) Selected enriched motifs identified at S/Da/De/F-specific peaks using MEME-ChIP. Plot below the sequence logo indicates distribution of the motifs across the regions used as input. (E) Table schematizing the results obtained by MEME-ChIP. Only selected motifs are displayed.
Figure 5—figure supplement 1

Analysis of chromatin accessible peaks upon combinatorial treatment.
(A) Principal component analysis of DMSO- and S/Da/De/F-treated samples using sequencing depth coverage calculated at a list of loci comprising all ATAC-seq peaks detected in this experiment. (B) Chromatin accessibility at the genomic loci proximal to HES1, ID3 and MIR206-MIR133B genes. Dashed black boxes indicate loci characterized by significant change in chromatin accessibility. Tracks represent snapshots from the IGV browser.
Figure 6 with 2 supplements

Combinatorial treatment induces expression of genes associated with structural maturation.
(A) Heatmap shows differentially expressed genes in hiPSC-1 myotubes upon combinatorial treatment compared to DMSO from three independent replicates. (B) Table shows muscle differentiation associated transcription factors and miRNAs that were upregulated in combinatorial treatment group when compared to DMSO group as revealed by IPA. (C–D) Bar graphs show the top physiological systems (C) and canonical pathways (D) associated with genes upregulated in combinatorial treatment group when compared to that of DMSO as revealed by IPA. (E–F) Bar graphs show the top biological processes (E) and cellular components (F) associated with genes upregulated upon combinatorial treatment based on gene ontology (GO) analysis. Data are plotted as –log (p-value) in C-F.
-
Figure 6—source data 1
IPA of upstream regulators of the differentially expressed genes upon combinatorial treatment confirm the pathways targeted by the small molecules.
- https://doi.org/10.7554/eLife.47970.020
-
Figure 6—source data 2
List shows the targets of transcription factors and miRNA that were found differentially expressed upon combinatorial treatment.
- https://doi.org/10.7554/eLife.47970.021
Figure 6—figure supplement 1
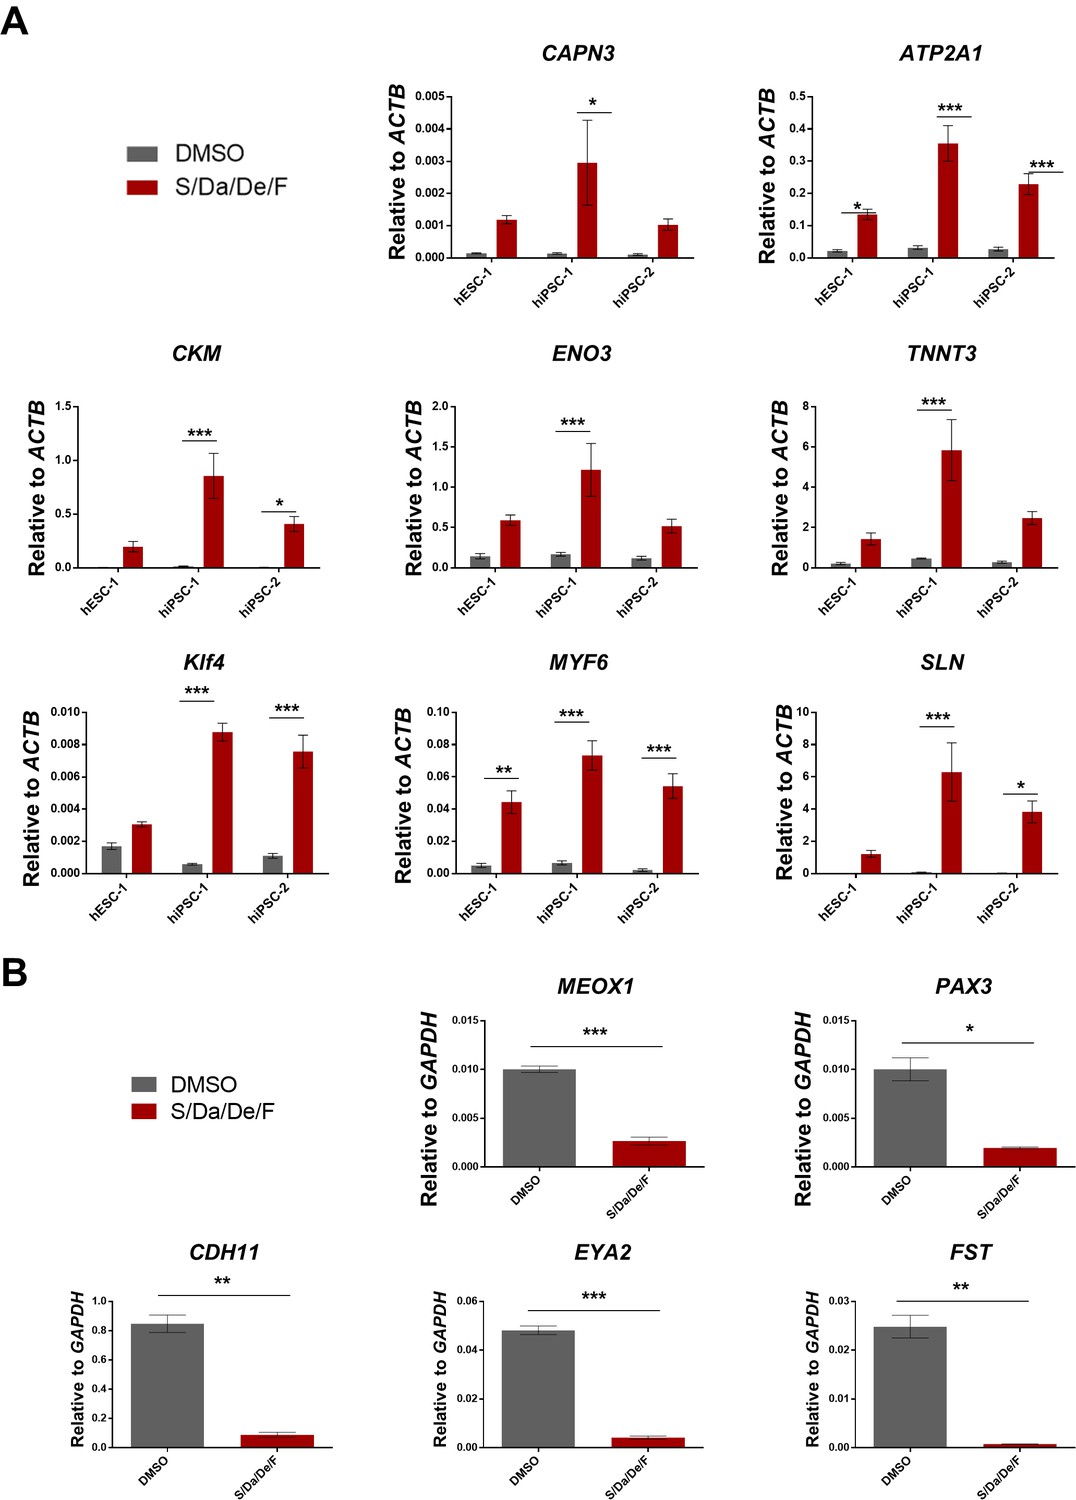
Validation of selected genes revealed by RNA-Sequencing upon combinatorial treatment of PS cell-derived myotubes.
(A) Bar graphs show quantitative analysis of gene expression of selected genes associated with skeletal muscle maturation in hESC-1, hiPSC-1 and hiPSC-2 myotubes, which were differentiated with combinatorial treatment or DMSO. Data are shown as mean of three independent replicates ± S.E.M. *p<0.05 **p<0.01 ***p<0.001. (B) Bar graphs show expression levels of genes associated with embryonic myogenic identity relative to GAPDH in hiPSC-1 myotubes, which were differentiated with combinatorial treatment or DMSO. Data are shown as mean of three independent replicates ± S.E.M. *p<0.05 **p<0.01 ***p<0.001.
Figure 6—figure supplement 2
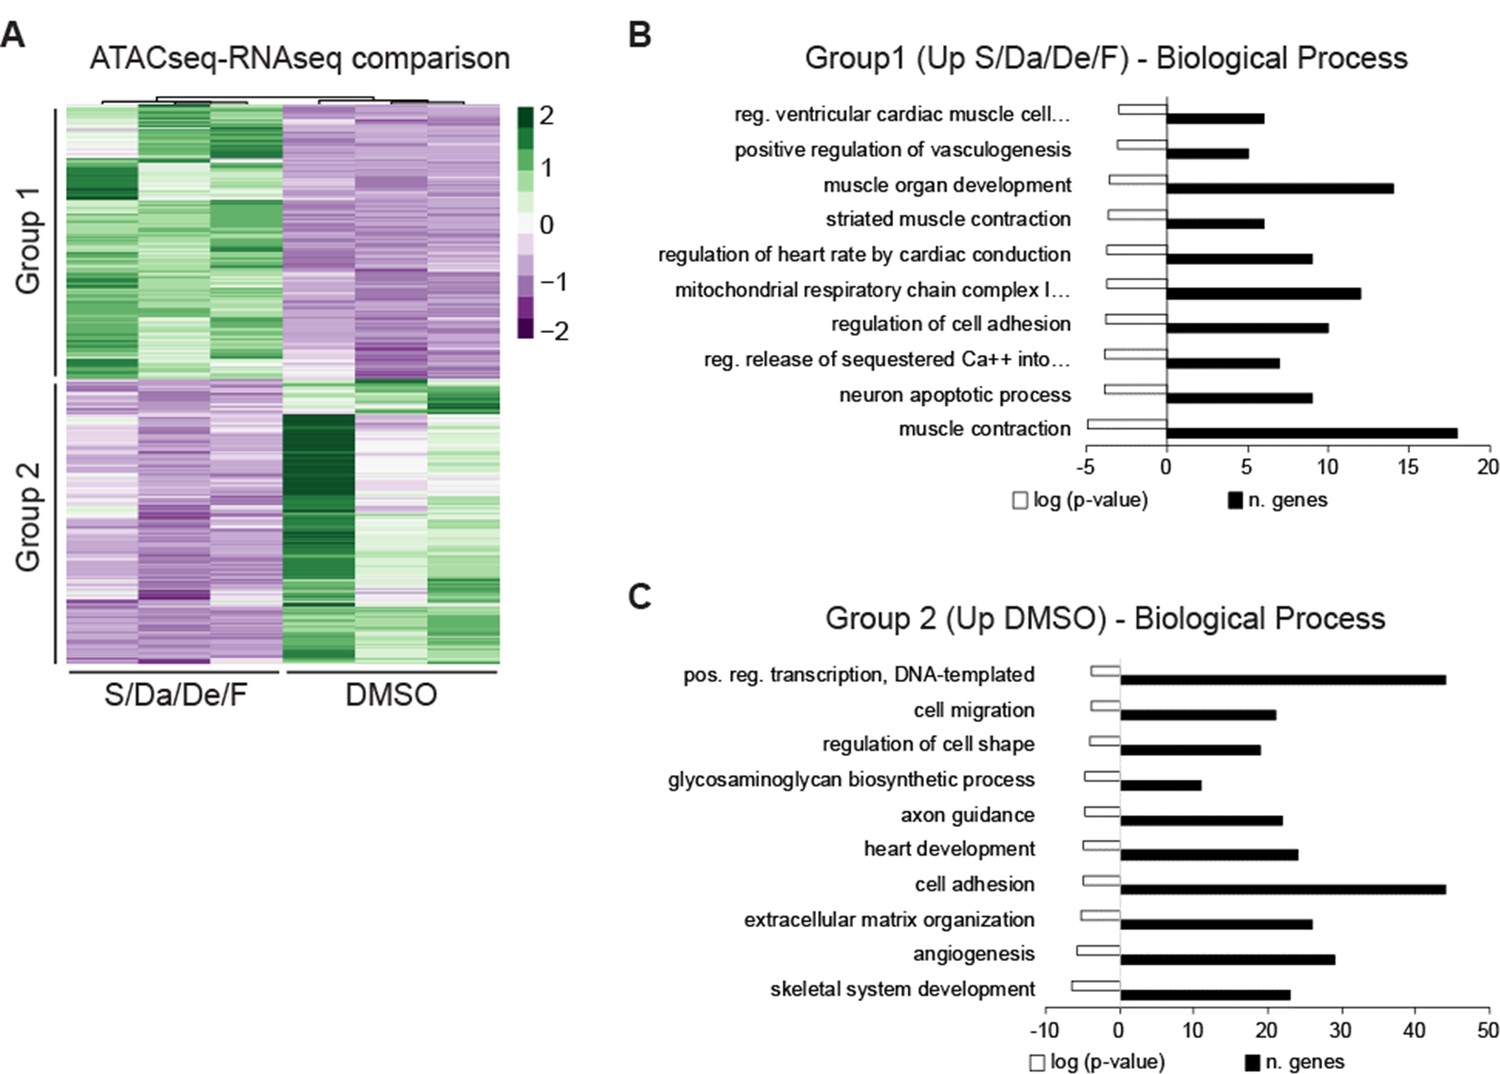
Transcriptomic analysis of genes annotated to loci with increased accessibility following S/Da/De/F treatment.
(A) Differential expression analysis of genes annotated to peaks with increased chromatin accessibility upon S/Da/De/F treatment. Genes were annotated using GREAT following a two gene association and 500 kb regulatory domain. (B–C) Gene ontology classification of S/Da/De/F-specific peaks using DAVID. Bar graphs show Biological Process categories for (B) upregulated and (C) downregulated genes from panel A.
Figure 7 with 1 supplement
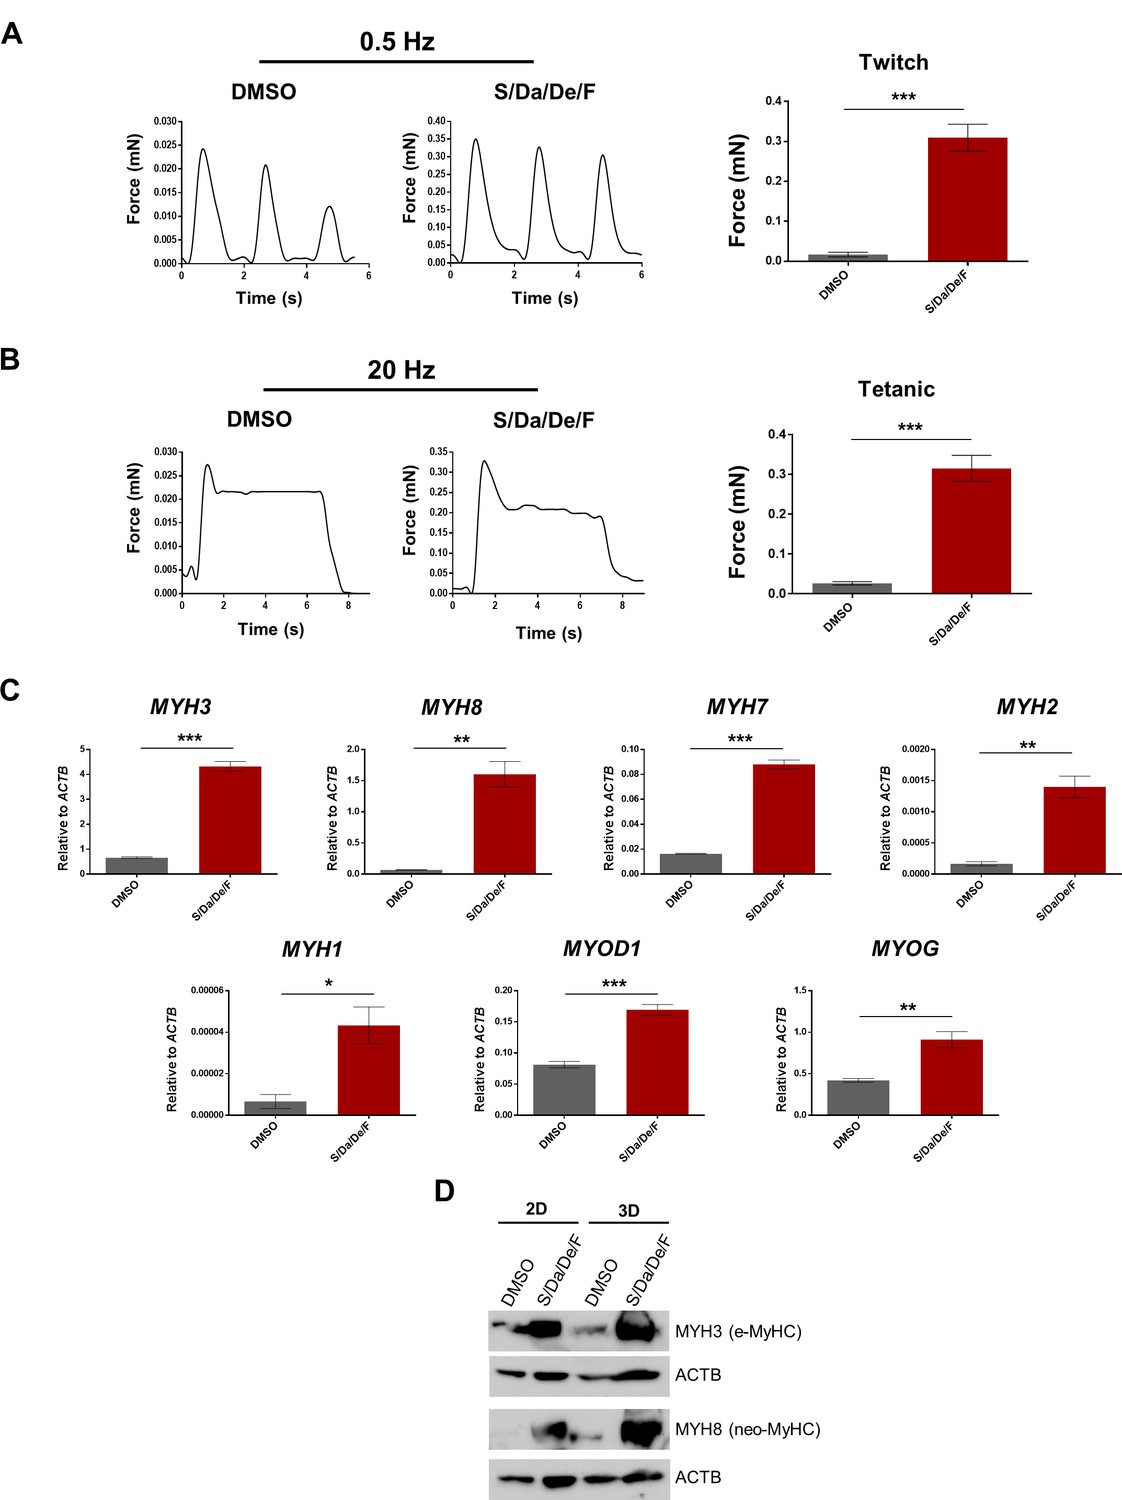
Increased contractile force generation in PS cell-derived 3D muscle constructs upon combinatorial treatment.
(A–B) Representative twitch (A) and tetanic (B) force patterns at 0.5 Hz and 20 Hz, respectively, generated by hiPSC-1 3D muscle constructs differentiated with combinatorial treatment or DMSO. Bar graphs show the twitch force (A) and tetanic force (B) as mean of three independent replicates ± S.E.M. ***p<0.001. Nine twitch peaks and three tetanic measurements from three independent muscle constructs were used for analysis. (C) Bar graphs show myogenic genes expression analysis relative to ACTB in 3D muscle constructs differentiated with combinatorial treatment or DMSO (from A and B). Data are shown as mean of three independent replicates ± S.E.M. *p<0.05 **p<0.01 ***p<0.001. (D) Protein expression analysis of MYH3 (e-MyHC) and MYH8 (neo-MyHC) by western blot of hiPSC-1 3D muscle constructs and 2D differentiated myotubes with combinatorial treatment or DMSO. Actin is shown as loading control.
Figure 7—figure supplement 1

Differentiation of PS cell-derived 3D muscle constructs in the presence of S/Da/De/F enhances the expression of adult MYH isoforms.
(A) Representative images of PS cell-derived 3D muscle constructs differentiated in the presence of S/Da/De/F or DMSO. Images were taken on the day of functional assessment. Scale bar is 1 cm. (B) Bar graphs show gene expression analysis of MYH isoforms and MYOG relative to ACTB in hiPSC-1 myotubes differentiated in 2D and 3D cultures. Data are shown as mean of three independent replicates ± S.E.M. *p<0.05 **p<0.01 ***p<0.001. (C) Representative images show immunostaining for neo-MyHC, pan-MyHC and α-actinin in longitudinal cryosections of 3D muscle constructs differentiated with S/Da/De/F or DMSO. DAPI stains nuclei. Scale bar is 100 μm.
Author response image 1
Tables
Key resources table
| Reagent type (species) or resource | Designation | Source or reference | Identifiers | Additional information |
|---|---|---|---|---|
| Cell line (Homo sapiens, Male) | hiPSC-1 | PMID: 22560081 | PLZ | Control line, available with the Rita Perlingeiro lab |
| Cell line (Homo sapiens, Male) | hiPSC-2 | PMID: 26411904 | TC-1133 | Control line, available with RUCDR Infinite Biologics |
| Cell line (Homo sapiens, Male) | hiPSC-3 | This study | MNP-120 | Control line, available with the Rita Perlingeiro lab |
| Cell line (Homo sapiens, Female) | hiPSC-4 | This study | MNP-119 | Control line, available with the Rita Perlingeiro lab |
| Cell line (Homo sapiens, Male) | hESC-1 | WiCell | H9 | ESC control line (WA09) |
| Cell line (Homo sapiens, Female) | hESC-2 | WiCell | H1 | ESC control line (WA01) |
| Cell line (Homo sapiens, Male) | hiPSC-DMD1 | This study | DMD1108 | DMDΔex31, available with the Rita Perlingeiro lab |
| Cell line (Homo sapiens, Male) | hiPSC-DMD2 | PMID: 28658631 | DMD1705 | DMDΔex52-54, available with the Rita Perlingeiro lab |
| Cell line (Homo sapiens, Male) | hiPSC-DM1-1 | PMID: 29898953 | DM1-1 | 2,000 CTG repeats in 3'UTR of DMPK gene, available with the Rita Perlingeiro lab |
| Cell line (Homo sapiens, Male) | hiPSC-DM1-2 | PMID: 29898953 | DM1-2 | 1,500 CTG repeats in 3'UTR of DMPK gene, available with the Rita Perlingeiro lab |
| Cell line (Homo sapiens, Female) | hiPSC-LGMD2A | PMID: 31501033 | 9015 | CAPN3Δex17-24, available with the Rita Perlingeiro lab |
| Chemical compound, drug | Tocriscreen Stem Cell Toolbox | Tocris | Cat# 5060 | 10 µM of each compound |
| Chemical compound, drug | CHIR99021 | Tocris | Cat# 4423 | 10 µM |
| Chemical compound, drug | LDN193189 | Cayman chemical | Cat# 19396 | 200 nM |
| Chemical compound, drug | SB431542 | Cayman chemical | Cat# 13031 | 10 µM |
| Chemical compound, drug | DAPT | Cayman chemical | Cat# 13197 | 10 µM |
| Chemical compound, drug | Dexamethasone | Cayman chemical | Cat# 11015 | 10 µM |
| Chemical compound, drug | Forskolin | Cayman chemical | Cat# 11018 | 10 µM |
| Chemical compound, drug | PD0325901 | Cayman chemical | Cat# 13034 | 10 µM |
| Chemical compound, drug | Doxycycline | Sigma Aldrich | Cat# D9891 | 1 µg/ml |
| Recombinant protein | Recombinant Human FGF-basic | Peprotech | Cat# 100-18B | 5 ng/ml |
| Recombinant protein | Recombinant Human HGF | Stem Cell Technologies | Cat# 78019 | 10 ng/ml |
| Recombinant protein | Recombinant Human IGF-1 | Stem Cell Technologies | Cat# 78022 | 2 ng/ml |
| Commercial assay or kit | iClick EdU Andy Fluor 555 Imaging Kit | GeneCopoeia | Cat# A004 | Cell proliferation assay |
| Antibody | MHC (all isoforms), mouse monoclonal | DSHB | Cat# MF20, RRID: AB_2147781 | Dilution-1:100 (IF) |
| Antibody | Desmin, mouse monoclonal | SCBT | Cat# sc-23879, RRID: AB_627416 | Dilution-1:500 (WB) |
| Antibody | ACTB, mouse monoclonal | SCBT | Cat# sc-4778, RRID: AB_626632 | Dilution- 1:1000 (WB) |
| Antibody | Titin, mouse monoclonal | DSHB | Cat# 9D10, RRID: AB_528491 | Dilution- 1:50 (IF) |
| Antibody | MyHC-neo, mouse monoclonal | DSHB | Cat# N3.36, RRID: AB_528380 | Dilution- 1:50 (IF), 1:200 (WB) |
| Antibody | MyHC-neo, mouse monoclonal | Leica | Cat# MHCN, RRID: AB_563900 | Dilution- 1:20 (IF), 1:200 (WB) |
| Antibody | MyHC-emb, mouse monoclonal | DSHB | Cat# F1.652, RRID: AB_528358 | Dilution- 1:200 (WB) |
| Antibody | MYH1/2, mouse monoclonal | DSHB | Cat# SC-71, RRID: AB_2147165 | Dilution- 1:200 (WB) |
| Antibody | α-actinin, mouse monoclonal | Thermofisher | Cat# MA122863, RRID: AB_557426 | Dilution- 1:25 (IF) |
| Antibody | OCT3/4, mouse monoclonal | SCBT | Cat# C-10, RRID: AB_628051 | Dilution- 1:50 (IF) |
| Antibody | SOX2, goat polyclonal | SCBT | Cat# Y-17, RRID: AB_2286684 | Dilution- 1:50 (IF) |
| Antibody | NANOG, mouse monoclonal | SCBT | Cat# H-2, RRID: AB_10918255 | Dilution- 1:50 (IF) |
| Antibody | SSEA4, mouse monoclonal | SCBT | Cat# sc-21704, RRID: AB_628289 | Dilution- 1:50 (IF) |
| Antibody | Anti-mouse IgG HRP-linked (sheep polyclonal) | GE Healthcare | Cat# NA931, RRID: AB_772210 | Dilution- 1:20000 (WB) |
| Antibody | Alexa fluor 555 goat anti-mouse IgG (goat polyclonal) | Thermofisher | Cat# A-21424, RRID: AB_141780 | Dilution- 1:500 (IF) |
| Other | Alexa Fluor 488 Phalloidin, F-actin probe | Thermofisher | Cat# A12379 | Dilution- 1:40 (IF) |
| Sequence-based reagent | MYH1 | Thermofisher | Assay ID: Hs00428600_m1 | Taqman probe for RT-qPCR |
| Sequence-based reagent | MYH2 | Thermofisher | Assay ID: Hs00430042_m1 | Taqman probe for RT-qPCR |
| Sequence-based reagent | MYH3 | Thermofisher | Assay ID: Hs01074230_m1 | Taqman probe for RT-qPCR |
| Sequence-based reagent | MYH7 | Thermofisher | Assay ID: Hs01110632_m1 | Taqman probe for RT-qPCR |
| Sequence-based reagent | MYH8 | Thermofisher | Assay ID: Hs00267293_m1 | Taqman probe for RT-qPCR |
| Sequence-based reagent | MYOD1 | Thermofisher | Assay ID: Hs02330075_g1 | Taqman probe for RT-qPCR |
| Sequence-based reagent | MYOG | Thermofisher | Assay ID: Hs01072232_m1 | Taqman probe for RT-qPCR |
| Sequence-based reagent | ACTB | Thermofisher | Assay ID: Hs99999903_m1 | Taqman probe for RT-qPCR |
| Sequence-based reagent | GAPDH | Thermofisher | Assay ID: Hs99999905_m1 | Taqman probe for RT-qPCR |
| Sequence-based reagent | SLN | Thermofisher | Assay ID: Hs00161903_m1 | Taqman probe for RT-qPCR |
| Sequence-based reagent | CAPN3 | Thermofisher | Assay ID: Hs01115989_m1 | Taqman probe for RT-qPCR |
| Sequence-based reagent | ATP2A1 | Thermofisher | Assay ID: Hs01115989_m1 | Taqman probe for RT-qPCR |
| Sequence-based reagent | ENO3 | Thermofisher | Assay ID: Hs01093275_m1 | Taqman probe for RT-qPCR |
| Sequence-based reagent | MYF6 | Thermofisher | Assay ID: Hs00231165_m1 | Taqman probe for RT-qPCR |
| Sequence-based reagent | CKM | Thermofisher | Assay ID: Hs00176490_m1 | Taqman probe for RT-qPCR |
| Sequence-based reagent | KLF4 | Thermofisher | Assay ID: Hs01034973_g1 | Taqman probe for RT-qPCR |
| Sequence-based reagent | TNNT3 | Thermofisher | Assay ID: Hs00952980_m1 | Taqman probe for RT-qPCR |
| Sequence-based reagent | CDH11 | Thermofisher | Assay ID: Hs00901479_m1 | Taqman probe for RT-qPCR |
| Sequence-based reagent | EYA2 | Thermofisher | Assay ID: Hs00193347_m1 | Taqman probe for RT-qPCR |
| Sequence-based reagent | FST | Thermofisher | Assay ID: Hs01121165_g1 | Taqman probe for RT-qPCR |
| Sequence-based reagent | CEBPB | Thermofisher | Assay ID: Hs00270923_s1 | Taqman probe for RT-qPCR |
| Sequence-based reagent | CEBPD | Thermofisher | Assay ID: Hs00270931_s1 | Taqman probe for RT-qPCR |
| Sequence-based reagent | FKBP5 | Thermofisher | Assay ID: Hs01561006_m1 | Taqman probe for RT-qPCR |
| Sequence-based reagent | NOTCH2 | Thermofisher | Assay ID: Hs01050702_m1 | Taqman probe for RT-qPCR |
| Sequence-based reagent | HES1 | Thermofisher | Assay ID: Hs00172878_m1 | Taqman probe for RT-qPCR |
| Sequence-based reagent | JAG1 | Thermofisher | Assay ID: Hs01070032_m1 | Taqman probe for RT-qPCR |
| Sequence-based reagent | COL1A1 | Thermofisher | Assay ID: Hs00164004_m1 | Taqman probe for RT-qPCR |
| Sequence-based reagent | ID3 | Thermofisher | Assay ID: Hs00954037_g1 | Taqman probe for RT-qPCR |
| Sequence-based reagent | SERPINE1 | Thermofisher | Assay ID: Hs00167155_m1 | Taqman probe for RT-qPCR |
| Sequence-based reagent | PPARGC1A | Thermofisher | Assay ID: Hs00173304_m1 | Taqman probe for RT-qPCR |
| Sequence-based reagent | RGS2 | Thermofisher | Assay ID: Hs01009070_g1 | Taqman probe for RT-qPCR |
| Sequence-based reagent | NR4A1 | Thermofisher | Assay ID: Hs00374226_m1 | Taqman probe for RT-qPCR |
Additional files
-
Transparent reporting form
- https://doi.org/10.7554/eLife.47970.024
Download links
A two-part list of links to download the article, or parts of the article, in various formats.
Downloads (link to download the article as PDF)
Open citations (links to open the citations from this article in various online reference manager services)
Cite this article (links to download the citations from this article in formats compatible with various reference manager tools)
Screening identifies small molecules that enhance the maturation of human pluripotent stem cell-derived myotubes
eLife 8:e47970.
https://doi.org/10.7554/eLife.47970


