A regulatory microRNA network controls endothelial cell phenotypic switch during sprouting angiogenesis
- University of Turin, Italy
- Candiolo Cancer Institute FPO-IRCCS, Italy
- Piemonte Orientale University, Italy
- Center for Translational Research on Autoimmune and Allergic Diseases - CAAD, Italy
Figures
Figure 1 with 2 supplements
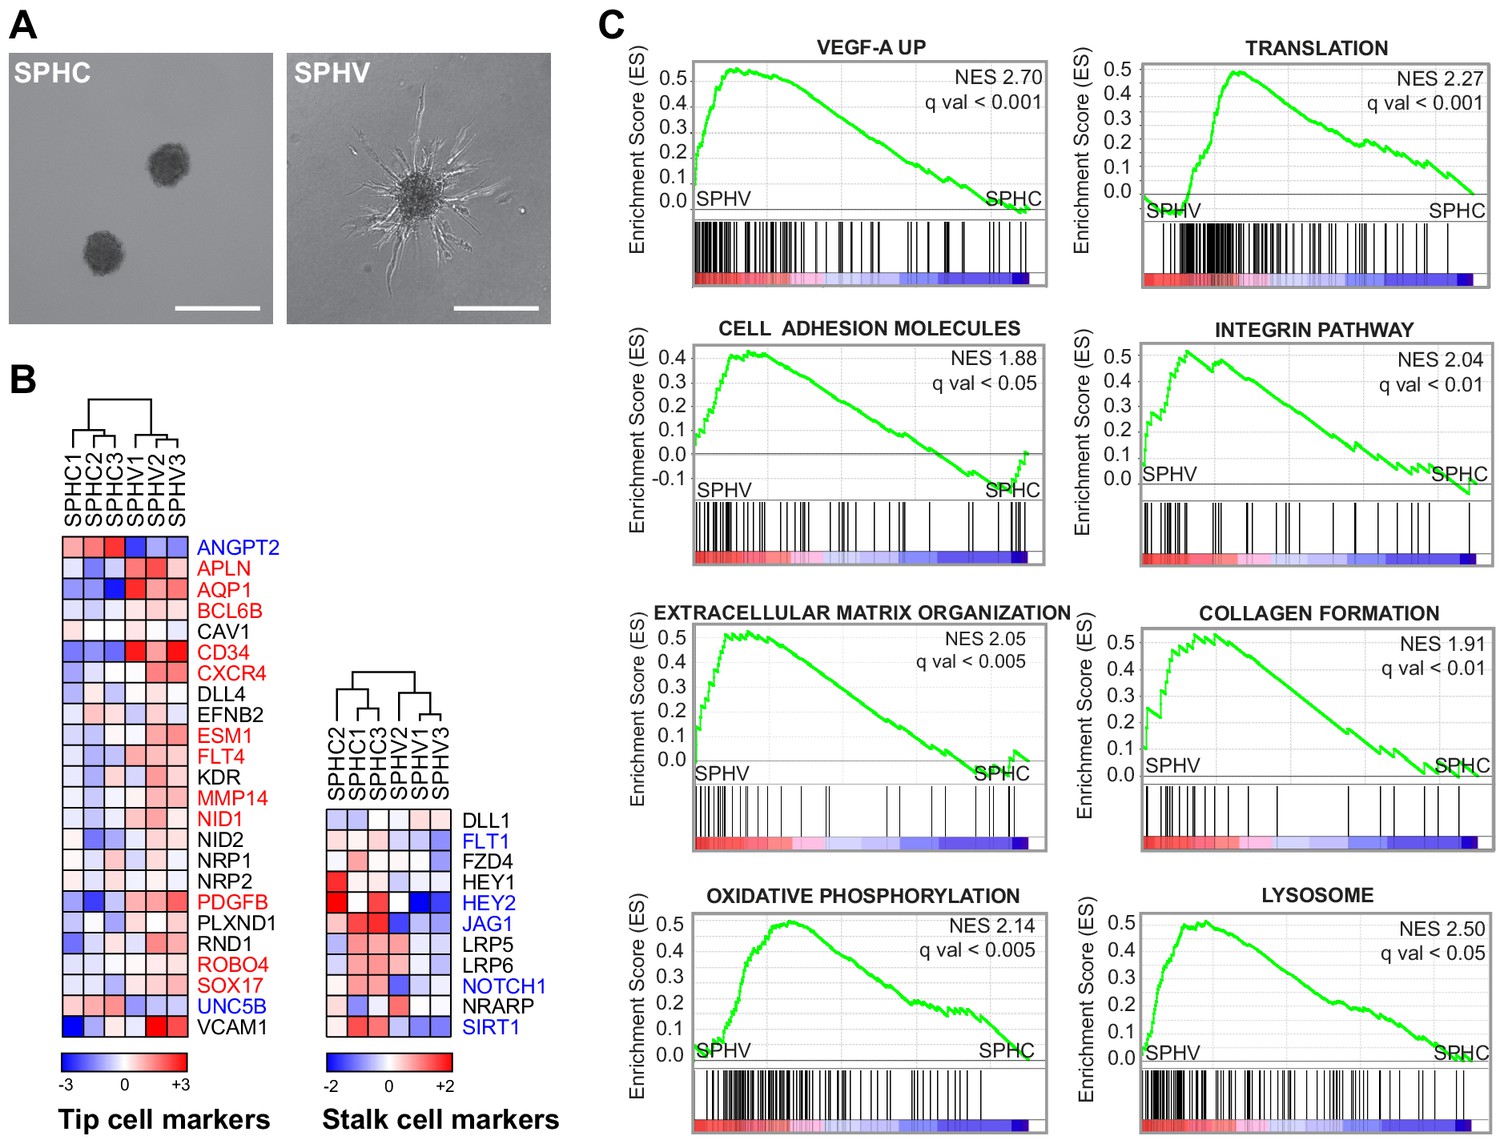
VEGF-A induces the tip phenotype of endothelial cells in a 3D model of sprouting angiogenesis.
(A) EC spheroids were embedded in a collagen matrix and stimulated with VEGF-A to induce endothelial cell sprouting. RNA-sequencing analysis was performed on control spheroids (SPHC) not stimulated with VEGF-A, and on spheroids after 18 hr from stimulus (SPHV). Scale bars, 200 µm. (B) Heatmaps showing the expression of tip and stalk cell markers in SPHC and SPHV. Color bars indicate log2(fold change) (log2FC) in the comparison SPCV versus SPHC. (C) Positively enriched gene sets identified by the GSEA study in the genesets collection for canonical pathways. False discovery rate (FDR) was accepted when q value <0.05.
Figure 1—figure supplement 1
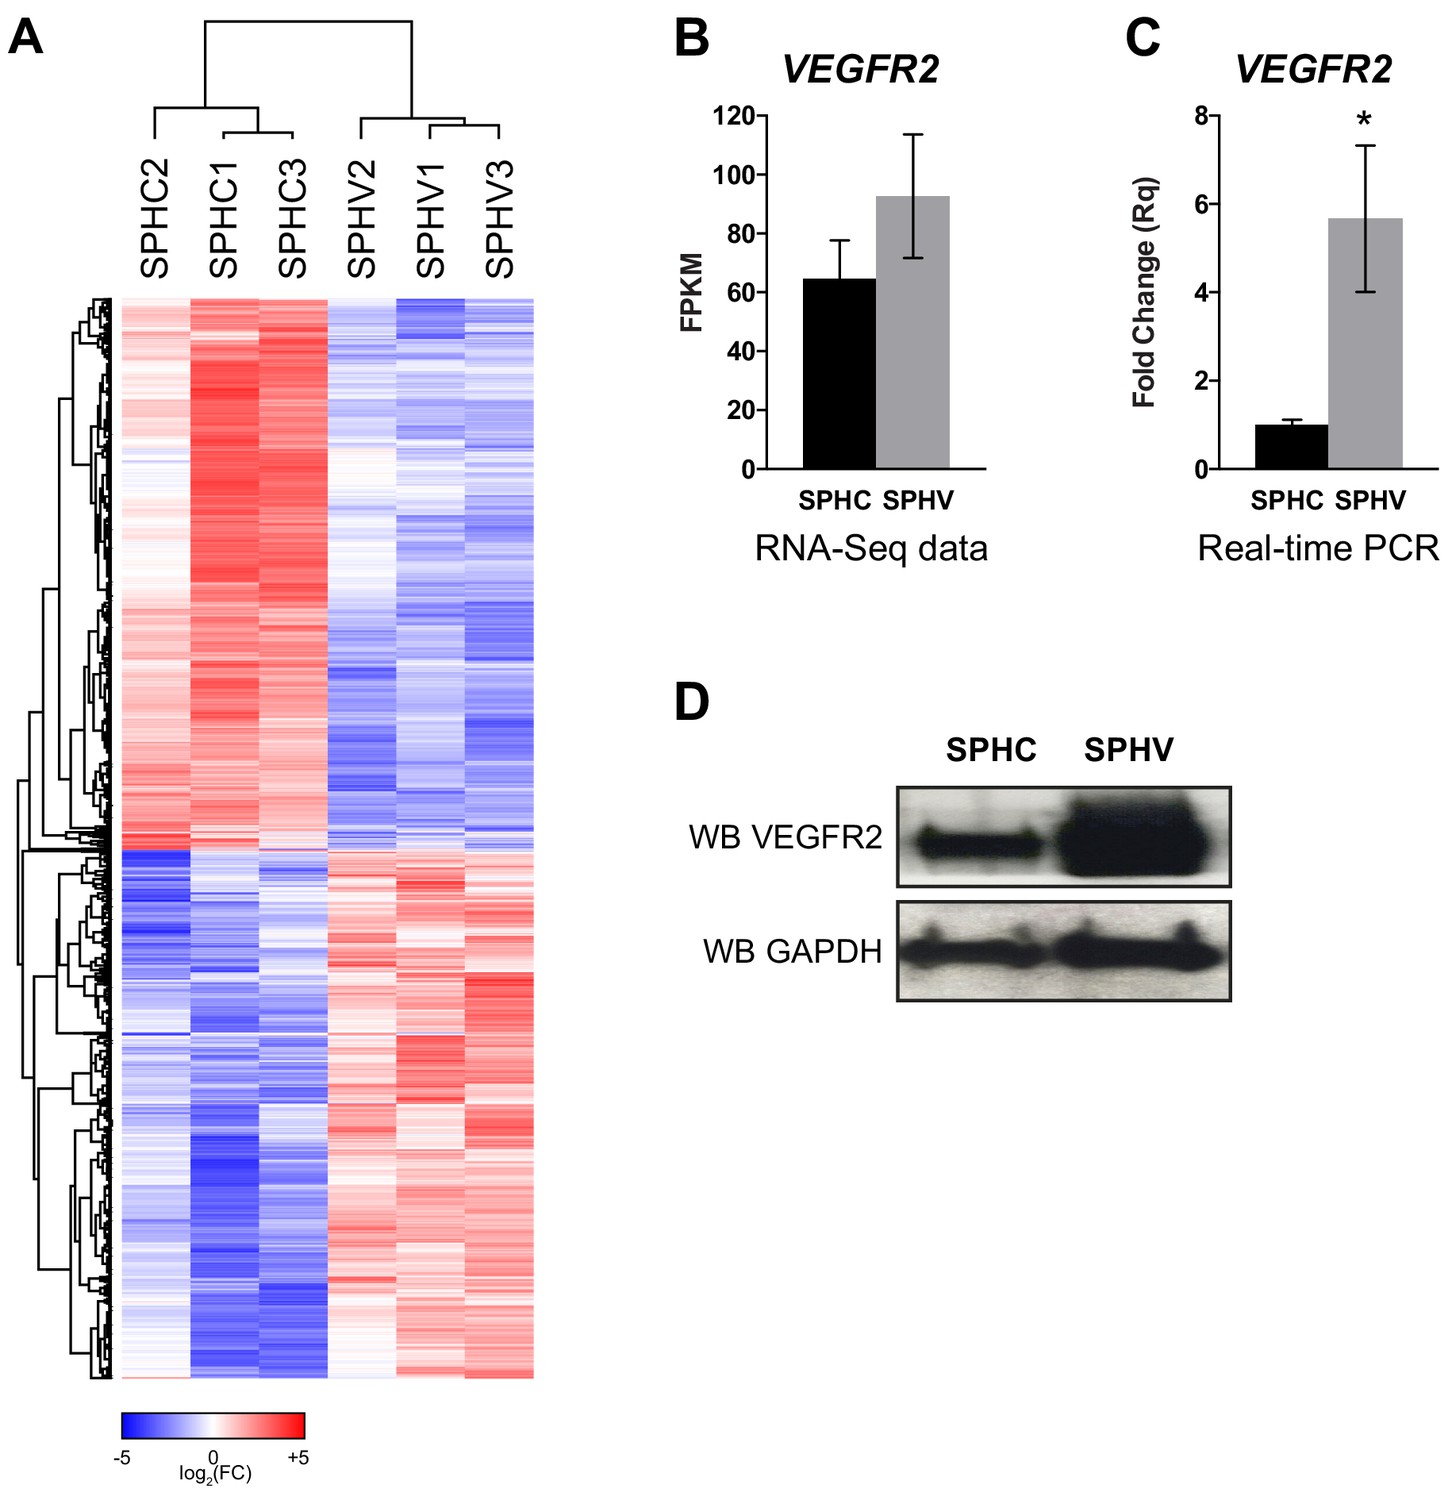
Expression profile of protein-coding genes annotated from the RNA-sequencing data.
(A) Heatmap showing 3072 DE protein-coding genes in SPHV versus SPHC with log2FC >0.5 and FDR <0.05. Color bar indicates log2FC. (B) VEGFR2 expression in SPHC and SPHV from RNA-sequencing data. (C) VEGFR2 expression in SPHC and SPHV measured by real-time PCR assay. Data are represented as mean ± SEM of n = 3 experiments. *, p<0.05. (D) VEGFR2 expression in SPHC and SPHV detected by western blot analysis. GAPDH was used as protein loading control. Data are representative of n = 3 experiments.
Figure 1—figure supplement 2
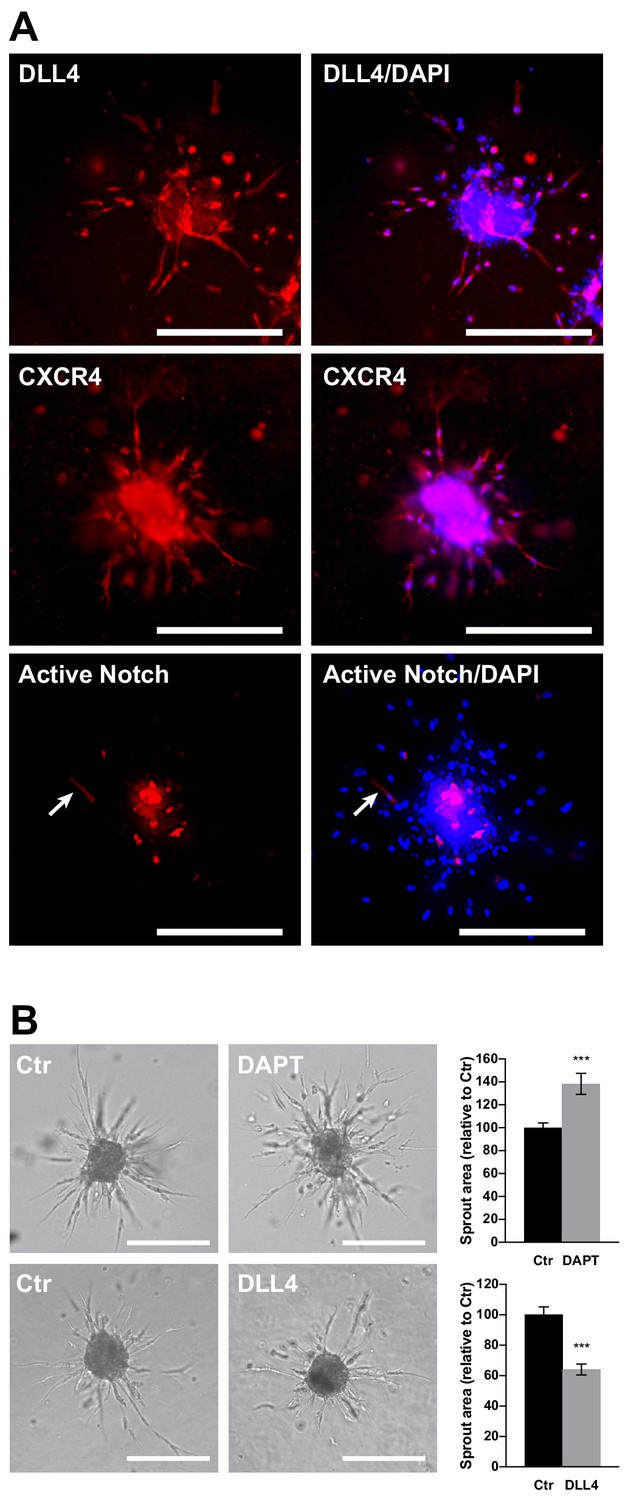
Organization of tip and stalk cells and the effect of Notch pathway manipulation in EC spheroids.
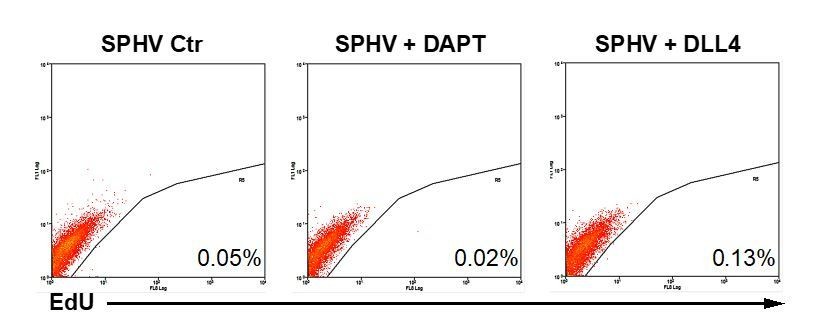
(A) DLL4 and CXCR4 expression was visualized in SPHV by immunofluorescent staining, or spheroids were generated with ECs transduced with Notch reporter pWPT-12XCSL-DsRedExpressDR to visualize cells in which the Notch pathway was activated. Scale bars = 200 μm. (B) Sprouting assay performed in the presence of the γ-secretase inhibitor DAPT or in the presence of the Notch ligand DLL4, and the corresponding quantification of sprouts area. Scale bars, 200 µm.
Figure 2 with 1 supplement
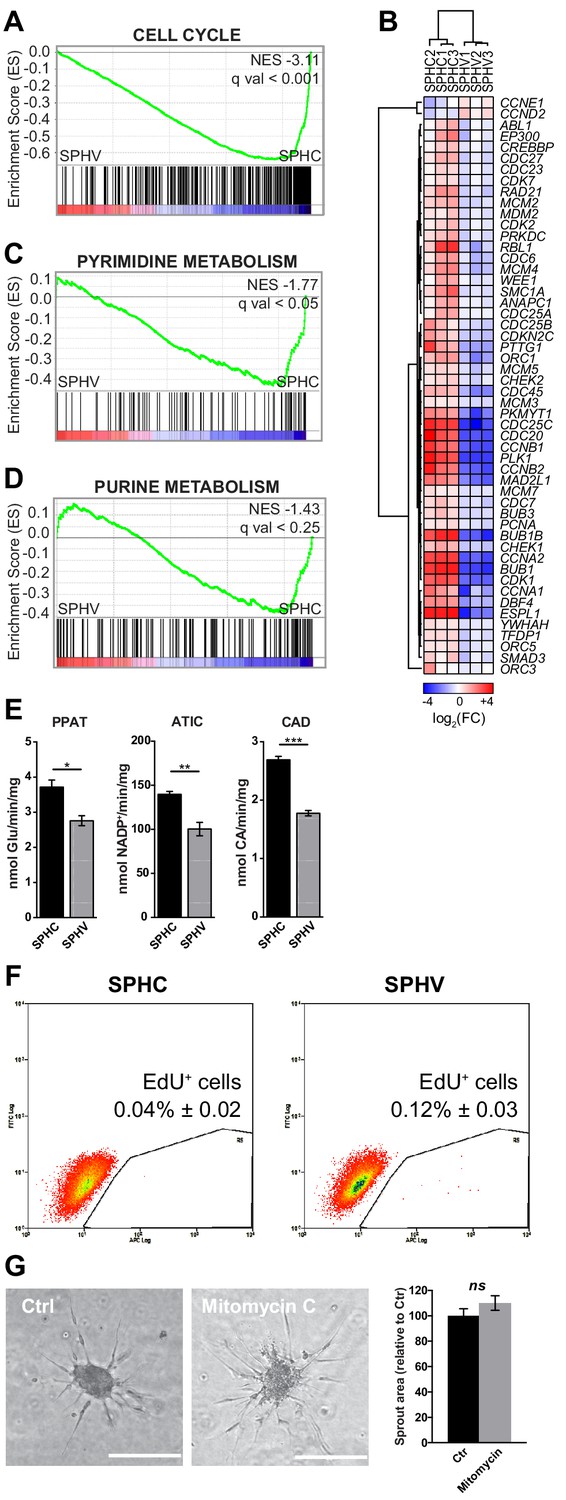
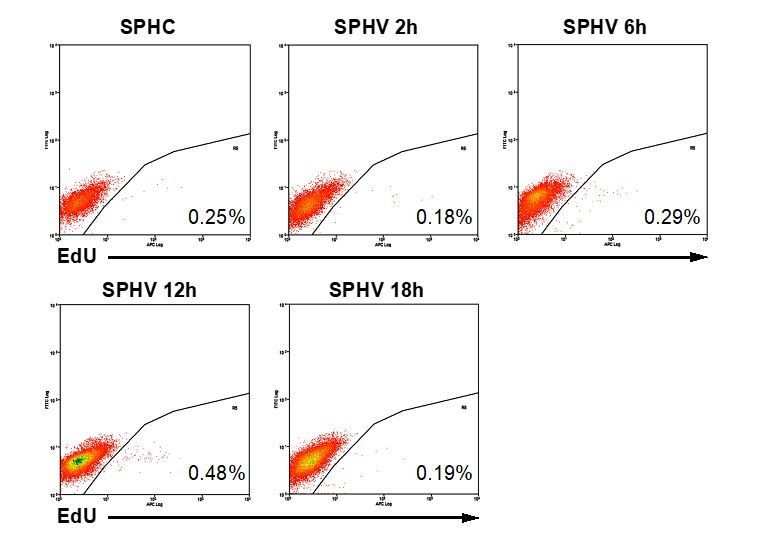
Early VEGF-A response does not involve cell proliferation.
(A) GSEA plot showing negative association with the ‘cell cycle’ gene set in SPHV compared to SPHC. (B) Heatmap representing the expression of genes that are included in the KEGG pathway ‘cell cycle’ and are differentially expressed with a log2(Fold Change)>0.5, FDR < 0.05 when comparing SPHV versus SPHC. Color bar indicates log2(fold change). (C, D) GSEA plots showing, respectively, negative association with ‘pyrimidine metabolism’ and ‘purine metabolism’ gene sets in SPHV compared to SPHC. FDR was accepted when q value < 0.05. (E) Measure of the VEGF-A-induced enzymatic activity of three enzymes involved in de novo nucleotide synthesis in SPHC and SPHV. PPAT, phosphoribosyl pyrophosphate amidotransferase; ATIC, 5-aminoimidazole-4-carboxamide ribonucleotide formyltransferase/IMP cyclohydrolase; CAD, carbamoyl-phosphate synthetase 2/aspartate transcarbamylase/dihydroorotase. Data are represented as mean ± SEM of n = 3 experiments. (F) Cell proliferation rate analysis in SPHC and SPHV performed by evaluation of EdU incorporation into the newly synthetized DNA. Representative plots of n = 3 experiments. Data represent the mean percentage of proliferating cells ± SEM of n = 3 experiments. p<0.05 in the comparison between SPHC and SPHV. (G) Sprouting assay performed with ECs pre-treated with the cell replication blocker mitomycin C, and the corresponding quantification of sprout area. Data are represented as mean ± SEM from n = 3 experiments. ***, p<0.001; **, p<0.01; *, p<0.05; ns, not significant.
Figure 2—figure supplement 1
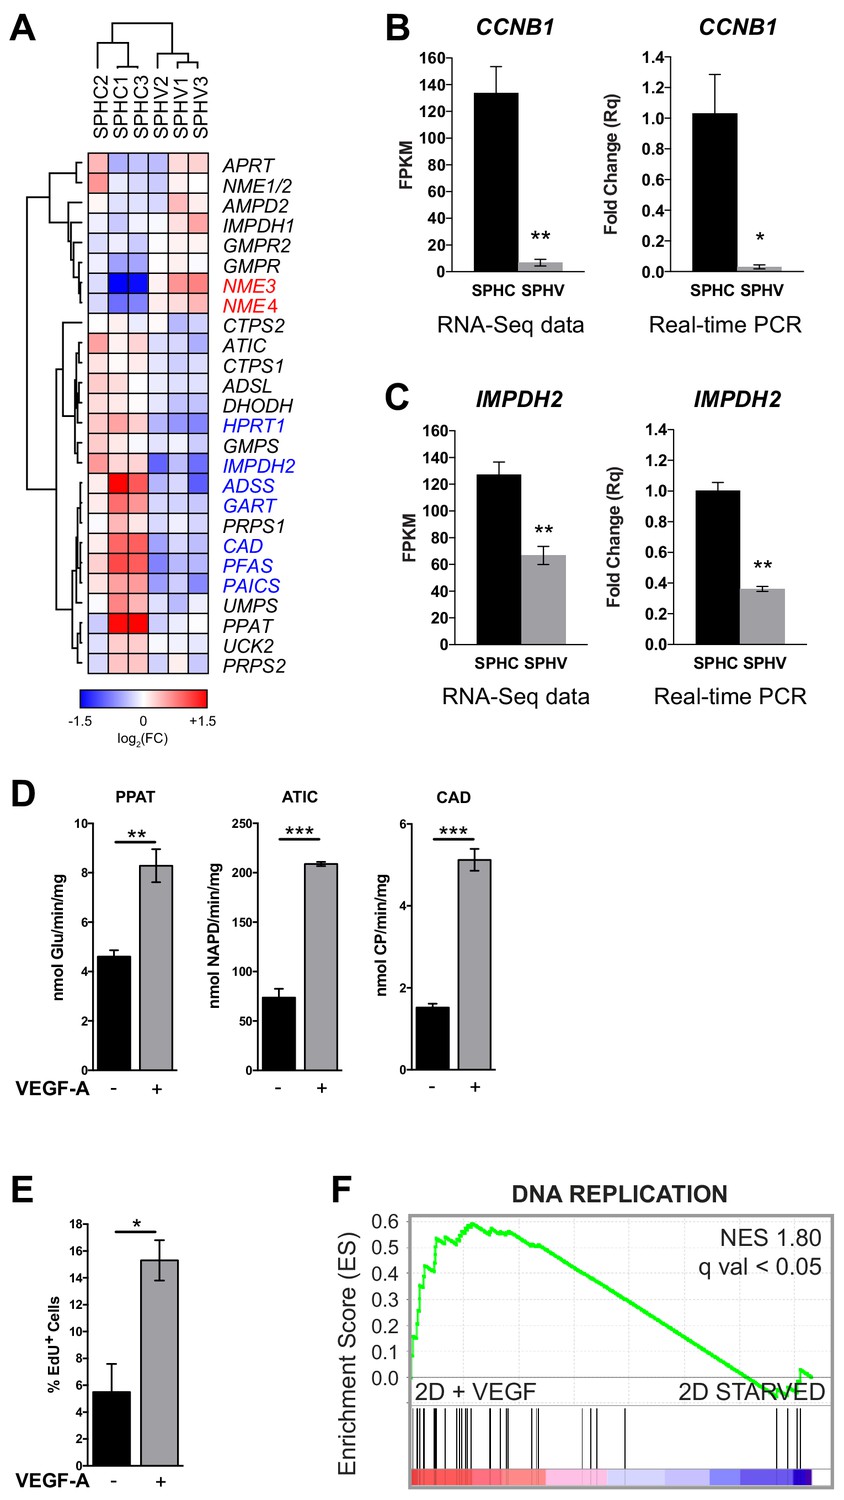
Expression profile of genes involved in nucleotide synthesis and cell proliferation assays.
(A) Heatmap representing the expression levels of genes involved in de novo nucleotide synthesis. The red or blue color of the gene name indicates DE genes with log2FC > 0.5 and FDR < 0.05. Color bar indicates log2FC. (B) CCNB1 expression in SPHC and SPHV from RNA-sequencing data and a real-time PCR assay. Data are represented as mean ± SEM of n = 3 experiments. (C) IMPDH2 expression in SPHC and SPHV from RNA-sequencing data and real-time PCR assay. Data are represented as mean ± SEM for n = 3 experiments. (D) Measure of the VEGF-A-induced enzymatic activity of three enzymes involved in de novo nucleotide synthesis in 2D-cultured human umbilical vein endothelial cells (HUVECs). PPAT: phosphoribosyl pyrophosphate amidotransferase; ATIC: 5-aminoimidazole-4-carboxamide ribonucleotide formyltransferase/IMP cyclohydrolase; CAD: carbamoyl-phosphate synthetase 2/aspartate transcarbamylase/dihydroorotase. Data are represented as mean ± SEM of n = 3 experiments. (E) VEGF-A-induced cell proliferation assessed by cytofluorimetric analysis of EdU incorporation into the DNA during cell replication, in 2D-cultured HUVECs. Data are represented as mean ± SEM for n = 3 experiments. (F) GSEA plot showing positive association with the ‘DNA REPLICATION’ gene set in 2D-cultured HUVEC stimulated with VEGF-A compared to unstimulated cells (starved). ***, p<0.001; **, p<0.01; *, p<0.05.
Figure 3 with 1 supplement
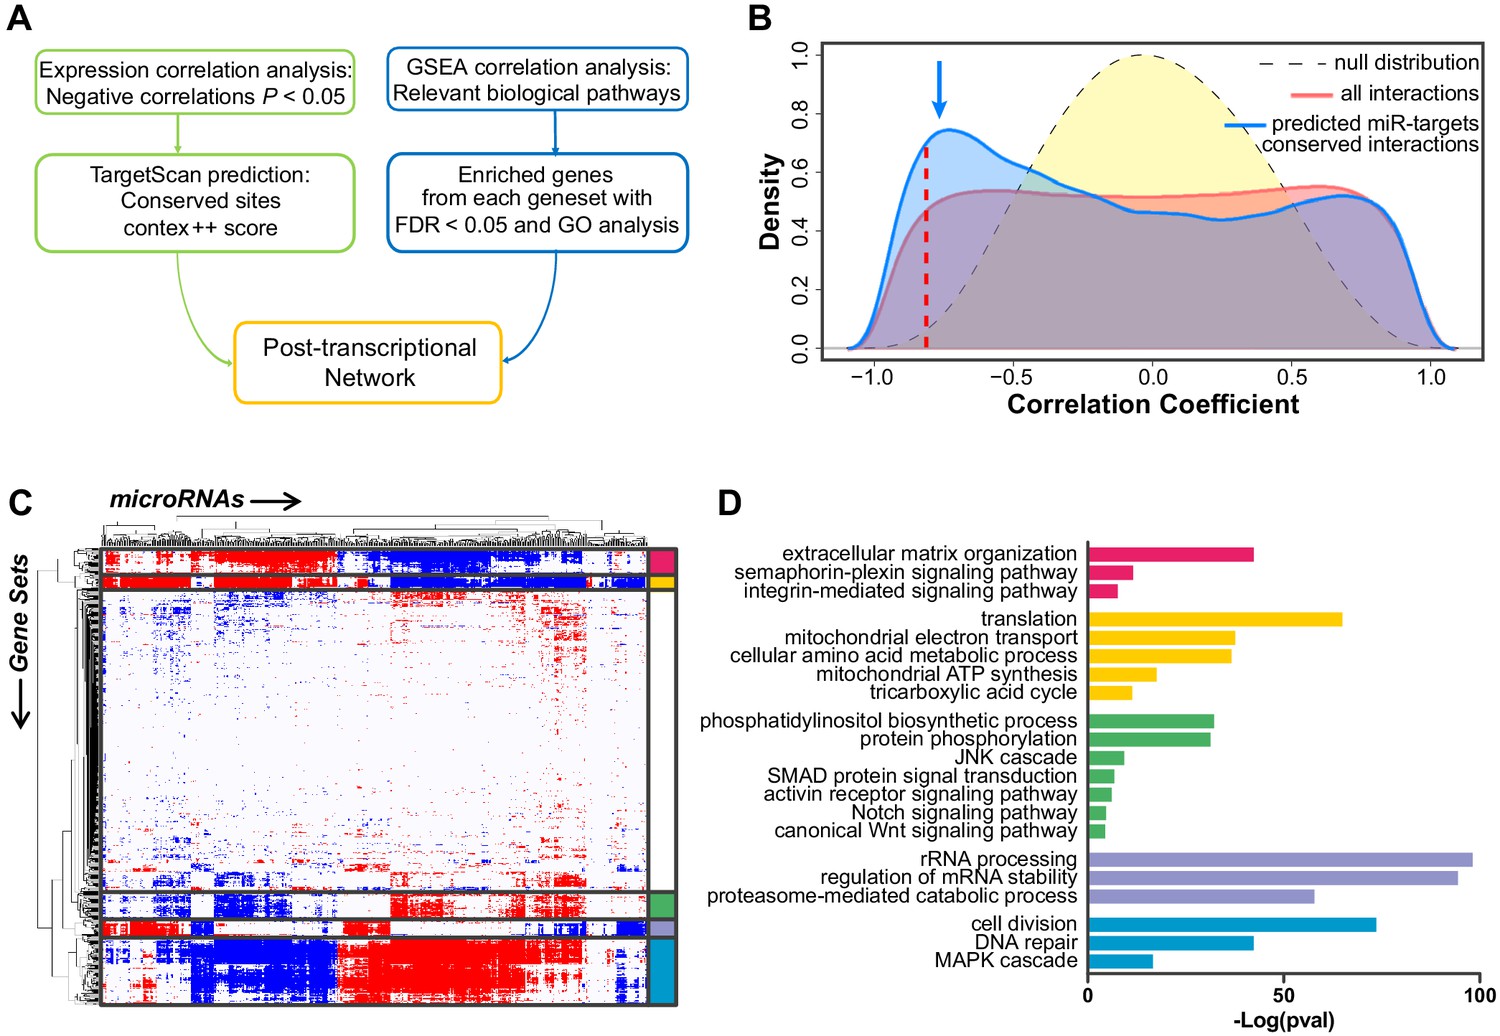
Construction of the post-transcriptional regulatory network that sustains acquisition of the tip cell phenotype.
(A) Schematic view of the computational approach used to generate the post-transcriptional regulatory network. (B) Distribution of the correlator (Pearson coefficient) of the pair-wise analysis that considered the expression profile of all miRNAs and of protein-coding genes expressed in SPCH and SPHV. The gray dashed curve represents the null hypothesis distribution (uncorrelated miRNA–protein coding gene pairs) obtained by sample randomization with 1000 permutations; the red curve represents all pair-wise miRNA–protein-coding gene interactions; the blue curve represents the subset of miRNA–protein-coding gene pairs containing an evolutionarily conserved interaction as predicted by the TargetScan database. The blue arrow points to the enrichment in negative correlations. The red dashed line indicates the statistical significance threshold chosen for the correlator (P < 0.05). (C) Association matrix of the expression profiles of miRNAs (columns) with functional gene sets (rows) representing canonical pathways. Significant associations (FDR < 0.05) are shown in red (positive) or blue (negative). White, not significant. Biologically relevant clusters are highlighted with different colors. (D) For each cluster in (C), genes contributing to enrichment in the correlated gene sets were analyzed by functional annotation. Graph shows –Log(P value) of representative gene ontology terms.
-
Figure 3—source data 1
miRNAs annotation.
- https://cdn.elifesciences.org/articles/48095/elife-48095-fig3-data1-v1.xlsx
Figure 3—figure supplement 1
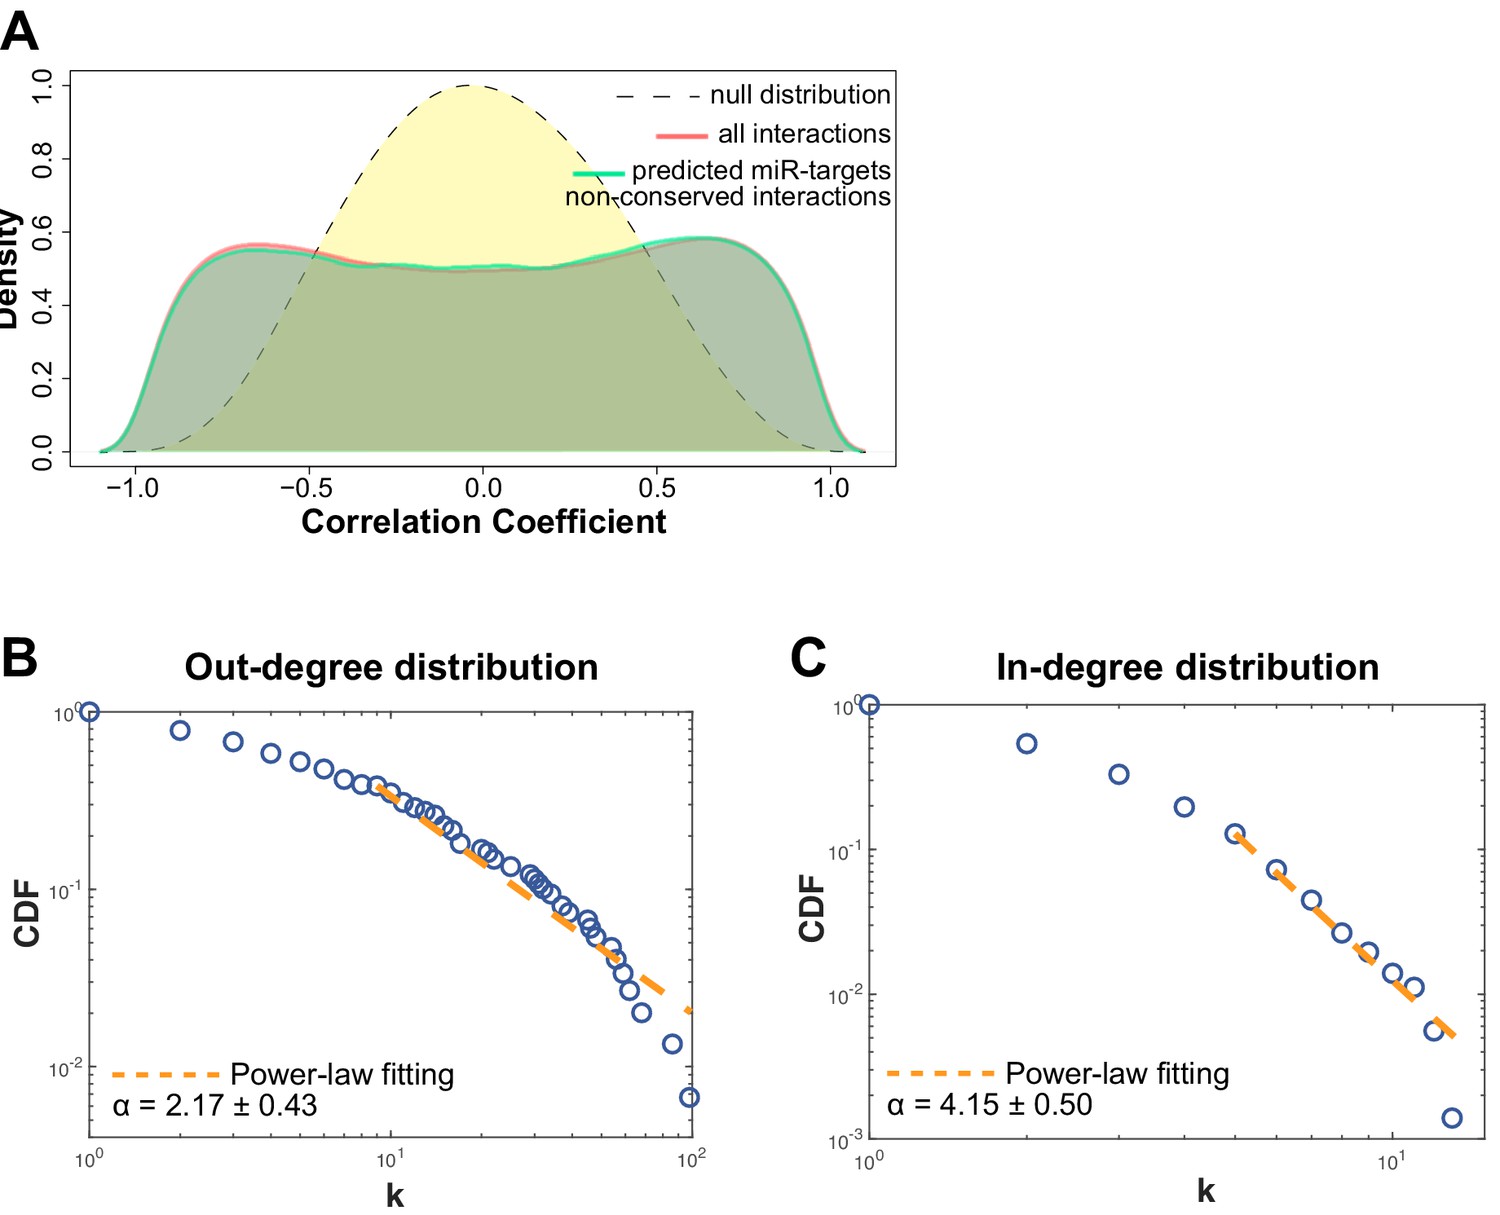
Non-conserved miRNA-target gene interactions analysis and network degree analysis.
(A) Distribution of the correlator (Pearson coefficient) of the pair-wise analysis that considered the expression profile of all miRNAs and protein-coding genes expressed in SPCH and SPHV. The gray dashed curve represents the null hypothesis distribution (uncorrelated miRNA–protein-coding gene pairs) obtained by sample randomization with 1000 permutations; the red curve represents all pair-wise interactions of miRNA–protein-coding gene interactions; the green curve represents the subset of miRNA–protein-coding gene pairs that contain an evolutionarily non-conserved interaction, as predicted by the TargetScan database. (B) Cumulative distribution function (CDF) of the number of connections (k) for each miRNA (out-degree). Kolmogorov-Smirnov test for the estimated power-law fitting, P = 0.153. (C) Cumulative distribution function (CDF) of the number of connections (k) for each protein-coding gene (in-degree). Kolmogorov-Smirnov test for the estimated power-law fitting, P = 0.235.
Figure 4
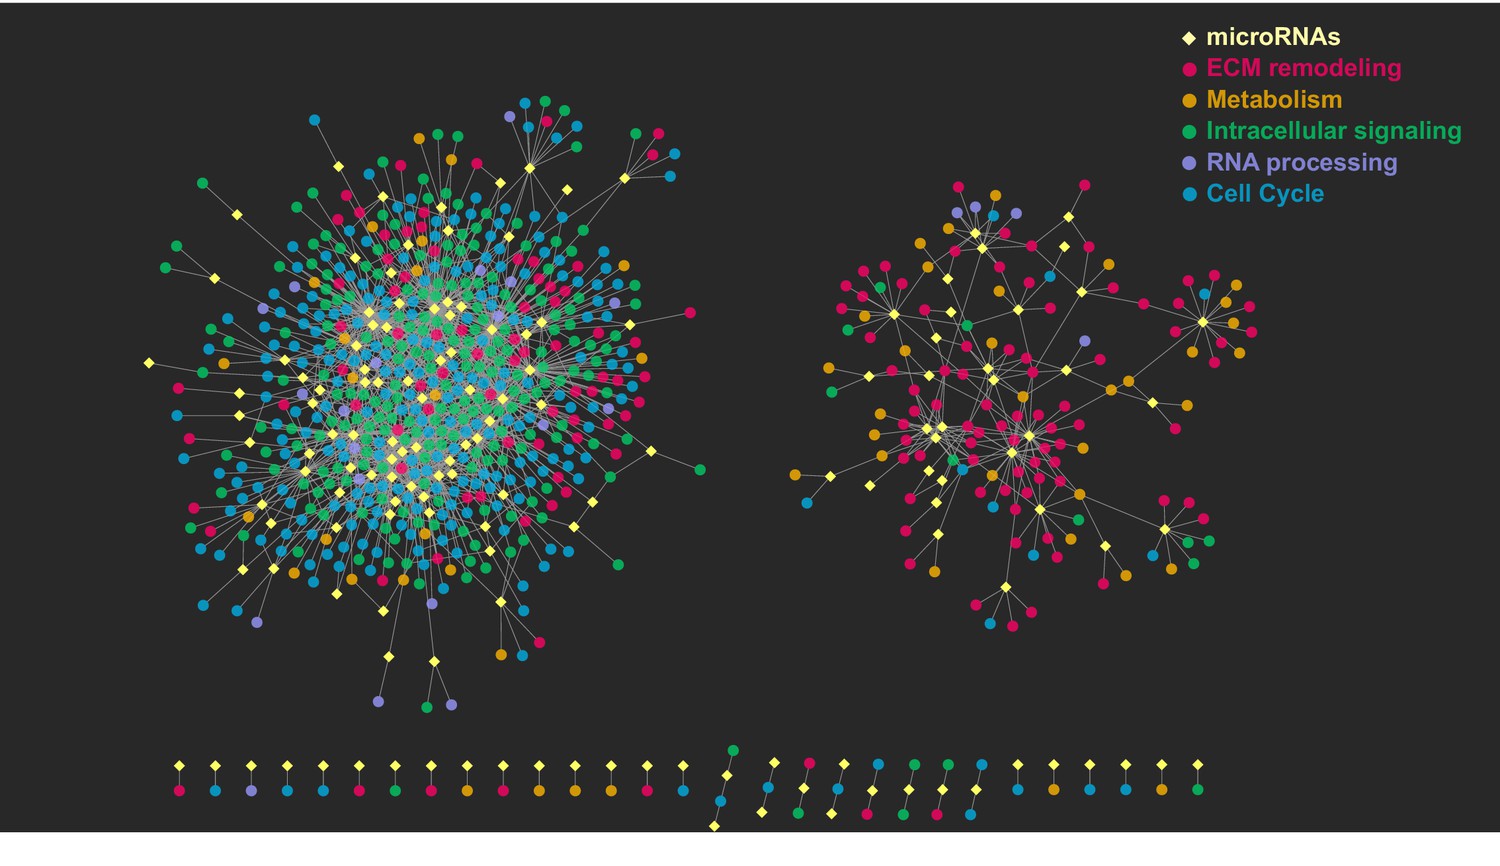
Graphical representation of the post-transcriptional network.
The network consists of two major, independent components. The component on the left includes the interactions between upregulated miRNAs and their respective downregulated target genes; the component on the right includes the interactions between downregulated miRNAs and their respective upregulated target genes. Yellow diamonds represent miRNAs, circles represent their target genes, colored on the basis of the gene ontology cluster to which they belong. Edges are the miRNA–target gene pairs with a predicted direct interaction and a significant negative correlation.
-
Figure 4—source data 1
Co-expression network edges.
- https://cdn.elifesciences.org/articles/48095/elife-48095-fig4-data1-v1.xlsx
Figure 5 with 1 supplement
ERK activation is not required for sprouting and the ERK module is repressed by miRNAs.
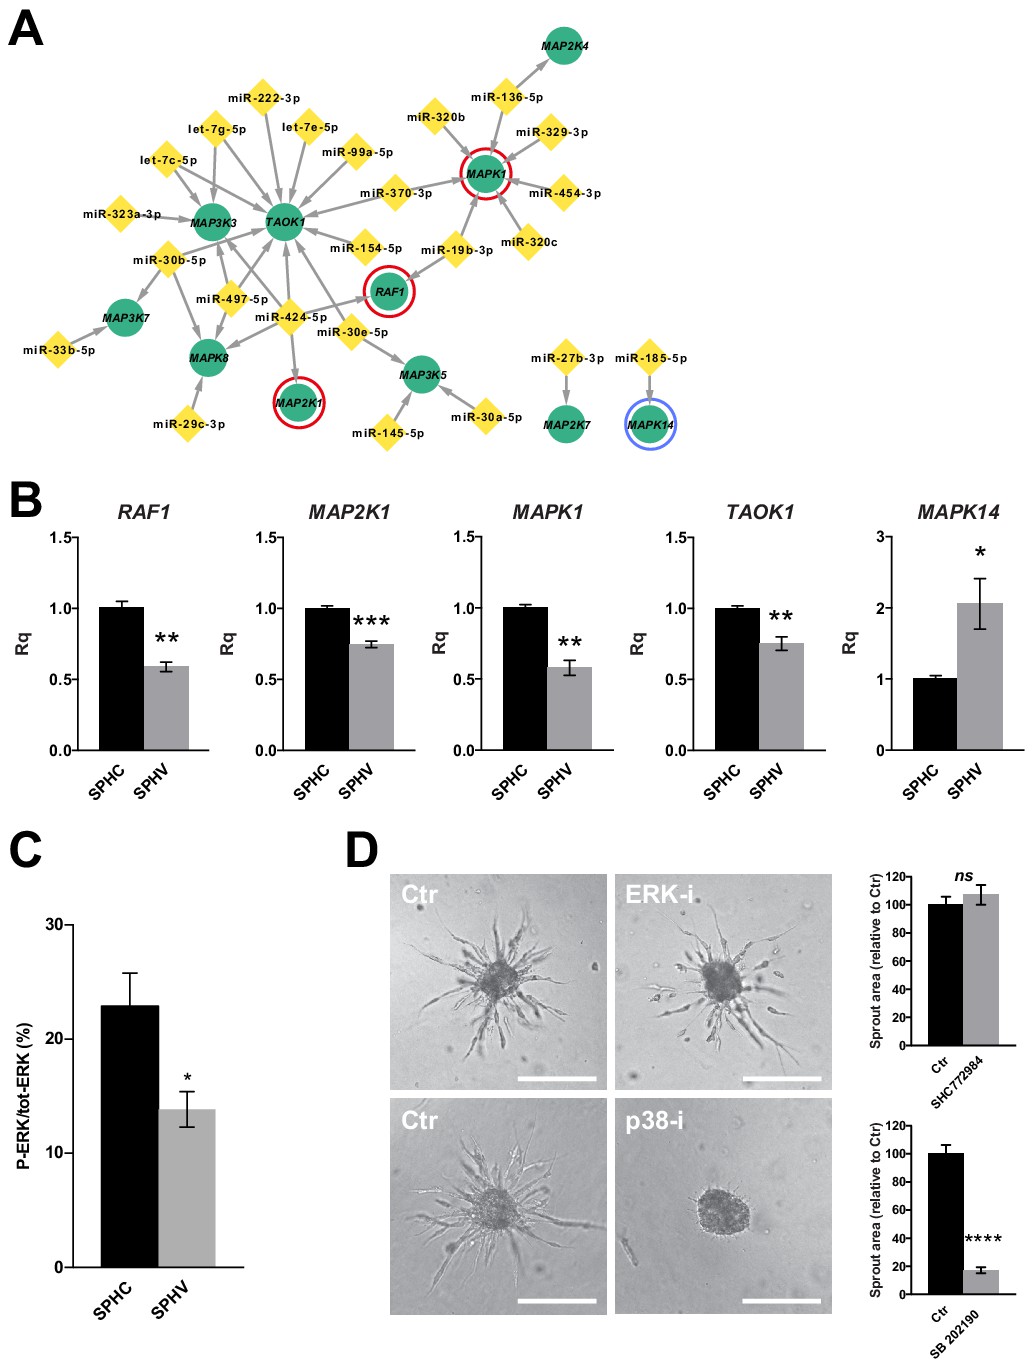
(A) Sub-network representing miRNAs targeting MAPK genes, derived from the global post-transcriptional network. The ERK module, consisting of RAF1 (C-Raf), MAP2K1 (MEK) and MAPK1 (ERK2), is highlighted by red circles. MAPK14 (p38α) is highlighted by a blue circle. (B) Real-time PCR validations of the RNA-sequencing data for some of the MAPK sub-network members, in SPHC and SPHV. Data are represented as mean ± SEM for n = 3 experiments. (C) ERK activity in SPHC and SPHV measured by Meso Scale Discovery (MSD) technology and expressed as the ratio of P-ERK/total ERK. Data are represented as mean ± SEM from n = 4 experiments. (D) Sprouting assay performed in the presence of the ERK inhibitor SHC 772984 or in the presence of the p38 inhibitor SB 202190, and the corresponding quantification of sprout area. Scale bars, 200 µm. ****, p<0.0001; ***, p<0.001; **, p<0.01; *, p<0.05; ns, not significant.
Figure 5—figure supplement 1
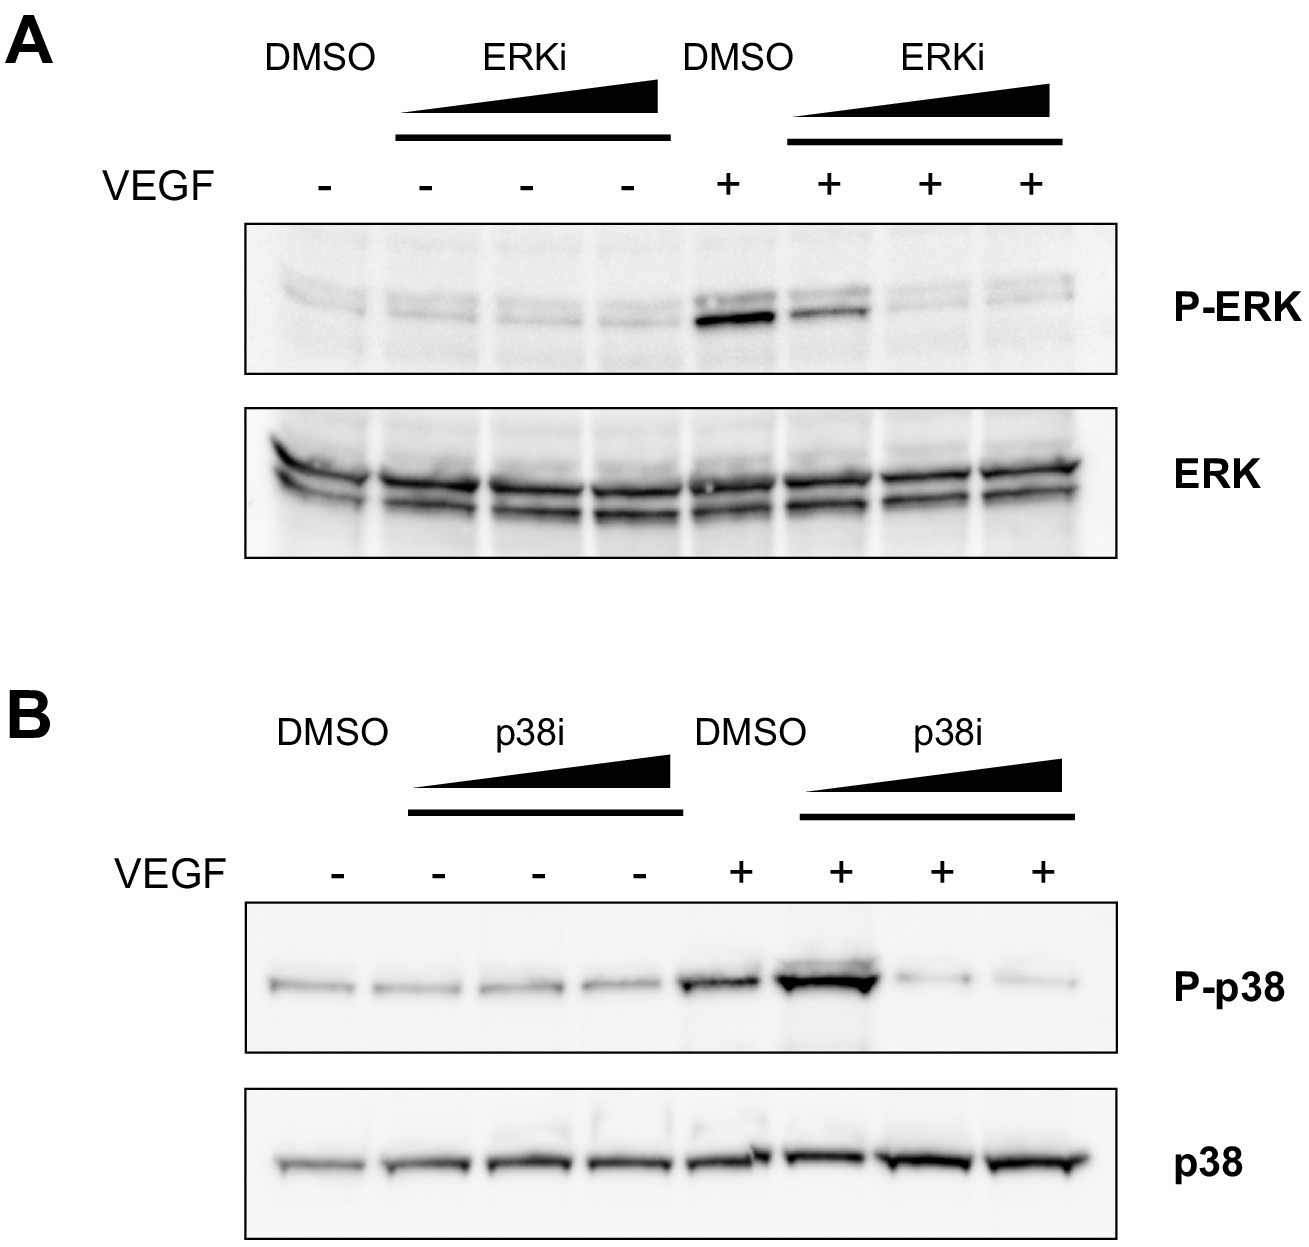
Assessment of the effective concentrations of ERK and p38 inhibitors in ECs.
(A) Western blot showing ERK phosphorylation, detected with an anti-phospho-ERK antibody (P-ERK), upon VEGF-A stimulus in the presence of an increasing concentration (10, 100, 300 nM) of the ERK inhibitor SHC 772984, or vehicle (DMSO). Total ERK was used as protein loading control. (B) Western blot showing p38 phosphorylation, detected with an anti-phospho-p38 antibody (P–p38), upon VEGF-A stimulus in the presence of increasing concentration (10, 100, 300 μM) of the p38 inhibitor SB 202190, or vehicle (DMSO). Total p38 was used as protein loading control. Data are representative of three independent experiments.
Figure 6 with 1 supplement
DICER knock-down rescues VEGF-A proliferative effect.
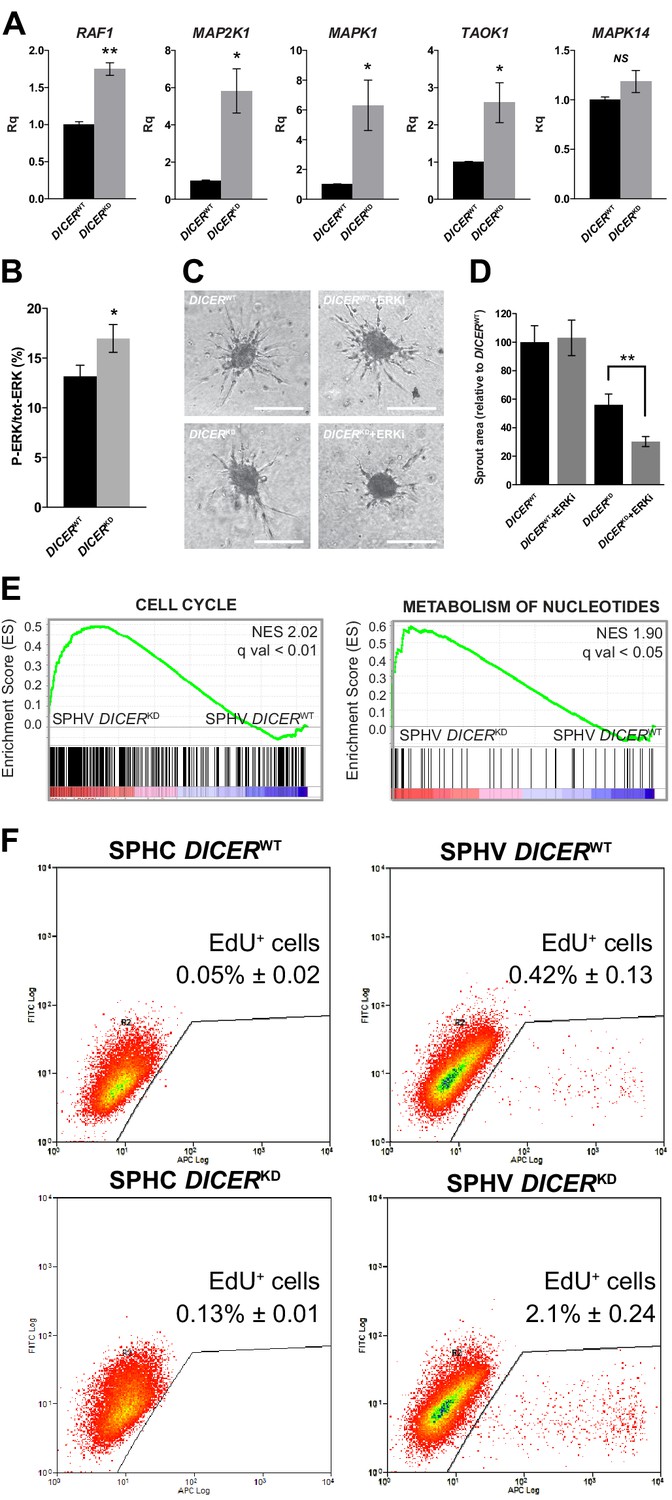
(A) Real-time PCR analysis of RAF1, MAP2K1, MAPK1, TAOK1, and MAPK14 in SPHV generated with DICERWT cells or DICERKD cells. Data are represented as mean ± SEM from n = 3 experiments. (B) ERK activity in SPHV generated with DICERWT cells or DICERKD cells measured by MSD and expressed as the ratio of P-ERK/total ERK. Data are represented as mean ± SEM from n = 3 experiments. (C) Sprouting assay performed with spheroids generated with DICERWT cells or DICERKD cells, in the presence of the ERK inhibitor SHC 772984. Scale bars, 200 µm. (D) Quantification of sprouts area for the cells shown in panel (C). Data are represented as mean ± SEM from n = 3 experiments. (E) GSEA study performed against the canonical pathways gene sets collection showed positive enrichment in the 'cell cycle' and 'metabolism of nucleotides' gene sets, in the comparison between DICERKD and DICERWT stimulated spheroids (SPHV). FDR was accepted when q value < 0.05. (F) Cell proliferation assessed by cytofluorimetric analysis of EdU incorporation into the DNA in spheroids generated from DICERWT cells or DICERKD cells that were either not stimulated (SPHC) or stimulated (SPHV) with VEGF-A. Representative plots of n = 3 experiments. Data represent mean percentages of proliferating cells ± SEM from n = 3 experiments. **, p<0.01; *, p<0.05.
Figure 6—figure supplement 1
DICER knock-down.
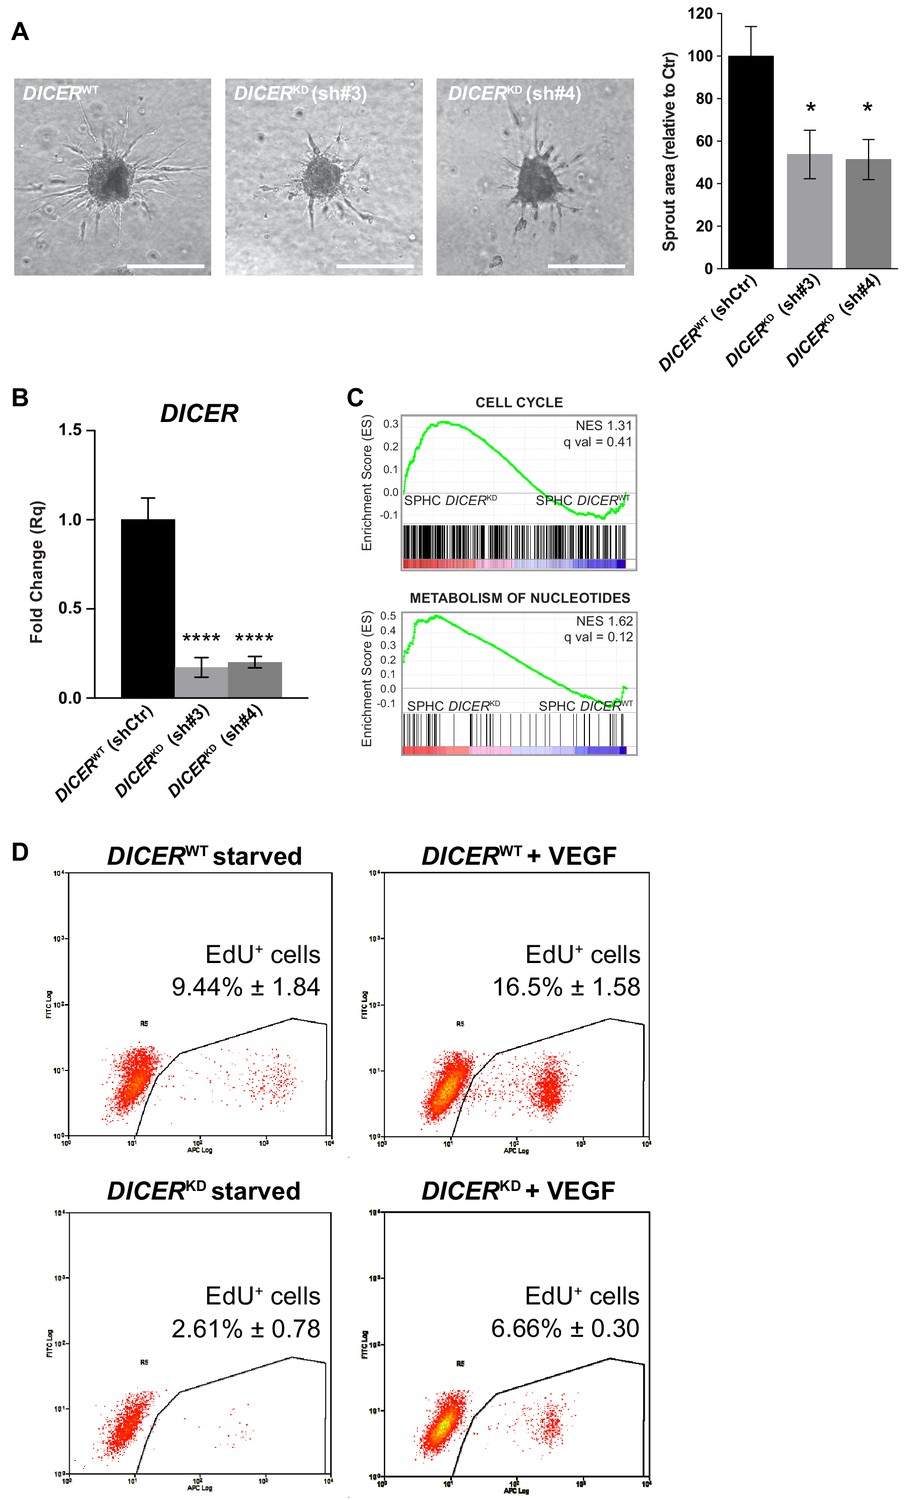
(A) Sprouting assay performed with spheroids generated with cells that had been transduced with a non-targeting shRNA (DICERWT shCtr) or with two different shRNAs targeting DICER (DICERKD sh#3 and DICERKD sh#4), and the corresponding quantification of the sprouted area. Data are represented as mean ± SEM from n = 6 experiments. Scale bars, 200 µm. (B) DICER expression measured by real-time PCR assay in cells transduced with a non-targeting shRNA (DICERWT shCtr) or with two different shRNAs targeting DICER (DICERKD sh#3 and DICERKD sh#4). Data are represented as mean ± SEM from n = 3 experiments. (C) GSEA study performed against the canonical pathways gene sets collection, comparing control spheroids (SPHC) generated with DICERKD or DICERWT cells. FDR q value > 0.05, not significant. (D) VEGF-A-induced cell proliferation assessed by cytofluorimetric analysis of EdU incorporation into the DNA during cell replication, in 2D-cultured HUVECs. Cells were transduced either with a scrambled shRNA (DICERWT) or with a shRNA targeting DICER (DICERKD). Plots are representative of n = 3 experiments. Data represent mean percentage of proliferating cells ± SEM from n = 3 experiments. p<0.05 in the comparison between DICERWT + VEGF and DICERKD + VEGF. ****, p<0.0001; **, p<0.01; *, p<0.05.
Figure 7 with 4 supplements
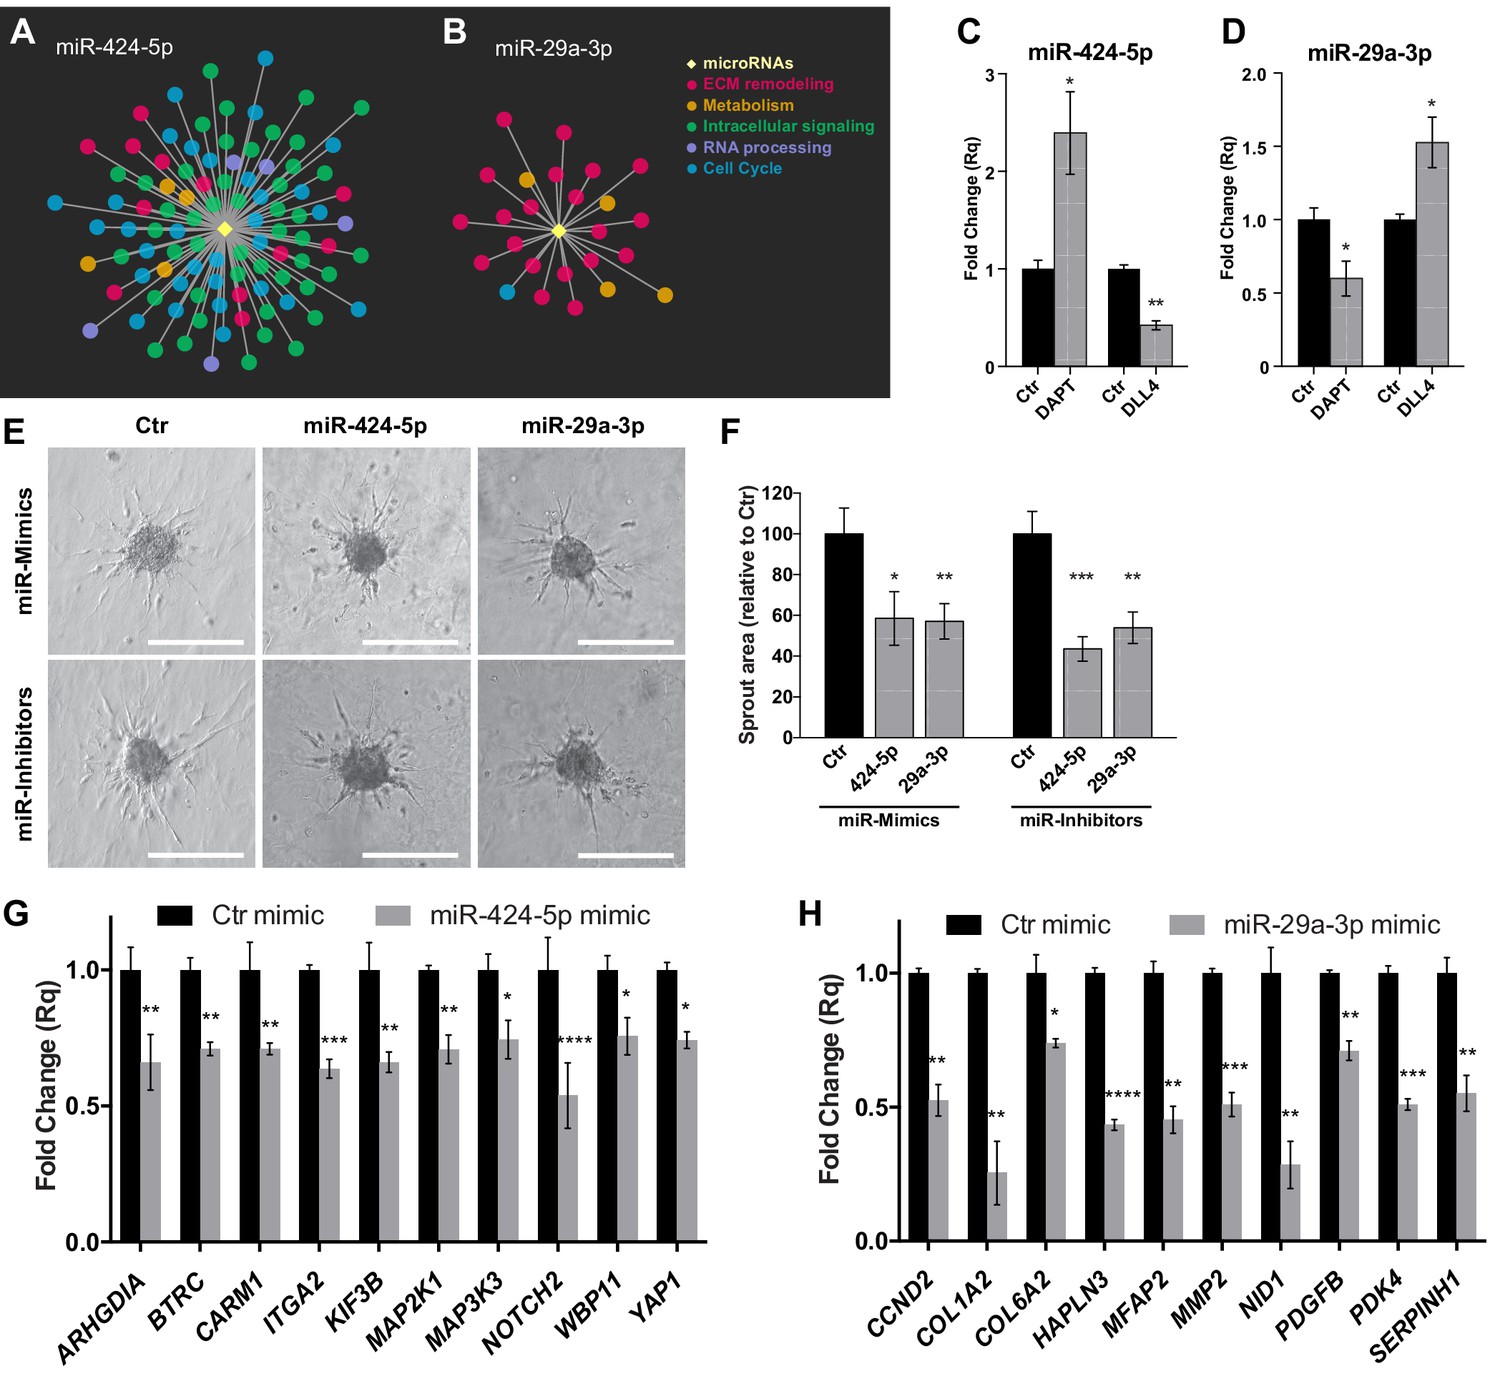
Hub miRNAs are essential to the sprouting process.
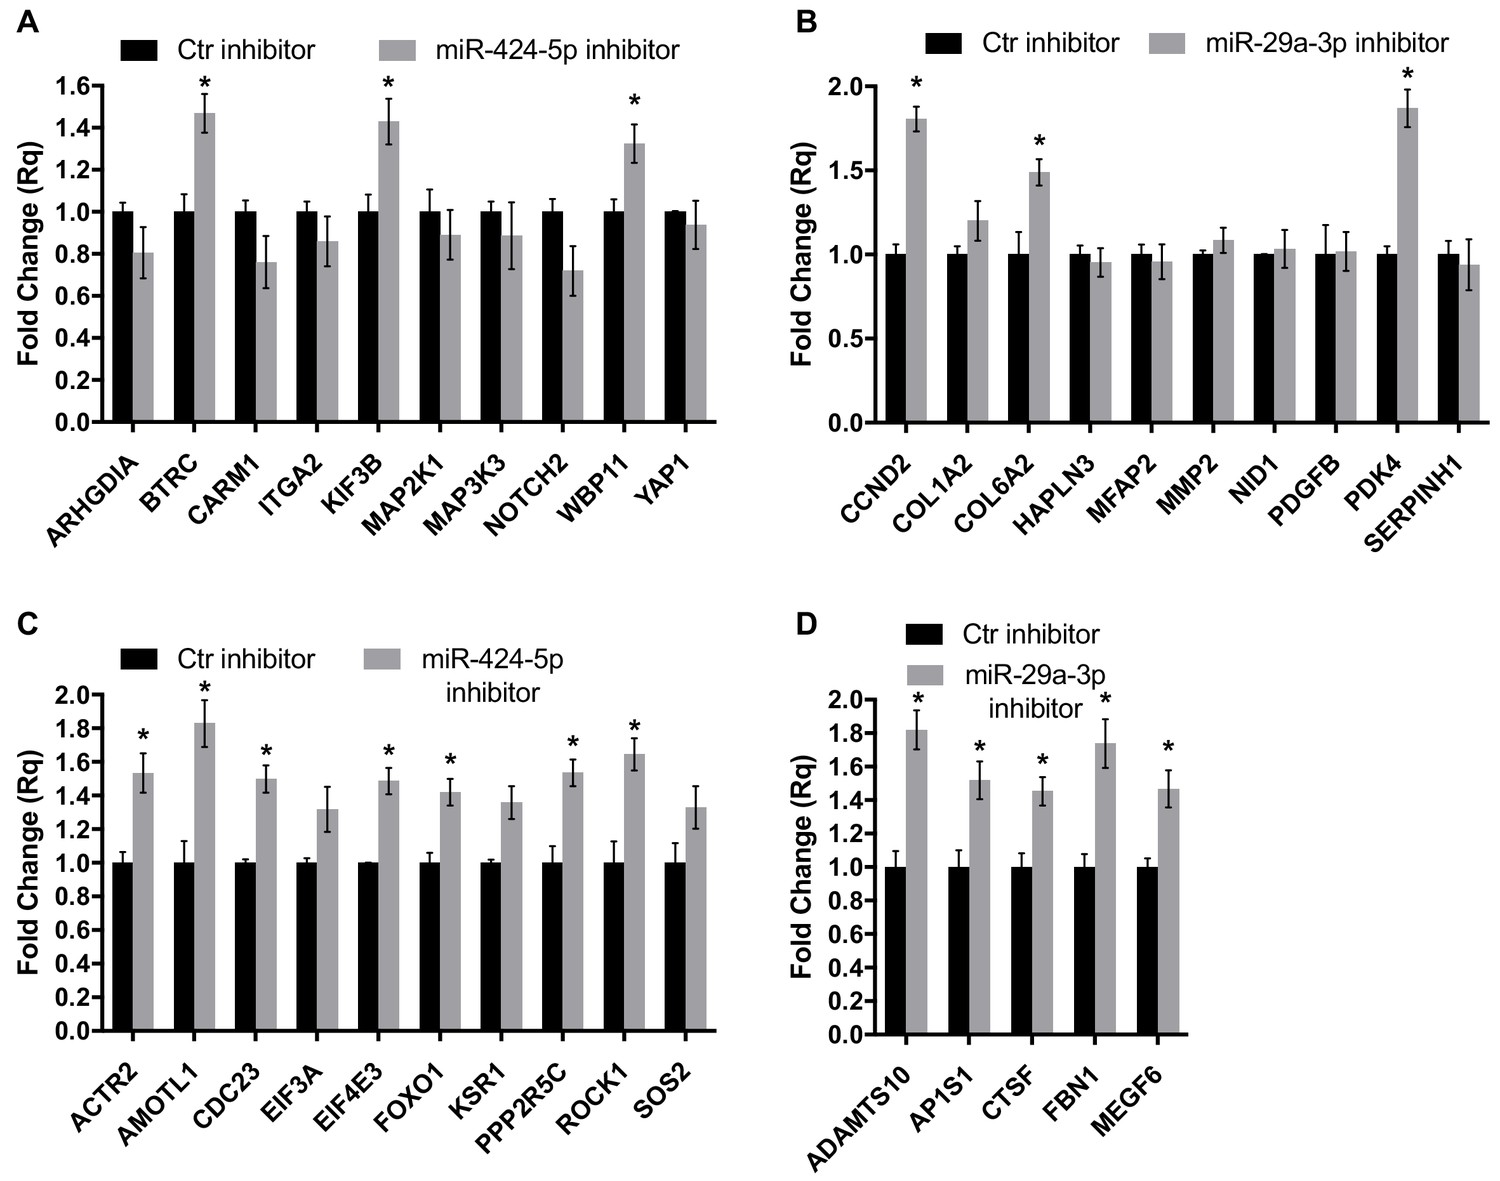
Graphical representation of miR-424–5p (A) and miR-29a-3p (B) sub-networks, characterized by different patterns of functional classes target genes. (C) Real-time PCR analysis of miR-424–5p expression in SPHV treated with DAPT or with exogenous DLL4. Data are represented as mean ± SEM from n = 3 experiments. (D) Real-time PCR analysis of miR-29a-3p expression in SPHV treated with DAPT or with exogenous DLL4. Data are represented as mean ± SEM for n = 3 experiments. (E) Sprouting assay performed with ECs transfected with miR-424–5p or miR-29a-3p mimics and inhibitors. Scale bars, 200 µm. (F) Quantification of sprout area for the cells shown in panel (E). Data are represented as mean ± SEM from n = 4 experiments. (G) Real-time PCR assays in EC transfected with miR-424–5p mimic detecting the expression of miR-424–5p targets predicted from the network analysis. Data are represented as mean ± SEM from n = 3 experiments. (H) Real-time PCR assays in EC transfected with miR-29a-3p mimic detecting the expression of miR-29a-3p targets predicted from the network analysis. Data are represented as mean ± SEM from n = 3 experiments. ****, p<0.0001; ***, p<0.001; **, p<0.01; *, p<0.05.
-
Figure 7—source data 1
Hub miRNA interactions supported by experimental evidence.
- https://cdn.elifesciences.org/articles/48095/elife-48095-fig7-data1-v1.xlsx
Figure 7—figure supplement 1
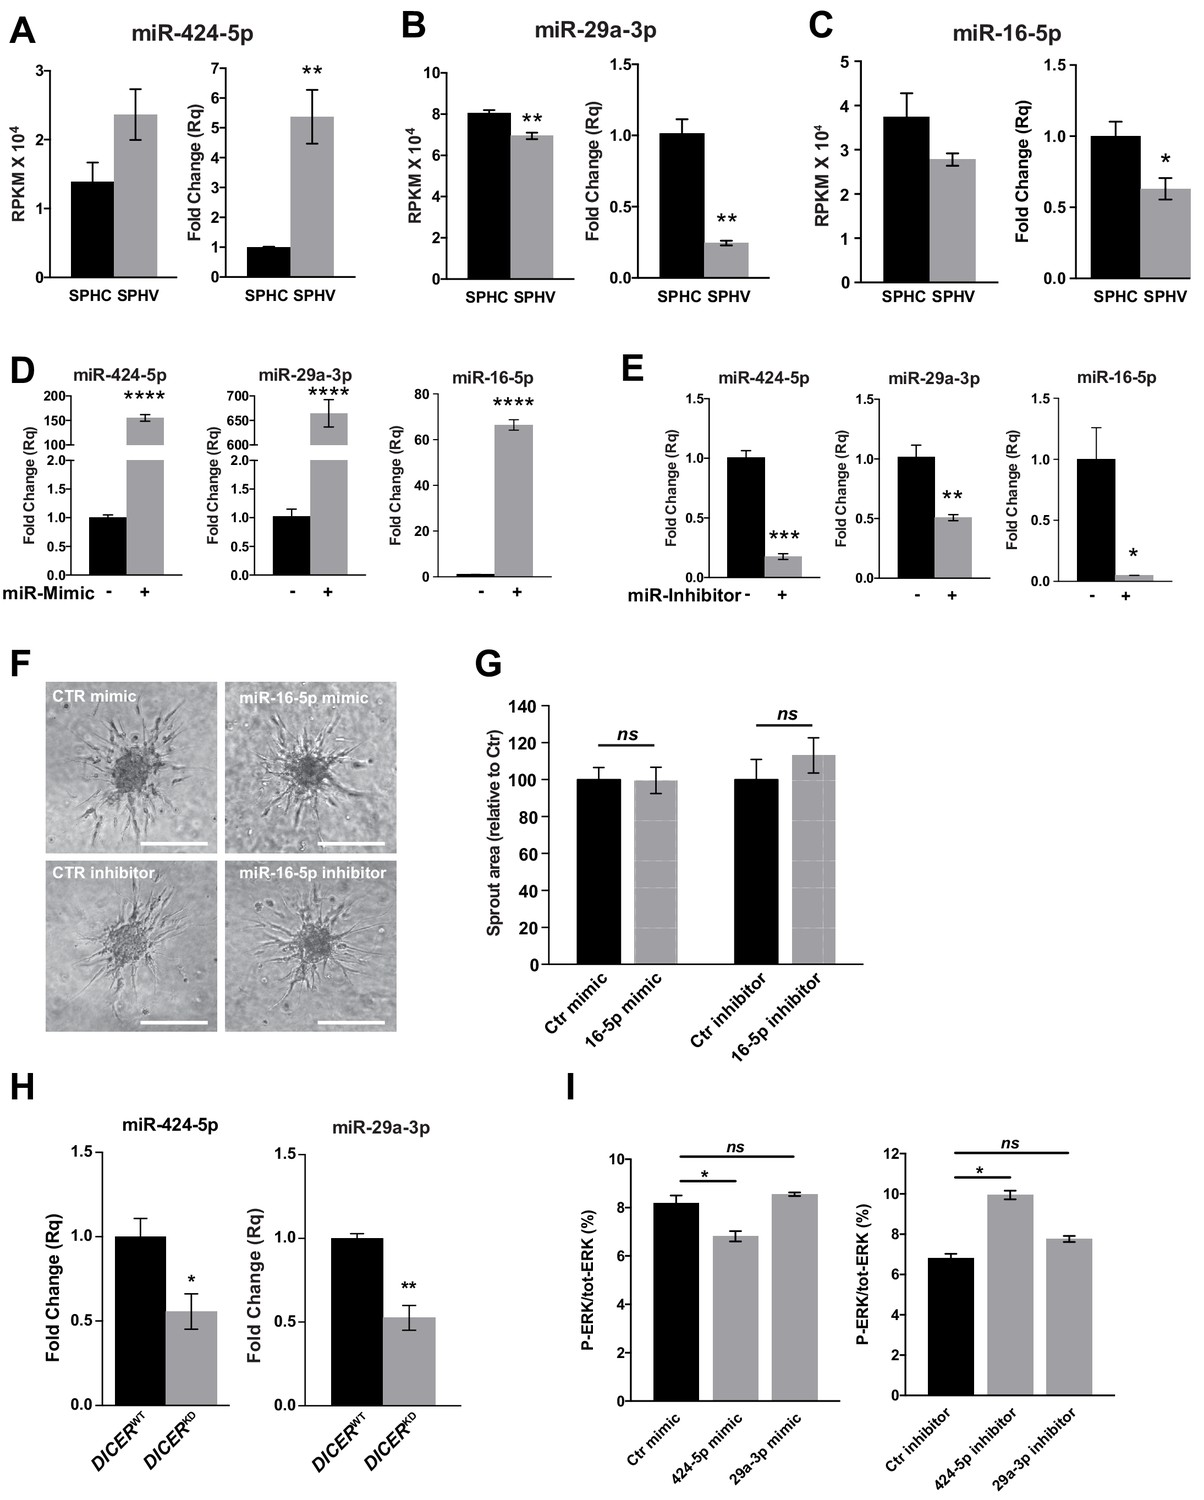
miR-424–5p, miR-29a-3p and miR-16–5 p gain of function and loss of function.
Real-time PCR validation of RNA-sequencing data for miR-424–5p (A), miR-29a-3p (B) and miR-16–5 p (C) in SPHC and SPHV. Data are represented as mean ± SEM from n = 3 experiments. (D) Real-time PCR assays detecting the overexpression of miR-424–5p, miR-29a-3p or miR-16–5 p in HUVECs transfected with the corresponding miRNA mimics. Data are represented as mean ± SEM from n = 3 experiments. (E) Real-time PCR assays detecting the inhibition of miR-424–5p, miR-29a-3p or miR-16–5 p in HUVECs transfected with the corresponding miRNA inhibitors. Data are represented as mean ± SEM from n = 3 experiments. (F) Sprouting assay performed with HUVECs transfected with miR-16–5 p mimic or inhibitor. Scale bars, 200 µm. (G) Quantification of the sprout area of cells shown in panel (F). Data are represented as mean ± SEM from n = 4 experiments. (H) Real-time PCR analysis of miR-424–5p and miR-29a-3p expression in spheroids generated with cells transduced with a non-targeting shRNA (DICERWT) or with a shRNA targeting DICER (DICERKD). Data are represented as mean ± SEM from n = 3 experiments. (I) ERK activity in SPHV generated with ECs transfected with miR-424–5p or miR-29a-3p mimics or inhibitors, measured by MSD and expressed as ratio of P-ERK/total ERK. Data are represented as mean ± SEM from n = 2 experiments. ****, p<0.0001; ***, p<0.001; **, p<0.01; *, p<0.05; ns, not significant.
Figure 7—figure supplement 2
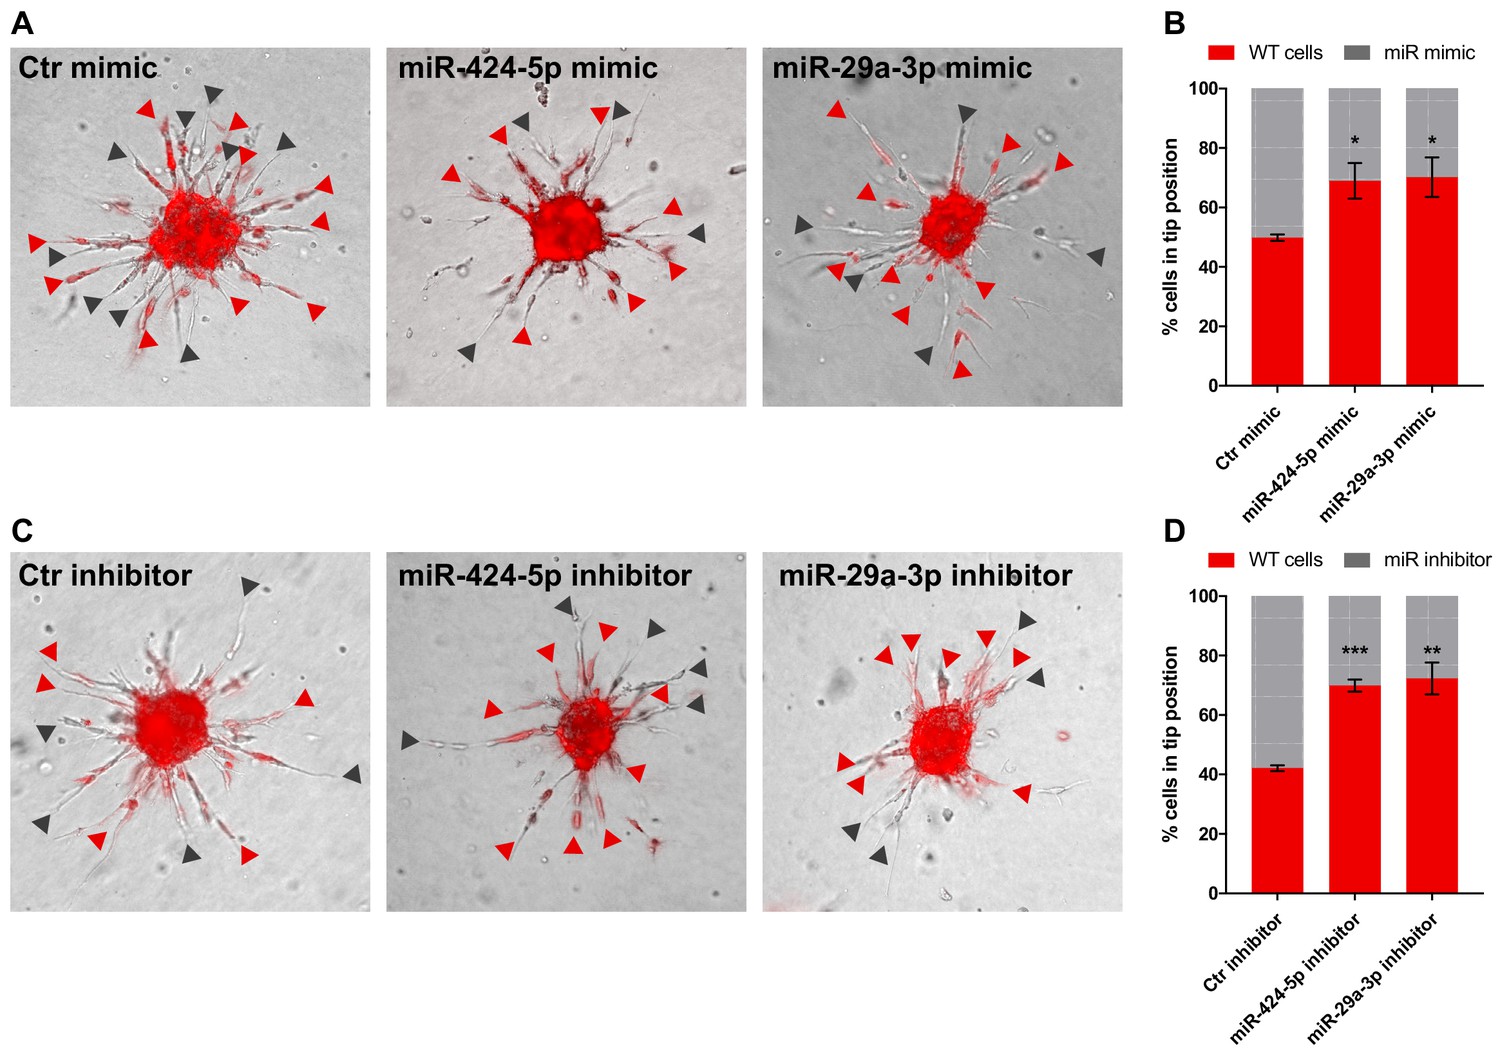
Tip competition assay.
(A) Sprouting assay performed with spheroids composed of 50% cells expressing DsRed and 50% cells transfected with control mimic, miR-424–5p mimic or miR-29a-3p mimic. Red arrowheads indicate the presence of a fluorescent (WT) cell at the tip position; gray arrowheads indicate a transfected cell. (B) Graph representing the percentage of cells occupying the tip position from the assay shown in panel (A). (C, D) same as (A, B) but with miRNA inhibitors. Data are represented as mean ± SEM from n = 2 experiments. ***, p<0.001; **, p<0.01; *, p<0.05.
Figure 7—figure supplement 3
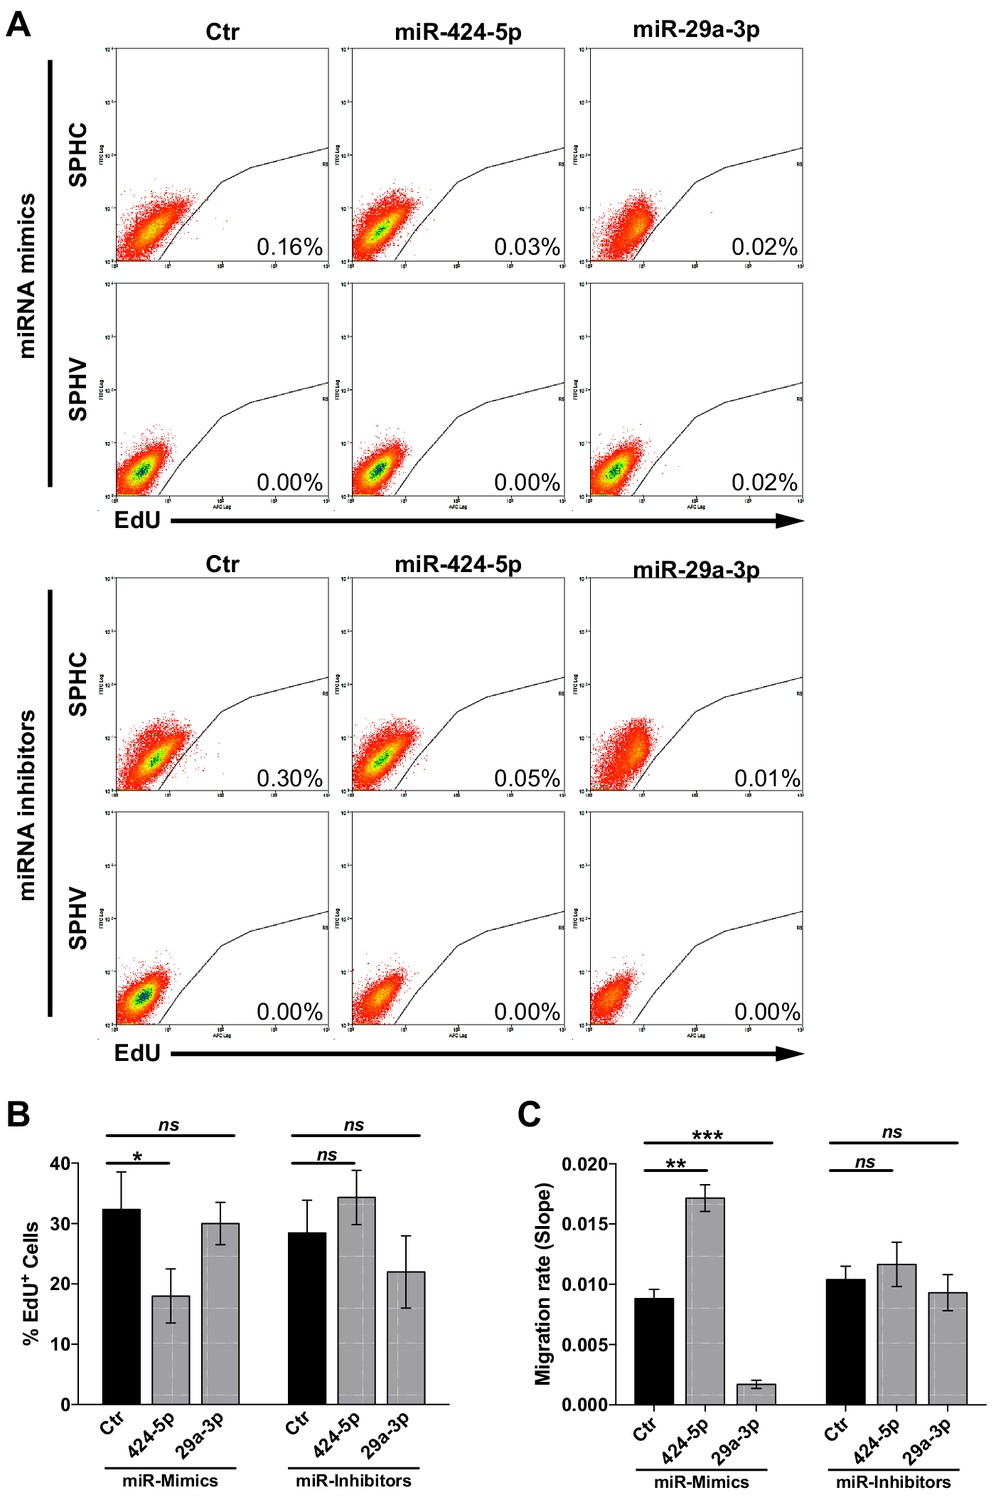
Assessment of VEGF-A-induced cell proliferation and migration upon modulation of miR-424–5p or miR-29a-3p.
(A) Cell proliferation assessed by cytofluorimetric analysis of EdU incorporation into the DNA in control spheroids (SPHC) or VEGF-A-stimulated spheroids (SPHV) generated with ECs transfected with miR-424–5p or miR-29a-3p mimics or inhibitors or their respective controls. Representative plots for n = 3 experiments. (B) Cell proliferation assessed by cytofluorimetric analysis of EdU incorporation into the DNA during cell replication in 2D cultured HUVECs transfected with miR-424–5p or miR-29a-3p mimics or inhibitors, or respective transfection controls. The assay was performed after 18 hr of VEGF stimulation. Data are represented as mean ± SEM from n = 3 experiments. (C) VEGF-induced cell migration of HUVECs transfected with miR-424–5p or miR-29a-3p mimics or inhibitors, or respective transfection controls, assessed by xCELLigence and represented as the slope of the migration curve over a 24 hr experiment. Data are represented as mean ± SEM from n = 3 experiments. ***, p<0.001; **, p<0.01; *, p<0.05; ns, not significant.
Figure 7—figure supplement 4
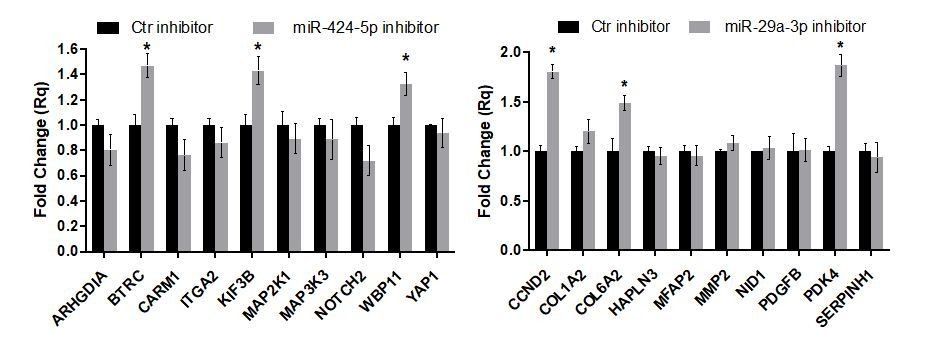
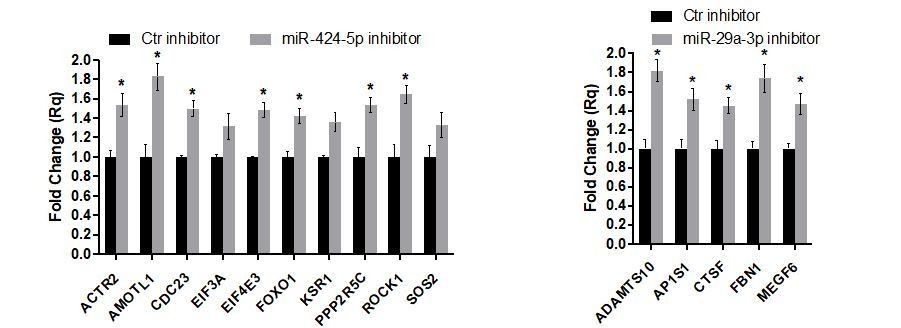
Gene expression analysis of miR-424–5p and miR-29a-3p target genes upon miRNA inhibition.
Real-time PCR assays detecting the expression of miR-424–5p (A) or miR-29a-3p (B) target genes predicted by the network analysis (the same targets as in Figure 7G,H) in EC transfected with the corresponding miRNA inhibitor. Data are represented as mean ± SEM from n = 2 experiments. (C,D) Real-time PCR assays detecting the expression of a different subset of miR-424–5p (C) or miR-29a-3p (D) predicted target genes in EC transfected with the corresponding miRNA inhibitor. Data are represented as mean ± SEM from n = 2 experiments. *, p<0.05.
Figure 8
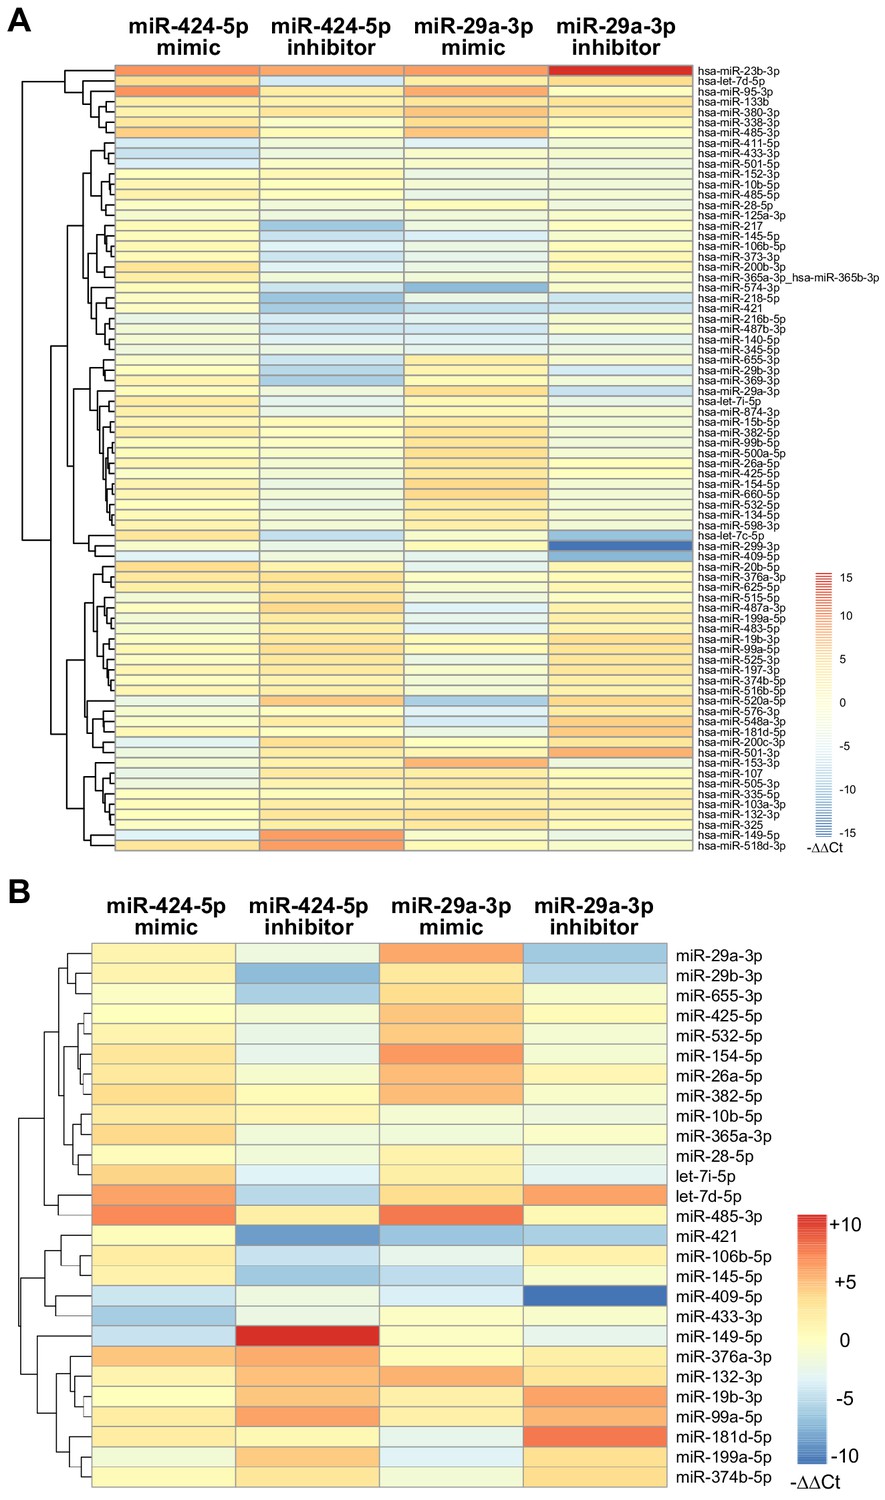
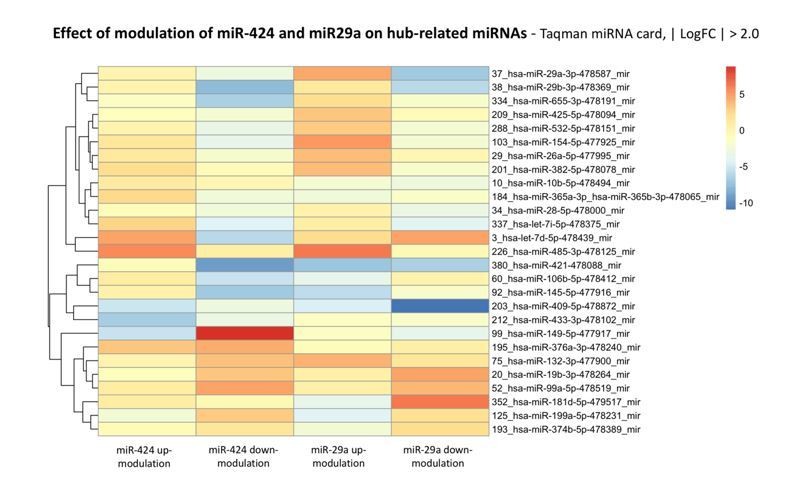
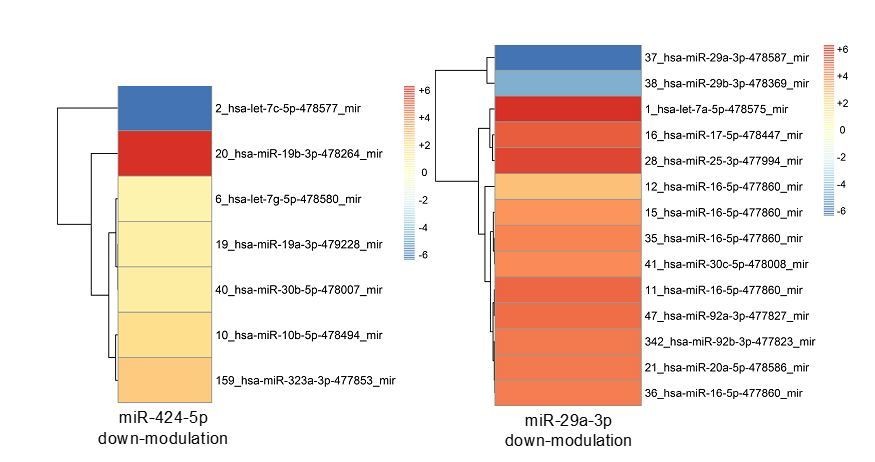
Modulation of miRNA hubs alters network architecture.
(A) Heatmap showing the result of a differential gene expression analysis of a panel of miRNAs upon up- or downmodulation of miR-424–5p or miR-29a-3p. Only miRNAs with |∆∆Ct| > 2 are represented. Color bar indicates –∆∆Ct values. (B) Heatmap showing only those differentially expressed miRNAs that have predicted target genes in common with miR-424–5p or miR-29a-3p. Color bar indicates –∆∆Ct values.
Figure 9
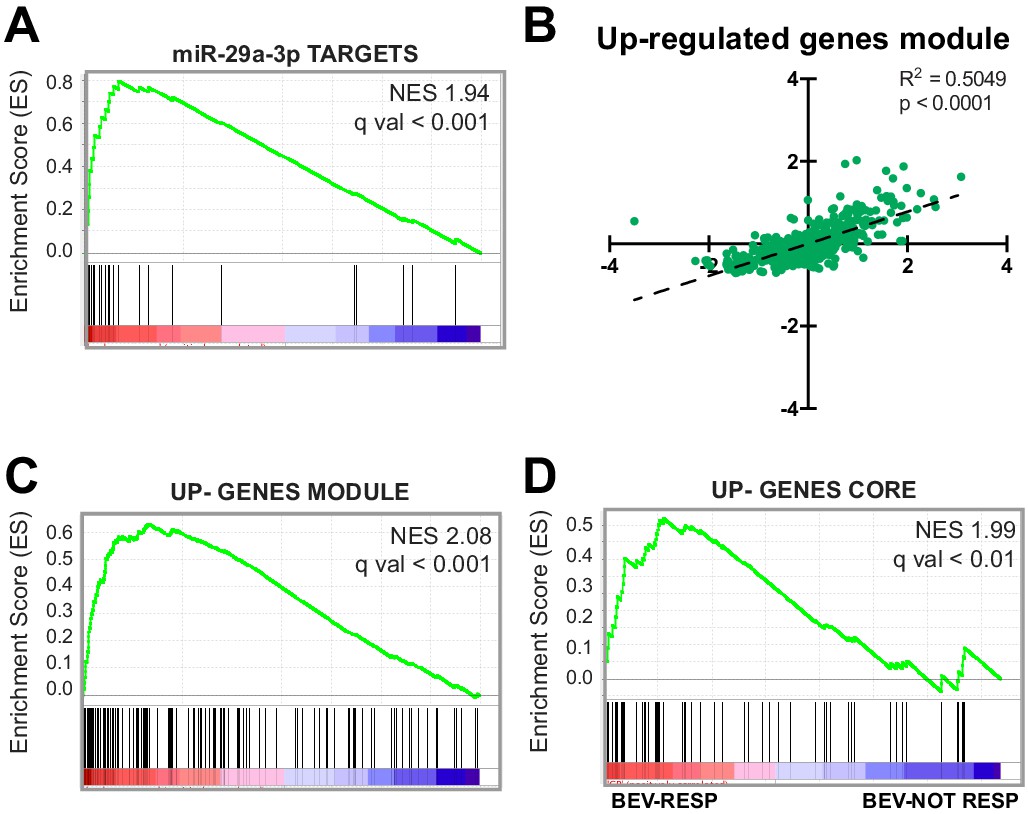
Upregulation of genes that are targeted by miRNAs during SA correlates with tumor angiogenesis.
(A) GSEA plot showing significant positive association for miR-29a-3p target genes in CRC samples stratified by their endothelial score. (B) Scatter plot showing correlation, in CRC samples, between the expression of genes that constitute the upregulated gene module from the network analysis and endothelial score. (C) GSEA plot showing significant positive association for the up-gene module with CRC samples stratified by their endothelial score. (D) GSEA plot showing significant positive association for the upregulated genes core, extracted from panel (B), with a cohort of bevacizumab-responding CRC patients (bev-resp), compared to not-responding patients (bev-not resp). FDR was accepted when q value < 0.05.
-
Figure 9—source data 1
Genes constituting the upregulated gene module and the enrichment core in CRC.
- https://cdn.elifesciences.org/articles/48095/elife-48095-fig9-data1-v1.xlsx
Author response image 1

Author response image 2
Author response image 3

Author response image 4
Author response image 5

Author response image 6
Author response image 7

Author response image 8
Author response image 9
Author response image 10
Author response image 11
Author response image 12

Additional files
-
Supplementary file 1
Key resources table.
- https://cdn.elifesciences.org/articles/48095/elife-48095-supp1-v1.docx
-
Supplementary file 2
Real-time PCR assays list.
- https://cdn.elifesciences.org/articles/48095/elife-48095-supp2-v1.xlsx
-
Transparent reporting form
- https://cdn.elifesciences.org/articles/48095/elife-48095-transrepform-v1.docx
Download links
A two-part list of links to download the article, or parts of the article, in various formats.
Downloads (link to download the article as PDF)
Open citations (links to open the citations from this article in various online reference manager services)
Cite this article (links to download the citations from this article in formats compatible with various reference manager tools)
A regulatory microRNA network controls endothelial cell phenotypic switch during sprouting angiogenesis
eLife 9:e48095.
https://doi.org/10.7554/eLife.48095


