A role for phagocytosis in inducing cell death during thymocyte negative selection
- University of California, Berkeley, United States
Figures
Figure 1 with 2 supplements
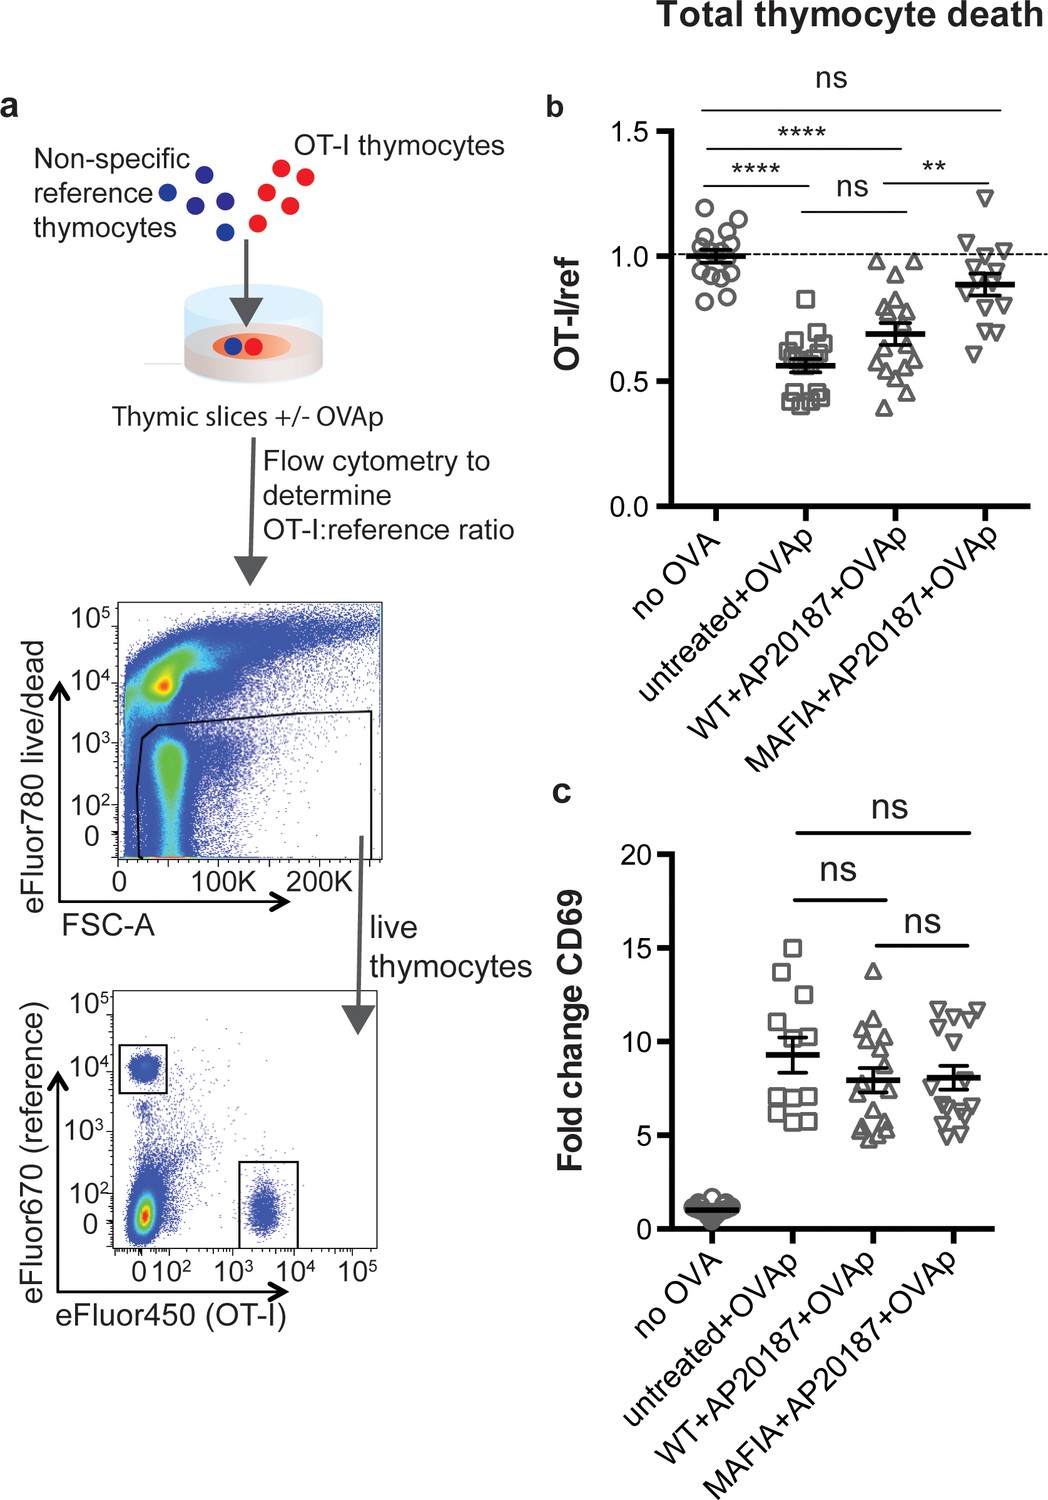
Depletion of phagocytes inhibits negative selection without dampening antigen recognition.
(a) Strategy to quantify negative selection: labeled OT-I and reference thymocytes (either wild type or F5 TCR transgenic) were overlaid onto thymic slices with or without OVA peptide, cultured for 16 hr, and then dissociated for analysis by flow cytometry. Lower panels show the flow cytometry gating strategy used to quantify live OT-I and reference thymocytes. (b–c) For depletion of phagocytes, WT or MAFIA thymic slices were treated with AP20187 and cultured for an additional 16 hr prior to the addition of thymocytes and peptide. (b) Thymocyte death displayed as the ratio of live OT-I thymocytes relative to live reference thymocytes present within the slice. We further normalized the ratios of OT-I:reference thymocytes in each experiment so that the average of the corresponding ‘no OVA’ samples was 1.0. (c) Fold change in expression of the activation marker CD69 by surviving OT-I thymocytes displayed as Mean Fluorescence Intensity (MFI) normalized so that the average MFI of the corresponding ‘no OVA’ samples is set to 1.0. ns not significant (p>0.05), **p<0.01, ****p<0.0001 (one-way ANOVA with Bonferroni’s correction with a 95% confidence interval) Data are pooled from three independent experiments, with mean and SEM of n = 12–39 total slices per condition, where each dot represents an individual slice.
Figure 1—figure supplement 1

GFP-expressing cells in the LysMGFP thymus include F4/80hi macrophages as well as a subset of CD11chi DCs.
(a) Major populations of thymic myeloid cells (gated on live singlets with high forward and side scatter) include F4/80hi macrophages (green), CD11chi DCs (blue), and F4/80-intermediate CD11c-intermediate eosinophils (orange). Gating strategy shown was used for all experiments where thymic myeloid cells were analyzed. (b) Expression of GFP in thymic myeloid cells in LysMGFP mice (black), with WT controls shown in gray. Data are representative of n = 2 mice per condition.
Figure 1—figure supplement 2
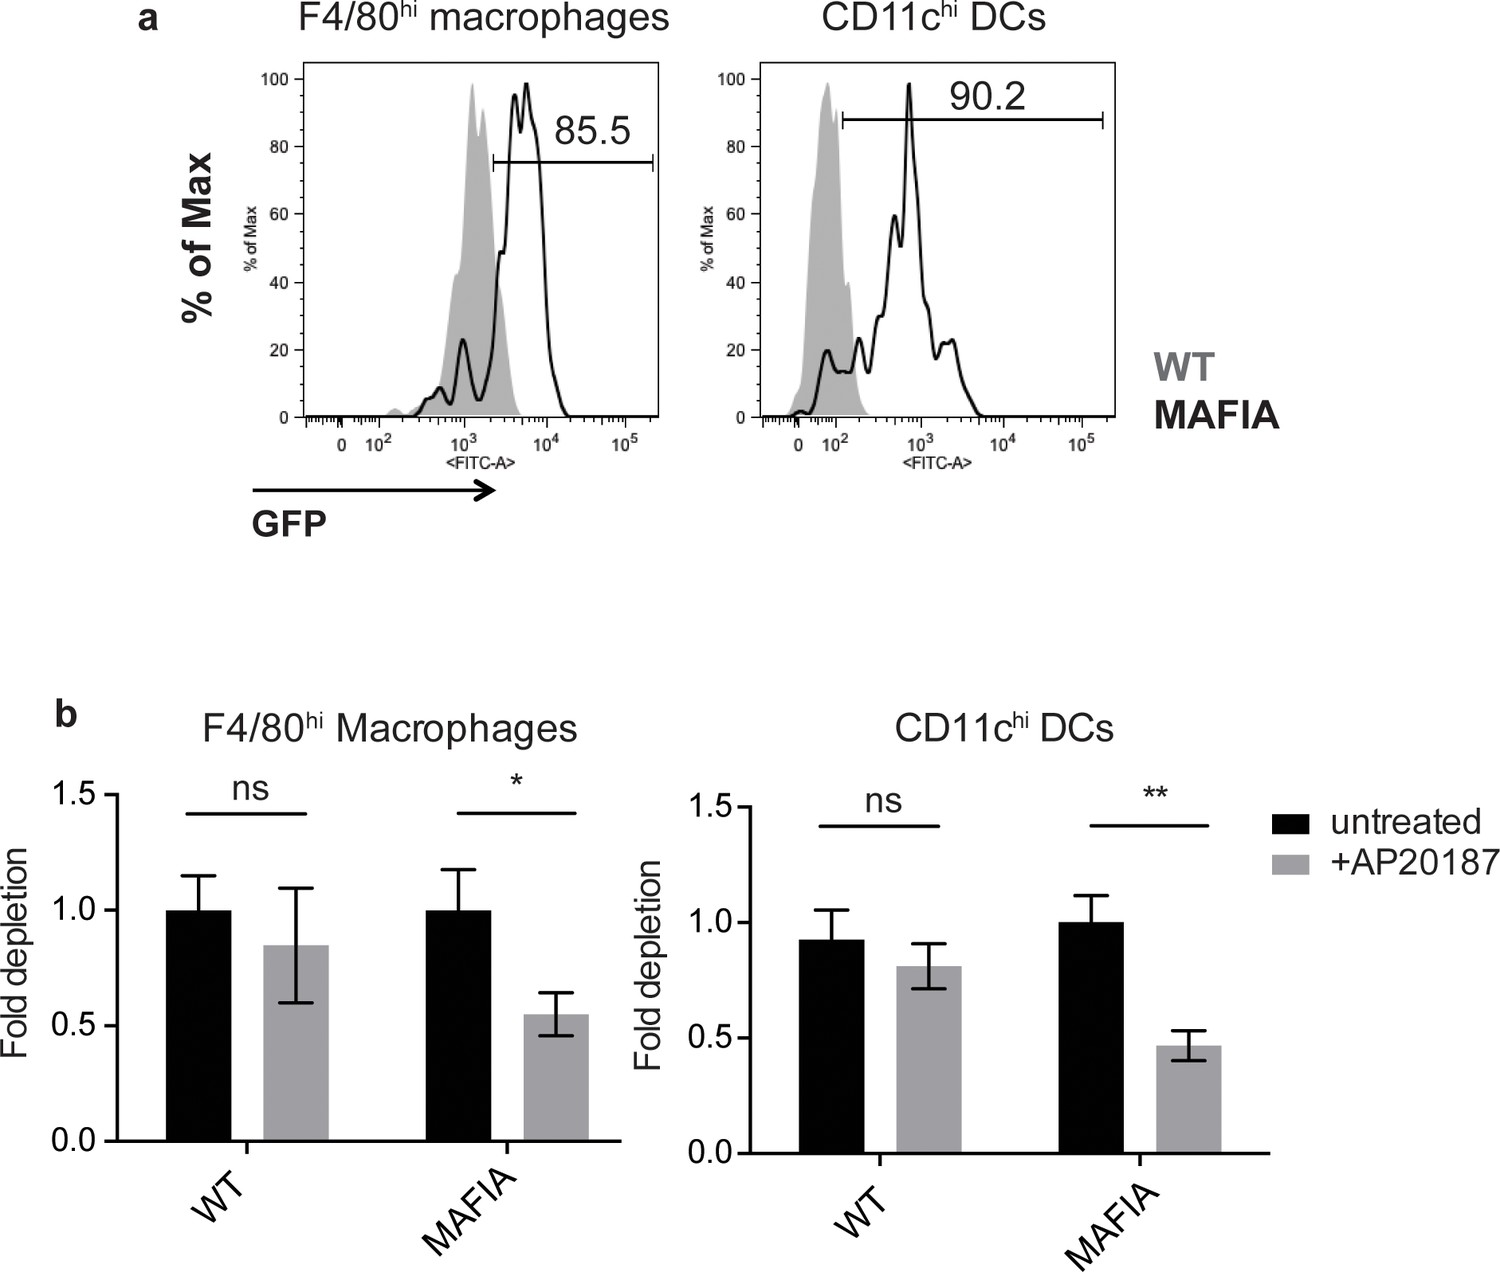
Depletion of phagocytes in MAFIA thymic slices.
(a) Expression of the MAFIA transgene in F4/80hi macrophages (left) and CD11chi DCs (right). (b) WT or MAFIA thymic slices were treated with AP20187 or left untreated for 16–18 hr. Slices were then dissociated and proportions of live F4/80hi macrophages (left) or CD11chi DCs (right) remaining in the slice were determined by flow cytometry. Fold depletion of macrophages (left) or DCs (right) upon treatment displayed as the proportion of live phagocytes present, normalized to untreated controls. Data are representative of 3 independent experiments, with mean and SEM of n = 6 total slices shown. ns not significant (p>0.05), *p<0.05, **p<0.01 (two-tailed unpaired Student’s t-test with 95% confidence interval).
Figure 2
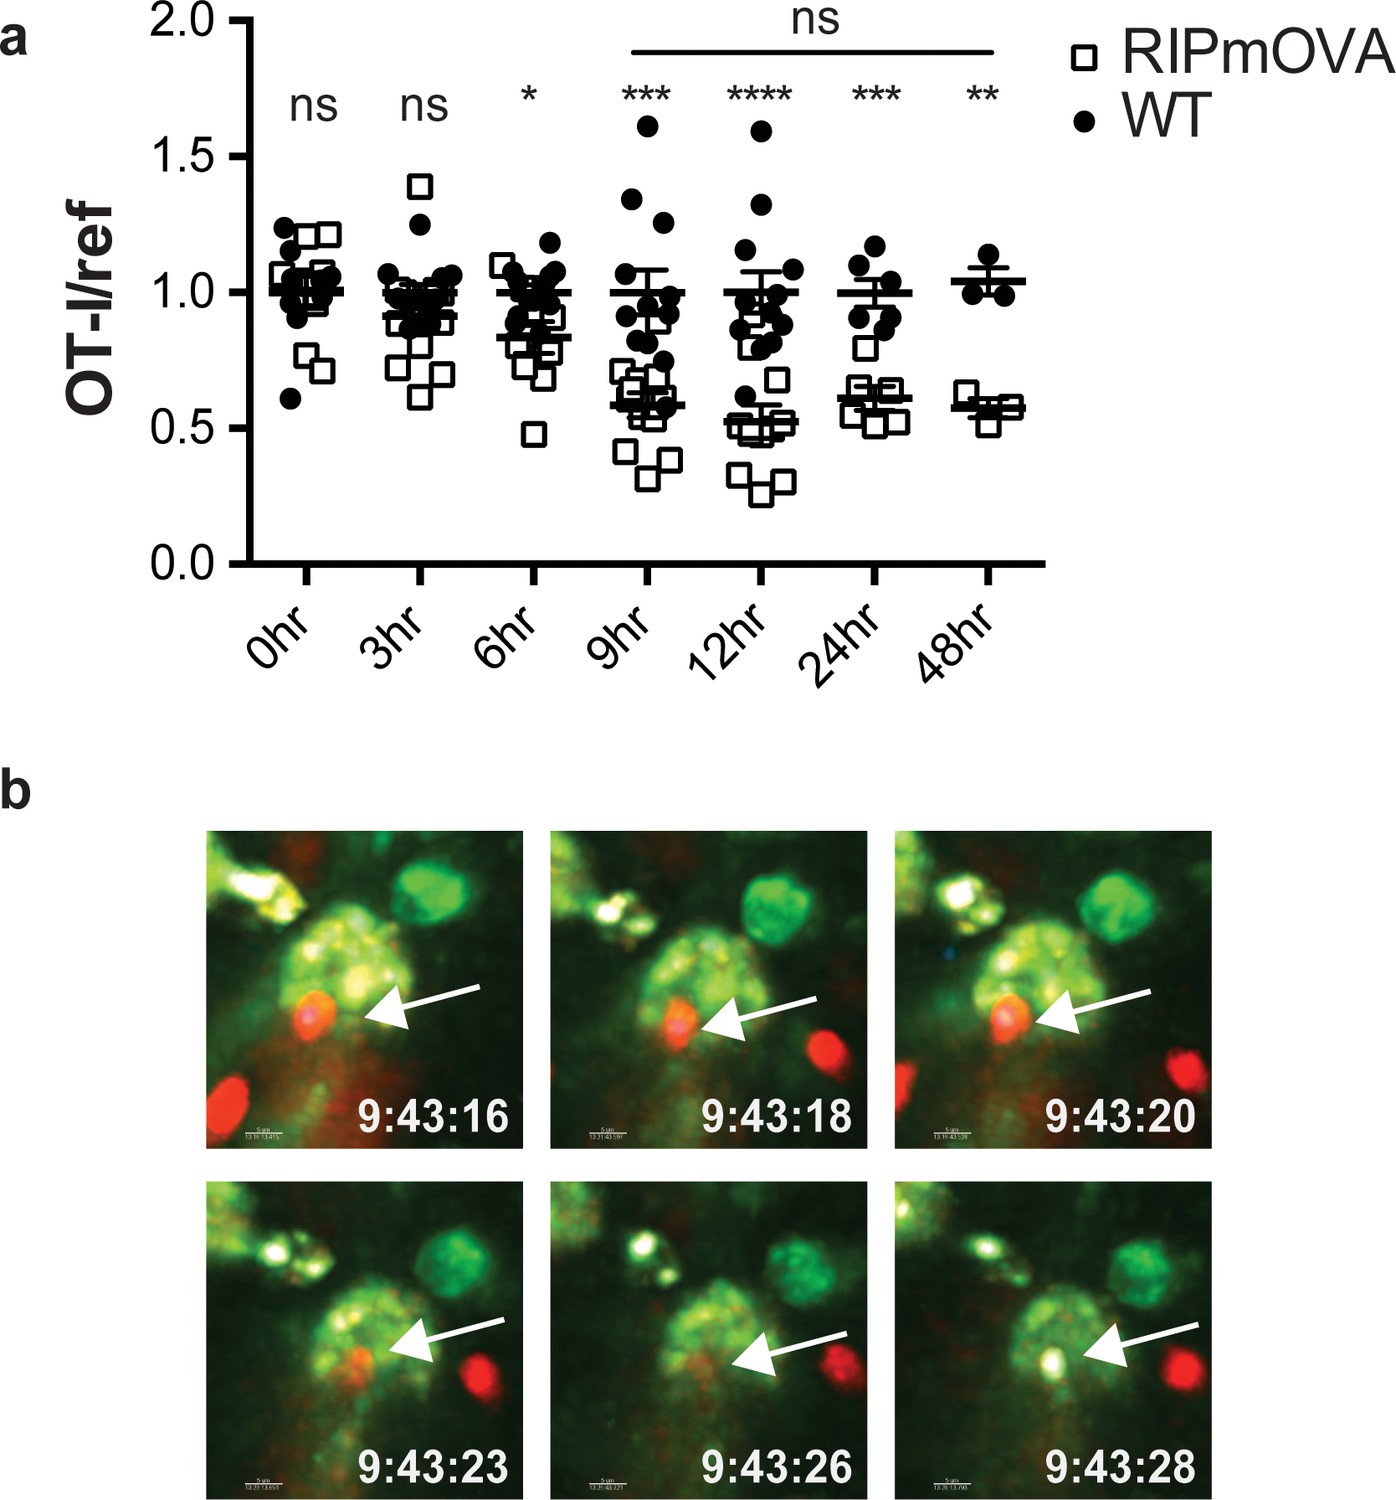
Thymocyte death and phagocytosis during negative selection to tissue-restricted antigen.
(a) Negative selection on RIPmOVA slices (open squares), displayed as the ratio of live OT-I thymocytes relative to live reference thymocytes present within the slice, normalized to no antigen controls (black squares). Data are pooled from 4 (0, 3, 6, 9, and 12 hr timepoints), 2 (24 hour timepoint), or 1 (48 hour timepoint) experiments, with mean and SEM of n = 3 (48hr WT and RIPmOVA), 6 (24hr WT and RIPmOVA), 9 (0hr WT and RIPmOVA), 7 (6hr RIPmOVA), 11 (12hr WT), 12 (3hr and 9 hr WT and RIPmOVA, 6 hr and 12 hr WT) total slices per condition, respectively, where each dot represents an individual slice. ns not significant (p>0.05), *p<0.05, **p<0.01, ***p<0.001, ****p<0.0001. Unpaired two-tailed Student’s t-test of WT vs RIPmOVA for each timepoint, or two-way ANOVA with 95% confidence interval with Tukey’s multiple comparisons test to compare RIPmOVA samples across timepoints (horizontal line). (b) Still images from a time-lapse series showing an example of OT-I thymocyte death. OT-I thymocytes were depleted of mature CD8 SP and labeled with Hoechst and SNARF before overlaying on LysMGFP RIPmOVA thymic slices. Slices were imaged by two-photon scanning laser microscopy. A 30 min movie was recorded in the medulla, with the time elapsed since thymocyte entry into the slice shown in white. Arrows indicate the position of the dying thymocyte.
Figure 3
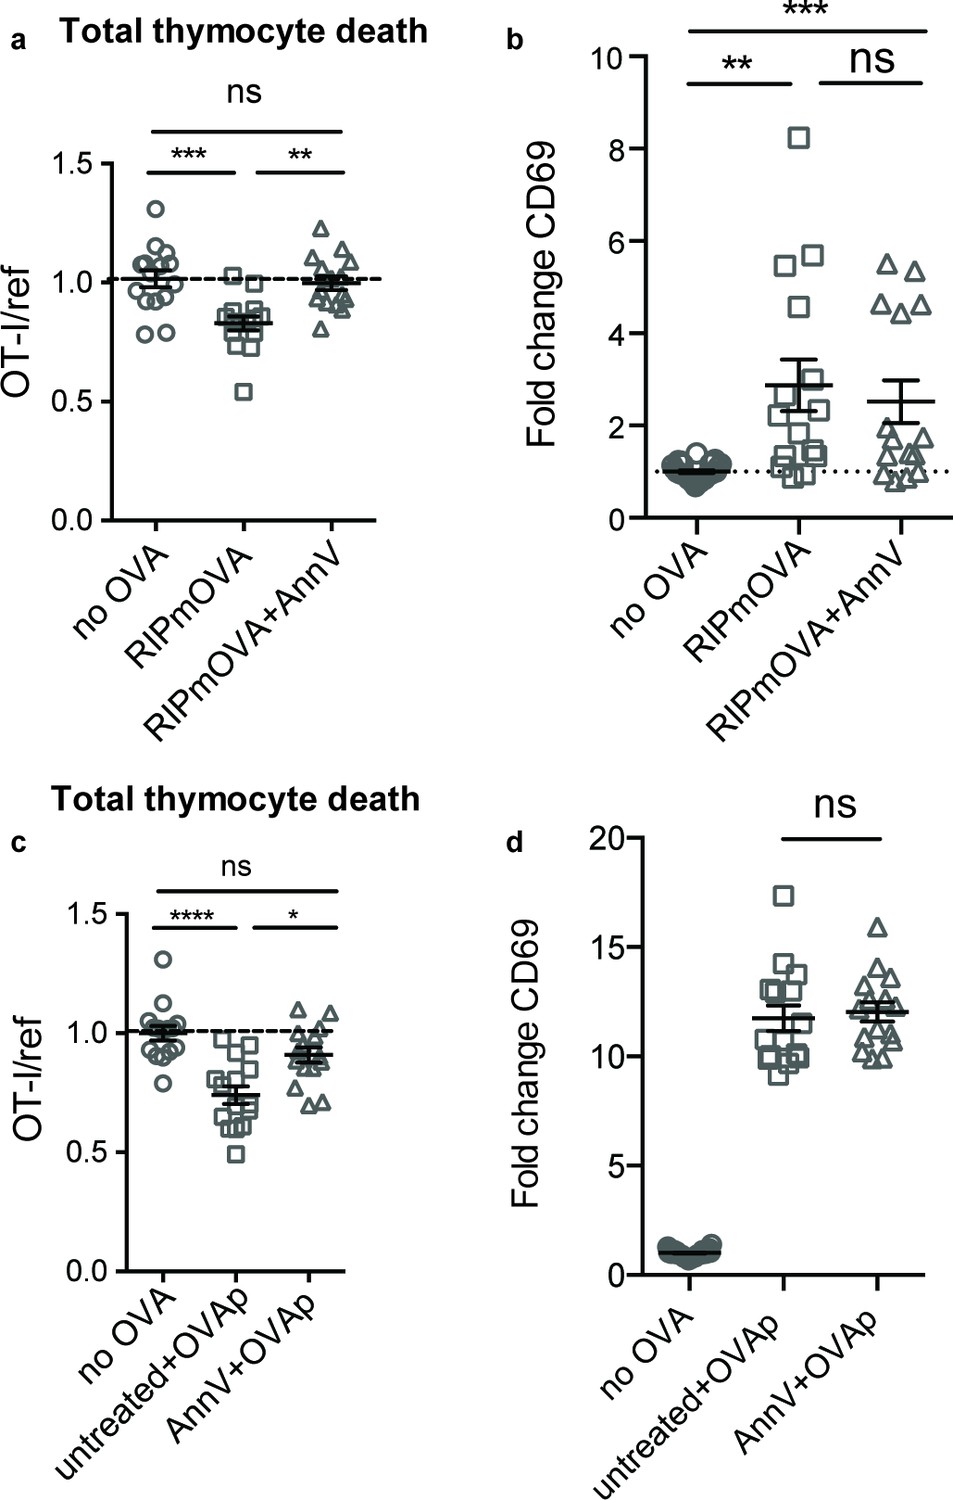
Phagocyte killing of autoreactive thymocytes is mediated by phosphatidylserine receptors.
(a-d) OT-I and reference thymocytes in AnnV buffer with or without AnnV were overlaid onto RIPmOVA slices (a,b) or WT slices treated with OVAp (c,d). Slices were then treated with AnnV and harvested 16 hr later for flow cytometric analysis. (a,c) Negative selection displayed as the ratio of live OT-I thymocytes relative to live reference thymocytes, normalized to no antigen controls. (b,d) Fold change in expression of the activation marker CD69 by surviving OT-I thymocytes displayed as Mean Fluorescence Intensity (MFI) normalized so that the average MFI of the corresponding ‘no OVA’ samples is set to 1.0. ns not significant (p>0.05), **p<0.01, ***p<0.001, ****p<0.0001 (one-way ANOVA with Bonferroni’s correction with a 95% confidence interval). Data are pooled from three independent experiments, with mean and SEM of n = 15–30 total slices per condition, where each dot represents an individual slice.
Figure 4 with 1 supplement
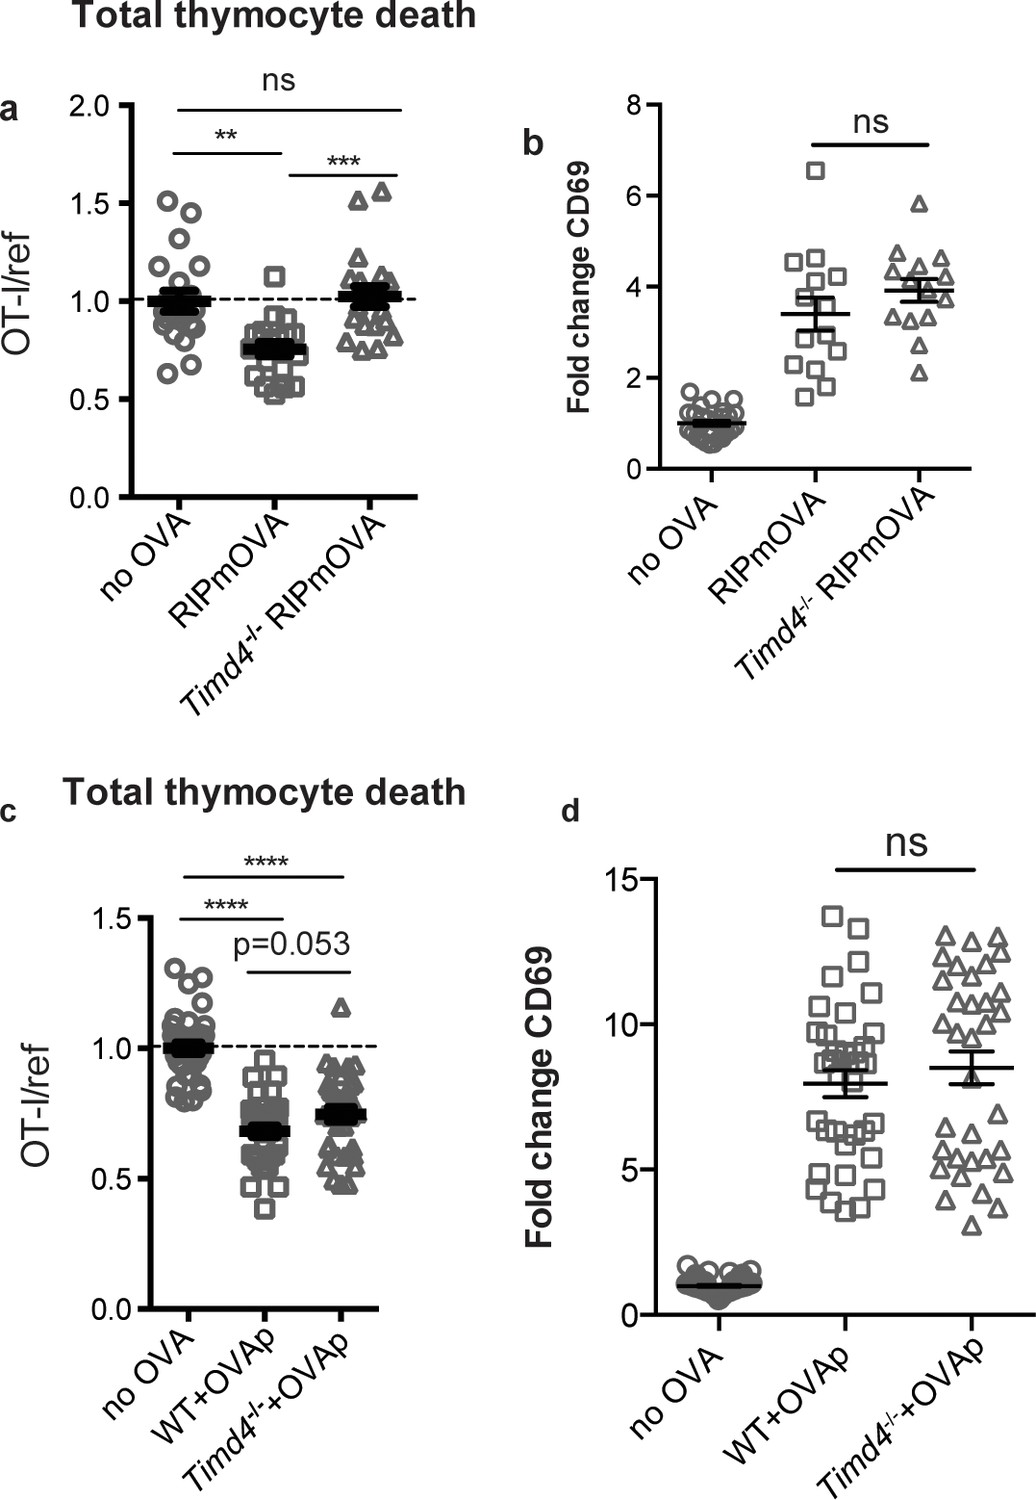
The phosphatidylserine receptor Tim-4 promotes negative selection to tissue-restricted antigens.
(a-d) OT-I and reference thymocytes were overlaid onto WT or Timd4-/- thymic slices with or without the RIPmOVA transgene. (a,b), or with or without addition of OVAp (c,d), and slices were dissociated and analyzed by flow cytometry 16 hr later. (a,c) Negative selection displayed as the ratio of surviving OT-I thymocytes relative to reference thymocytes, normalized to no antigen controls. (b,d) Fold change in expression of the activation marker CD69 by surviving OT-I thymocytes displayed as Mean Fluorescence Intensity (MFI) normalized so that the average MFI of the corresponding ‘no OVA’ samples is set to 1.0. ns not significant (p>0.05), **p<0.01, ***p<0.001, ****p<0.0001 (one-way ANOVA with Bonferroni’s correction with 95% confidence interval) Data are pooled from 4 (a,b) or 7 (c,d) independent experiments, with mean and SEM of n = 15–20 (a,b) or 35 (c,d) total slices per condition, where each dot represents an individual slice.
Figure 4—figure supplement 1

Normal number and cell-surface phenotype of phagocytes in the thymus of Timd4-/- mice.
(a) Expression of Tim-4 by WT F4/80hi macrophages (left) and CD11chi DCs (right) shown in blue, with Timd4-/- shown in red for comparison. (b,c) Proportions (b) or total number per thymus (c) of macrophages and DCs in age and sex-matched WT and Timd4-/- mice. Data are representative of (a,b) or compiled from (c) n = 5 mice per genotype, where each dot represents an individual mouse. ns not significant (p>0.05) (two-tailed Student’s t-test with 95% confidence interval) (d) Expression of markers associated with antigen presentation and costimulation by WT (blue) and Timd4-/- thymic F4/80 hi macrophages and CD11c hi DCs. Data are representative of three independent experiments.
Figure 5 with 1 supplement
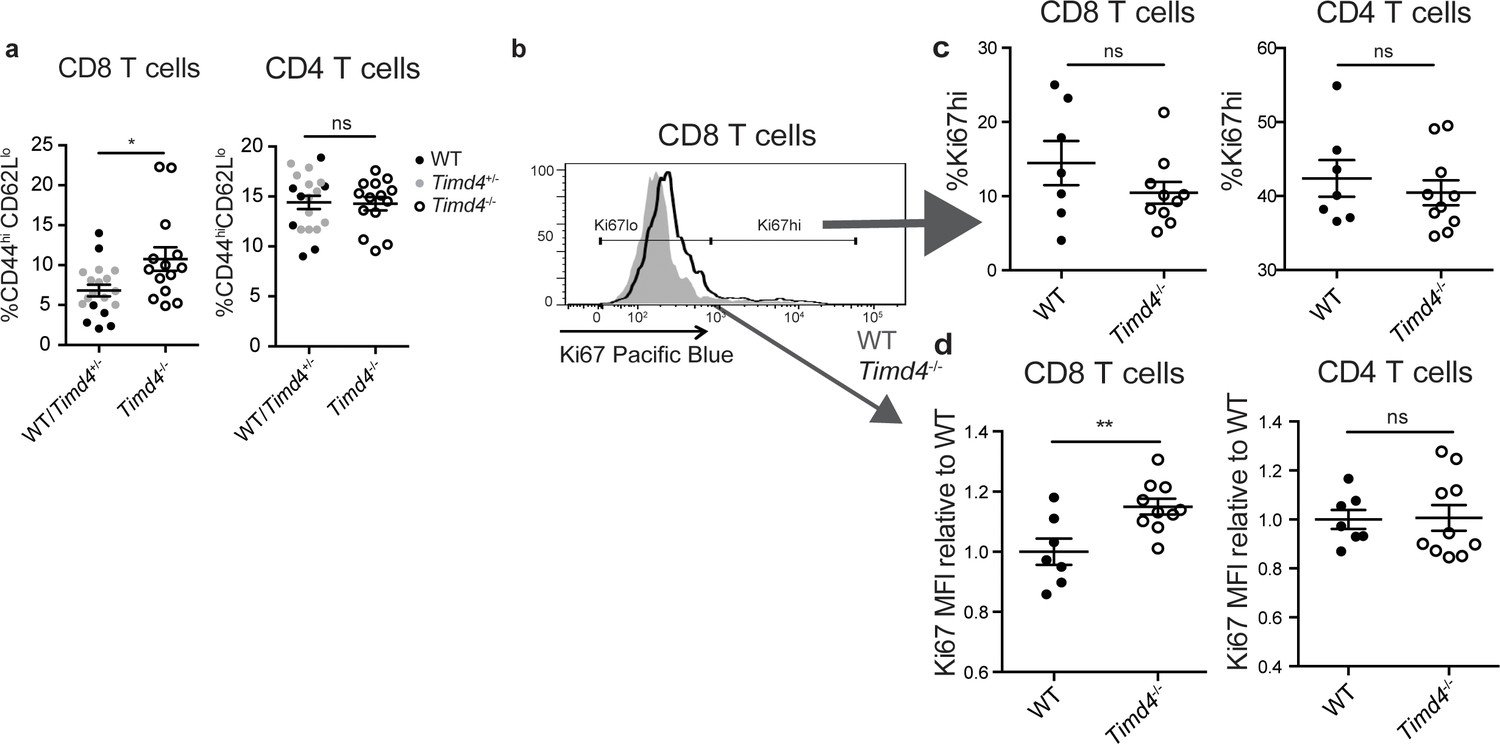
CD8 SP thymocytes that develop in a Tim4-deficient environment show signs of increased self-reactivity.
(a) Percent of CD8 (left) or CD4 (right) T cells with an activated phenotype (CD44hi CD62Llo), isolated from the spleens of age and sex-matched WT and Timd4-/- mice, or Timd4-/- and littermate Timd4+/- controls. Data are compiled from n = 14 Timd4-/- mice and n = 18 WT or Timd4+/- controls, where each dot represents an individual mouse. (b–d) Thymocytes from age and sex-matched Timd4-/- or WT mice were injected i.v. into Tcra-/- hosts. Blood was collected 9–10 weeks post-transfer and analyzed by flow cytometry. (b) Ki67 expression of CD8 T cells derived from Timd4-/- or WT mice. (c) Percent of CD8 or CD4 T cells expressing high levels of Ki67. (d) Relative levels of Ki67 within resting (Ki67lo) WT or Timd4-/- CD8 or CD4 T cells, represented as MFI normalized to WT levels, where each dot represents an individual mouse. Data are representative of (b) or pooled from (c,d) two independent experiments, with mean and SEM of n = 7 (WT) or 10 (Tim4-/-). ns not significant (p>0.05), *p<0.05, **p<0.01 (two-tailed Student’s t-test with 95% confidence interval).
Figure 5—figure supplement 1
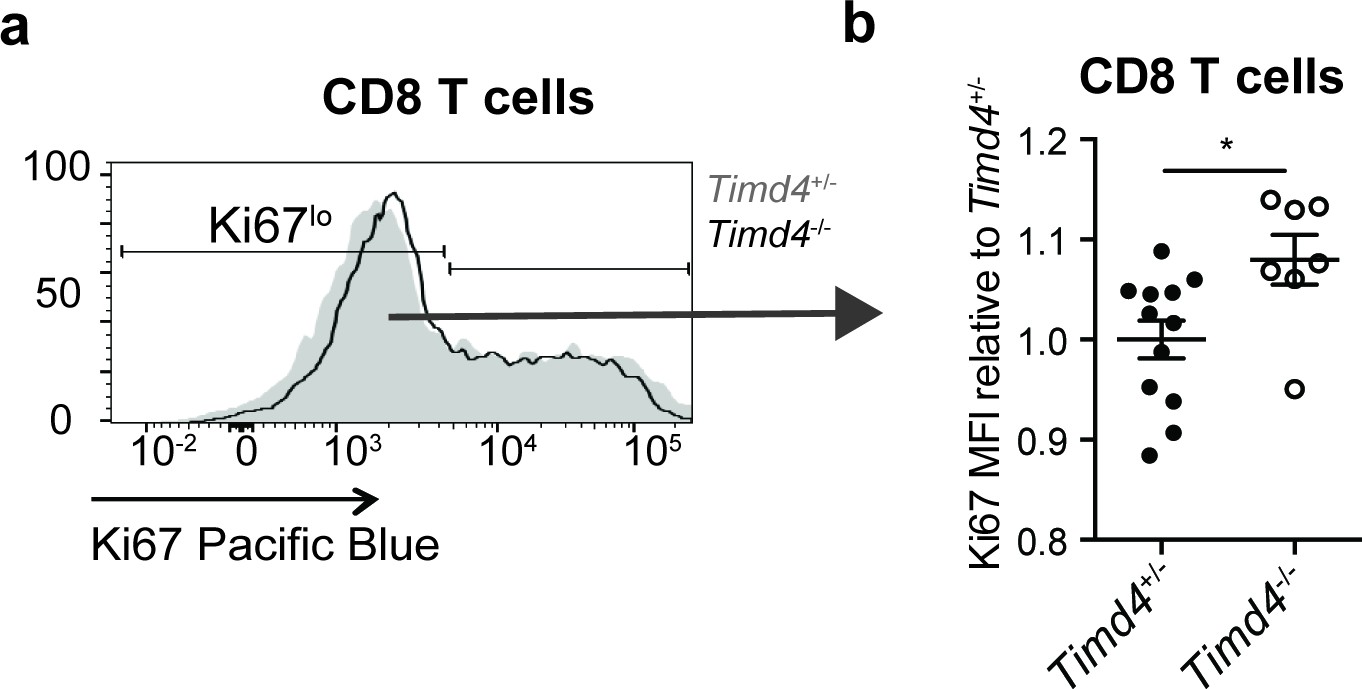
Elevated levels of Ki67 in Timd4-/- CD8 T cells at steady-state.
(a) Ki67 expression of CD8 T cells from blood of 4 week old Timd4-/- or Timd4+/- littermate controls. (b) Relative levels of Ki67 within resting (Ki67lo) Timd4+/- or Timd4-/- CD8 T cells, represented as MFI normalized to levels in Timd4+/- controls, where each dot represents an individual mouse. Data are representative of (a) or pooled from (b) one experiment, with mean and SEM of n = 11 (Timd4+/-) or 7 (Timd4-/-), where each dot represents an individual mouse. *p<0.01 (two-tailed Student’s t-test with 95% confidence interval).
Figure 6 with 2 supplements
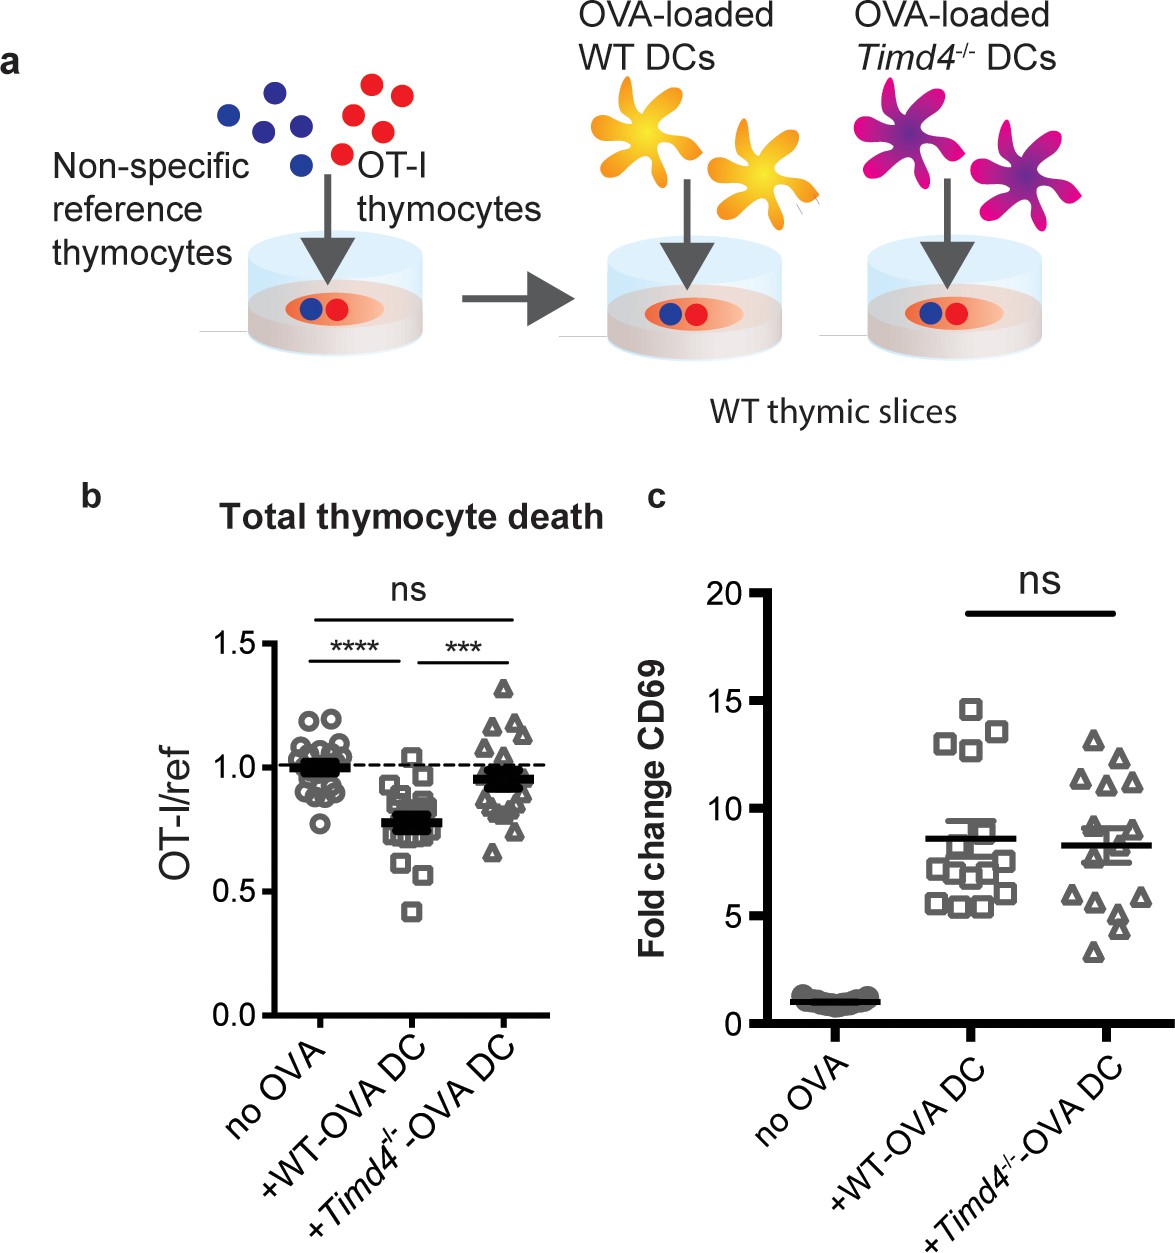
Peptide presentation by phagocytes promotes efficient negative selection.
(a) Schematic of the experimental setup: OT-I and reference thymocytes were overlaid onto WT thymic slices onto which OVA-loaded or unloaded WT or Tim-4-/- BMDCs were added. Slices were dissociated and analyzed by flow cytometry 16 hr later. (b) Negative selection displayed as the ratio of live OT-I thymocytes relative to live reference thymocytes, normalized to no antigen controls. (c) Antigen recognition of surviving OT-I thymocytes displayed as Mean Fluorescence Intensity (MFI) of the activation marker CD69. Data are pooled from 4 (b) or 3 (c) independent experiments, with mean and SEM of n = 15–20 total slices per condition, where each dot represents an individual slice. ns not significant (p>0.05), ***p<0.001, ****p<0.0001 (one-way ANOVA with Bonferroni’s correction with 95% confidence interval).
Figure 6—figure supplement 1
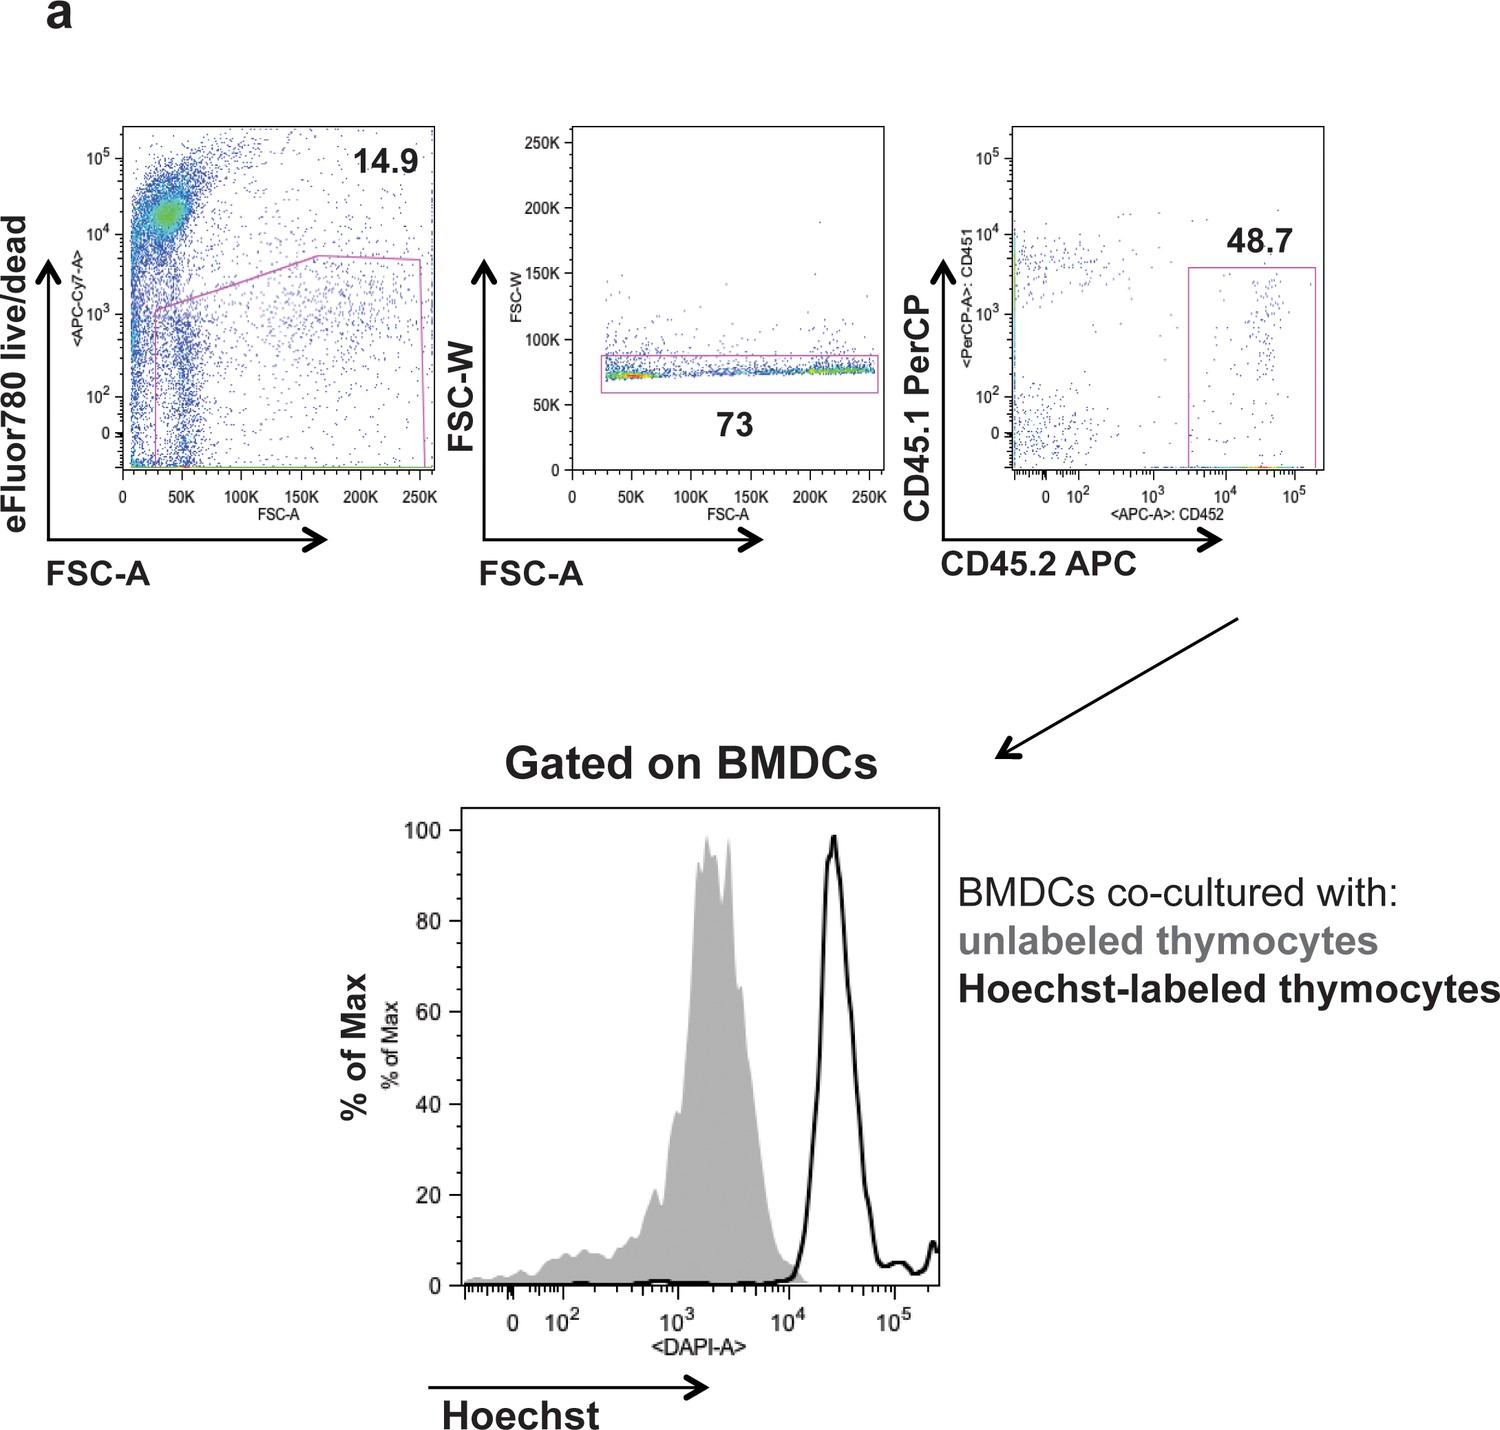
Bone marrow-derived dendritic cells are phagocytic.
Hoechst-labeled or unlabeled CD45.1 OT-I thymocytes were cultured in vitro for 16 hr with CD45.2 BMDCs. Accumulation of Hoecsht dye in BMDCs (gated on live, CD45.2+, singlets) cultured with unlabeled (gray) or Hoecsht-labeled (black) thymocytes.
Figure 6—figure supplement 2
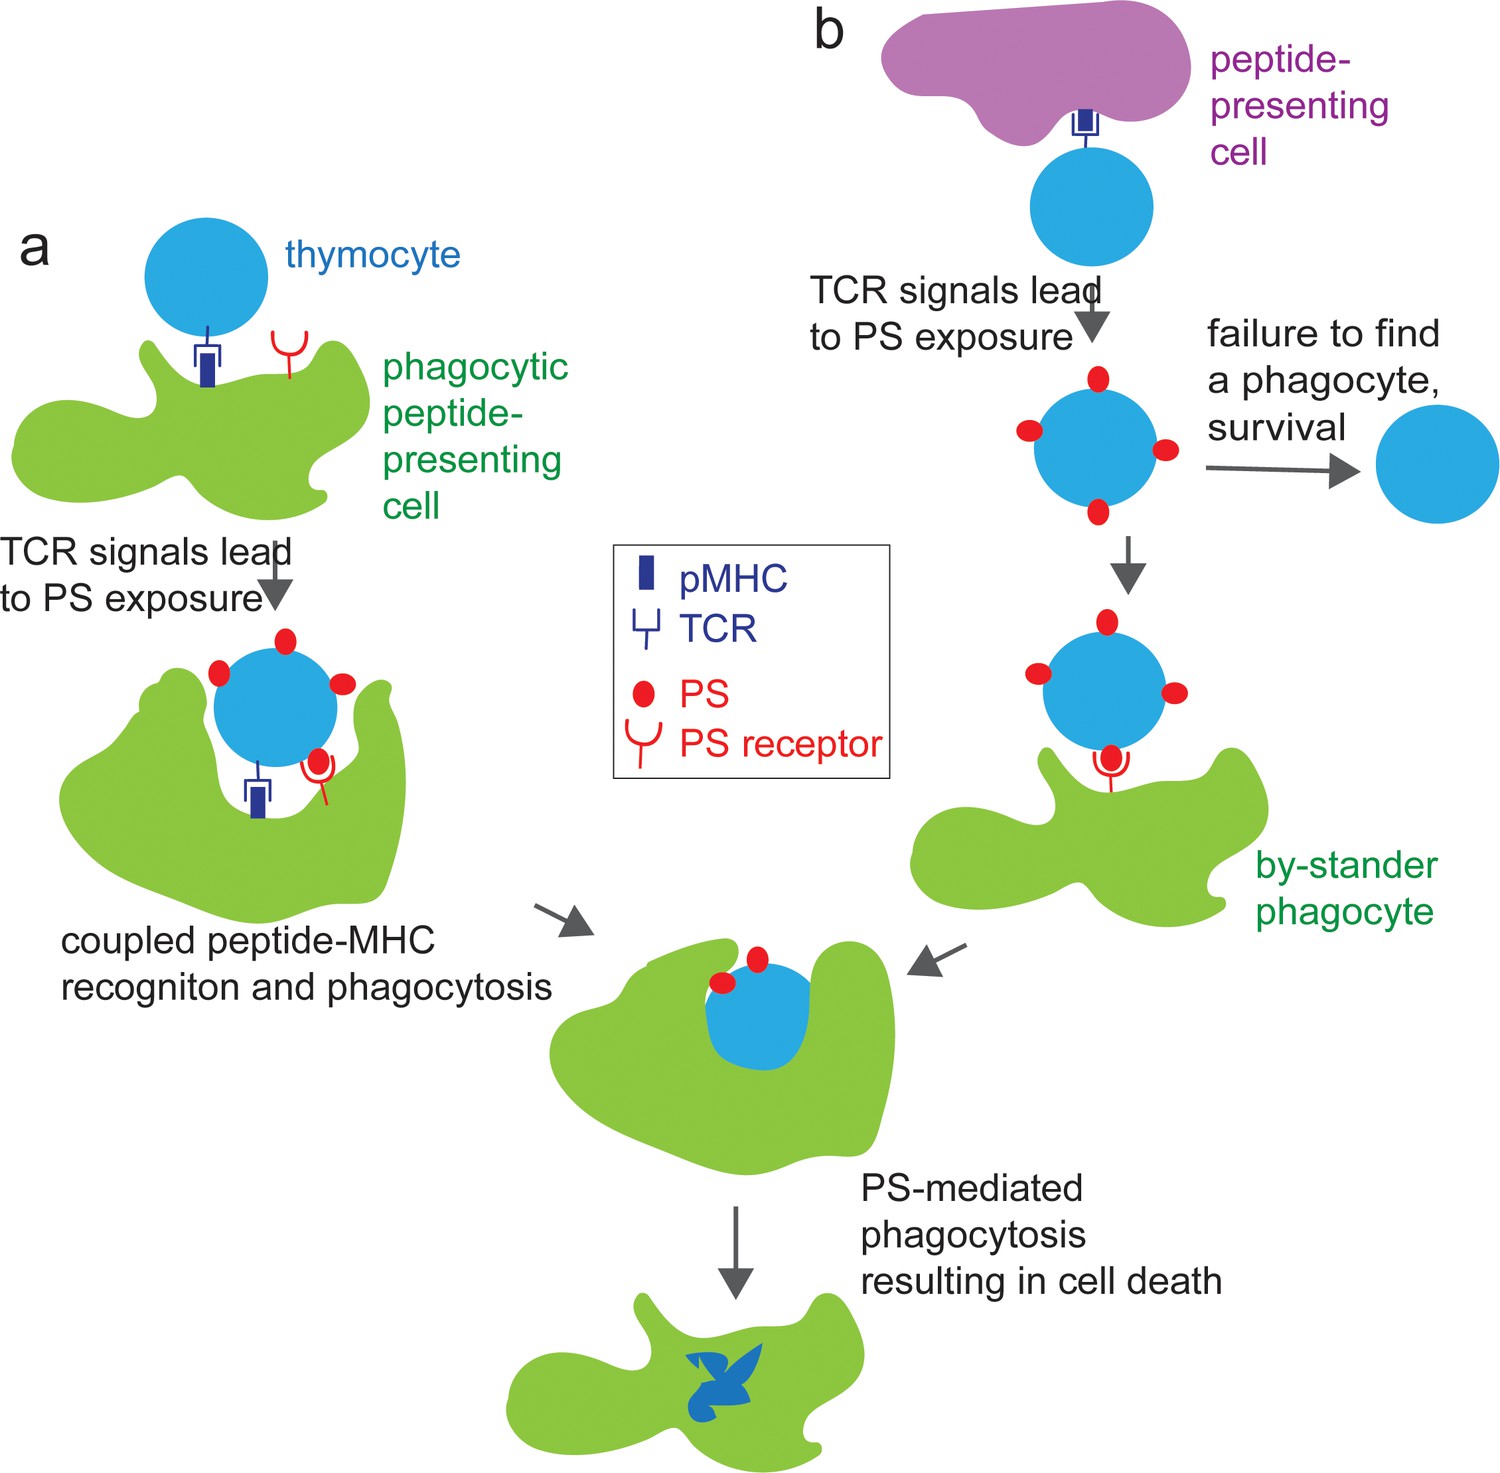
Model for the role of phagocytes in inducing cell death during negative selection.
In the first step, a thymocyte encounters a high affinity self-peptide-MHC ligand (pMHC, dark blue rectangles) on a peptide presenting cell, leading to the exposure of phosphatidyl serine (PS, red ovals) on the cell surface. In a second step, recognition of the autoreactive thymocyte via PS-receptors on a phagocyte leads to uptake and death of the thymocyte. In (a) the same cell both presents the self-peptide and phagocytoses the autoreactive thymocyte, leading to efficient negative selection. In (b), the thymocyte encounters peptide on a non-phagocytic cell, and requires a subsequent interaction with a phagocyte in order to mediate its death. Thymocytes that fail to subsequently interact with a phagocyte may recover and survive, leading to less efficient negative selection.
Author response image 1

No significant difference in quantitation of negative selection when F5 versus WT thymocytes are used as an irrelevant reference control.
OT-I and either F5 or WT thymocytes were overlaid onto WT thymic slices with or without addition of OVA peptide. 16 hours later, thymic slices were harvested for flow cytometric analysis. Negative selection is displayed as the ratio of live OT-I thymocytes relative to live F5 or WT reference thymocytes, as indicated, normalized to no OVA controls. ns not significant (p<0.05).
Author response image 2

Depletion strategy used for experiments in Figure 2B and supplemental videos.
(a) Expression of β7 integrin on the indicated populations of increasing maturity (Hogquist et al., 2015) in wild type and OT-I TCR transgenic thymocytes. (b) CD4 vs. CD8 expression on OT-I thymocytes before and after depletion of β7 integrin expressing cells.
Author response image 3
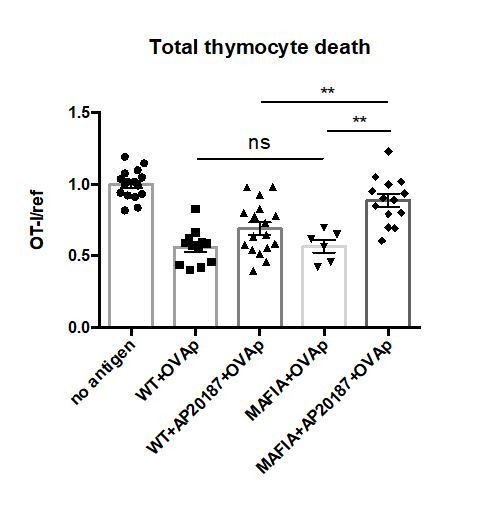
No significant difference in negative selection on untreated WT versus MAFIA thymic slices.
WT or MAFIA thymic slices were cultured with or without AP20187 for 16 hours. OT-I and reference thymocytes (either wild type or F5 TCR transgenic) were then overlaid onto the thymic slices with or without OVA peptide, and dissociated for analysis by flow cytometry after 16 hours of culture. Thymocyte death is displayed as the ratio of live OT-I thymocytes relative to live reference thymocytes present within the slice, normalized to the average ratio on no antigen control slices. ns not significant (p>0.05), **p<0.01, (Unpaired two-tailed t test). Data are pooled from 3 independent experiments with mean and SEM of n=16 total slices per condition (except for MAFIA+OVAp condition, n=6), where each dot represents an individual slice.
Videos
Video 1
Example 1 of thymocyte death occurring concurrently with phagocytosis.
OT-I thymocytes were depleted of mature CD8 SP and double labeled with Hoechst and SNARF before overlaying on LysMGFP RIPmOVA thymic slices. Slices were imaged by two-photon scanning laser microscopy at 9.5 hr after thymocyte addition to the slice.
Video 2
Example 2 of thymocyte death occuring concurrently with phagocytosis.
Additional files
Download links
A two-part list of links to download the article, or parts of the article, in various formats.
Downloads (link to download the article as PDF)
Open citations (links to open the citations from this article in various online reference manager services)
Cite this article (links to download the citations from this article in formats compatible with various reference manager tools)
A role for phagocytosis in inducing cell death during thymocyte negative selection
eLife 8:e48097.
https://doi.org/10.7554/eLife.48097


