Rhodoquinone biosynthesis in C. elegans requires precursors generated by the kynurenine pathway
- University of Toronto, Canada
- Phenalysys Inc, Canada
Figures
Figure 1
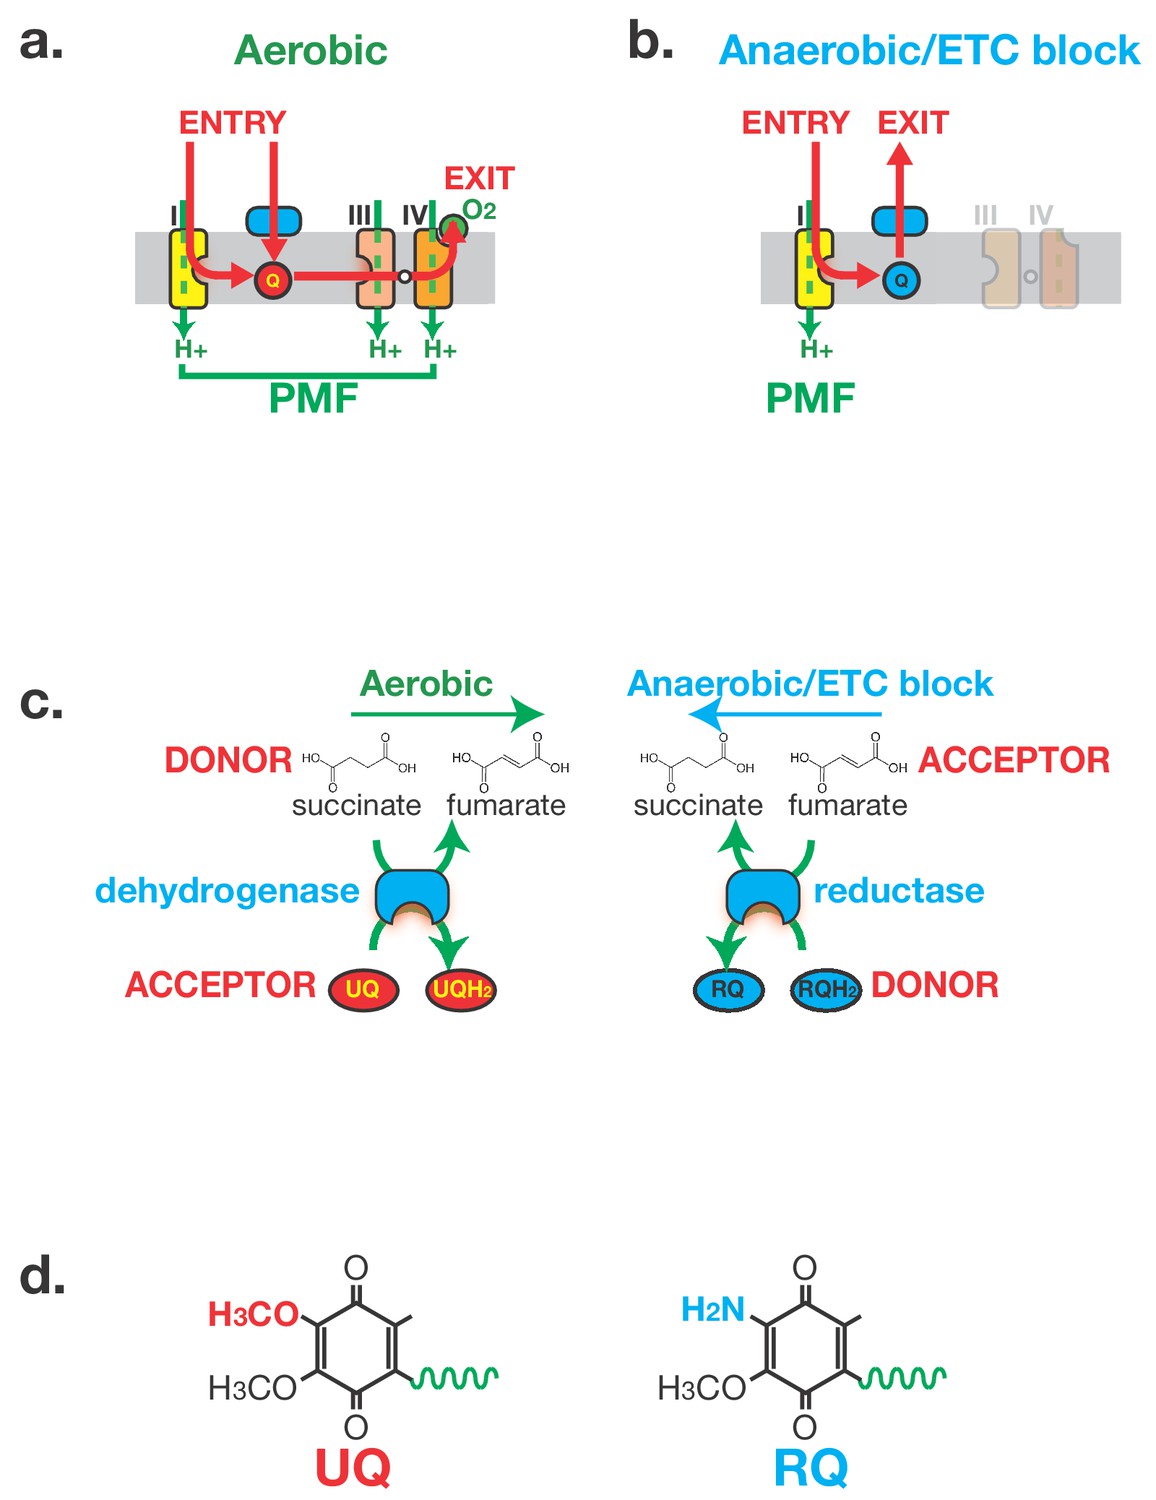
Anaerobic metabolism in helminths requires Rhodoquinone (RQ).
(a) Electron flow in the Electron Transport Chain (ETC) under aerobic conditions. Electrons enter the ETC either via Complex I or via a number of Quinone-coupled Dehydrogenases (QDH; cyan). These complexes transfer electrons to Ubiquinone (red circle ‘UQ’) which shuttles them to Complex III. They exit the ETC at Complex IV where they are transferred to oxygen as the terminal electron acceptor. Proton pumping is coupled to electron transport and is carried out by Complexes I, III and IV. Electron flow is shown in red and proton pumping in green. (b) Electron flow in the Electron Transport Chain (ETC) under anaerobic conditions. Electrons still enter the ETC at Complex I which transfers electrons to RQ (cyan circle ‘RQ’). RQ shuttles electrons to the QDHs which now operate as reductases, allowing electrons to exit the ETC and onto a diverse set of terminal electron acceptors. Complex I is the sole proton pump in this truncated ETC. (c) Schematic of Complex II activity under aerobic and anaerobic conditions. Under aerobic conditions, Complex II acts as a succinate dehydrogenase, transferring electrons from succinate onto UQ. Under anaerobic conditions, Complex II operates in the reverse direction acting as a fumarate reductase, accepting electrons from RQ and transferring them to succinate as the terminal electron sink. (d) Structure of UQ and RQ. The critical amine group differing between UQ and RQ is highlighted; the polyprenyl tail is shown schematically as a green wavy line.
Figure 2 with 1 supplement

C. elegans makes Rhodoquinone (RQ) and can carry out RQ-dependent anaerobic metabolism.
(a) C. elegans makes both UQ and RQ. C. elegans were grown under normoxic conditions and quinones extracted and analysed by mass spectrometry (see Materials and methods). Both UQ and RQ can be detected. (b) C. elegans increases succinate production following treatment with Potassium Cyanide (KCN). C. elegans L1 larvae were treated either with 200 µM KCN alone, 12.5 µM rotenone alone, or a combination of KCN and rotenone for 1 hr and metabolites extracted and analysed by mass spectrometry (see Materials and methods). The graph shows that succinate levels increase over 5-fold following KCN treatment and that this increase is blocked by rotenone indicating that it requires Complex I activity. Data are from three independent biological repeats; box plots show median and the interquartile range as well as individual data points; succinate levels are shown relative to levels in wild-type untreated animals.
Figure 2—figure supplement 1
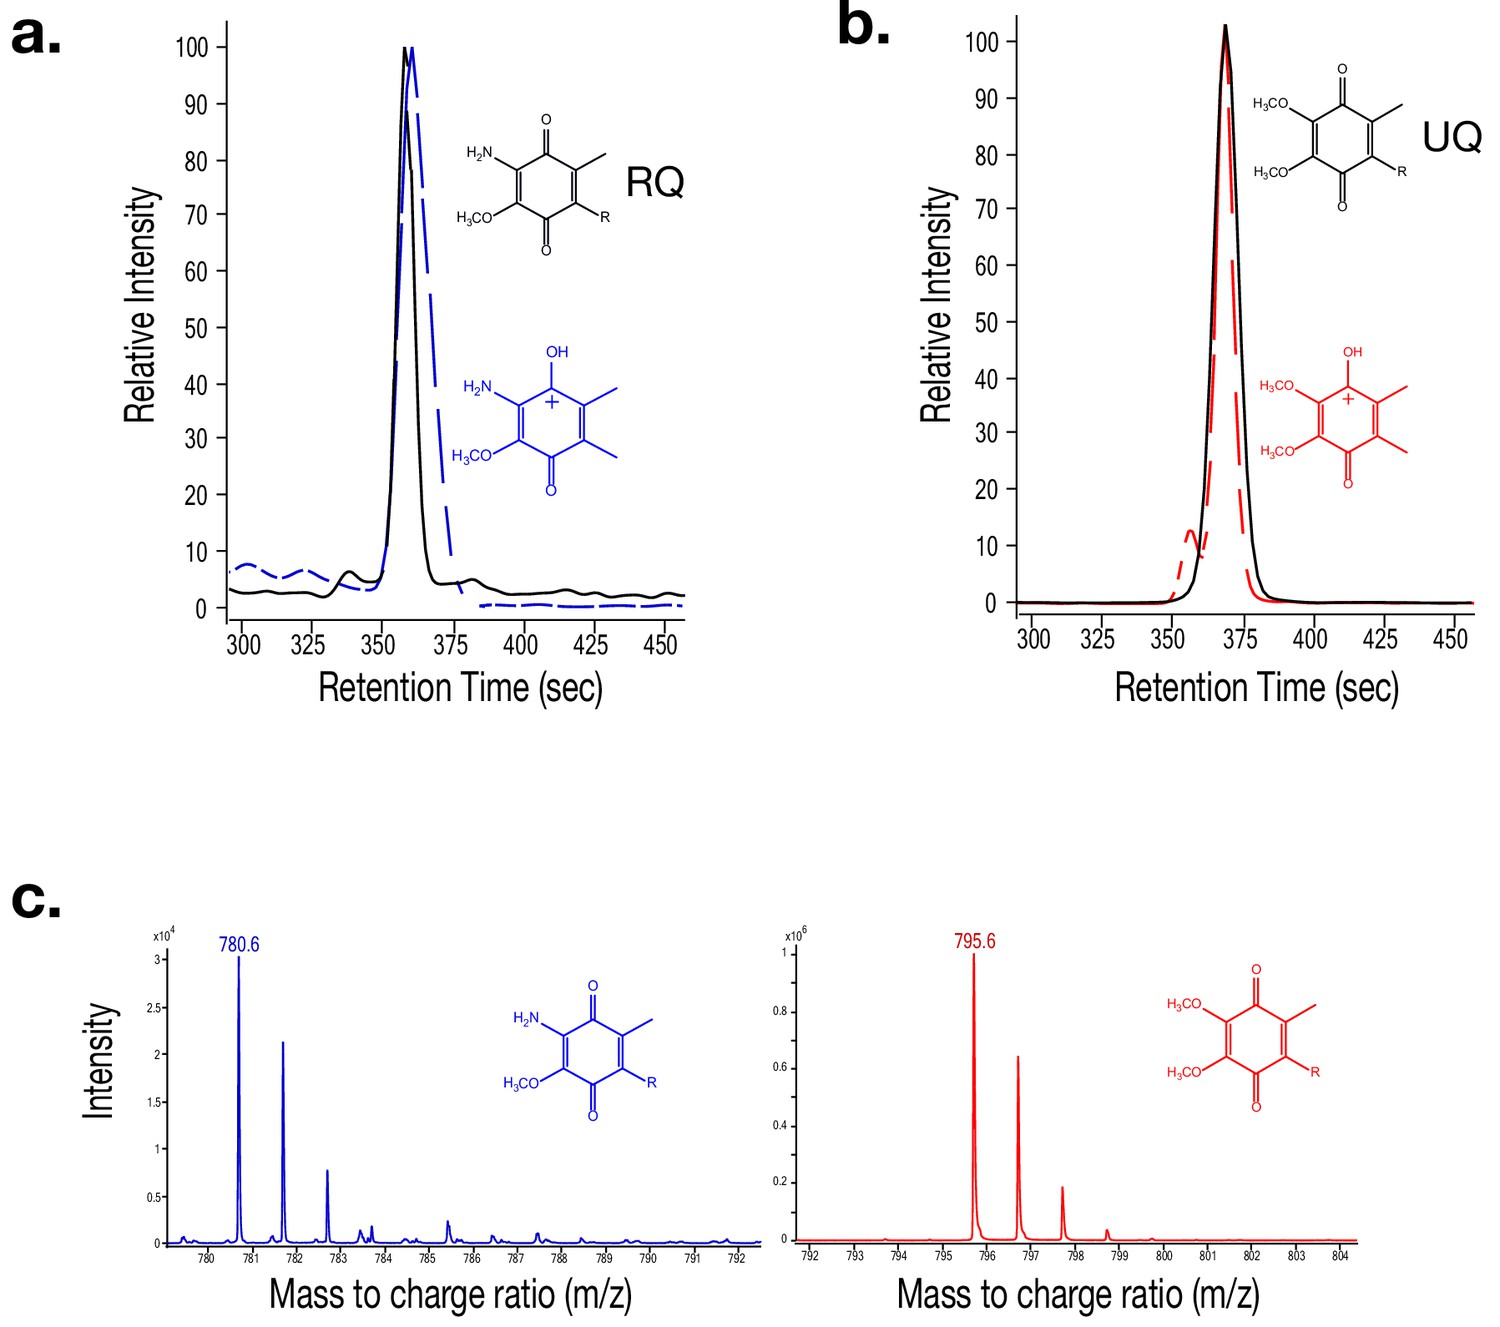
Mass spectra for Rhodoquinone (RQ) and Ubiquinone (UQ).
(a) Mass spectrometry (MS) extracted-ion chromatogram (EIC) of Rhodoquinone (RQ) (RT = 360 s) shown by a solid black line. An MS/MS EIC of the RQ product ion is shown with a dashed blue line. (b) MS EIC of Ubiquinone (UQ) (RT = 365 s) shown by a solid black line. The dashed red line represents the MS/MS EIC of Q’s product ion. (c) Mass spectra of RQ (m/z = 780.6) shown in blue. Mass spectra of UQ (m/z = 795.6) shown in red. (d) Mass spectra of the RQ product ion (m/z = 182.1) shown in blue. Mass spectra of the Q product ion (m/z = 197.1) shown in red.
Figure 3 with 1 supplement
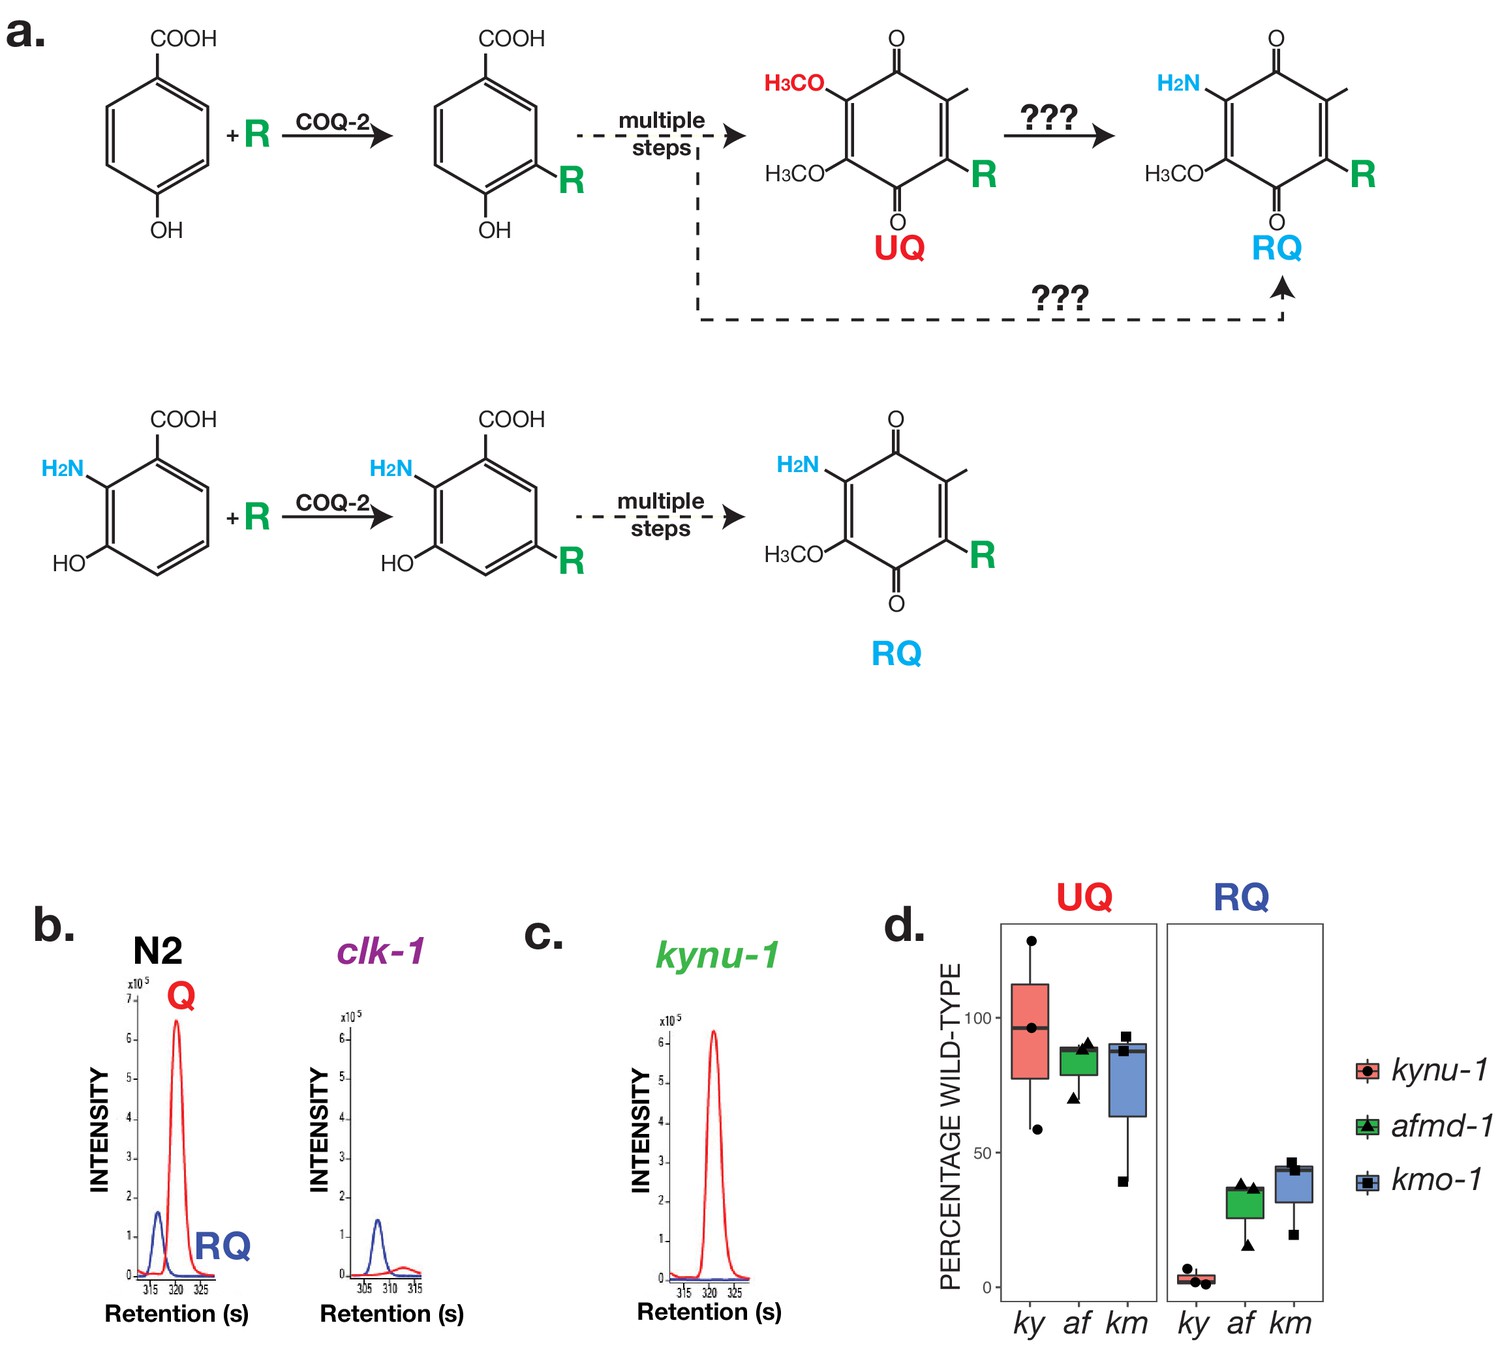
RQ in C. elegans does not derive from UQ but from Tryptophan metabolites.
(a) Schematic showing possible routes for RQ synthesis. Current models for RQ synthesis are shown schematically in the top pathway: PHB is prenylated by COQ-2 at the start of the UQ synthesis pathway and RQ either derives from UQ or from a UQ precursor — the amine group is thus added at a late step. The lower pathway shows our proposed pathway. Rather than use PHB as the substrate for COQ-2, RQ synthesis starts with prenylation of 3-hydroxyanthranilate by COQ-2. The amine group is thus present from the start of RQ synthesis rather than being added at a late step and RQ synthesis proceeds via the same pathway as UQ synthesis. (b) UQ is not a required intermediate for RQ synthesis. clk-1(qm30) mutant worms and N2 wild-type worms were grown under normoxic conditions and quinones extracted and analysed. N2 worms contain both UQ and RQ whereas clk-1(qm30) mutants only contain detectable RQ. (c) RQ synthesis requires metabolism of Tryptophan via the kynurenine pathway. kynu-1(e1003) mutant worms were grown under normoxic conditions and quinones extracted and analysed. While wild-type worms contain both UQ and RQ, kynu-1(e1003) mutants only contain detectable UQ. RQ synthesis thus requires the degradation of Tryptophan via the kynurenine pathway. (d) UQ and RQ levels in different kynurenine pathway mutants. Quinones were extracted from worms homozygous for loss of function mutations in kynu-1, afmd-1 or kmo-1 (ky, af and km respectively) and analysed by mass spec. Graphs show levels of UQ and RQ in each strain — levels are shown as % of wild-type levels, and each data point derives from a separate biological replicate.
Figure 3—figure supplement 1
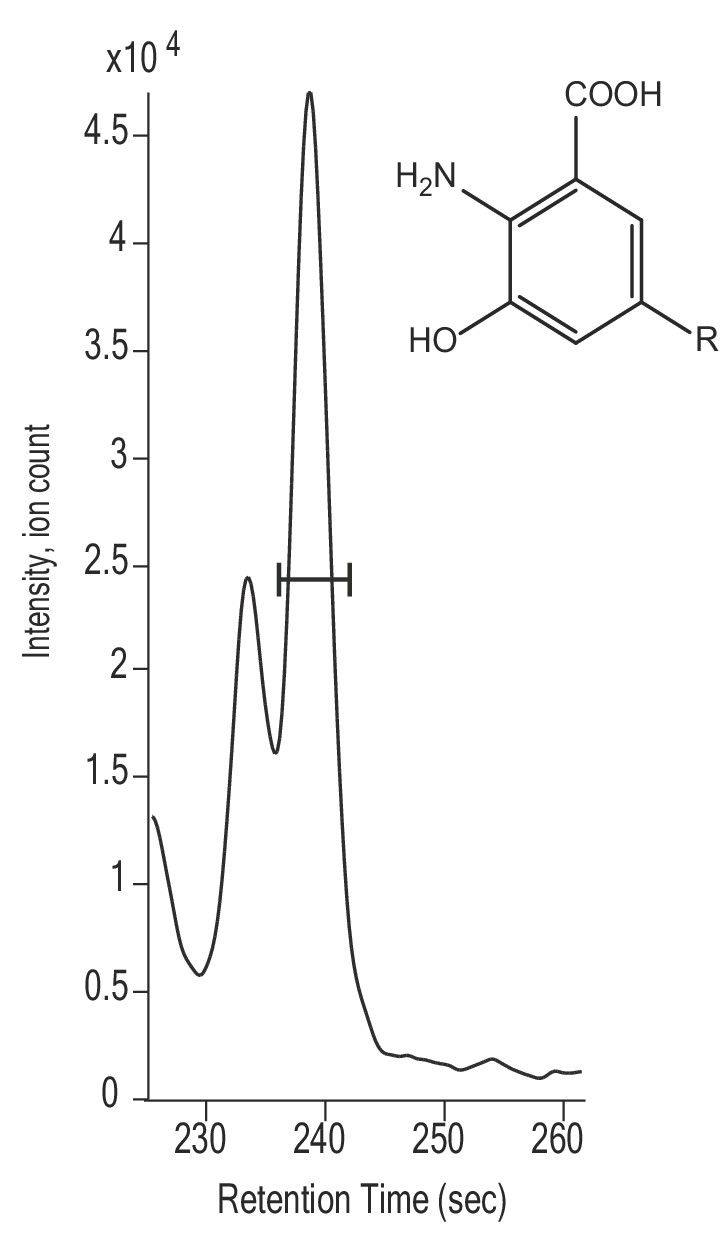
Extracted ion chromatogram and possible structure of suspected RQ intermediate likely to polyprenyl 3-hydroxyanthranilate (m/z = 768.63).
https://doi.org/10.7554/eLife.48165.007
Figure 4

The critical amine group on RQ derives from Tryptophan.
(a) Schematic of kynurenine pathway. 3-hydroxyanthranilate (3 HA) derive from Tryptophan via the kynurenine pathway and this requires KYNU-1 activity. The nitrogen atom that becomes part of the key amine group on RQ is highlighted. (b) Analysis of RQ in animals fed either only 15N substrates or 15N substrates along with 14N Tryptophan. Wild-type worms were fed with 15N-labelled bacteria for three generations either in the absence or in the presence of 14N Tryptophan. Almost all RQ is 15N labelled when worms were only eating 15N bacteria. However when 14N Tryptophan was also present, almost half the RQ is 14N RQ, indicating that the amine group of RQ must derive from Tryptophan. (c) Wild-type worms were fed with 15N-labelled bacteria for three generations either in the absence (-) or in the presence of 14N anthranilate (+A), 14N 3-hydroxyanthranilate (+HA) or 14N Tryptophan (+Trp). Quinones were extracted and 14N RQ and +1 15N RQ levels quantified. Graph shows ratio of 14N RQ to 15N; data are from three independent biological replicates, *** denotes p<0.01 compared to – control treatment.
Figure 5
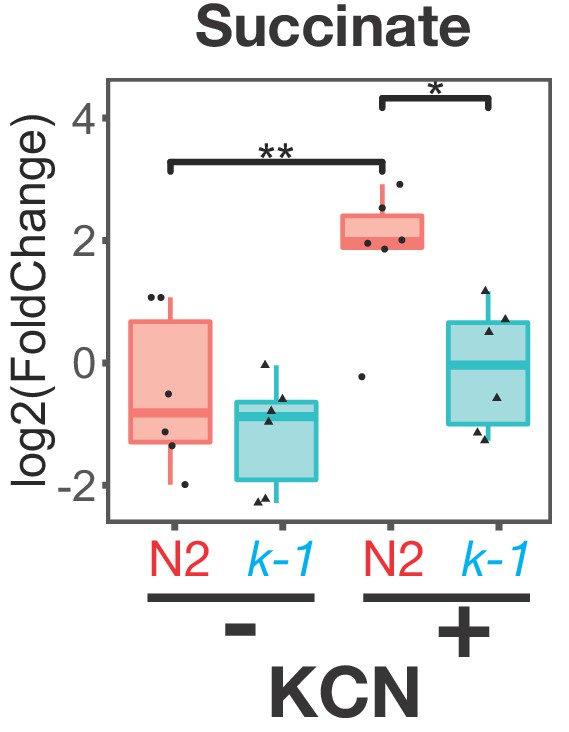
Buildup of succinate following Complex IV inhibition requires RQ.
Wild-type (N2) or kynu-1(e1003) mutant animals were exposed to 200 µM KCN for 6 hr and metabolites extracted and analysed by mass spectrometry. Data are from five independent biological repeats; box plots show median and the interquartile range as well as individual data points; levels are computed relative to levels in wild-type untreated animals. Succinate levels increase markedly in N2 worms (red ‘N2’) following KCN treatment; there is no significant increase in kynu-1(e1003) mutant animals (cyan ‘k-1’) confirming that fumarate reductase activity of Complex II requires RQ.
Figure 6
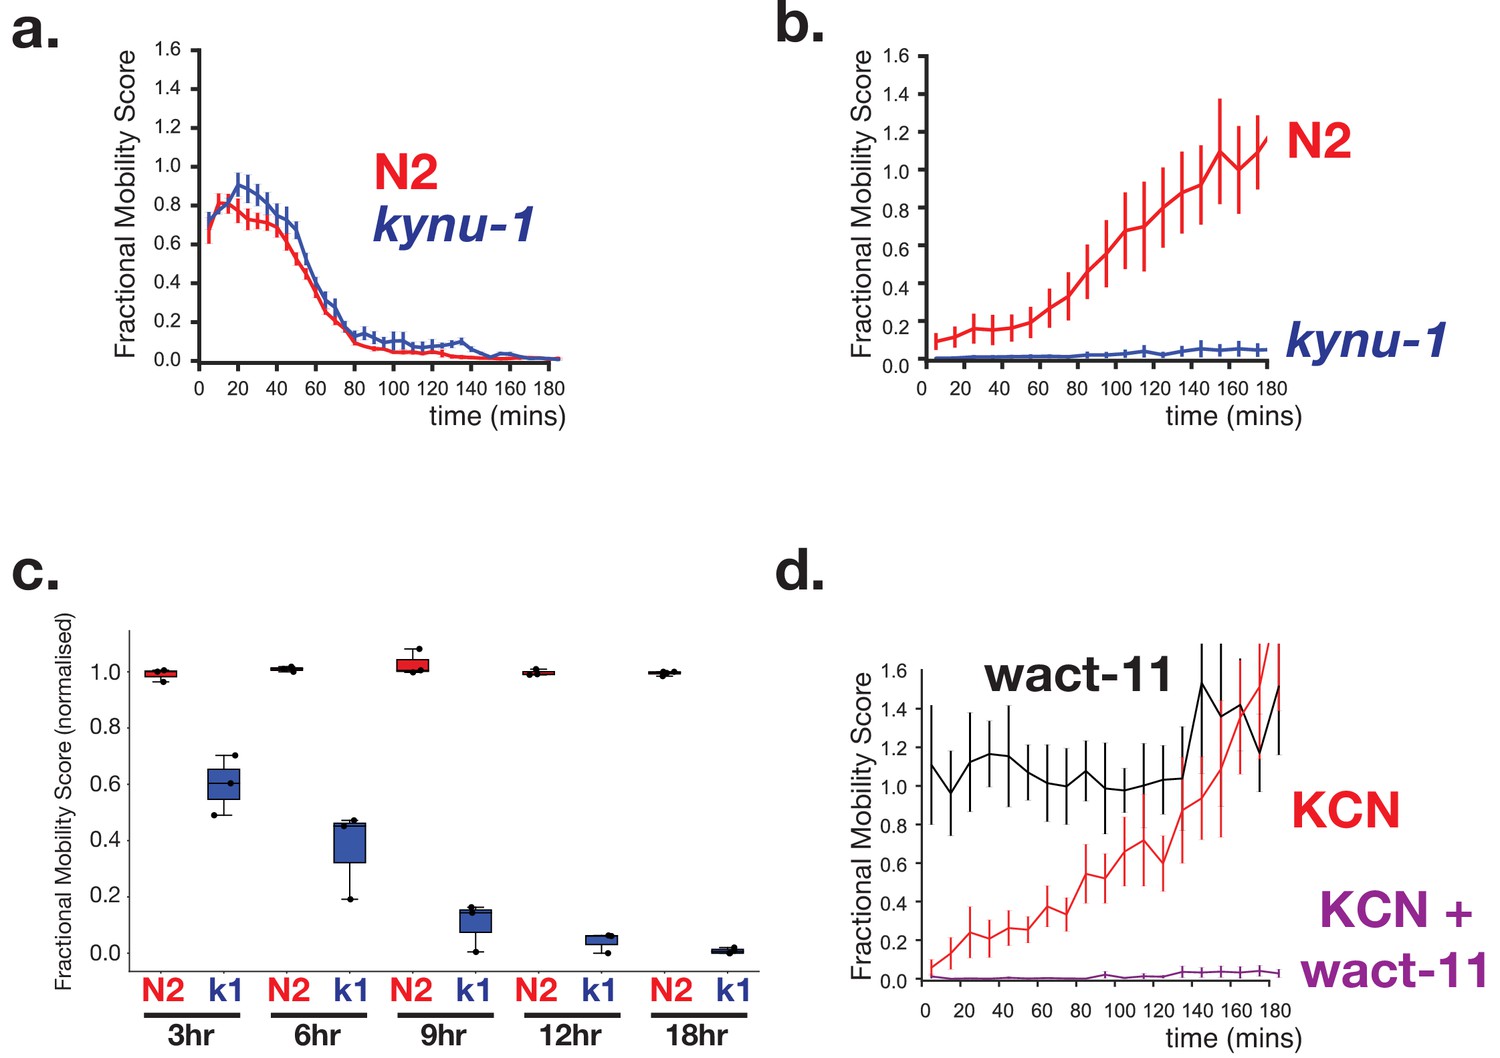
RQ-dependent metabolism is required for long-term survival in anaerobic conditions.
(a) Loss of RQ does not affect acute sensitivity to KCN. Wild-type (N2, red curve) and kynu-1(e1003) mutant L1 animals (kynu-1, blue curve) were exposed to 200 µM KCN and their movement measured over 3 hr (see Materials and methods). Both strains slow their movement and become immobile after ~90 mins. Curves show means of 3 biological replicates with three technical replicates in each; error bars are standard error. (b) RQ is required for survival following extended treatment with KCN. Wild-type (N2, red curve) and kynu-1(e1003) mutant L1 animals (kynu-1, blue curve) were exposed to 200 µM KCN for 15 hr. KCN was then diluted (see Materials and methods) and worm movement was measured over a 3 hr time course. Curves show means of 3 biological replicates with three technical replicates in each; error bars are standard error. (c) Effect of different lengths of exposure to KCN on worm survival. Wild-type (N2, red) and kynu-1(e1003) mutant L1 animals (kynu-1, blue) were exposed to 200 µM KCN for different lengths of time from 3 hr to 18 hr. KCN was then diluted (see Materials and methods) and worm movement was measured after 3 hr. Box plots show levels of movement after a 3 hr recovery period. Data are from three biological replicates with three technical replicates in each. (d) Ability to survive extended KCN exposure requires Complex II activity. Wild-type L1 animals were treated with 200 µM alone, 10 µM of wact-11 (a helminth-specific Complex II inhibitor) alone, or a combination of KCN and wact-11 for 15 hr. Drugs were then diluted 6x and worm movement was measured over a 3 hr timecourse. wact-11 treatment alone had no effect on survival over the experiment (black curve) and worms recovered completely from KCN treatment alone. However worms could not survive treatment with both KCN and wact-11. Curves show means of 3 biological replicates with three technical replicates in each; error bars are standard error.
Figure 7
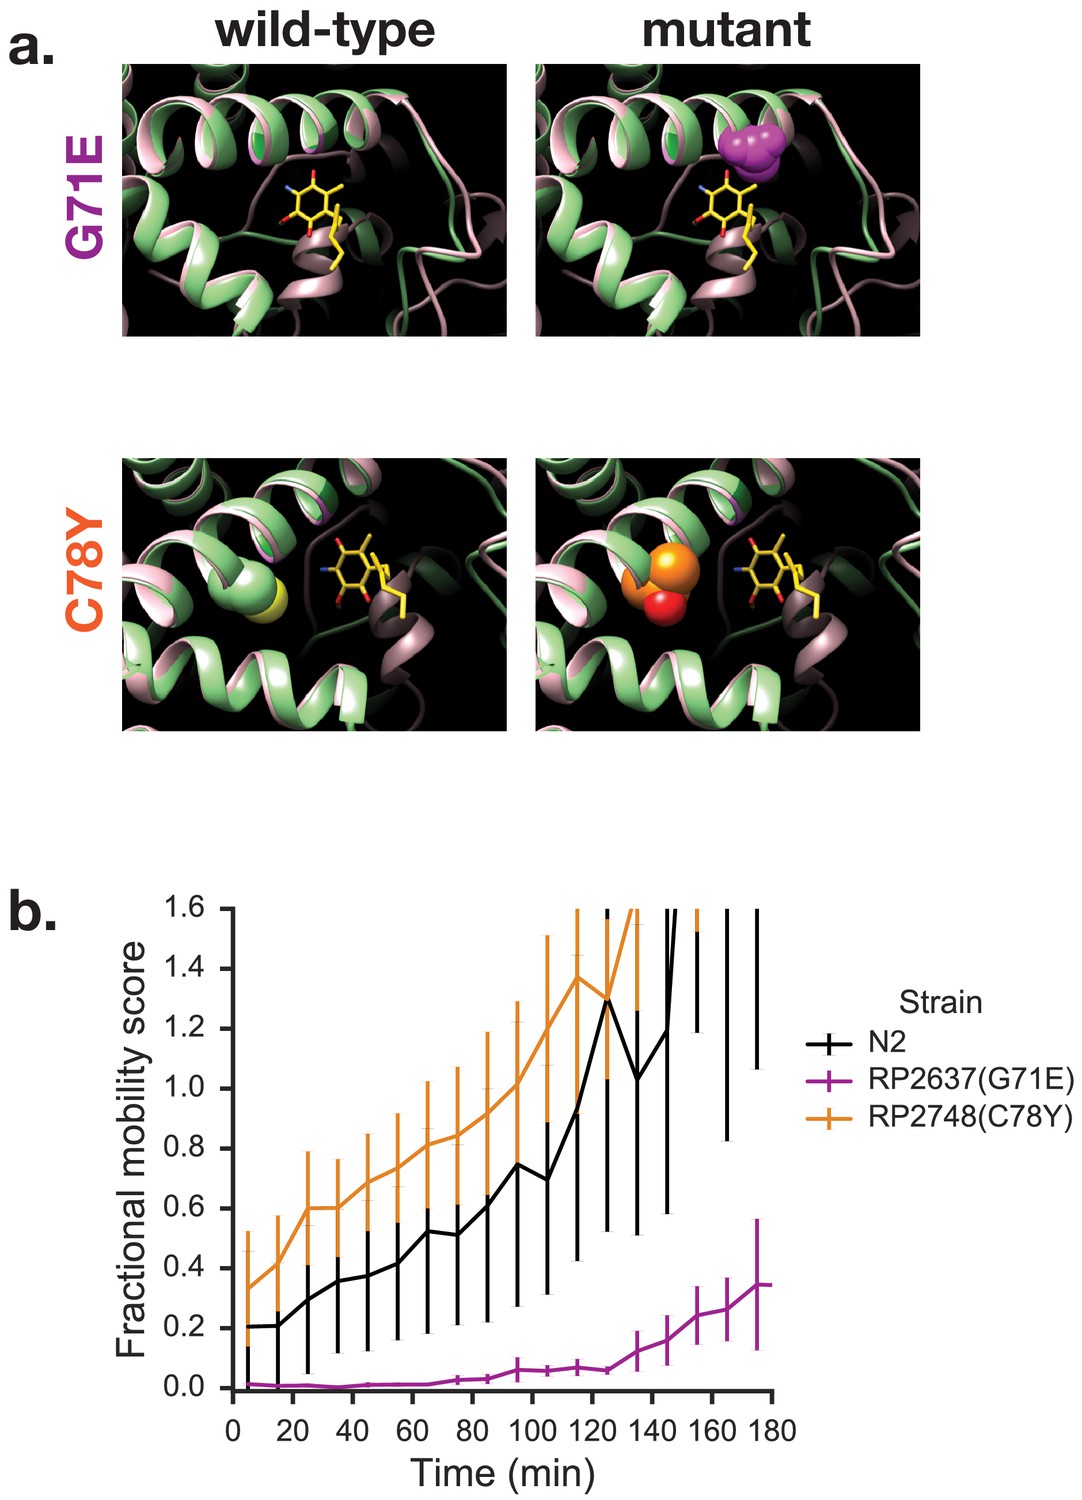
Mutations in quinone-binding pocket of Complex II subunit MEV-1 affect ability to survive extended KCN treatment.
(a) Positions of mutations that alter wact-11 sensitivity. MEV-1 structures show either the wild-type residues or mutations that alter wact-11 binding. The structures shown are C. elegans sequences (green) threaded onto the Ascaris suum crystal (pink). RQ is shown in yellow with the critical amine group in blue — note that this is RQ2 and not RQ9, hence the shortened prenyl tail. Note that G71E alters a residue that lies right over the quinone ring of RQ whereas C78Y is further from the ring. (b) Effect of quinone-pocket mutations on ability to survive extended KCN exposure. L1 worms containing either wild-type, G71E or C78Y mutant mev-1 alleles were exposed to 200 µM KCN for 15 hr. KCN was then diluted 6x and the movement of worms measured across a 3 hr time course. Curves show means of 3 biological replicates with three technical replicates in each; error bars are standard error.
Videos
Video 1
Survival in KCN of N2 but not of kynu-1(tm4924) mutants.
L1 animals were treated with 200 μM KCN for 18 hr followed by a 6-fold dilution. Worms were imaged using the Phenalysys Parallux 2. Graphs show the moving average of raw FMS values as described in Materials and methods.
Additional files
-
Transparent reporting form
- https://doi.org/10.7554/eLife.48165.013
Download links
A two-part list of links to download the article, or parts of the article, in various formats.
Downloads (link to download the article as PDF)
Open citations (links to open the citations from this article in various online reference manager services)
Cite this article (links to download the citations from this article in formats compatible with various reference manager tools)
Rhodoquinone biosynthesis in C. elegans requires precursors generated by the kynurenine pathway
eLife 8:e48165.
https://doi.org/10.7554/eLife.48165


