Spatiotemporal dynamics and heterogeneity of renal lymphatics in mammalian development and cystic kidney disease
- University College London, United Kingdom
- Mayo Clinic, United States
- University of Oxford, United Kingdom
- University of Manchester, United Kingdom
- Royal Manchester Children’s Hospital, Manchester University NHS Foundation Trust, Manchester Academic Health Science Centre, United Kingdom
Figures
Figure 1 with 7 supplements
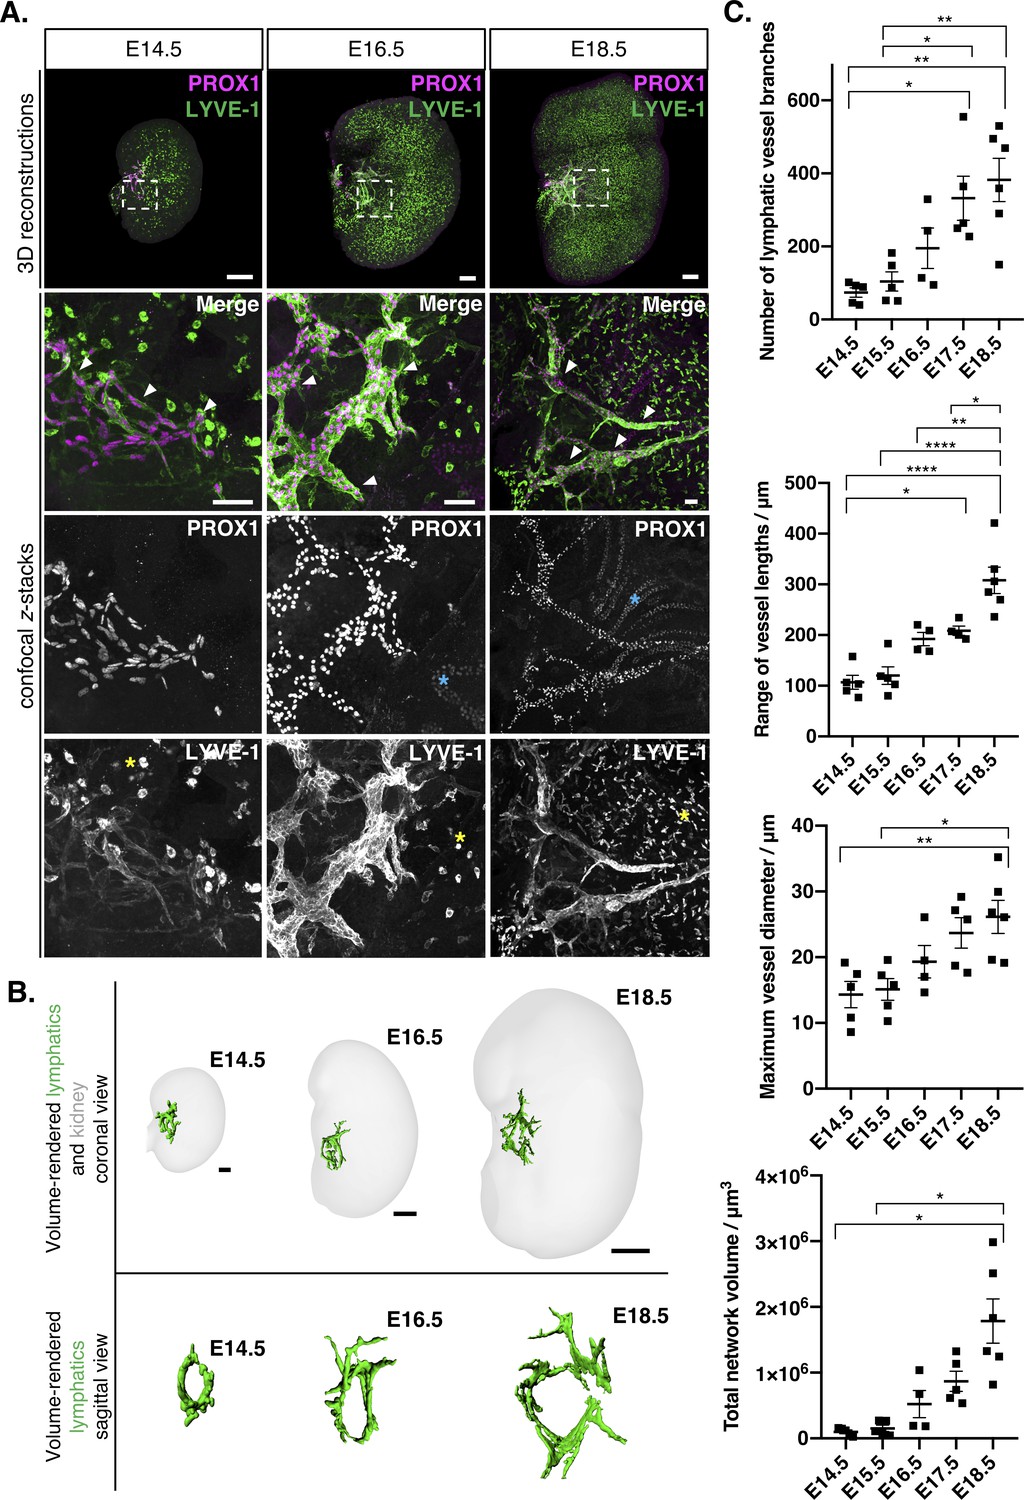
Visual and quantitative characterization of lymphatic vessels during mouse kidney development.
(A) Appearance of PROX1+/LYVE-1+ lymphatic endothelium (white arrowheads) in E14.5, E16.5 and E18.5 mouse kidneys. Representative 3D reconstructions and confocal z-stacks from a minimum of four kidneys per timepoint from three independent embryonic litters. Dashed boxes in the 3D reconstructions represent the location of the lymphatic plexus and indicate area shown at higher magnification in the bottom of each panel. Strong LYVE-1 staining was also observed in macrophages from E14.5 through to E18.5 (yellow asterisks). Weak PROX1 staining was observed in tubular epithelium from E16.5 onwards (blue asterisks). 3D reconstruction scalebars: 100 μm (E14.5, E16.5); 200 μm (E18.5). Confocal z-stack scalebars: 50 μm. (B) Volume renderings of the lymphatic plexus and embryonic kidneys at E14.5, E16.5 and E18.5; top panels show the lymphatic plexus and kidney from a coronal view; bottom panels show the sagittal view looking down upon the plexus towards the hilum. Scalebars: 50 μm (E14.5); 100 μm (E16.5); 500 μm (E18.5). The sagittal views are not to scale. (C) Quantitative analysis of kidney lymphatic vessel development at E14.5 (n = 5), E15.5 (n = 5), E16.5 (n = 4), E17.5 (n = 5) and E18.5 (n = 6). Each data point represents a whole kidney immunolabelled for PROX1 and LYVE-1 and error bars represent standard error of the mean. ANOVA showed significant increases in the number of lymphatic vessel branches per kidney (F = 8.5; p=0.0003), the range of vessel lengths (F = 20.6; p<0.0001), the maximum vessel diameter (F = 5.7; p=0.003) and total network volume (W = 10.6; p=0.0022). For the total volume of the lymphatic network, we used Welch’s ANOVA, as equality of variance was not met for this parameter. Brackets between timepoints demonstrate significance when multiple comparisons were performed using Bonferroni tests (or Tamhane T2 multiple comparison testing for total network volume). *: p<0.0332; **: p<0.0021; ***: p<0.0002, ****: p<0.0001. Raw data and results of all multiple comparisons are presented in Figure 1—source data 1.
-
Figure 1—source data 1
This spreadsheet contains the numerical raw data and statistics for the quantitative analysis of kidney lymphatic vessel development shown in Figure 1C and Figure 1—figure supplement 3.
- https://cdn.elifesciences.org/articles/48183/elife-48183-fig1-data1-v2.xls
Figure 1—figure supplement 1
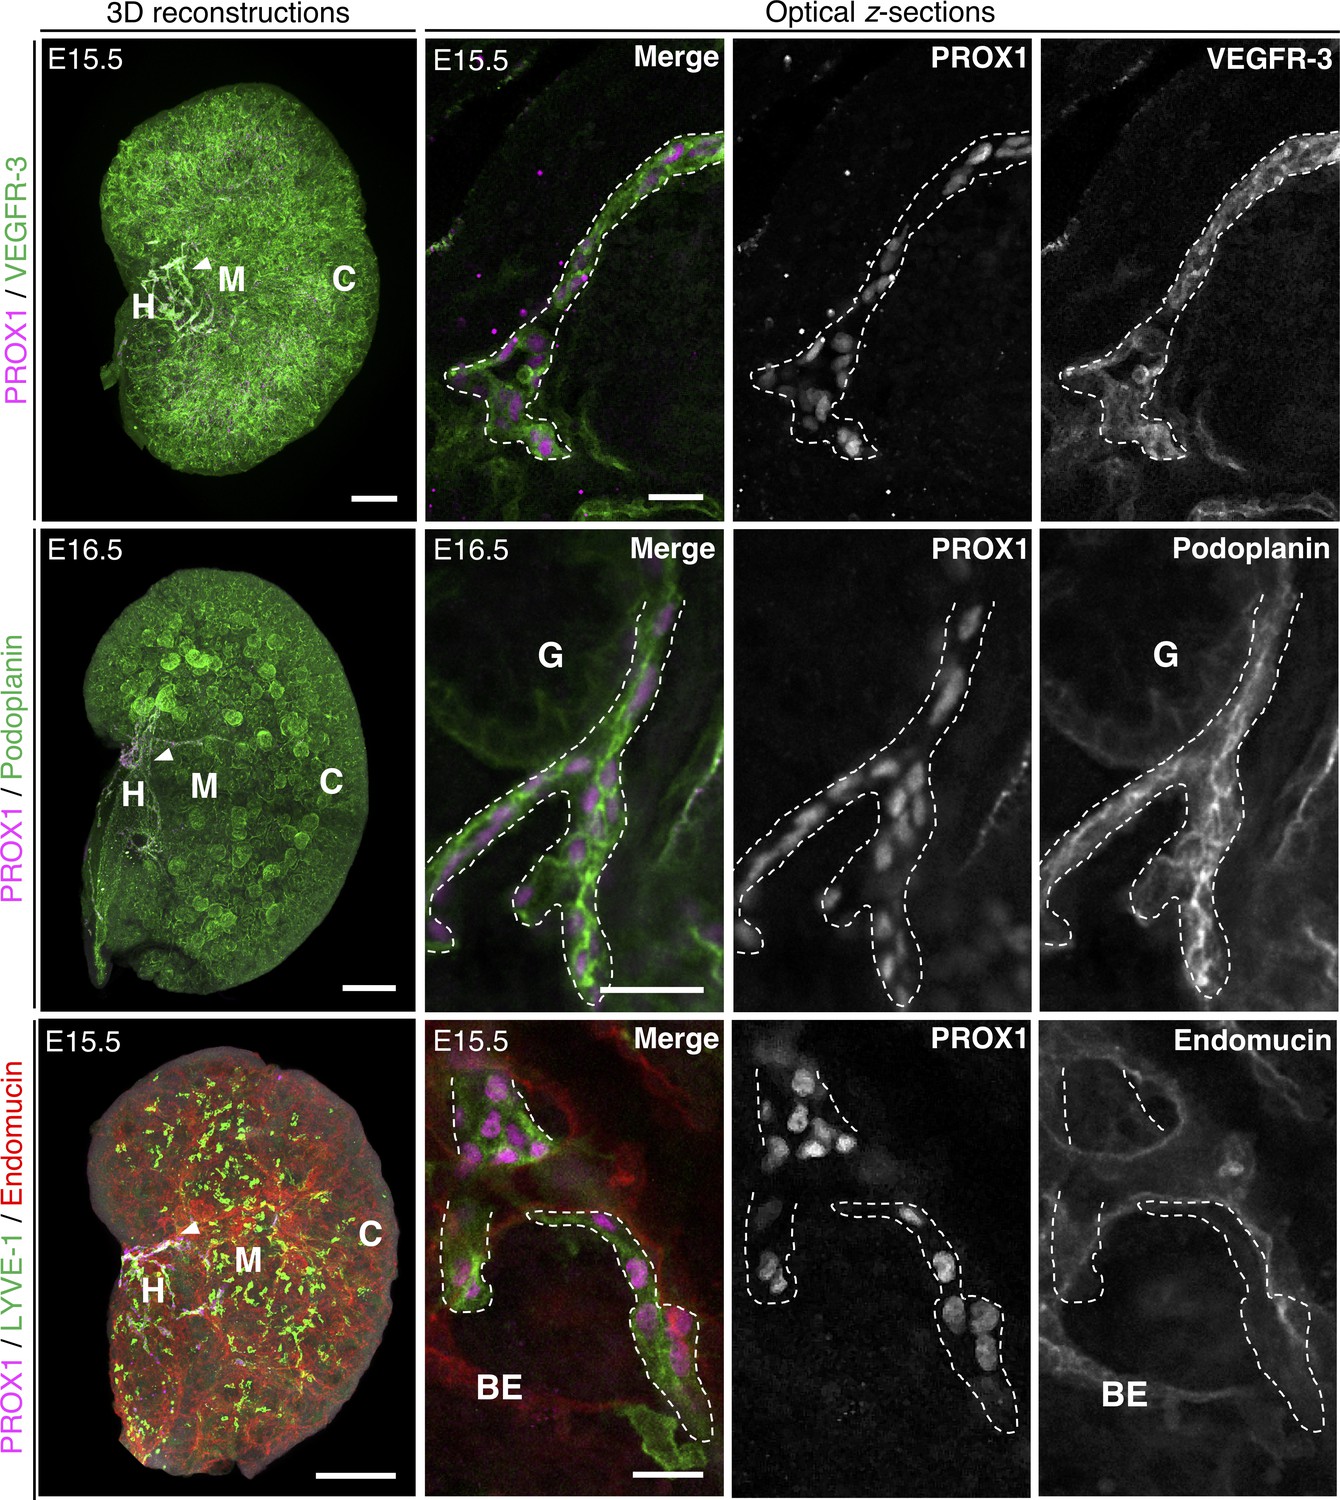
Confirmation of identity of the kidney lymphatic plexus.
Representative 3D reconstructions and optical z-sections from a minimum of three kidneys from three independent litters. We found the kidney lymphatic plexus in the hilum (white arrowheads in 3D reconstructions, magnified in optical z-sections) also expressed VEGFR-3 (top three panels, E15.5) and podoplanin (middle three panels, E16.5) strongly but expressed the blood vascular marker endomucin weakly relative to surrounding renal blood vasculature (bottom three panels, E15.5). For all 3D reconstructions orthogonal slicing was performed in Imaris software to show only a mid-section of the kidney, making the lymphatic plexus more visible. The dotted outlines in optical z-sections indicate the boundaries of the lymphatic endothelium. Scalebars: 150 μm (VEGFR-3-stained kidney); 200 μm (podoplanin and endomucin-stained kidneys); 20 μm (all optical z-sections). BE, blood endothelium; C, cortex; G, glomerulus; H, hilum; M, medulla.
Figure 1—figure supplement 2

Spatial relationships of lymphatic vessels to other anatomical structures in the developing mouse kidney.
(A) Kidney lymphatic vessels form a ring-like vascular anastomosis adjacent to the nascent renal pelvis. The left image shows a representative 3D reconstruction of three kidneys from independent litters stained for PROX1, podoplanin and uroplakin 3a (UPK3A). Higher magnification (right panels, region in low power image displayed with white arrowhead) showing lymphatic vessels next to the base of the renal pelvis (outlined in red) at E16.5. (B) Co-alignment of branches of lymphatic vessels and blood vasculature in developing kidneys. The left image shows a representative 3D reconstruction of three kidneys from three independent litters stained for PROX1, LYVE-1 and platelet endothelial cell adhesion molecule-1 (PECAM-1). Higher magnification (right panels, region in low power image displayed with white arrowhead) shows lymphatic vessel branches and their close relationship with renal arterioles in the renal hilum, but not vasa recta in the medulla or glomeruli in the cortex at this stage. (C) Absence of smooth muscle coverage of kidney lymphatics. The left image shows a representative 3D reconstruction of four kidneys from three independent litters stained for PROX1, PECAM-1 and alpha smooth muscle actin (αSMA). Higher magnification (right panels, region in low power image displayed with white arrowhead) shows strong αSMA expression around PECAM-1+ renal arterioles, but no detectable expression around PROX1+ lymphatics. (D) The developing renal medulla is devoid of kidney lymphatics. The left image shows a representative 3D reconstruction of three kidneys from independent litters stained for PROX1, podoplanin and aquaporin 2 (AQP2). Higher magnification (right panels, region in low power image displayed with white arrowhead) shows that lymphatic vessels are observed in the hilum, but not in the renal papilla or medulla. For all 3D reconstructions orthogonal slicing was performed in Imaris software to visualize the lymphatics more clearly (yellow lines indicate the plane of slicing). Scalebars: 100 μm, except the low magnification 3D reconstructions in C (300 μm) and in D (200 μm). C, cortex; G, glomerulus; H, hilum; M, medulla; Pv, renal pelvis; LV, lymphatic vessels; RA, renal arterioles; VR, vasa recta.
Figure 1—figure supplement 3
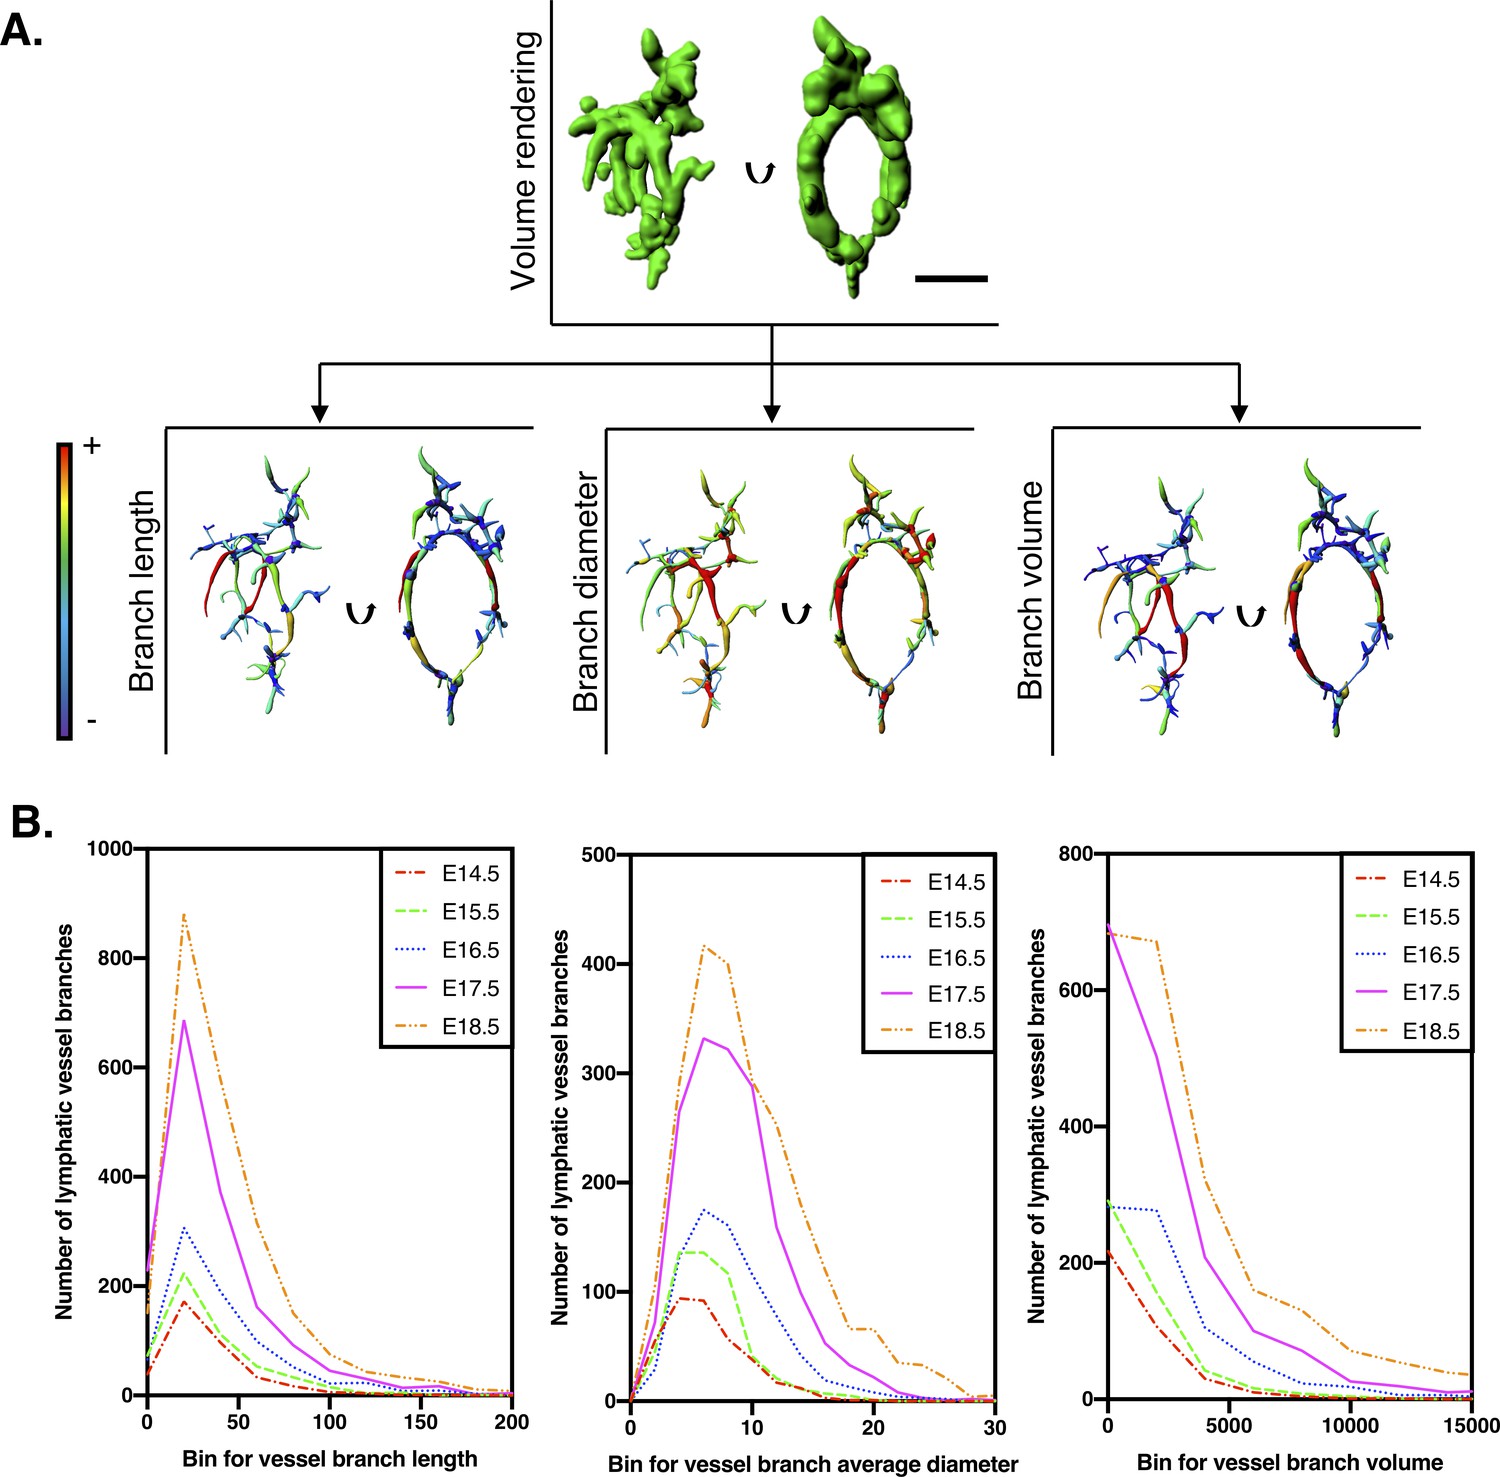
Filament tracing analysis for quantification of kidney lymphatic vessel development.
(A) Procedure to measure lymphatic vessel branch lengths, diameters and volumes. The single inset above shows a segmented and volume-rendered lymphatic plexus from an E14.5 kidney. By performing filament tracing analysis of the segmented lymphatics, parameters for each branch of the lymphatic vasculature plexus were derived. Each of the three insets below show orthogonal views (plane of rotation indicated with black arrows) of the plexus transformed into color-coded visual models of each parameter. Here, red represents the highest value and purple represents the lowest value for each parameter within the E14.5 kidney. Scalebar: 50 μm. (B) Histograms of individual vessel branch lengths, diameters and volumes of the kidney lymphatic vascular plexus. Each curve represents lymphatic vessel branches derived from filament tracing analysis, pooled from all kidneys acquired at each timepoint. The analysis includes E14.5 (n = 370 branches from five kidneys), E15.5 (n = 520 branches from five kidneys), E16.5 (n = 782 branches from four kidneys), E17.5 (n = 1660 branches from five kidneys) and E18.5 (n = 2293 branches from six kidneys). A shift of the graph upwards suggests an increasing number of vessel branches at a given value of branch length, diameter or volume. A shift of the graph right represents an increase in vessel parameter for a given number of vessel branches. Thus, the shift of the graphs up and to the right from E14.5–18.5 represent the progressive remodeling of the plexus. All raw data are presented in Figure 1—source data 1.
Figure 1—figure supplement 4
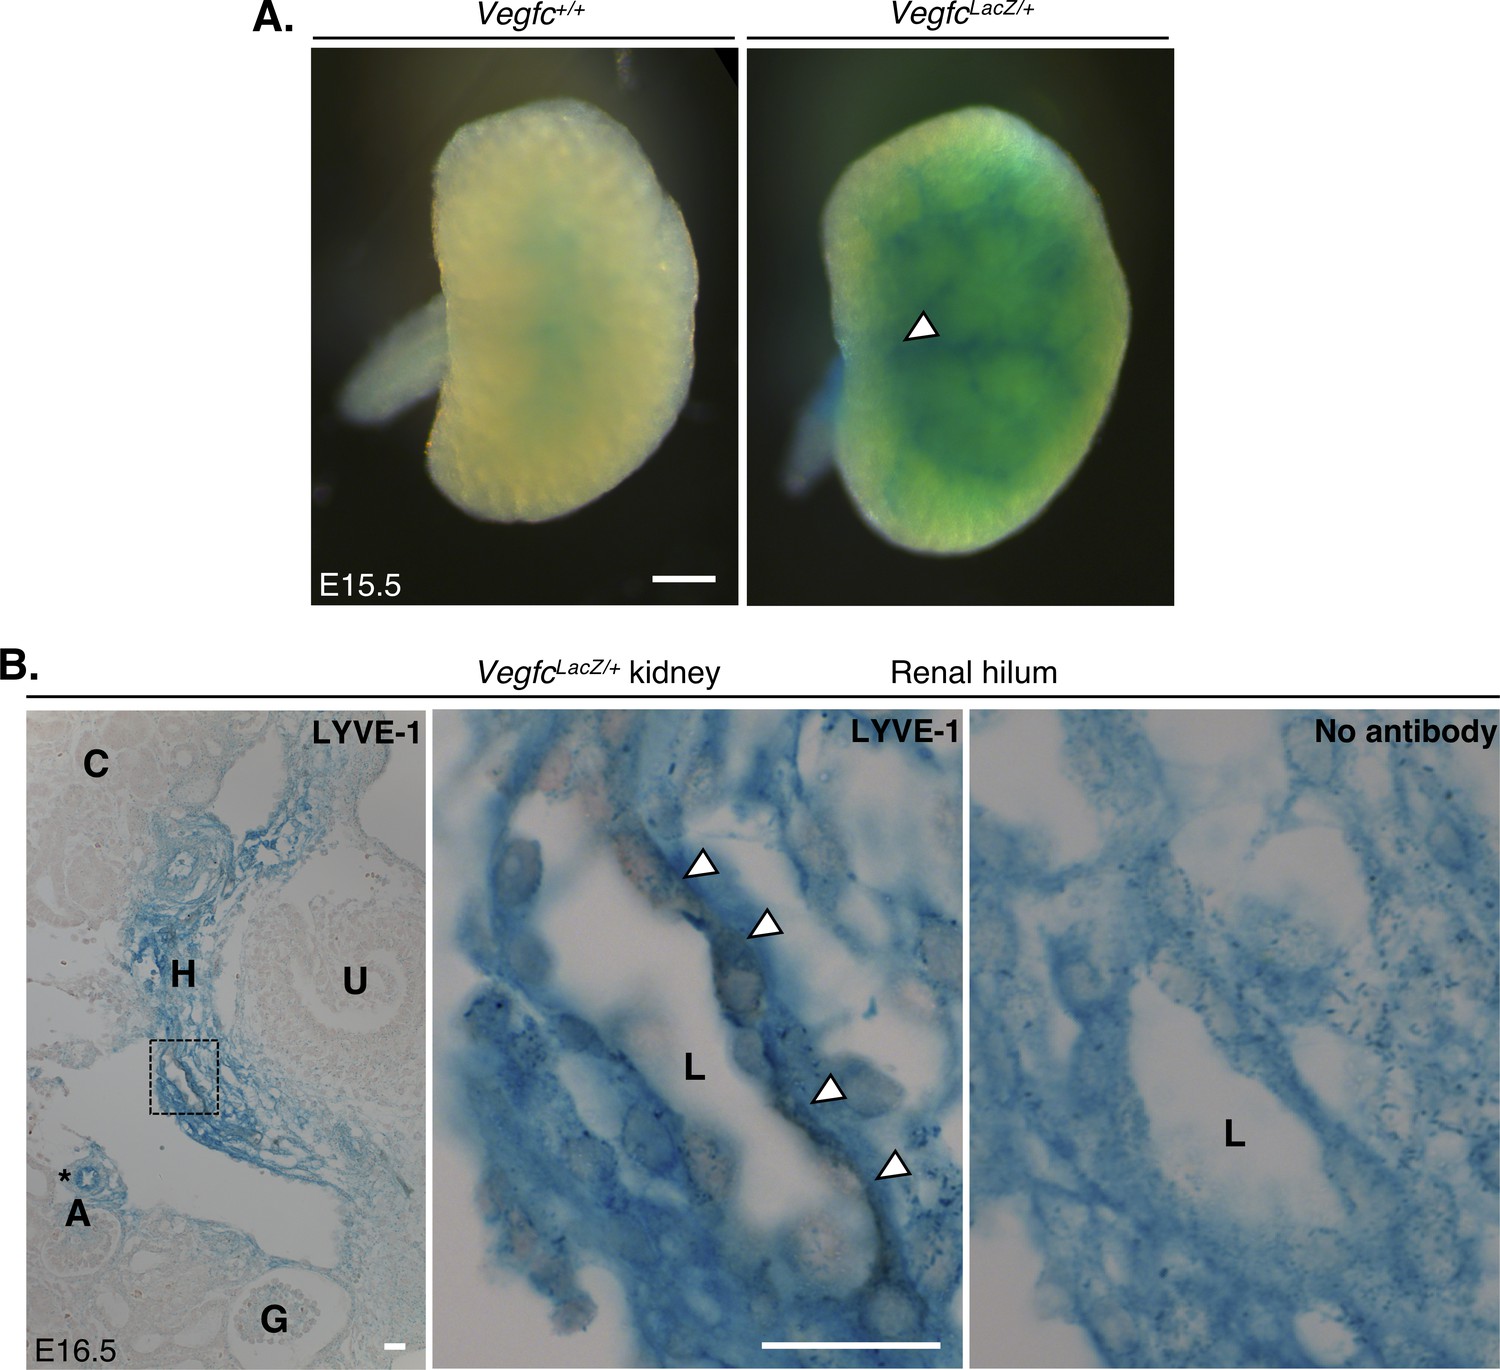
Proximity of VEGF-C expression during murine kidney development.
(A) Wholemount X-gal staining of E15.5 embryonic kidneys from VegfcLacZ/+ mice. Scant beta-galactosidase (β-gal) was observed in Vegfc+/+ control kidneys, whereas a vascular pattern of staining, originating from the renal hilum (white arrow) was observed in VegfcLacZ/+ kidneys. Scale bar: 500 μm (B) DAB immunohistochemical staining for LYVE-1 of serially sectioned X-gal-stained E16.5 VegfcLacZ/+ kidneys. Image contrast was adjusted in FIJI to best distinguish the 3,3′-DAB (brown) and β-gal (blue), by setting display values in all images to a min/max of 33/222. The left panel shows strong β-gal activity in the hilum and around arterioles (black asterisk) of E16.5 kidneys. The middle inset shows a high-power image of the region delineated with a black box. Immunoreactivity for LYVE-1 is detectable in the membrane of a lumenized lymphatic vessel which is surrounded by β-gal-expressing interstitial cells. This is comparable to the right panel, an unstained serial section of the same lymphatic vessel demonstrating no immunoreactivity. Scale bars: 20 μm. A, arteriole; G, glomerulus; H, hilum; L; lymphatic vessel lumen, U, ureter.
Figure 1—video 1
Appearance of patent vessel lumen in the kidney lymphatic plexus at E16.5.
Scan through of serial confocal images taken from the renal hilum of an E16.5 mouse embryonic kidney immunolabelled for PROX1 (magenta) and LYVE-1 (green). The video pauses to show a lymphatic vessel lumen at this stage (white arrow). Scalebar: 50 μm.
Figure 1—video 2
3D imaging and volume rendering of the developing kidney lymphatic vasculature.
3D reconstruction of an E17.5 mouse embryonic kidney immunolabelled for PROX1 (magenta) and LYVE-1 (green) before optical clearing and imaging using an LSM880 confocal microscope (Zeiss). The lymphatic vascular plexus is clearly visible in the hilum of the developing kidney. PROX1 also labels a subset of tubular epithelial cells, and LYVE-1 an abundant population of macrophages in the kidney at this timepoint. Using the Isosurface Rendering function in Imaris software (Bitplane), we segmented and volume-rendered the PROX1+/LYVE-1+ lymphatic plexus (yellow).
Figure 1—video 3
Anatomical relationship of the lymphatic plexus to the nascent renal pelvis.
3D reconstruction of an E16.5 wildtype mouse embryonic kidney immunolabelled for PROX1 (magenta), LYVE-1 (green) and UPK3A (blue; labelling urothelium, a specialized epithelium lining the renal pelvis). A ring-like anastomosis formed by lymphatic vessels in the hilum of the kidney wraps around the base of the nascent renal pelvis at this stage.
Figure 2 with 3 supplements

Isolated lymphatic endothelial cell clusters in the mouse embryonic kidney that form in response to VEGF-C.
(A) In the developing kidney, PROX1+/LYVE-1+ lymphatic endothelial cells appear as either vessels or cell clusters. A representative image from analysis of four kidneys from three independent litters. Lymphatic clusters (white arrowheads) at E16.5 are structurally and anatomically distinguishable from the lymphatic plexus (white asterisk). The segmentation of PROX1+/LYVE-1+ lymphatics makes clusters easier to visualize. Scalebar: 50 μm. H, hilum; C, cortex. (B) Confirmation of the lymphatic identity of clusters. Representative confocal z-stacks from a minimum of 3 kidneys from three independent litters stained for PROX1, LYVE-1, podoplanin and VEGFR-3 identifies lymphatic clusters (white arrowhead). Filopodia-like projections (white asterisks) extend from the clusters. The relationship of clusters to other structures in the kidney is also shown. Scalebars: 20 μm. BE, blood endothelium; G, glomerulus; Mφ, macrophage. (C) Quantitative assessment of lymphatic cluster dynamics during mouse kidney development. For each embryonic kidney immunolabelled for PROX1 and LYVE-1, the number of clusters (top graph) or the total number of cells within all clusters (bottom graph) in any single kidney was quantified. Each data point represents the values for one kidney and error bars represent standard error of the mean. ANOVA showed a significant overall increase in the total number of clusters per kidney (F = 10.9; p=0.0002) and the total number of cells constituting all clusters per kidney (F = 15.9; p<0.0001). Brackets between timepoints demonstrate significance when multiple comparisons were performed using Bonferroni tests. *: p<0.0332; **: p<0.0021; ***: p<0.0002, ****: p<0.0001. Raw data and results of all multiple comparisons are presented in Figure 2—source data 1. (D) Volume renderings of a representative E15.5 kidney conveys the heterogeneity of PROX1+/LYVE-1+ cluster size and morphology. Scalebar: 5 μm. (E) VEGF-C increases the abundance of lymphatic clusters ex vivo. Representative 3D reconstructions of mouse embryonic kidneys, harvested at E14.5, cultured at the air-liquid interface for 48 hr with or without 40 ng/ml recombinant VEGF-C and immunolabelled for PROX1 and LYVE-1. PROX1+/LYVE-1+ lymphatic cell clusters (white arrowheads) were detectable in both treated and untreated explants. The number of PROX1+/LYVE-1+ lymphatic cell clusters per kidney was quantified. Each data point represents the values for one cultured kidney and error bars represent standard error of the mean. An unpaired Student’s t-test showed that treatment with VEGF-C significantly increased the abundance of PROX1+/LYVE-1+ cell clusters within the explants (t = 2.77; p=0.0184). Data were pooled from two independent culture experiments. Raw data and results of statistical tests are presented in Figure 2—source data 2.
-
Figure 2—source data 1
This spreadsheet contains the numerical raw data and statistics for the quantitative analysis of kidney lymphatic endothelial cell cluster dynamics in vivo, shown in Figure 2C.
- https://cdn.elifesciences.org/articles/48183/elife-48183-fig2-data1-v2.xls
-
Figure 2—source data 2
This spreadsheet contains the numerical raw data and statistics comparing the effect of VEGF-C treatment on lymphatic endothelial cell cluster number in mouse embryonic kidney explants, shown in Figure 2E.
- https://cdn.elifesciences.org/articles/48183/elife-48183-fig2-data2-v2.xls
Figure 2—figure supplement 1
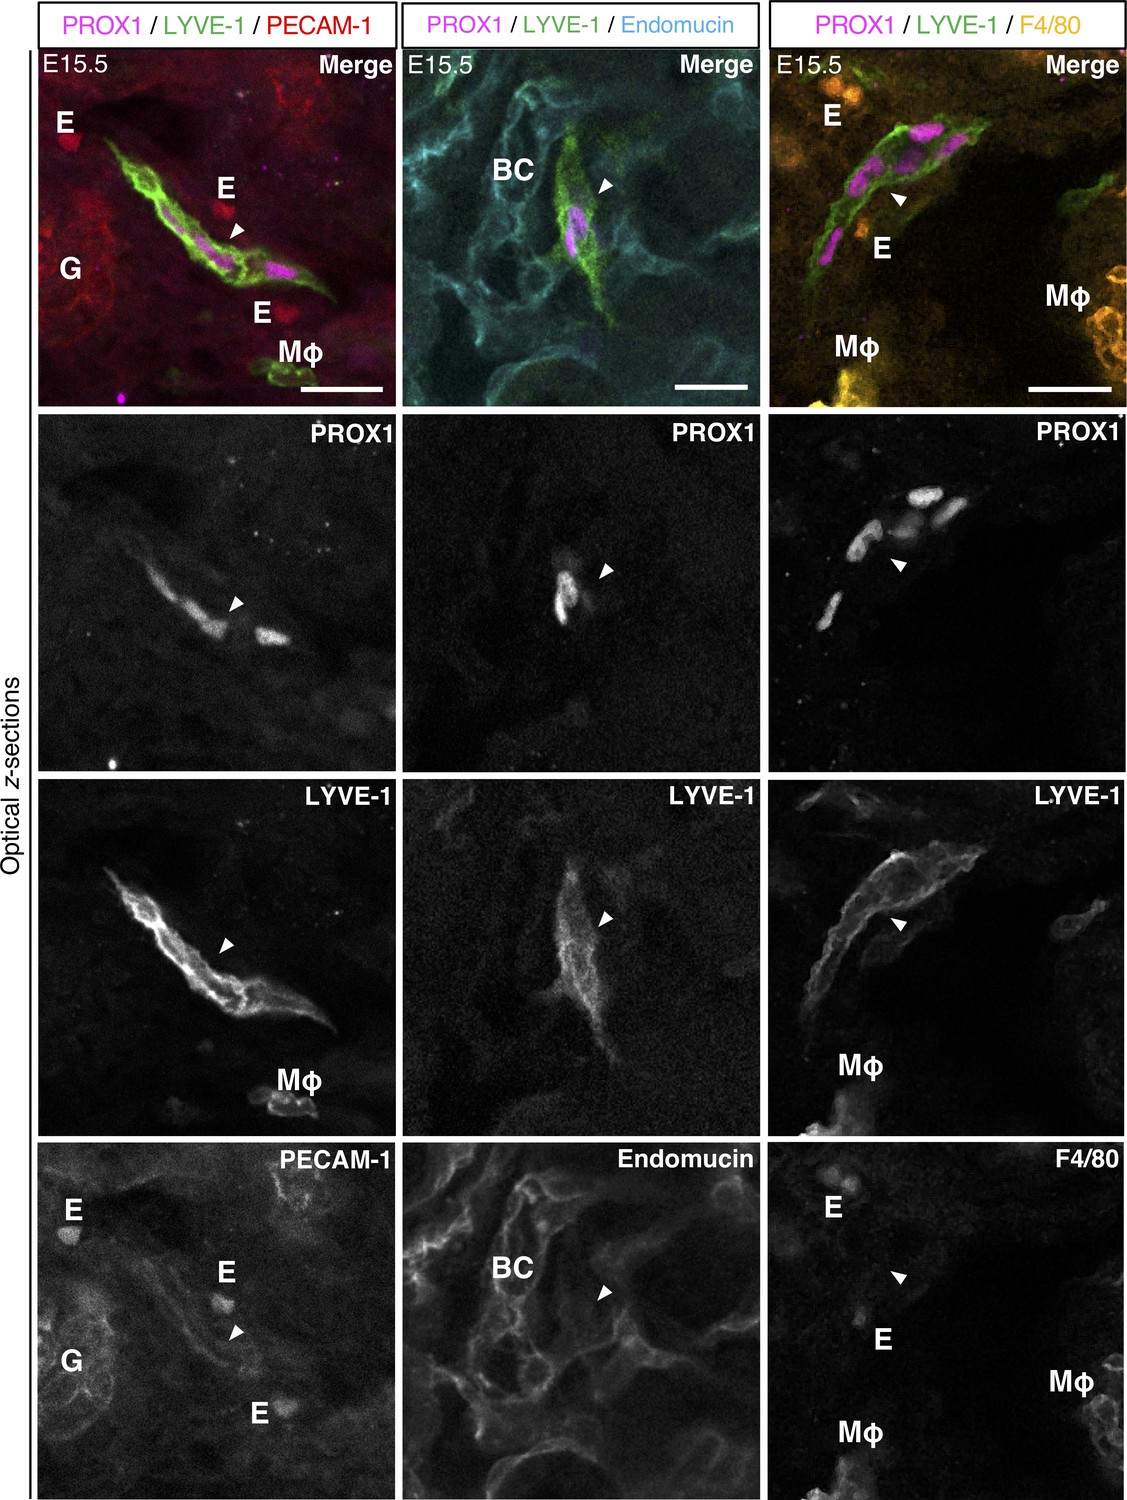
Molecular profile of lymphatic endothelial cell clusters.
Representative optical z-sections of two mouse embryonic kidneys from two independent litters were immunolabelled for PROX1 and LYVE-1, together with immunolabelling for PECAM-1 or endomucin (vascular endothelium) and F4/80 (macrophages). A minimum of three clusters were analyzed per kidney. Lymphatic endothelial cell clusters (white arrowhead) expressed PECAM-1 and endomucin weakly but did not obviously express F4/80. As expression of PECAM-1, endomucin and F4/80 were imaged using a 488 nm laser, erythrocytes were also visible in some images due to heme fluorescence. Scalebars: 20 μm. BC, blood capillary; E, erythrocyte; G, glomerulus; MΦ, macrophage.
Figure 2—video 1
The appearance of lymphatic endothelial cell clusters in the developing mouse kidney.
Cropped 3D reconstruction from high-resolution confocal imaging of an E16.5 mouse embryonic kidney immunolabelled with PROX1 (magenta) and LYVE-1 (green). The video starts at the lymphatic vascular plexus in the hilum of the kidney, before flying through towards the renal cortex, where a structurally and anatomically distinguishable cluster of PROX1+/LYVE-1+ lymphatic endothelial cells is present. The 3D reconstruction was cropped using the orthogonal slicing function in Imaris to make the cluster more visible. LYVE-1+/PROX1- cells are visible throughout the kidney, likely representing a renal macrophage population (see co-expression of F4/80 in Figure 2—figure supplement 1).
Figure 2—video 2
Kidney lymphatic clusters in mouse are responsive to VEGF-C ex vivo.
3D reconstructions of representative E14.5 mouse embryonic kidneys cultured at the air-liquid interface for 48 hr treated without (first) or with (second) 40 ng/ml recombinant VEGF-C, stained for PROX1 (magenta) and LYVE-1 (green). More PROX1+/LYVE-1+ lymphatic clusters are present in the VEGF-C-treated kidney explants.
Figure 3 with 1 supplement

Lymphatic vessels and clusters in the 12PCW human fetal kidney.
(A) Representative 3D reconstructions of 1 mm-thick kidney slices from three independent human fetal kidneys at 12PCW, each stained for PROX1 and podoplanin. We observed PROX1+/podoplanin+ lymphatic vascular networks in the renal hilum and cortex (white arrowheads). Large caliber vessels were visible in the renal hilum (white asterisks). Scalebars: 200 μm. (B) Representative 3D reconstructions of junction between the renal hilum and cortex (dashed line) reveals a distinct lymphatic endothelial cell cluster (white boxed region) expressing PROX1 and podoplanin. This was structurally distinct from lymphatic vessels (white arrowheads) in this region of 12PCW kidneys and are shown in higher magnification in the optical z-sections (right three panels). Adjacent to the cluster (white arrowhead in optical z-section) were PROX1+/podoplanin- cells of unknown identity (white asterisk). Scalebar: 200 μm (3D reconstruction); 20 μm (optical z-section). PROX1 expression was also found in tubular epithelial cells at 12PCW (yellow asterisks throughout). C, cortex; H, hilum; T, tubular epithelium.
Figure 3—video 1
Existence of lymphatic vessels and clusters in the human fetal kidney.
3D reconstruction of a millimeter-thick section from a 12 post-conceptional week (PCW) human kidney, stained with PROX1 (magenta) and podoplanin (green). The video is taken in the region of the junction between the hilum and the cortex. Lymphatic vessels are clearly visible and the video flies through to show that, distant from these vessels, a lymphatic cluster thatlabels for both PROX1 and podoplanin is visible within the cortex of the kidney slice. Adjacent to the cluster are PROX1+/podoplanin- cells of unknown identity.
Figure 4 with 4 supplements
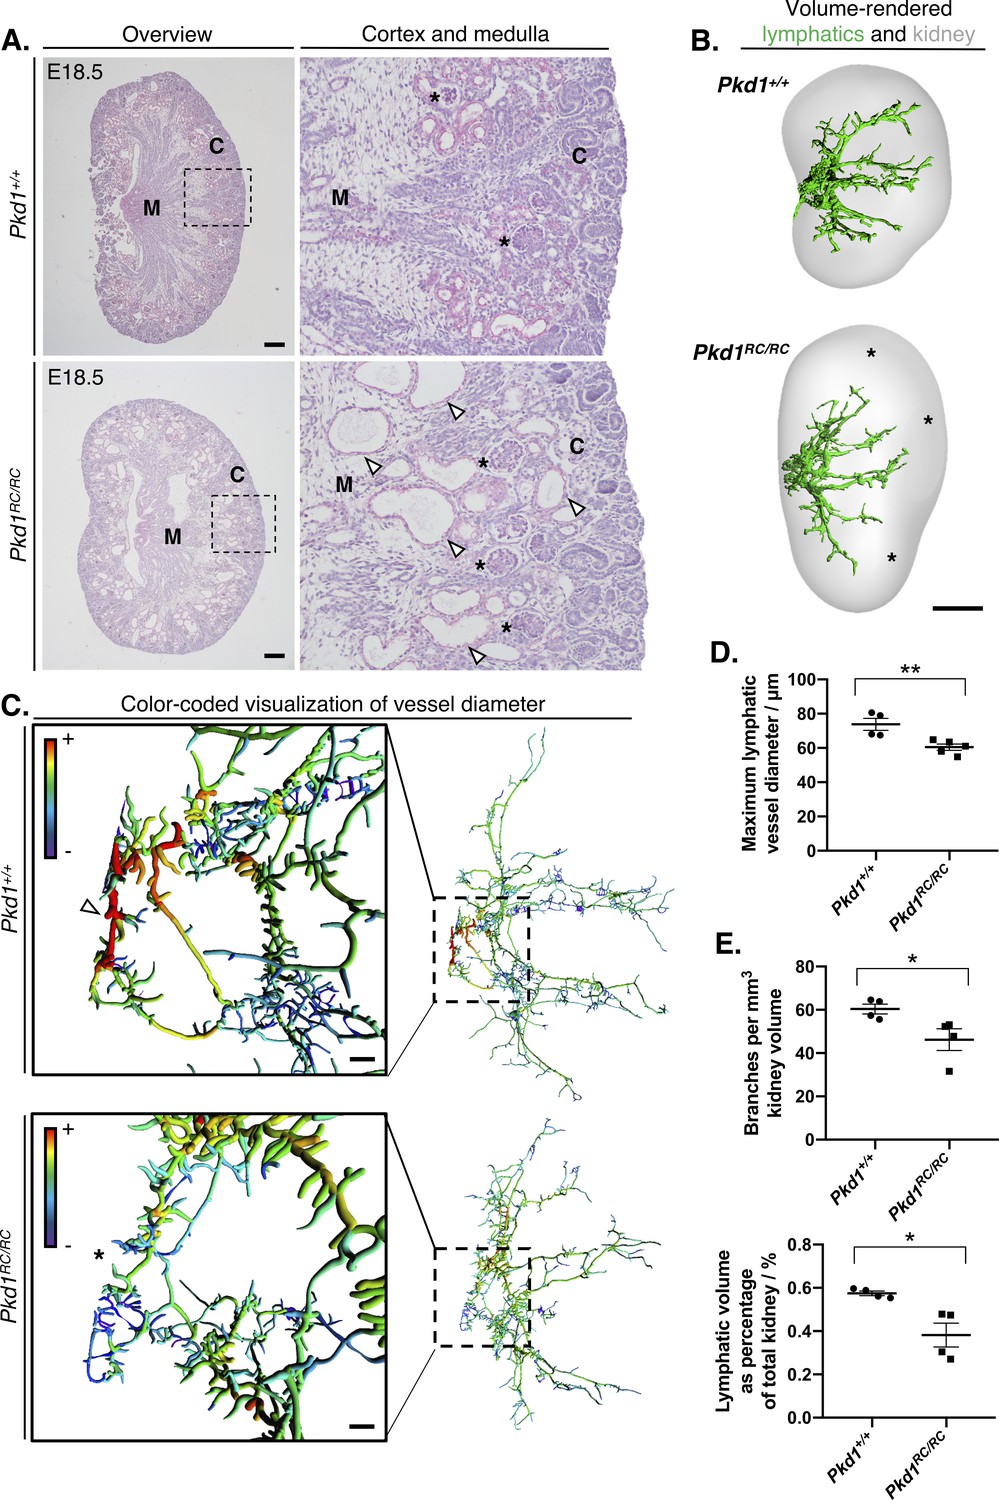
Identification of kidney lymphatic vessel defects in the Pkd1RC mouse model.
(A) Representative brightfield images of four histology slides each from right kidneys of three independent Pkd1RC/RC or Pkd1+/+ mouse embryos at E18.5. We cut 5 μm sections cut from the middle of Pkd1RC/RC and Pkd1+/+ kidneys and stained with periodic acid-Schiff. Panels on the right show magnified images of the boundary between the cortex and medulla in either group (boxed region in low magnification images), where corticomedullary cysts (white arrowheads) are visible in Pkd1RC/RC kidneys at this timepoint. Glomeruli in either group are shown with black asterisks. Scalebars: 200 μm. C, cortex; M, medulla. (B) Volume rendered kidneys and lymphatic vessels in Pkd1RC/RC and Pkd1+/+ kidneys. Overall, the lymphatic network appeared stunted in homozygous mutants and regions within the peripheries of their kidneys were unoccupied by lymphatic vessels at this stage (see black asterisks). Scalebars: 500 μm. (C) Filament tracing and color-coded visualization reveals a structural defect in large-caliber lymphatic vessel diameter in Pkd1RC/RC mice at E18.5. Each vessel branch is color-coded on a spectrum, from the smallest diameter vessels (average branch diameter <20 μm) colored in purple to the largest vessel branch (average branch diameter >70 μm) colored in red. Insets on the left showed the magnified region of the plexus on the right, corresponding to the ring-like anastomosis at the base of the plexus. The large diameter red colored vessel branches in the Pkd1+/+ kidneys (white arrowhead) are absent in the equivalent region in Pkd1RC/RC kidneys (black asterisk). Scalebars: 50 μm. (D) Comparison of maximum vessel diameter in Pkd1+/+ and Pkd1RC/RC kidneys at E18.5. An unpaired Student’s t-test showed that the maximum lymphatic vessel diameter was significantly reduced in Pkd1RC/RC kidneys (t = 3.6 p=0.0087). (E) Lymphatic vessel branches and total lymphatic network volume are reduced per unit of kidney volume in Pkd1RC/RC kidneys. ANOVA showed that both the number of vessel branches per mm of kidney (t = 2.6, p=0.0418) and the percentage occupancy of the volume of the kidney by lymphatic vessels (Welch’s corrected t = 3.4, p=0.0367) were significantly reduced in homozygous mutants compared to wildtype controls at this timepoint. Welch’s correct was applied when testing percentage occupancy of the total kidney volume by lymphatic vessels, as the two groups did not have equality of variances for this parameter. All kidneys from this analysis were pooled from a total of three independent litters. In all graphs, each data point represents the right kidney from an individual embryo and error bars represent standard error of the mean. Raw data and results of all statistical tests are presented in Figure 4—source data 1.
-
Figure 4—source data 1
This spreadsheet contains the numerical raw data and statistics for the quantitative analysis of kidney lymphatic vessel phenotypes in the Pkd1RC mouse model at E18.5 shown in Figure 4D, Figure 4E and Figure 4—figure supplement 1.
- https://cdn.elifesciences.org/articles/48183/elife-48183-fig4-data1-v2.xls
Figure 4—figure supplement 1
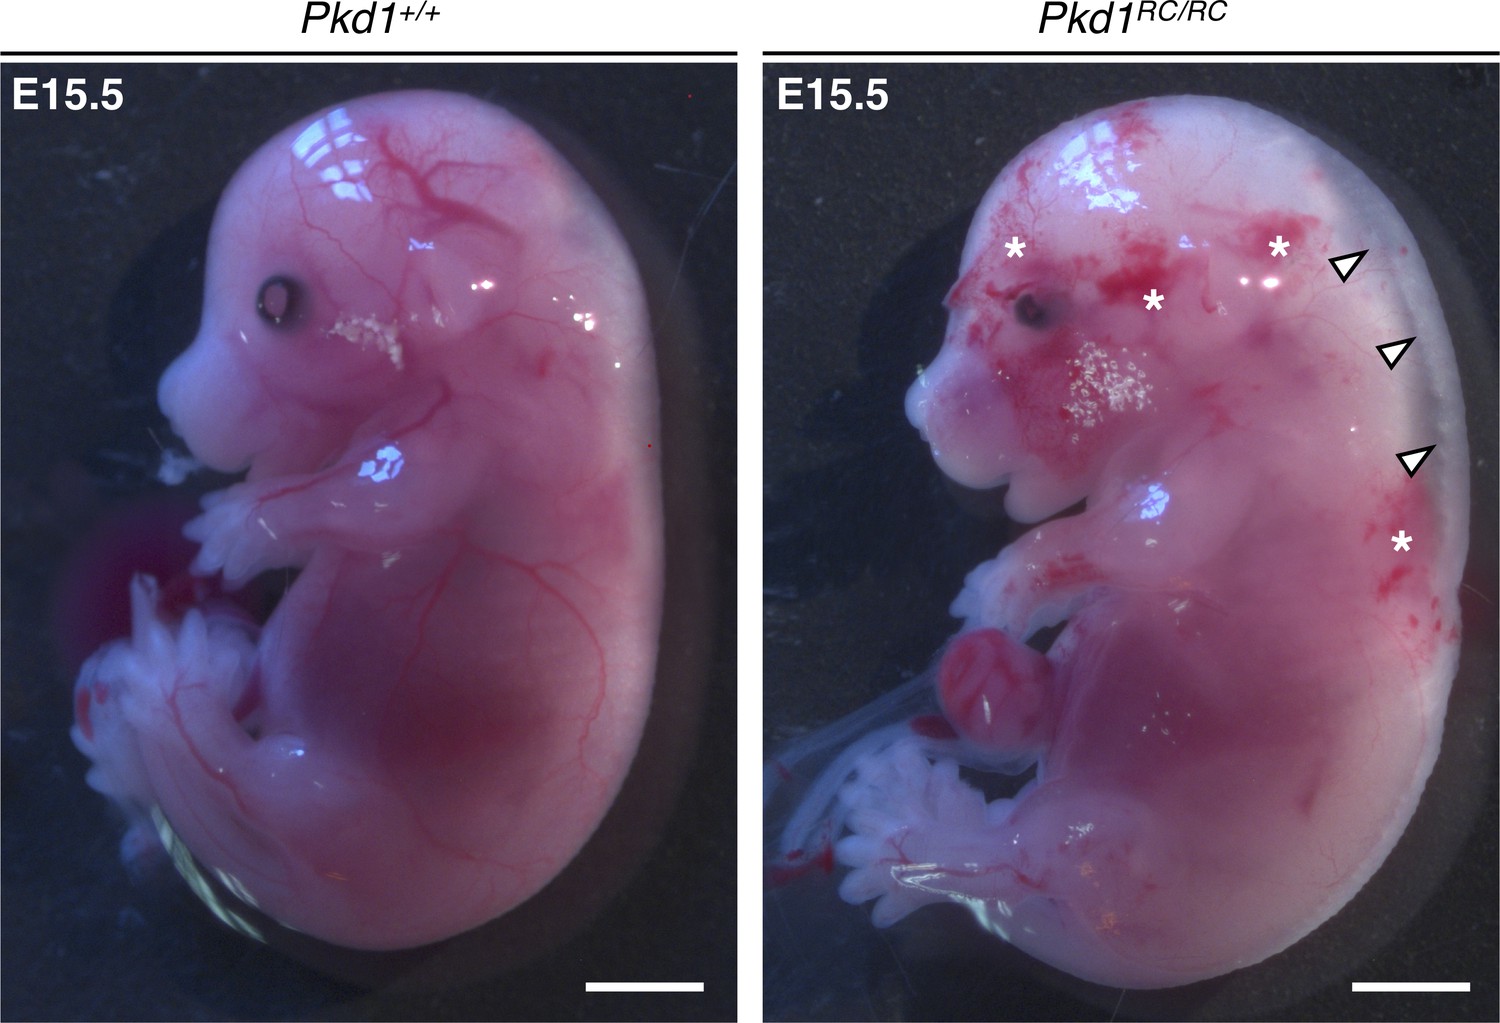
Mouse embryos homozygous for the Pkd1RC allele present with subcutaneous edema and hemorrhage.
Compared to Pkd1+/+ littermates, Pkd1RC/RC embryos are edematous (white arrowheads) and exhibit a hemorrhagic phenotype (white asterisks) at E15.5. Evidence for this phenotype was observed in four out of four mutants from two independent litters. Scalebars: 2 mm.
Figure 4—figure supplement 2

Further quantitative analysis of lymphatic defects in the Pkd1RC mouse model.
Comparison of total number of vessel branches, range of vessel lengths, total lymphatic network volume and total kidney volume between Pkd1+/+ and Pkd1RC/RC kidneys at E18.5. In all graphs, each data point represents values for the right kidney from an individual embryo and error bars represent standard error of the mean. Unpaired Student’s t-tests showed no significant differences in the total number of vessel branches (t = 0.76, p=0.4698), the range of their lengths (t = 0.68; p=0.5367), the total volume of the lymphatic network (t = 1.6, p=0.1804) or the total volume of the kidney (t = 0.05, p=0.96) between the two groups at E18.5. All kidneys from this analysis were pooled from a total of three independent litters and error bars represent standard error of the mean. Raw data and results of all statistical tests are presented in Figure 4—source data 1.
Figure 4—video 1
Close proximity between lymphatic vessels and renal cysts in the Pkd1RC mouse model.
Scan through of serial confocal images taken from the renal cortex of a E18.5 Pkd1RC/RC kidney labelled with lymphatics (green) and the nuclear counterstain Hoechst (grey). The lymphatic vessels in this image have been segmented, retaining only PROX1+/LYVE-1+ structures and the nuclear counterstain. As the video progresses, corticomedullary cysts come into display, and the lymphatic vessels and are seen running adjacent to and in close contact with cells lining the cysts. Scalebar: 50 μm.
Figure 4—video 2
Reduced diameter of large-caliber lymphatic vessels in the Pkd1RC mouse model.
Volume-rendered lymphatic networks and color-coded visual models of Pkd1+/+ (first) and Pkd1RC/RC (second) kidneys at E18.5. When the color-coded visual models are applied (bars visible in the bottom right), where red represents the largest vessel branch diameter (>70 μm) and purple represents the smallest (>20 μm), large-caliber red vessels visible at the base of the lymphatic plexus in the wildtype are reduced in diameter in the equivalent region of the homozygous mutant kidney.
Tables
Key resources table
| Reagent type | Designation | Source (publication) | Identifier | Additional information |
|---|---|---|---|---|
| Biological sample (Mus musculus) | CD-1 wildtype mouse | Charles River | Crl:CD1(ICR) | Maintained as a random bred closed colony in house |
| Biological sample (Mus musculus) | VegfcLacZ mouse | See Karkkainen et al. (2004) | Vegfctm1Ali RRID:IMSR_EM:10734 | VegfcLacZ/+ males mated with Vegfc+/+ females to generate experimental litters, maintained on a CD-1 background |
| Biological sample (Mus musculus) | Pkd1 p.R3277C mouse | See Hopp et al. (2012) | Pkd1tm1.1Pcha RRID: MGI:5476836 | Pkd1RC/+ animals mated to generate experimental litters, maintained on a C57BL/6 background |
| Biological sample (Homo sapiens) | Human fetal kidney | Human Developmental Biology Resource (Gerrelli et al., 2015) | - | Material obtained at 12PCW |
| Peptide, recombinant protein | Vascular endothelial growth factor C | R and D Systems | Cat# 9199-VC-025 | Added to culture medium at 40 ng/ml |
| Sequence-based reagent | Pkd1RC_F | See Hopp et al. (2012) | PCR primers | CAAAGGTCTGGGTGATAACTGGTG |
| Sequence-based reagent | Pkd1RC_R | See Hopp et al. (2012) | PCR primers | CAGGACAGCCAAATAGACAGGG |
| Antibody | Anti-PROX1 (Goat polyclonal) | R and D Systems | Cat# AF2727 RRID:AB_2170716 | Wholemount immunofluorescence (1:200) in mouse and human. Transcription factor labelling nuclei of lymphatic endothelium (Wigle and Oliver, 1999) and some tubular epithelium within the kidney (Kim et al., 2015) |
| Antibody | Anti-PROX1 (Rabbit polyclonal) | Millipore | Cat# ABN278 RRID:AB_2811075 | Wholemount immunofluorescence (1:200) in mouse only. |
| Antibody | Anti-LYVE-1 (rabbit polyclonal) | Abcam | Cat# ab14917 RRID:AB_301509 | Wholemount immunofluorescence (1:100) in mouse only. Labels lymphatic endothelial cell surface (Banerji et al., 1999). Present on F4/80+ macrophages and venous endothelium in the developing mouse kidney (Lee et al., 2011) |
| Antibody | Anti-LYVE-1 (goat polyclonal) | R and D Systems | Cat# AF2125 RRID:AB_2297188 | Colorimetric immunohistochemistry (1:20) of VegfcLacZ/+ mouse kidney sections. |
| Antibody | Anti-podoplanin (Syrian hamster monoclonal) | ThermoFisher Scientific | Cat# 14-5381-82 Clone: 8.1.1 RRID:AB_1210505 | Wholemount immunofluorescence (1:100) in mouse only. Expressed on lymphatic endothelial cell membranes (Wetterwald et al., 1996; Breiteneder-Geleff et al., 1999). Also expressed on podocytes within the developing and mature kidney (Breiteneder-Geleff et al., 1997) |
| Antibody | Anti-podoplanin (Mouse monoclonal) | Agilent | Cat# M361929-2 Clone: D2-40 RRID:AB_2162081 | Wholemount immunofluorescence (1:100) in human only. Expressed on lymphatic endothelial cell membranes within the human fetal kidney (Jin et al., 2010). |
| Antibody | Anti-VEGFR-3 (Goat polyclonal) | R and D Systems | Cat# AF743 RRID:AB_355563 | Wholemount immunofluorescence (1:100) in mouse only. Expressed on lymphatic endothelial cell membranes and blood endothelia in the developing kidney (Kenig-Kozlovsky et al., 2018; Kaipainen et al., 1995). |
| Antibody | Anti-endomucin (Rat monoclonal) | Santa-Cruz | Cat# sc-53941 Clone: V.5C7 RRID:AB_2100038 | Wholemount immunofluorescence (1:50) in mouse only. |
| Antibody | Anti-PECAM-1 (Rat monoclonal) | BD Biosciences | Cat# 553370 Clone: MEC13.3 RRID:AB_394816 | Wholemount immunofluorescence (1:50) in mouse only. |
| Antibody | Anti-F4/80 (Rat monoclonal) | Bio-Rad | Cat# MCA497 Clone: Cl:A3.1 RRID:AB_2098196 | Wholemount immunofluorescence (1:50) in mouse only. |
| Antibody | Anti-UPK3A (Rabbit polyclonal) | Abcam | Cat# ab82173 RRID:AB_2213493 | Wholemount immunofluorescence (1:100) in mouse only. |
| Antibody | Anti-AQP2 (Rabbit polyclonal) | Abcam | Cat# ab15116 RRID:AB_301662 | Wholemount immunofluorescence (1:100) in mouse only. |
| Other | Hoechst 33342 | Life Technologies | Cat# H3570 | Nuclear counterstain. Wholemount immunofluorescence (1:2000) |
| Software, algorithm | ImageJ/FIJI | https://imagej.net/Welcome (Schindelin et al., 2012) | RRID:SCR_002285 | Version 2.0 |
| Software, algorithm | Zen | https://www.zeiss.com/microscopy/int/products/microscope-software/zen.html | - | - |
| Software, algorithm | Imaris | http://www.bitplane.com | RRID:SCR_007370 | Version 8.2. Imaris FilamentTracer used in this paper (RRID:SCR_007366) |
| Software, algorithm | Amira | https://www.thermofisher.com/uk/en/home/industrial/electron-microscopy/electron-microscopy-instruments-workflow-solutions/3d-visualization-analysis-software/amira-life-sciences-biomedical.html | RRID:SCR_007353 | Version 5.4 |
Additional files
-
Source code 1
FIJI Macro for segmentation of PROX1+/LYVE-1+ structures.
- https://cdn.elifesciences.org/articles/48183/elife-48183-code1-v2.docx
-
Transparent reporting form
- https://cdn.elifesciences.org/articles/48183/elife-48183-transrepform-v2.pdf
Download links
A two-part list of links to download the article, or parts of the article, in various formats.
Downloads (link to download the article as PDF)
Open citations (links to open the citations from this article in various online reference manager services)
Cite this article (links to download the citations from this article in formats compatible with various reference manager tools)
Spatiotemporal dynamics and heterogeneity of renal lymphatics in mammalian development and cystic kidney disease
eLife 8:e48183.
https://doi.org/10.7554/eLife.48183


