The structure of the yeast Ctf3 complex
- Harvard Medical School, Howard Hughes Medical Institute, United States
- Harvard University, United States
Figures
Figure 1 with 1 supplement
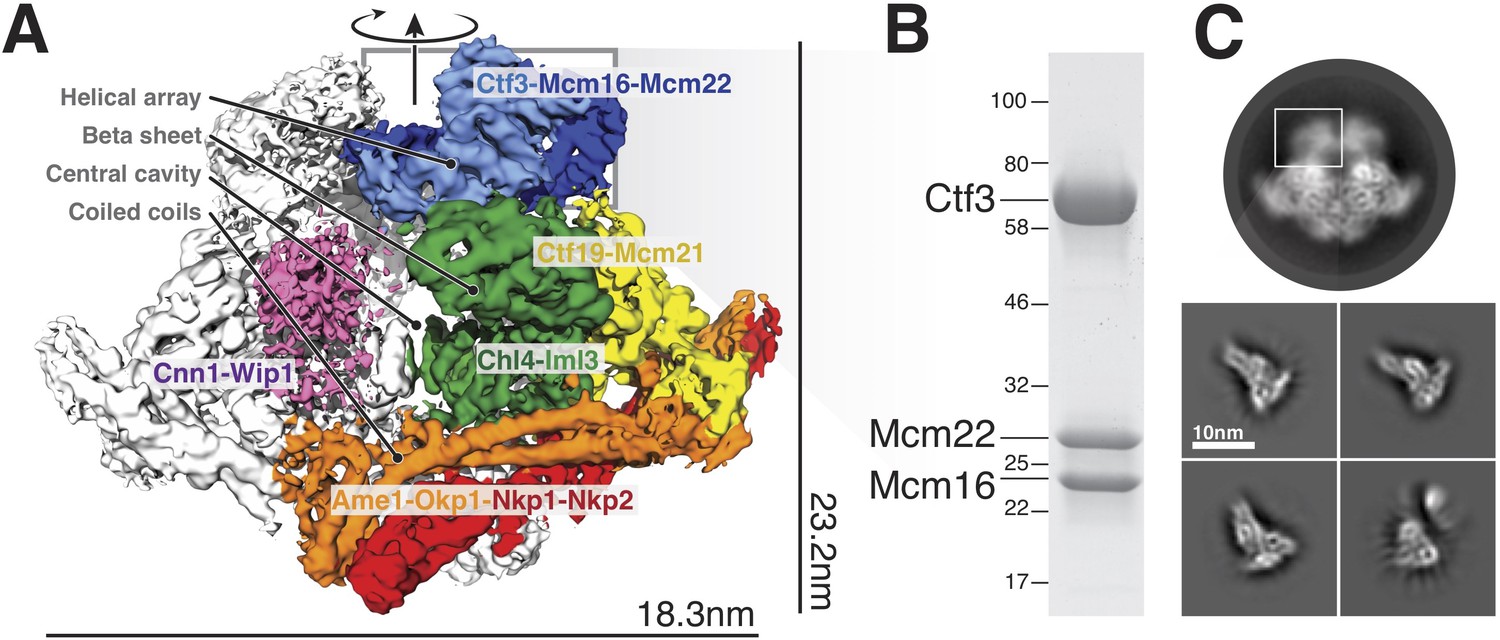
Overview of the Ctf19c and position of the Ctf3c within it.
(A) Ctf19c density map colored according to constituent subcomplexes (Hinshaw and Harrison, 2019). (B) The recombinant Ctf3c sample used for cryo-EM (size markers – kDa). (C) Two-dimensional class averages showing the full Ctf19c (circle) and the Ctf3c (squares). The white box indicates the fuzzy Ctf19c density assigned to the Ctf3c.
Figure 1—figure supplement 1
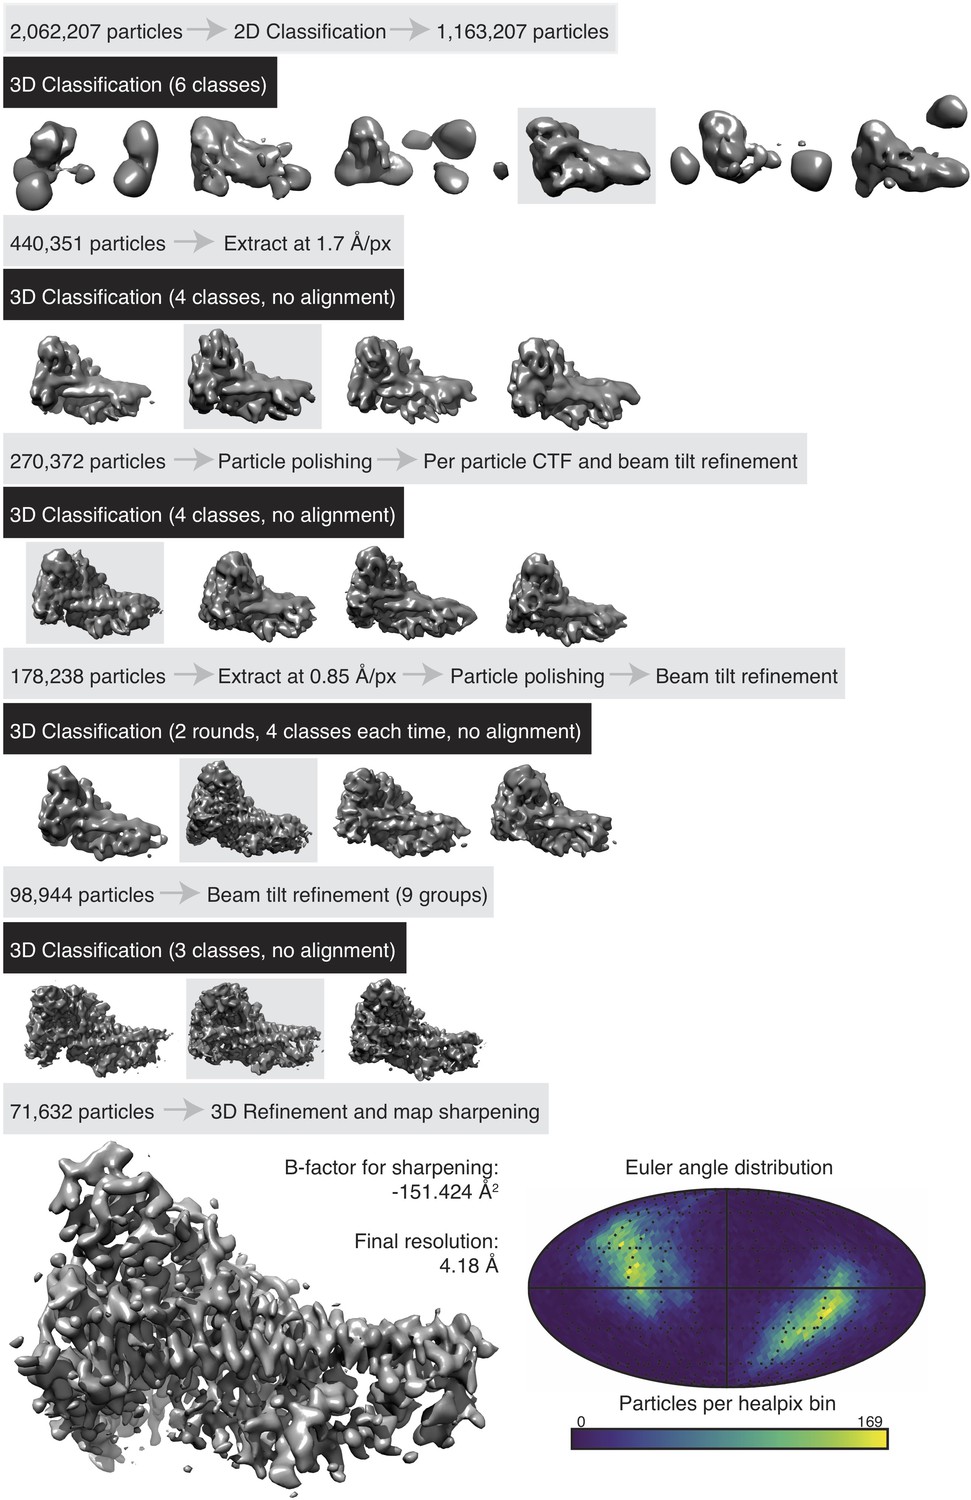
Cryo-EM data processing The data processing procedure for Ctf3c structure determination is shown.
Three-dimensional refinement using a soft mask around the particle volume was carried out before each three-dimensional classification step, particle polishing step, and round of particle parameter refinement (CTF or beam tilt parameters). For the final round of beam tilt refinement, data was segmented into groups according to the relative hole position from where the particle data originated. The Euler angle plot (bottom right) shows the Euler angular distribution according to real-space HEALPix binning (Gorski et al., 2005).
Figure 2 with 2 supplements
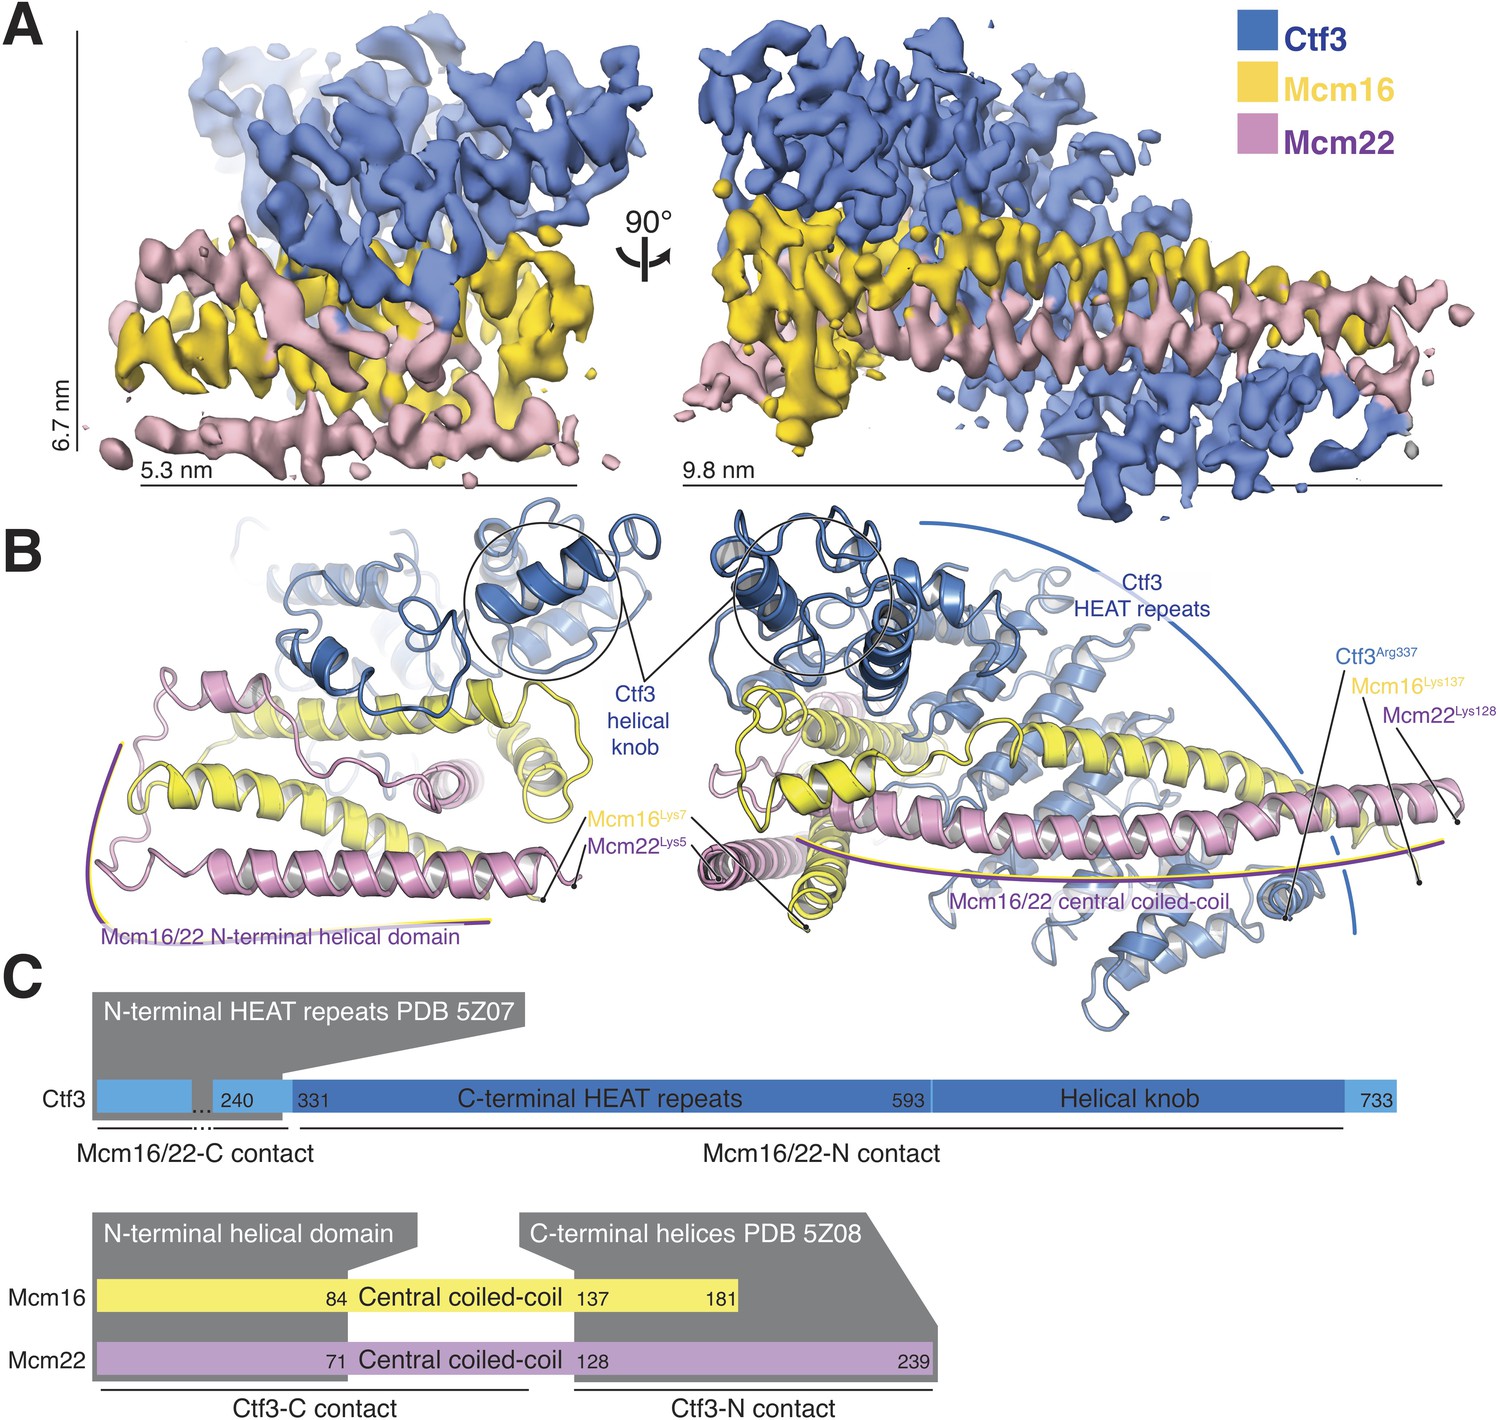
Overview of the Ctf3c structure determined by cryo-EM.
(A) Cryo-EM density map shown in in two orientations. The density is colored according to the atomic model of the complex. (B) Atomic model of the Ctf3c colored according to panel (A) and shown in the same orientations. Prominent Ctf3c features are labeled. (C) Domain diagram depicting Ctf3c components. Lines below the colored bars indicate Ctf3-Mcm16/22 contacts. Text inside the colored bars and gray boxes indicates domain structure. PDB numbers refer to the published crystal structures of Ctf3-N and Mcm16/22 C (Hu et al., 2019).
Figure 2—figure supplement 1
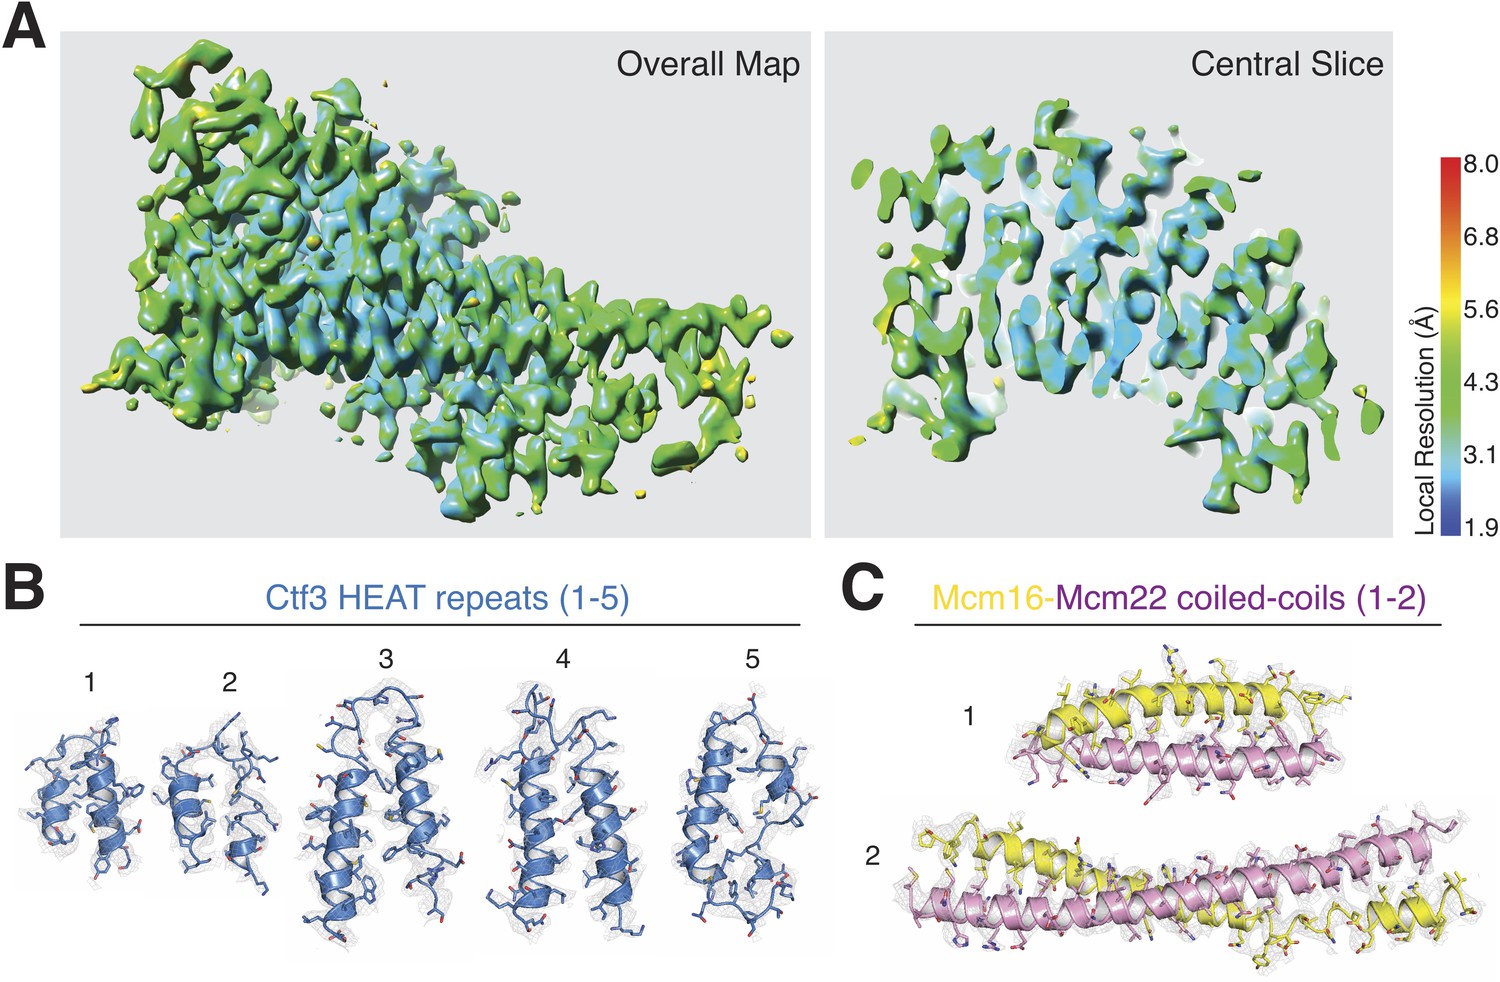
Analysis of cryo-EM density map quality and model fitting.
(A) Local resolution estimation for the Ctf3c density map (pValue 0.05, minRes 1.90 Å, maxRes 8.00 Å, step 1.0 Å). (B) Cryo-EM density and model fitting for Ctf3-C HEAT repeats 1–5 (designated from N- to C-terminus of the modeled polypeptide chain; 1 – 354–386, 2 – 391–423, 3 – 430–475, 4 – 477–525, 5 – 531–576). (C) Cryo-EM density and model fitting for the Mcm16/22 N parallel coiled-coils (1 – Mcm16-7-38 and Mcm22-7-38, 2 – Mcm16-80-136 and Mcm22-69-130).
Figure 2—figure supplement 2
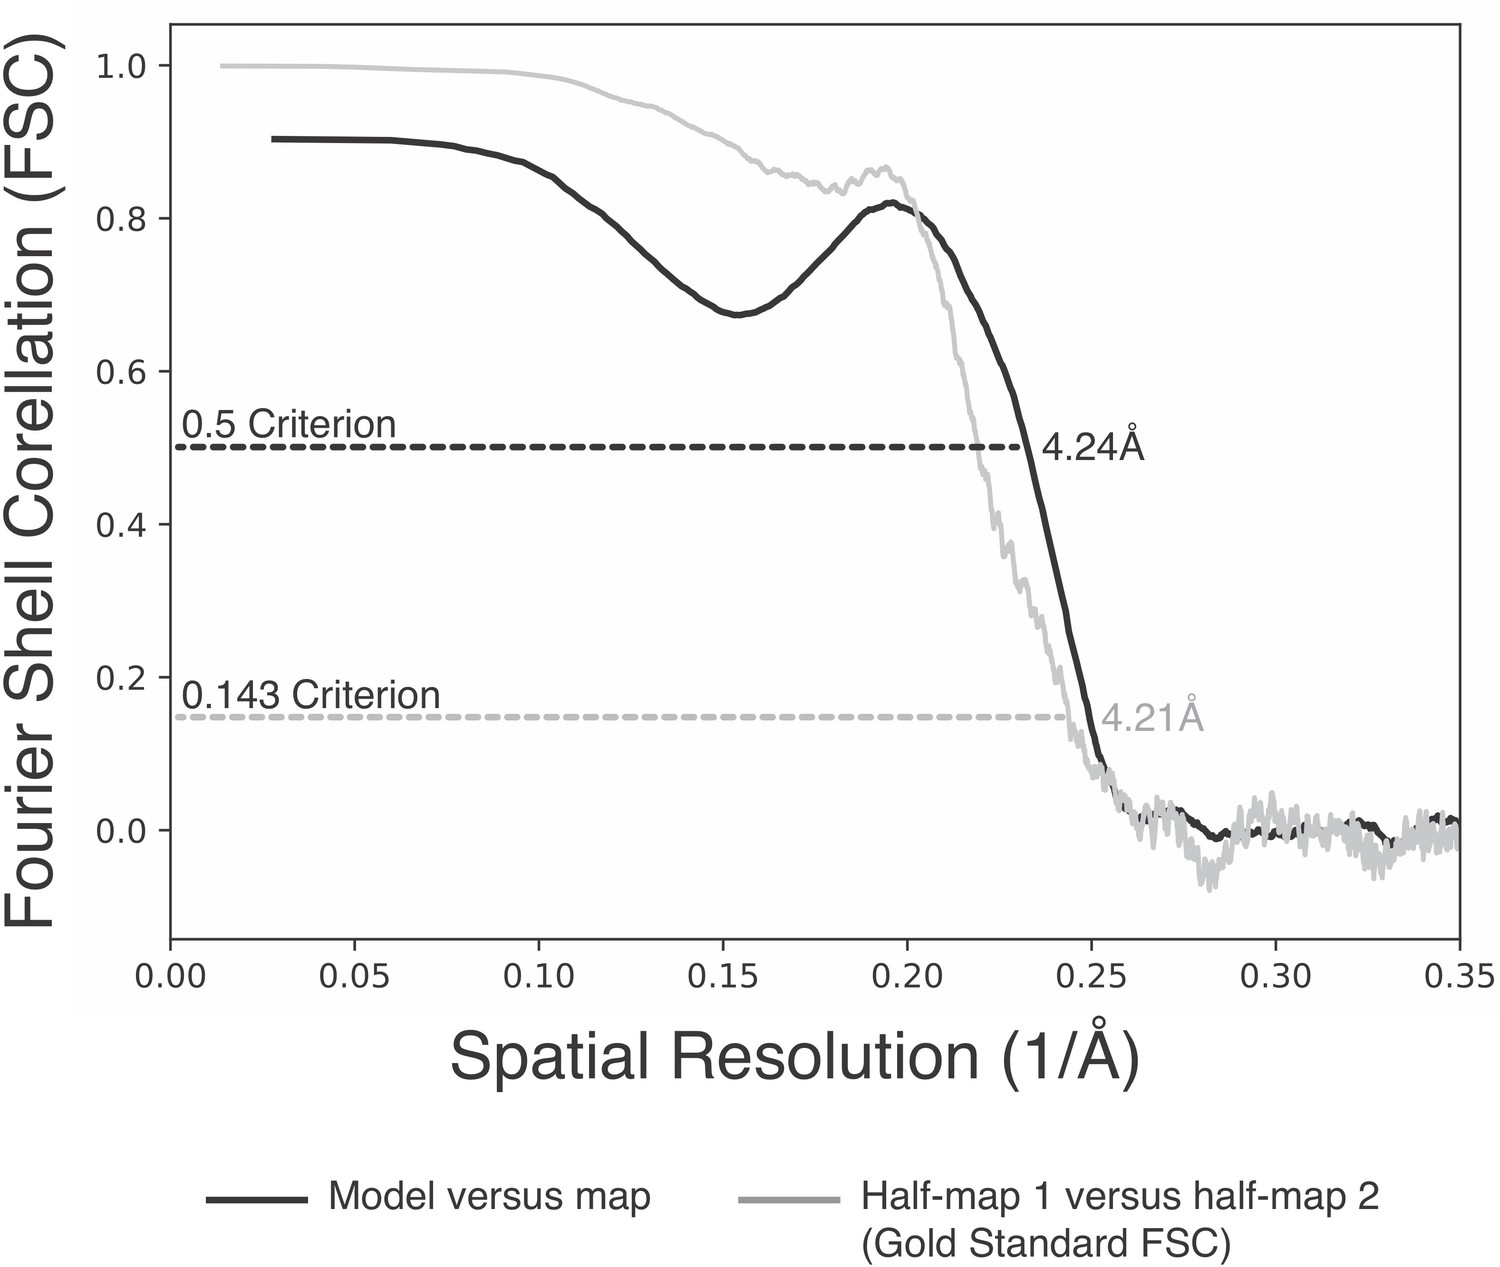
Fourier shell correlation curves describing the Ctf3c density map (half-map to half-map) and map-to-model correlations.
https://doi.org/10.7554/eLife.48215.006
Figure 3 with 1 supplement
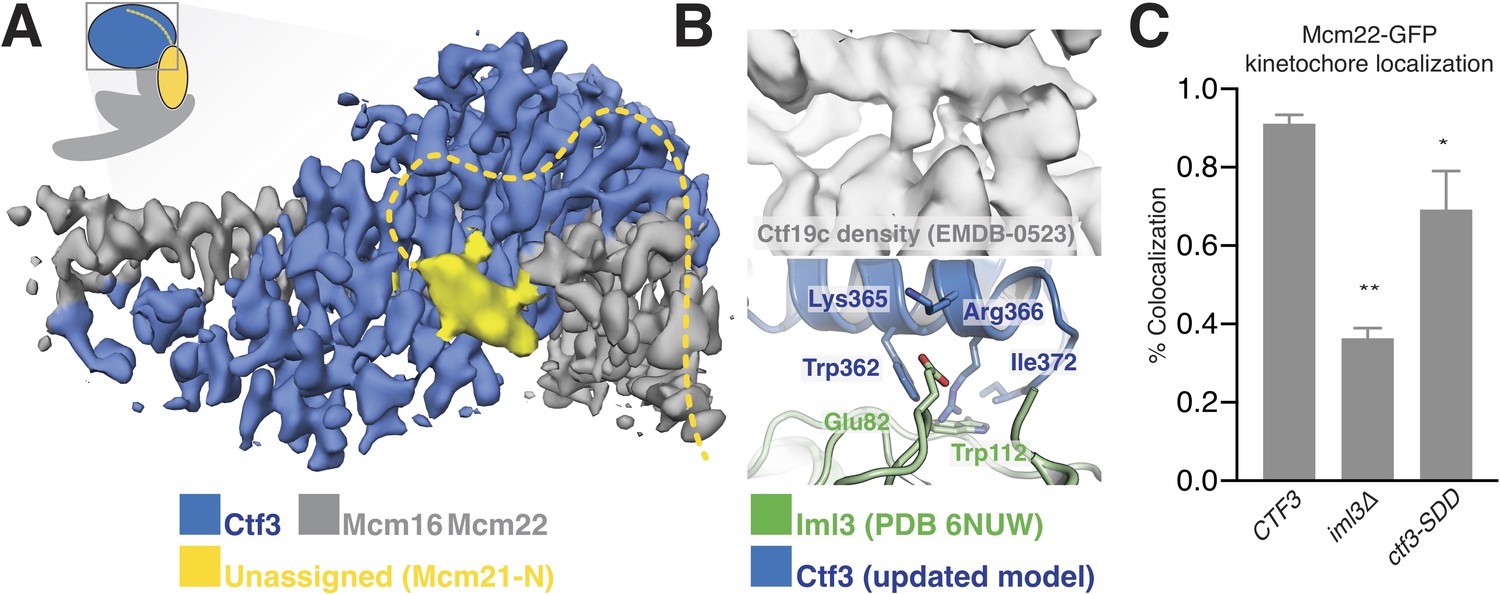
Interactions between the Ctf3c and the full Ctf19c.
(A) Composite cryo-EM density map showing extra density, only visible in the original Ctf19c map, which likely belongs to Mcm21-N. The image was created by combining the high-resolution Ctf3c map (blue and gray) with the displayed yellow density from the Ctf19c map (EMDB-0523). The inset shows the position of the map in the context of the full Ctf19c model. (B) Cryo-EM density showing the interaction between Ctf3 and Iml3. The top panel shows density determined for the interface in the context of the full Ctf19c. The bottom panel shows a composite model; Iml3 coordinates refined into the Ctf19c cryo-EM map are green, and Ctf3 coordinates refined into the current density map are blue. (C) The indicated S. cerevisiae strains (CTF3 – CTF3-3FLAG: SMH690, SMH691, SMH692; iml3Δ: SMH91; ctf3-SDD – ctf3-SDD-3FLAG: SMH693, SMH694, SMH695) expressing Mcm22-GFP and Spc110-mCherry were imaged during asynchronous division. Coincidence frequencies of Mcm22-GFP foci with Spc110-mCherry foci are plotted (error bars –±SD for frequency measurements from three independent cultures; * – p<0.05; ** – p<0.01, Student’s t-test, two tails, unequal variance).
Figure 3—figure supplement 1
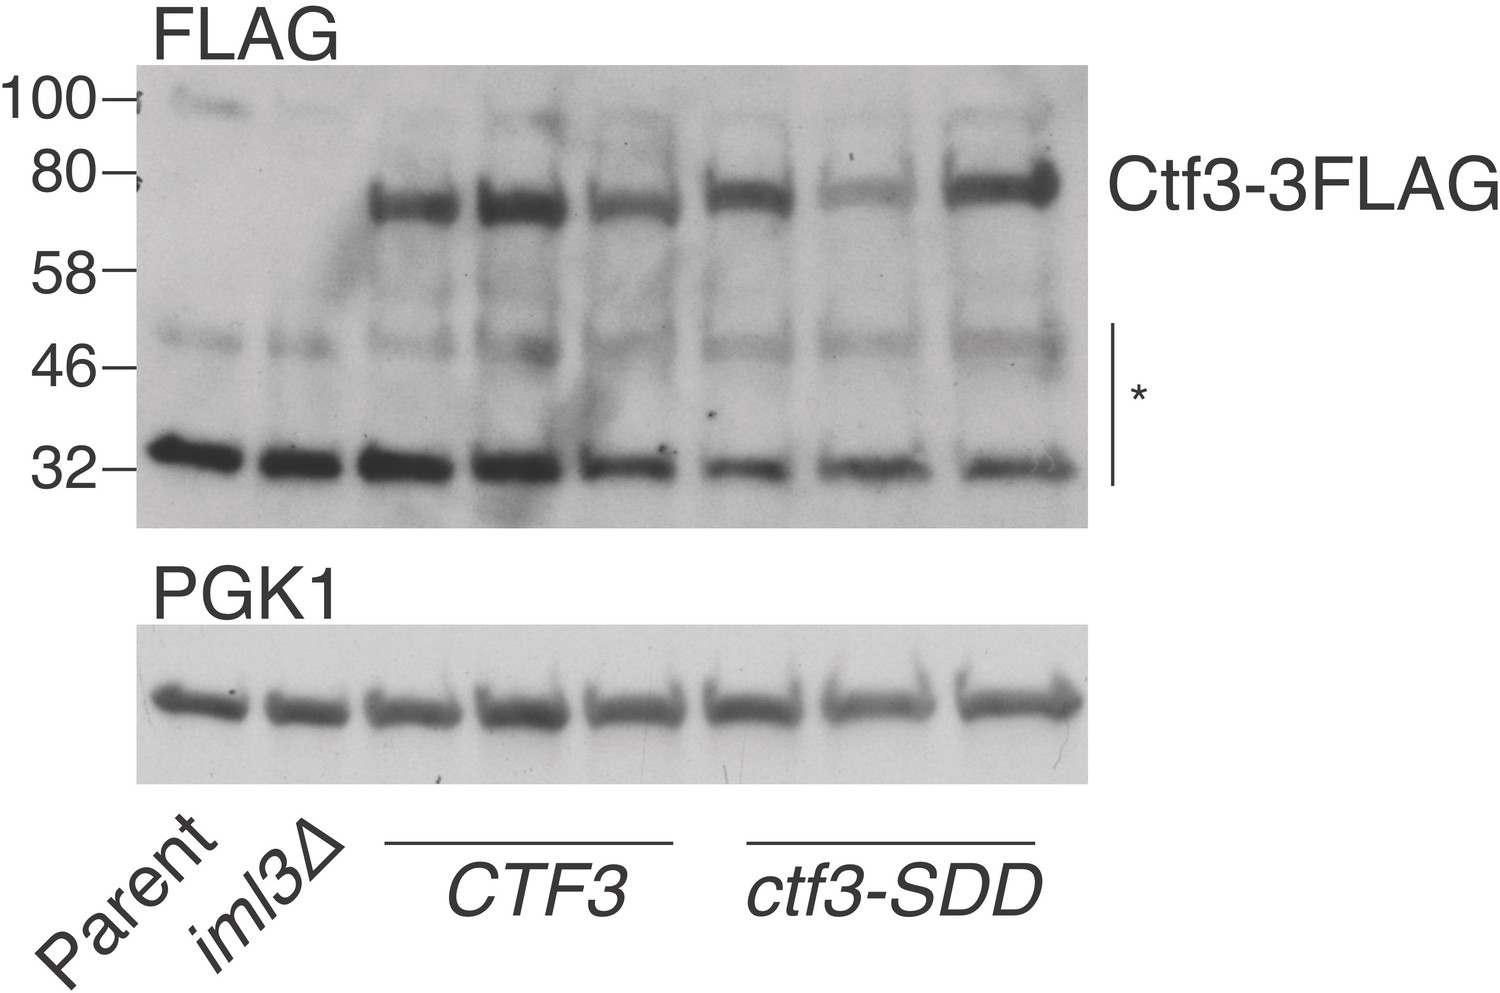
Expression levels of Ctf3 WT and mutant proteins.
Total cellular protein extract was analyzed by Western blot for the presence of Ctf3-3FLAG in the indicated strains (* – non-specific bands; Parent: SMH81; iml3Δ: SMH91; CTF3 – CTF3-3FLAG: SMH690, SMH691, SMH692; ctf3-SDD – ctf3-SDD-3FLAG: SMH693, SMH694, SMH695).
Figure 4
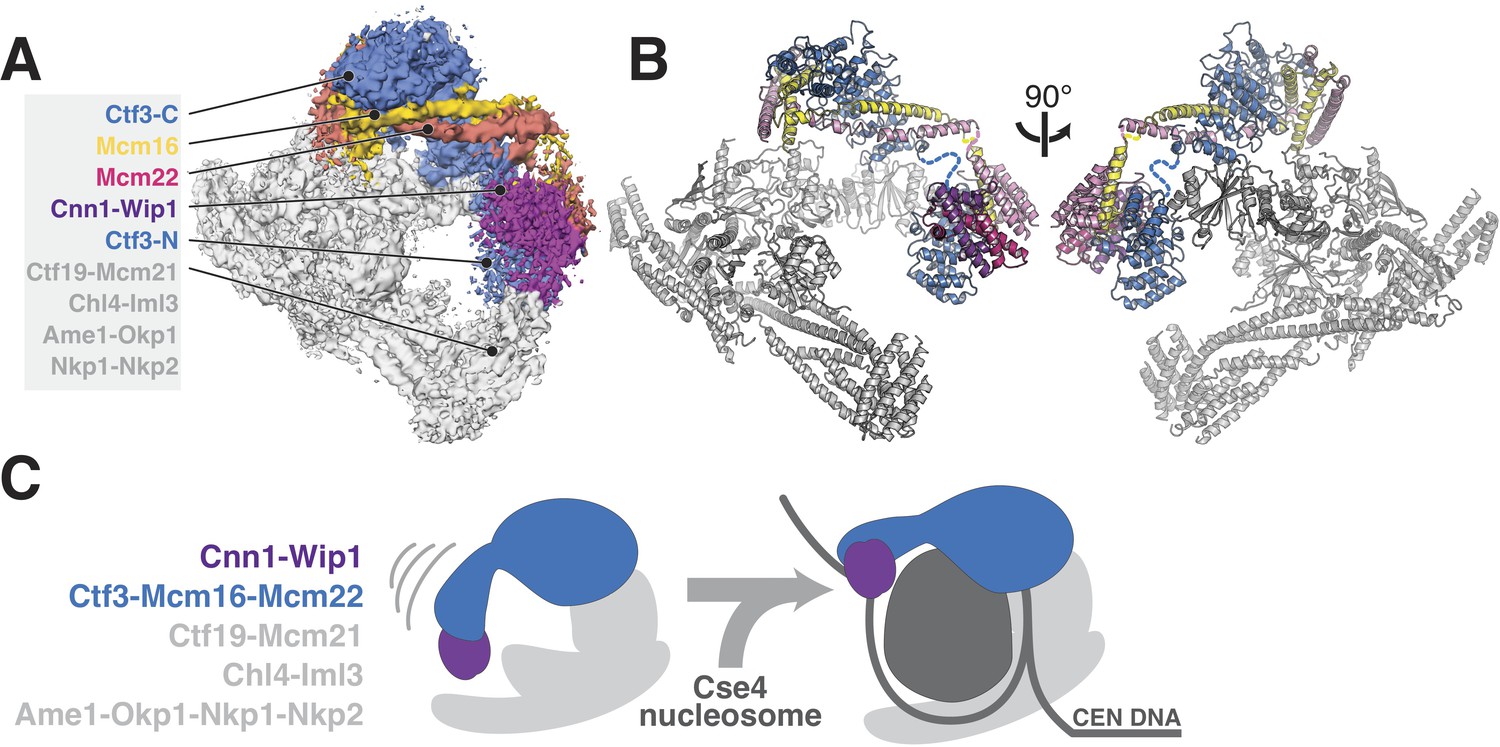
Updated model of Ctf19c architecture and interactions.
(A–B) Cryo-EM density map (A) and corresponding composite atomic model (B) showing the 13-protein Ctf19c in its monomeric form (EMDB-0523). The Ctf3 N-terminal HEAT repeat domain and adjacent Cnn1-Wip1 heterodimer, both of which occupy updated positions in the overall model, are labeled. The Ctf3c components visualized in the current study are also labeled. The Ctf3-N-Mcm16/22 C module (PDB 5Z08), with Ctf3-N substituted by a homology model, was positioned to minimize the gap between ordered parts of Mcm16/22 (reported here and previously) (Hu et al., 2019). The interaction between Ctf3-N and Cnn1-Wip1 has not been visualized experimentally, so the histone-fold extension of Cnn1 required for Ctf3 contact (Pekgöz Altunkaya et al., 2016) was used to position Cnn1-Wip1 with respect to Ctf3-N. (C) Proposed model for nucleosome accommodation by the Ctf19c in its monomeric form. Ctf3-N, along with Cnn1-Wip1, flex up and outward to make space for a Cse4/CENP-A nucleosome. Current data does not distinguish between one or two copies of the Ctf19c decorating the Cse4/CENP-A particle. A single Ctf19c was therefore drawn for clarity.
Tables
Table 1
Model information.
https://doi.org/10.7554/eLife.48215.011| Protein | Chain ID | HOMOLOGS (Human; pombe) | Chain length (Total; Modeled) | Template | Procedure | Modelled residues |
|---|---|---|---|---|---|---|
| Mcm16 | H | CENP-H; Fta3 | 181; 130 | -- | Build de novo | 7–137 |
| Ctf3 | I | CENP-I; Mis6 | 733; 381 | 6NUW | Modify, build de novo | 337–718 |
| Mcm22 | K | CENP-K; Sim4 | 239; 124 | -- | Build de novo | 5–128 |
Key resources table
| Reagent type (species) or resource | Designation | Source or reference | Identifiers | Additional information |
|---|---|---|---|---|
| Gene (S. cerevisiae) | See Table 2 | |||
| Strain, strain background (S. cerevisiae) | S288c | |||
| Genetic reagent (S. cerevisiae) | See Table 2 | |||
| Antibody | anti-FLAG-HRP (mouse monoclonal) | Sigma | A8592 | (1:1000) |
| Antibody | anti-PGK1 (mouse monoclonal) | Invitrogen | 459250 | (1:5000) |
| Antibody | goat anti-mouse-IgG-HRP (rabbit polyclonal) | Abcam | Ab97046 | (1:10000) |
| Recombinant DNA reagent | See Table 3 | |||
| Cell line (E. coli) | Rosetta 2(DE3)pLysS; E. coli | EMD Millipore | 71403 | Harrison lab stock |
| Software, algorithm | SerialEM (v3.7) | Mastronarde, 2005 | ||
| Software, algorithm | MotionCor2 (v1.1.0) | Zheng et al., 2017 | ||
| Software, algorithm | CTFFIND4 (v4.1.8) | Rohou and Grigorieff, 2015 | ||
| Software, algorithm | Relion (v3.0.1) | Kimanius et al., 2016 | ||
| Software, algorithm | ResMap (v1.1.4) | Kucukelbir et al., 2014 | ||
| Software, algorithm | PyMol (v2.1.0) | Schrödinger, LLC | ||
| Software, algorithm | Chimera (v1.11.2) | Pettersen et al., 2004 | ||
| Software, algorithm | Coot (v0.8.8) | Emsley et al., 2010 | ||
| Software, algorithm | Phenix (v1.13) | Afonine et al., 2018 | ||
| Software, algorithm | TrackMate (v3.0.0) | Tinevez et al., 2017 | ||
| Software, algorithm | MAFFT | Katoh et al., 2017 | ||
| Software, algorithm | JalView | Waterhouse et al., 2018 | ||
| Software, algorithm | Phyre2 | Kelley et al., 2015 | ||
| Software, algorithm | Fiji | Schmitzberger and Harrison, 2012 | ||
| Software, algorithm | python 2.7.2 | www.python.org | ||
| Other (holey carbon grids) | C-flat | Electron Microscopy Sciences | CF-2/1–4C |
Table 2
Yeast strains used in this study.
https://doi.org/10.7554/eLife.48215.012| Strain number | Genotype | Reference |
|---|---|---|
| SMH81 | MATa MCM22-GFP::HisMX SPC110-mCherry::hphMX | (Huh et al., 2003) |
| SMH91 | MATa MCM22-GFP::HisMX SPC110-mCherry::hphMX iml3Δ::KanMX | This study |
| SMH690 | MATa MCM22-GFP::HisMX SPC110-mCherry::hphMX CTF3-3FLAG::KanMX | This study |
| SMH691 | MATa MCM22-GFP::HisMX SPC110-mCherry::hphMX CTF3-3FLAG::KanMX | This study |
| SMH692 | MATa MCM22-GFP::HisMX SPC110-mCherry::hphMX CTF3-3FLAG::KanMX | This study |
| SMH693 | MATa MCM22-GFP::HisMX SPC110-mCherry::hphMX ctf3-SDD-3FLAG::KanMX | This study |
| SMH694 | MATa MCM22-GFP::HisMX SPC110-mCherry::hphMX ctf3-SDD-3FLAG::KanMX | This study |
| SMH695 | MATa MCM22-GFP::HisMX SPC110-mCherry::hphMX ctf3-SDD-3FLAG::KanMX | This study |
Table 3
Plasmids used in this study.
https://doi.org/10.7554/eLife.48215.013| Plasmid number | Genotype | Reference |
|---|---|---|
| pSMH145 | pLIC-Tra His6-TEV-Ctf3; His6-TEV-Mcm16; His6-TEV-Mcm22 | (Hinshaw et al., 2017) |
| pSMH1269 | pFA6a-CTF3-6Gly-3FLAG-KanMX6 (BsiWI/SalI) | This study |
| pSMH1577 | pFA6a-ctf3-SDD-6Gly-3FLAG-KanMX6 (BsiWI/SalI) | This study |
Table 4
Cryo-EM data collection, refinement, and validation.
https://doi.org/10.7554/eLife.48215.010| CTF3c (EMDB-20200) (PDB 6OUA) | |
|---|---|
| Data collection and processing | |
| Magnification | 105,000 |
| Voltage (kV) | 300 |
| Electron exposure (e–/Å2) | 51 |
| Defocus range (μm) | −1.5 to −3.5 |
| Pixel size (Å) | .85 |
| Symmetry imposed | None |
| Initial particle images (no.) | 2,062,207 |
| Final particle images (no.) | 71,632 |
| Map resolution (Å) FSC threshold | 4.18 (0.143) |
| Refinement | |
| Initial model used (PDB code) | 6NUW |
| Model resolution (Å) FSC threshold | 4.24 (0.5) |
| Model resolution range (Å) | 40–4.18 |
| Map sharpening B factor (Å2) | −151.424 |
| Model composition Non-hydrogen atoms Protein residues Ligands | 5208 637 0 |
| B factors (Å2) | Min: 36.02 Max: 141.08 Mean: 72.17 |
| R.m.s. deviations Bond lengths (Å) Bond angles (°) | 0.008 1.351 |
| Validation MolProbity score Clashscore Poor rotamers (%) | 2.37 7.09 2.35 |
| Ramachandran plot Favored (%) Allowed (%) Disallowed (%) | 82.25 99.68 0.32 |
Additional files
-
Transparent reporting form
- https://doi.org/10.7554/eLife.48215.014
Download links
A two-part list of links to download the article, or parts of the article, in various formats.
Downloads (link to download the article as PDF)
Open citations (links to open the citations from this article in various online reference manager services)
Cite this article (links to download the citations from this article in formats compatible with various reference manager tools)
The structure of the yeast Ctf3 complex
eLife 8:e48215.
https://doi.org/10.7554/eLife.48215


