Adaptive substitutions underlying cardiac glycoside insensitivity in insects exhibit epistasis in vivo
- Princeton University, United States
- University of Pittsburgh, United States
- University of Pittsburgh School of Medicine, United States
- Columbia University, United States
- Justus-Liebig-Universität Gießen, Germany
Figures
Figure 1 with 4 supplements
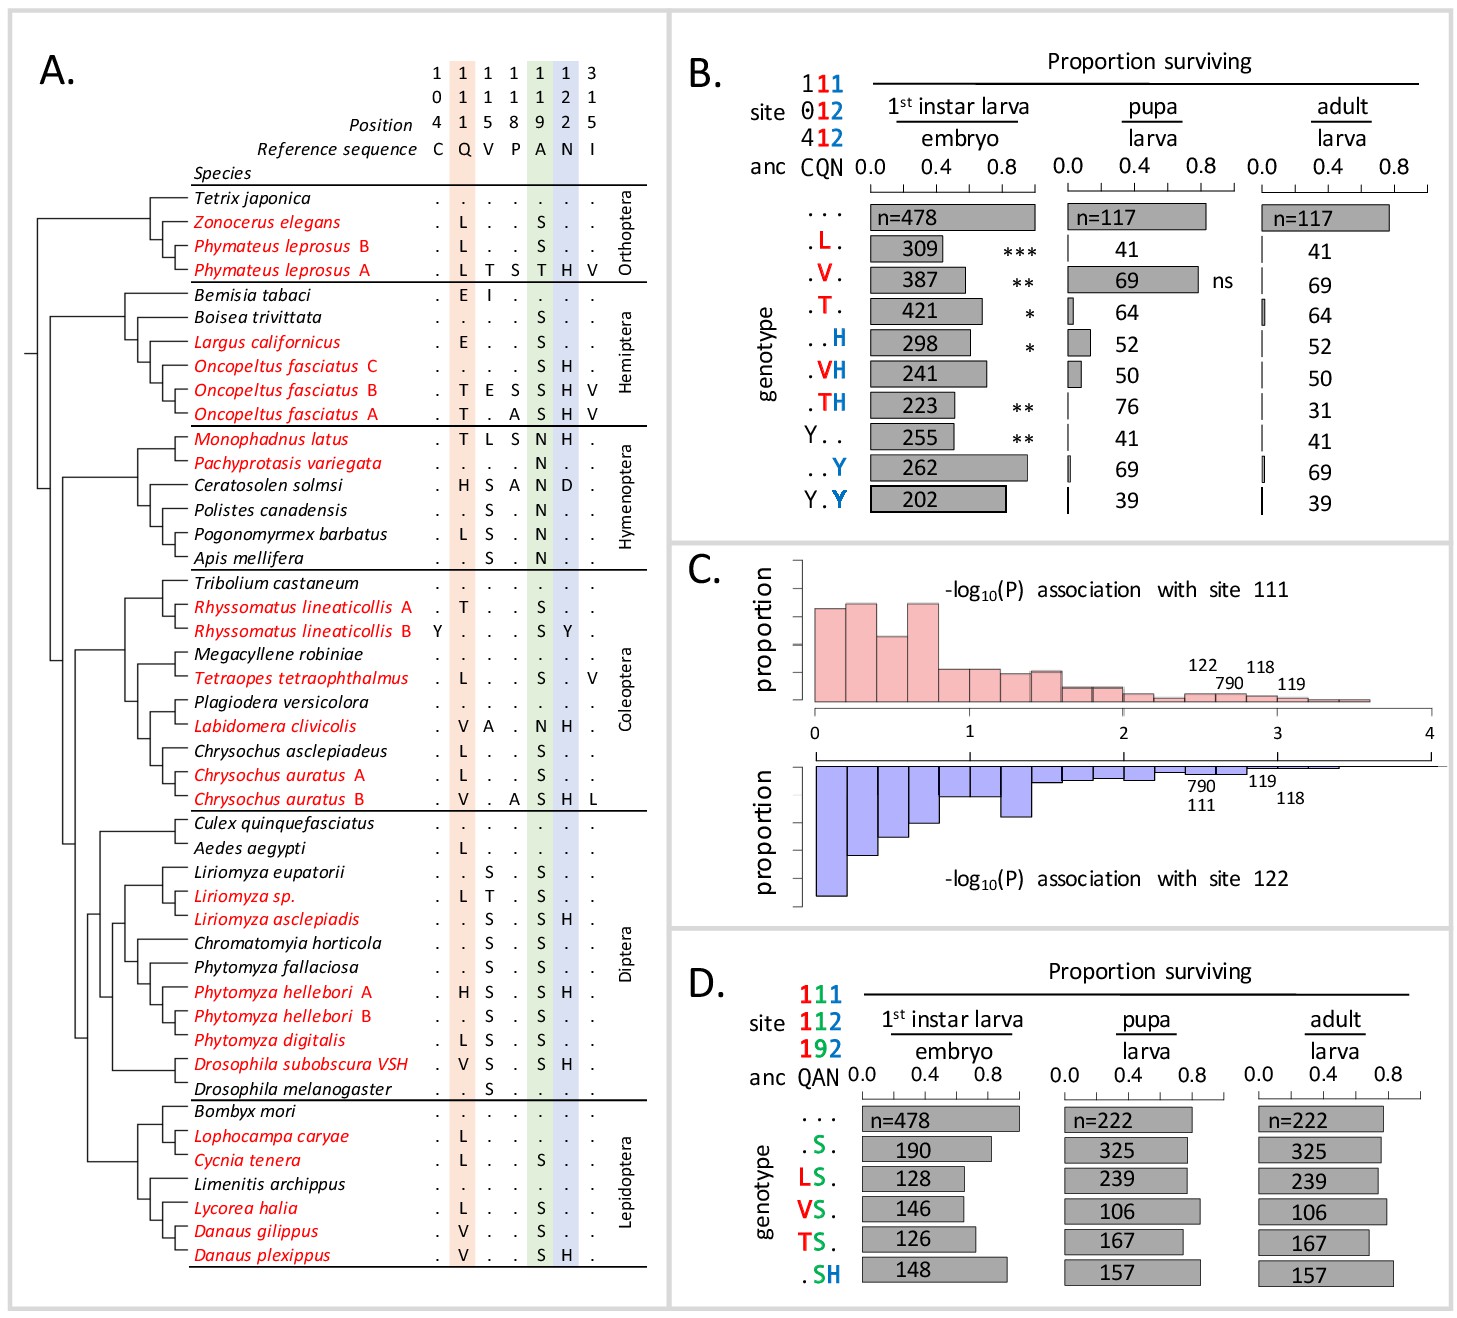
Deleterious effects of substitutions at positions 111 and 122 are ameliorated by the permissive substitution A119S.
(A) Patterns of amino acid substitution at sites implicated in CG sensitivity near the H1-H2 transmembrane domain of ATPα1 in representative species from six insect orders (see Supplementary file 1 for all species). CG-adapted species names are shown in red. Dots indicate identity with the ancestral reference sequence and letters indicate derived amino acid substitutions. Positions 111 and 122, highlighted in pink and blue respectively, are hotspots of frequent parallel substitution. C104Y and N122Y represent rare substitutions associated with ATPα1 duplication (Zhen et al., 2012). Position 119 (highlighted in green) had not been previously implicated in CG sensitivity, but is identified as a candidate permissive substitution in subsequent analyses. (B) Viability of homozygous first instar larvae, pupae and adults for the first series of engineered substitution lines. Dots indicate identity with the ancestral reference at sites C104, Q111, and N122. Plotted is the proportion of surviving homozygous mutant offspring (i.e. EYFP-), scaled by the proportion for the wild-type control. The number of individuals assayed is indicated in each case. Survival odds relative to the wild type-strain (…) was tested using a Fisher’s Exact Test, with adjusted P-values indicated as: ***p<0.001; **p<0.01, *p<0.05. All larvae to pupa survivorship are significantly lower than wild-type (p<1e-5) except for Q111V. All larvae to adult survivorship are significantly lower than wild-type (p<1e-5). (C) Distributions of P-values for the strength of the phylogenetic correlation between sites 111 (above) or 122 (below) and 270 non-singleton amino acid variants in a multi-sequence alignment including 174 ATPα1 sequences representing 161 species. Sites 111 and 122 exhibit highly correlated evolution. Three additional sites in the lowest 5% of P-values shared in common between sites 111 and 122, including site 119, are labeled. (D) Viability of homozygous first instar larvae, pupae and adults for the second series of engineered substitution lines that include A119S relative to the wild-type control. Dots indicate identity with the ancestral reference at sites Q111, A119, and N122. The number of individuals assayed is indicated in each case. Despite slight reductions in viability, all reductions are not significant relative to wild-type line after multiple test correction.
Figure 1—figure supplement 1
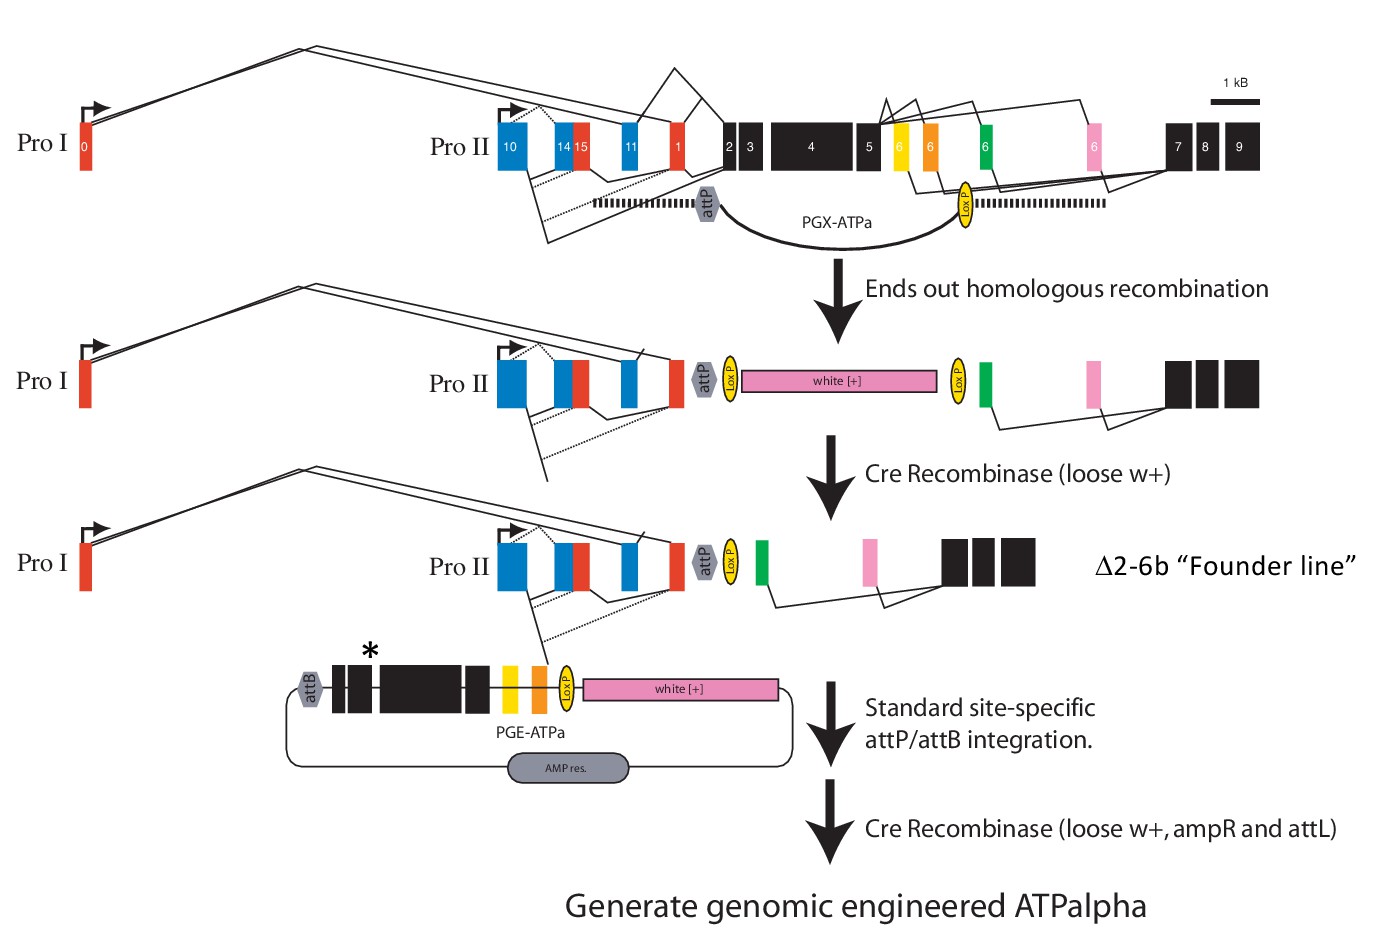
Engineering strategy for generating amino acid substitution lines.
A targeted replacement of exons 2-6b with a mini-white gene was generated by ends-out homologous recombination. The mini-white gene was removed using Cre-lox site-specific recombination to create the Δ2-6b ‘Founder line’. The founder line is injected with the PGE-ATPa plasmid carrying a substitution of choice (asterisk) and incorporated by site-specific phiC31/attP integration. The mini-white gene was removed using Cre-lox site-specific recombination to create engineered ATPα (ATPalpha) lines (Supplementary file 1).
Figure 1—figure supplement 2
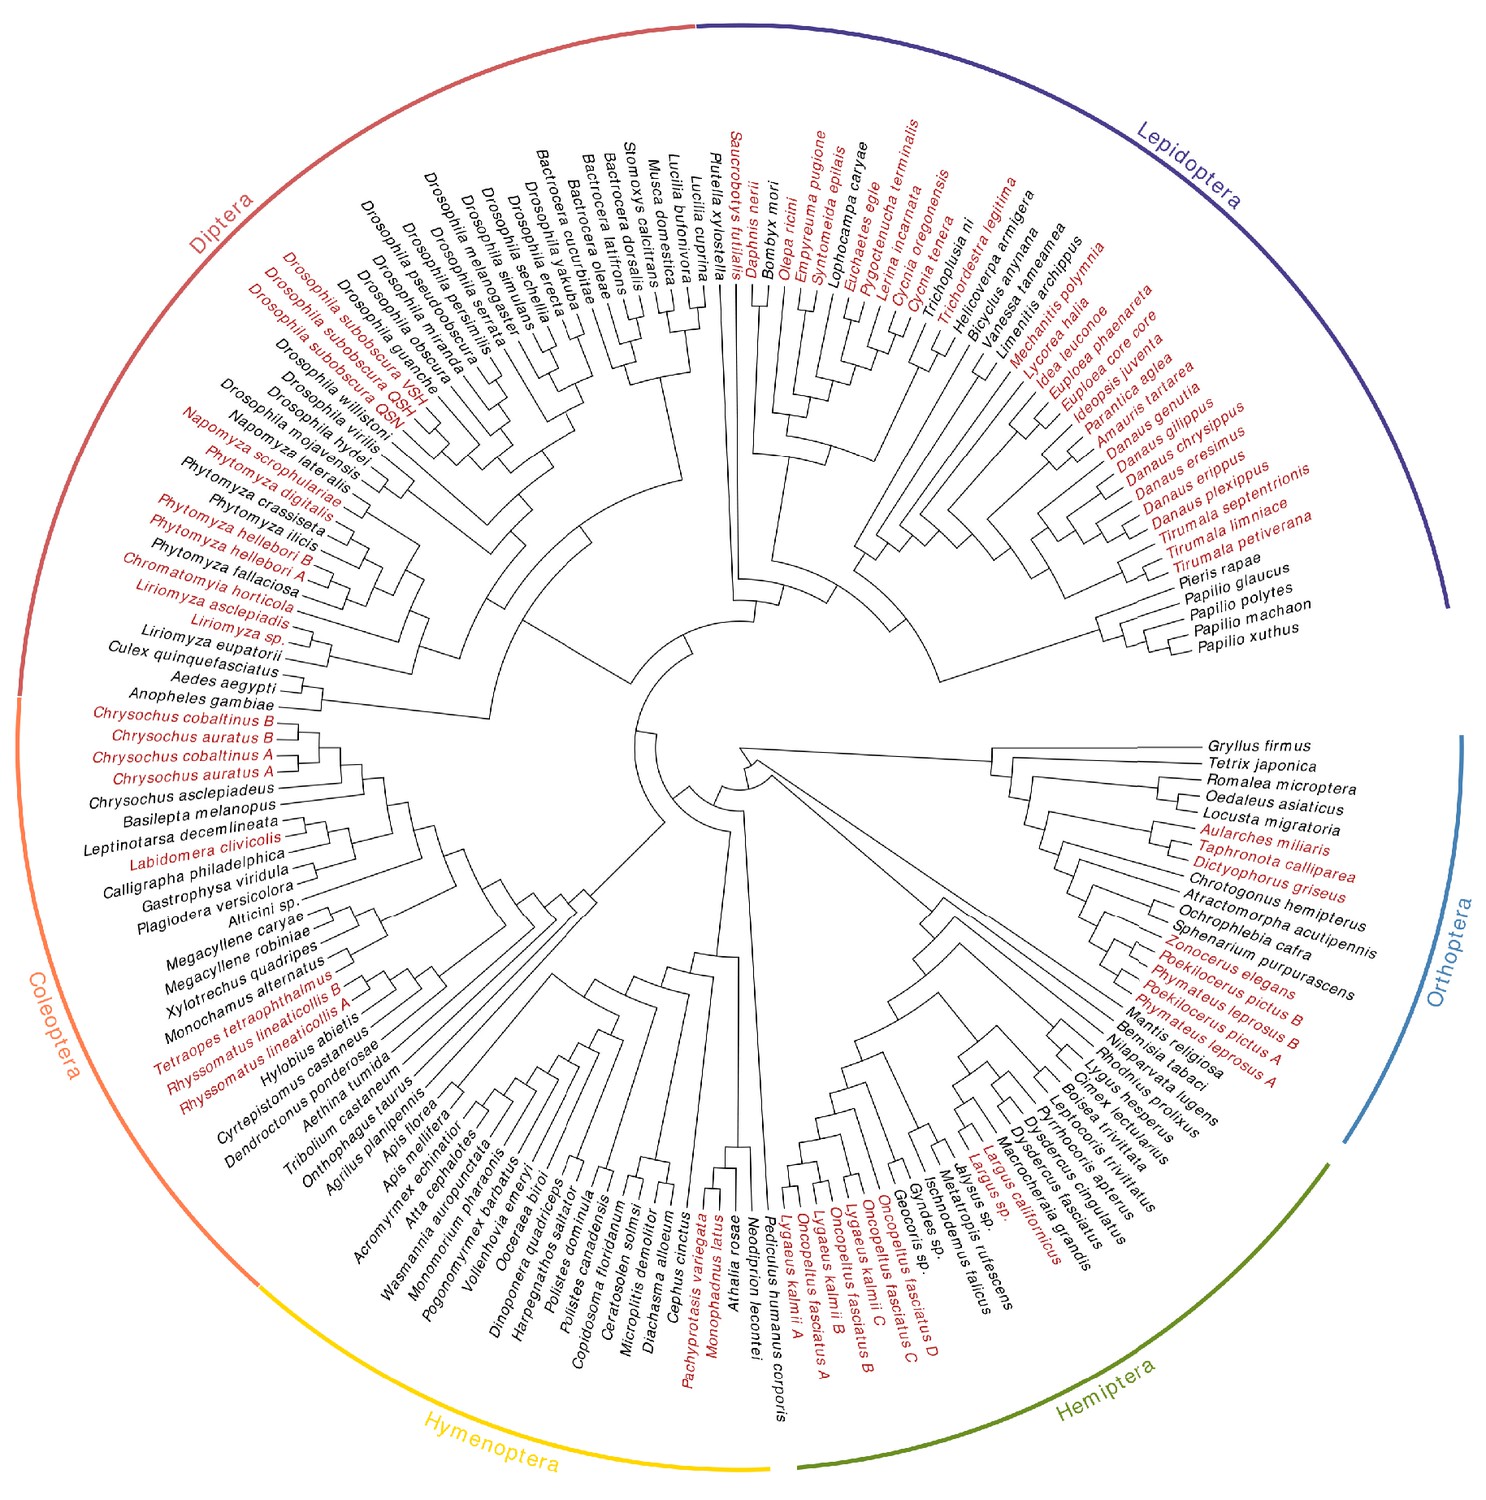
Phylogeny showing relationships of the sampled species.
In red are species known specialists on CG-containing plants or inferred to be CG-insensitive.
Figure 1—figure supplement 3
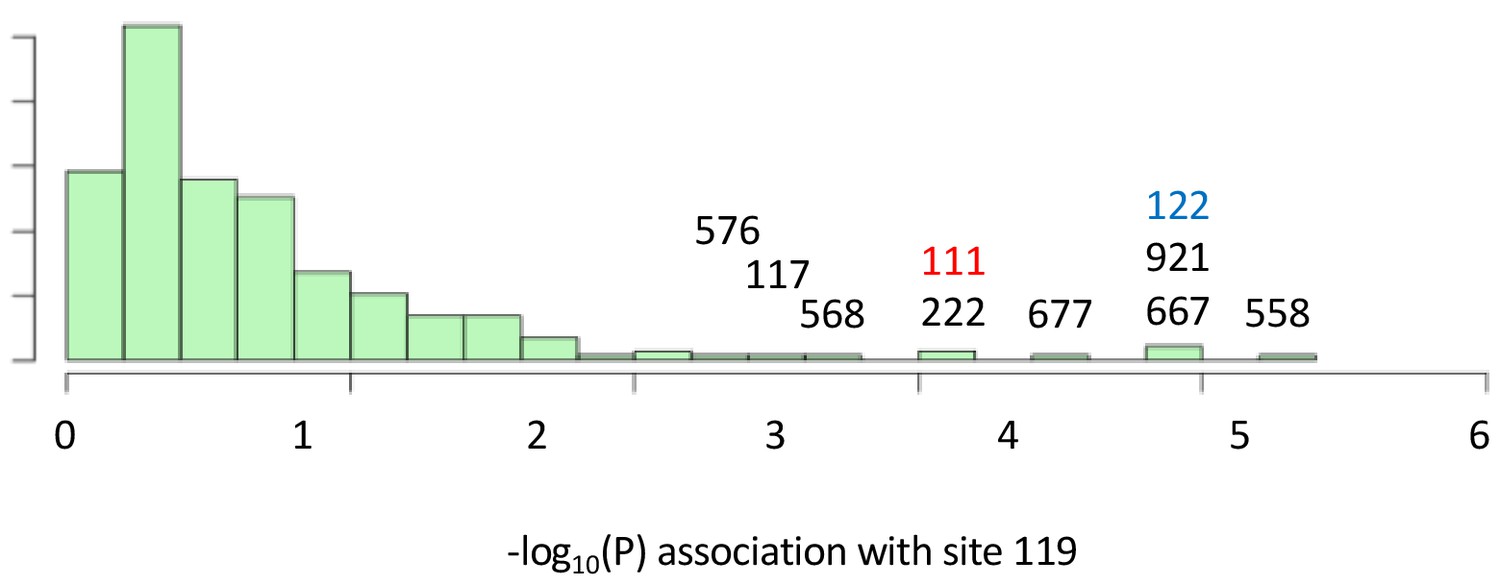
Variant sites in ATPα1 most strongly correlated with substitutions with site 119.
Shown is the distribution of P-values for strength of phylogenetic correlation between site 119 and 270 non-singleton amino acid variants in an alignment including 174 ATPα1 sequences representing 161 species See Materials and methods for a description of estimating correlations using BayesTraits. Indicated are the 10 top ranking sites. Sites 111 (red) and 122 (blue) are highly-correlated interacting sites known to be important for insensitivity of the NKA to CG-inhibition (see Figure 1).
Figure 1—figure supplement 4
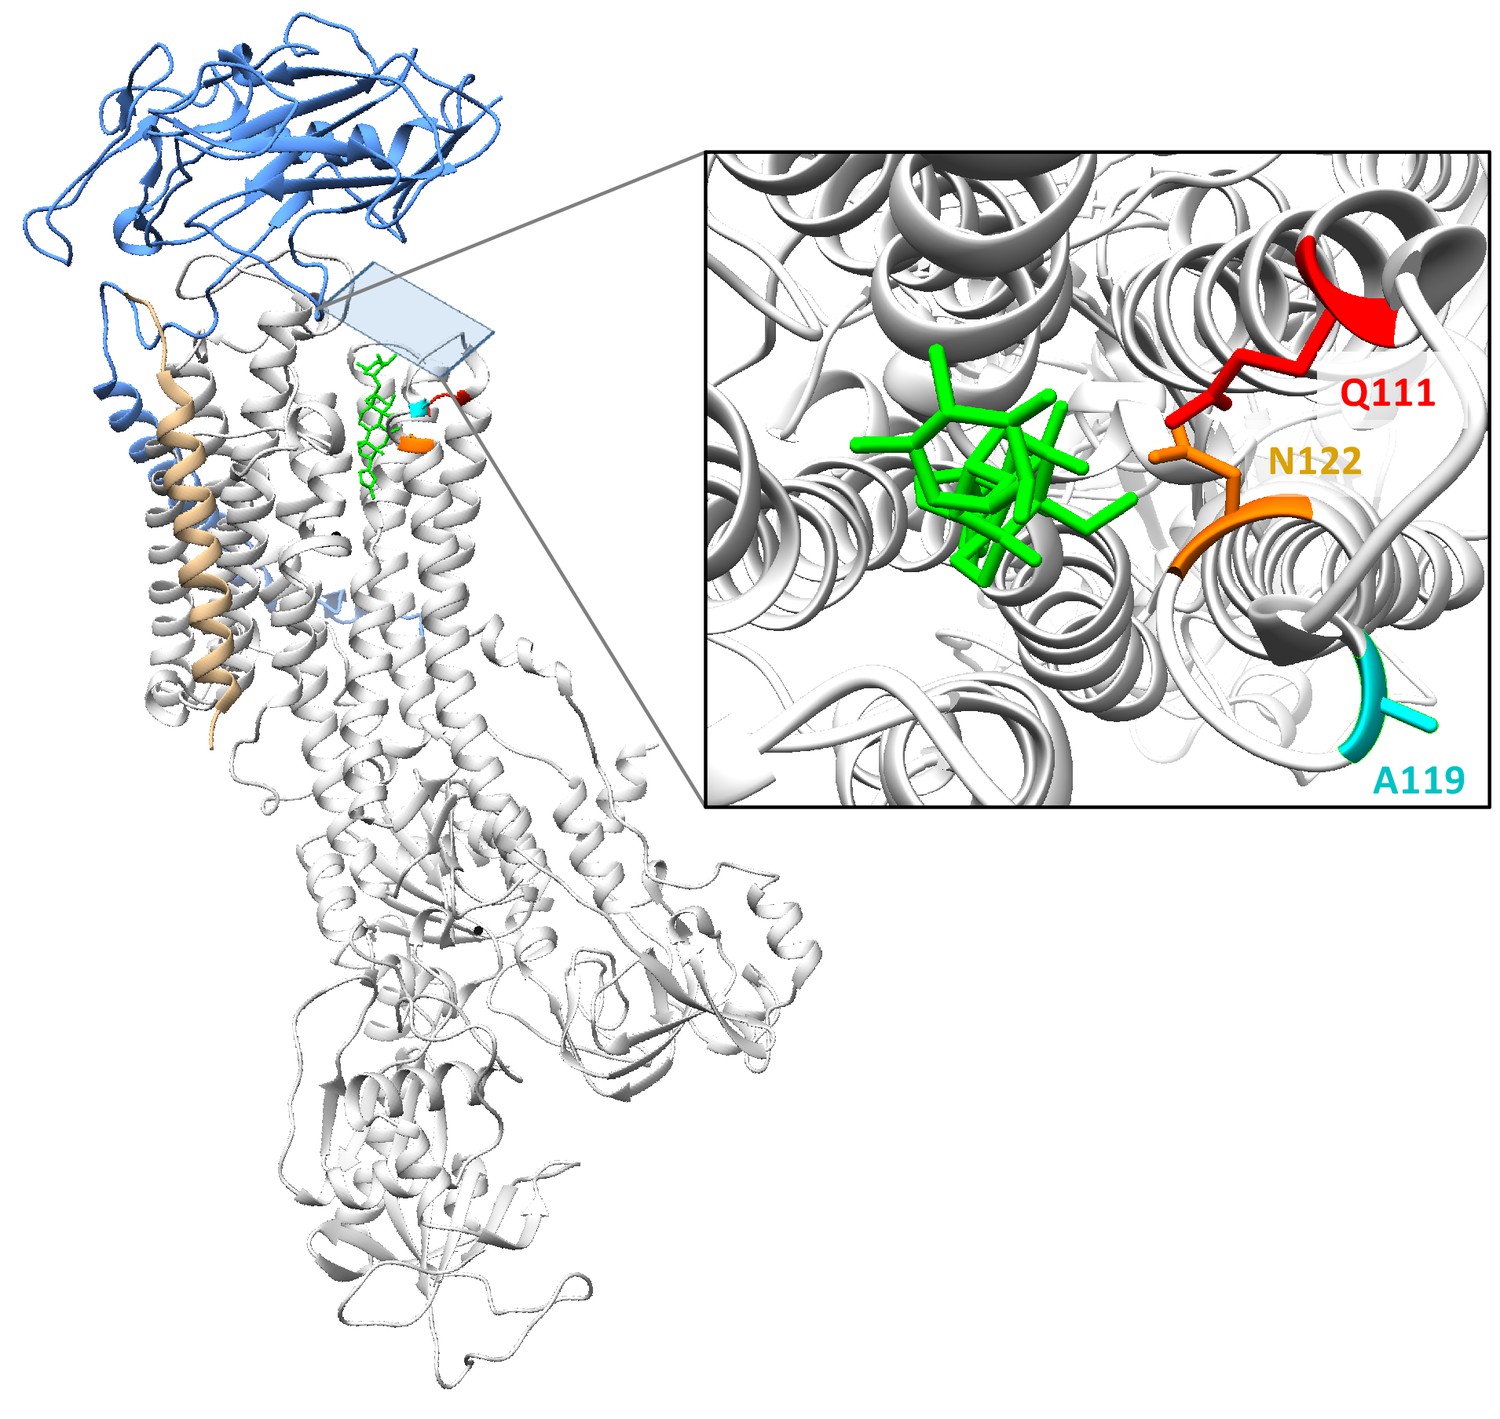
Crystal structure of NKA bound to the cardiac glycoside ouabain (PDB:4HYT).
Estimated co-crystal structure of Drosophila melanogaster NKA bound to the cardiac glycoside (CG) ouabain. A homology model was constructed with Swiss-Model (Waterhouse et al., 2018; https://swissmodel.expasy.org), using the Sus scrofa (pig) structure bound to ouabain (PDB:4HYT) as a template and ATPα1 of D. melanogaster (Genbank: P13607) as target. The alpha-subunit is shown in white ribbon, and subunits beta and gamma in blue and gold ribbon, respectively. In red, magenta and orange are residues Q111, A119 and N122, respectively. The bound ouabain ligand is colored green. The structure was visualized using UCSF Chimera 1.11.2.
Figure 2 with 3 supplements
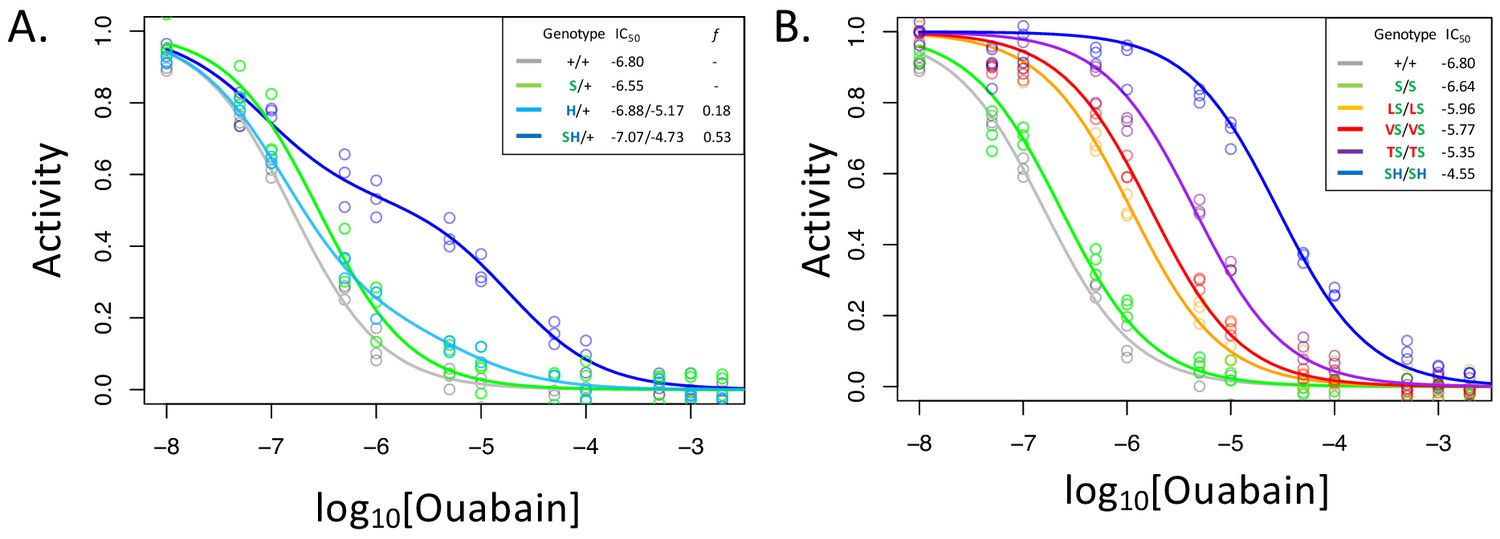
A119S ameliorates detrimental effects of CG-insensitivity substitutions on NKA function.
Plotted are relative activity as a function of increasing concentrations of the cardiac glycoside (CG) ouabain. (A) Inhibition curves are plotted for heterozygous individuals to allow comparison of the effects of these substitutions in the presence and absence of A119S. Points represent biological replicates, each of which is the mean across three technical replicates. Curves for the engineered wild-type strain (+/+) and A119S/+ (S/+) are plotted for comparison. The presence of A119S alone confers a negligible increase in CG-insensitivity and results in a monophasic curve. In contrast, N122H/+ (H/+) and A119S+N122H (SH/+) exhibit biphasic curves (i.e. the estimated proportion of CG-inhibitable activity of the mutant form, f, are significantly larger than 0). For H/+, f = 0.18 (95% CI 0.14–0.24), and is significantly lower than that of SH/+, f = 0.53 (95% CI 0.47–0.56). (B) Inhibition curves for homozygous substitutions Q111L, Q111V, Q111T and N122H in the presence of A119S reveal that they increase CG-insensitivity by 7, 11, 28 and 178-fold, respectively. The effect of A119S alone is estimated to be 1.45-fold relative to +/+ (95% CI 1.13–1.86).
Figure 2—figure supplement 1
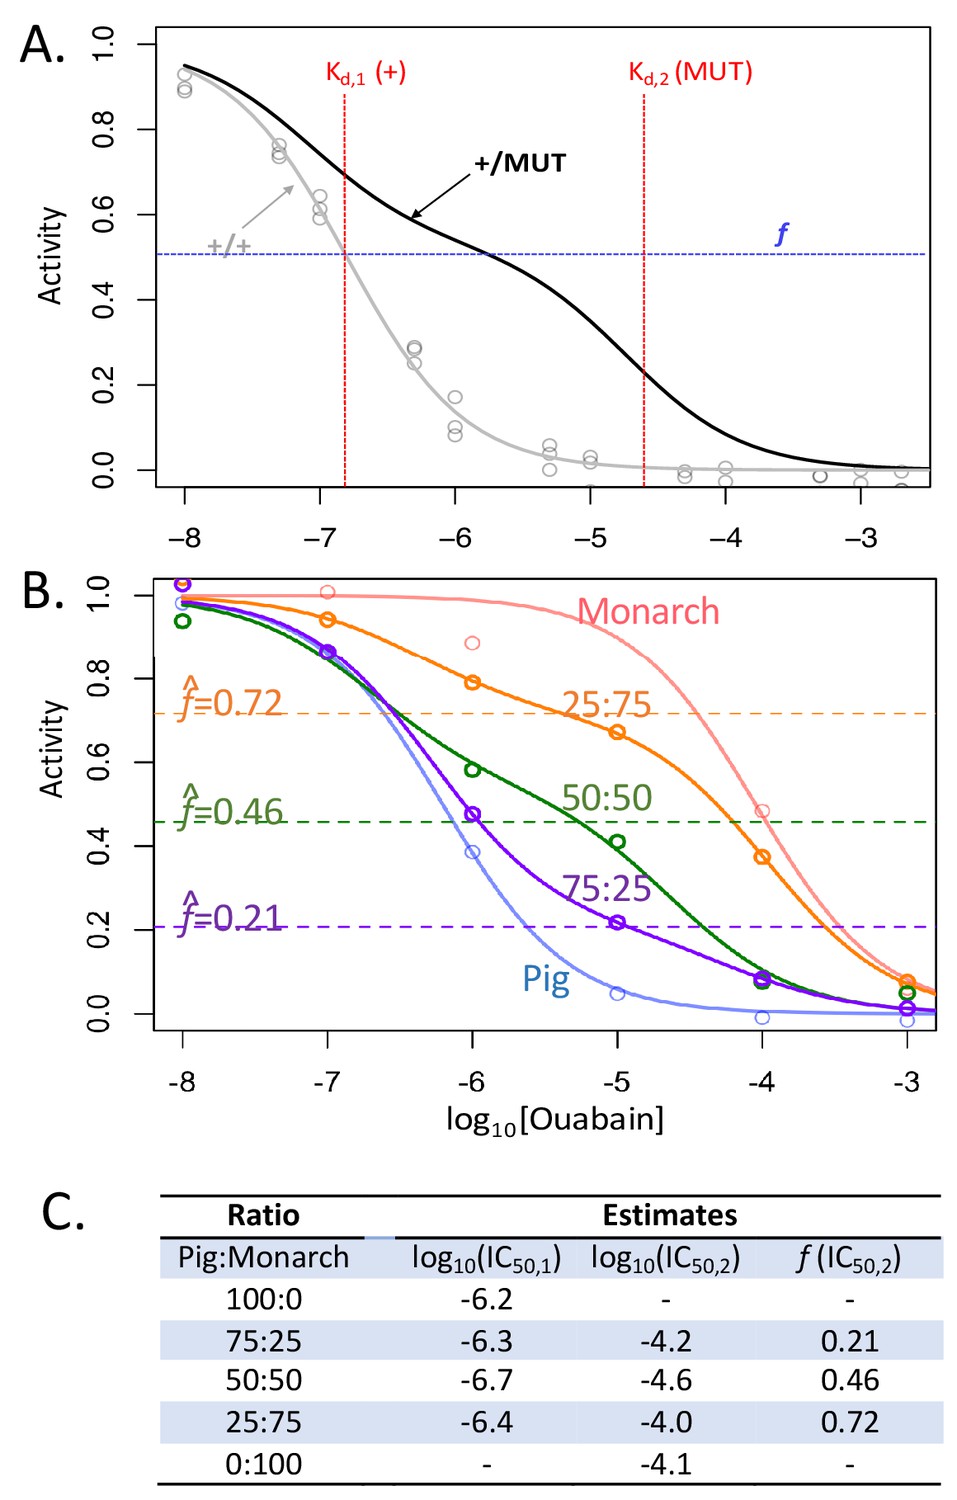
Biphasic inhibition curve fitting allows the estimation of relative activities of two enzyme forms in a mixture.
(A) Shown in gray is the monophasic curve fit corresponding to observed data (gray points) for the D. melanogaster line one homozygous wild- type (+/+) construct. In black is a hypothetical biphasic curve for a mixture of two forms of the enzyme, a sensitive wild-type form (+) and insensitive mutant form (MUT). A biphasic curve is expected for a mixture of two enzymes with distinct inhibitor dissociation constants, Kd,1 and Kd,2. The proportion f corresponds to the proportion of the total CG-inhibitable activity attributable to the form with Kd,2. If the two forms are equally active and mixed in equal proportions, f is expected to be 0.5, and the shape of the curve will depend on f and two Kd corresponding to the two forms of the enzyme in the mixture. (B) Validation of the method using mixtures with known normalized proportions of Pig (sensitive form) and Monarch butterfly (insensitive form) enzymes (proportions are indicated as Pig:Monarch). Enzyme-inhibition activities were analyzed as described in the Materials and methods, except using only six ouabain concentrations (range 10−8 M to 10−3 M) and one biological replicate. Parameters for homogenous extracts and mixtures were estimated using the monophasic (f = 0) and biphasic models (f > 0), respectively (see Equation 1 of Materials and methods). (C) Corresponding parameter estimates for panel B.
Figure 2—figure supplement 2
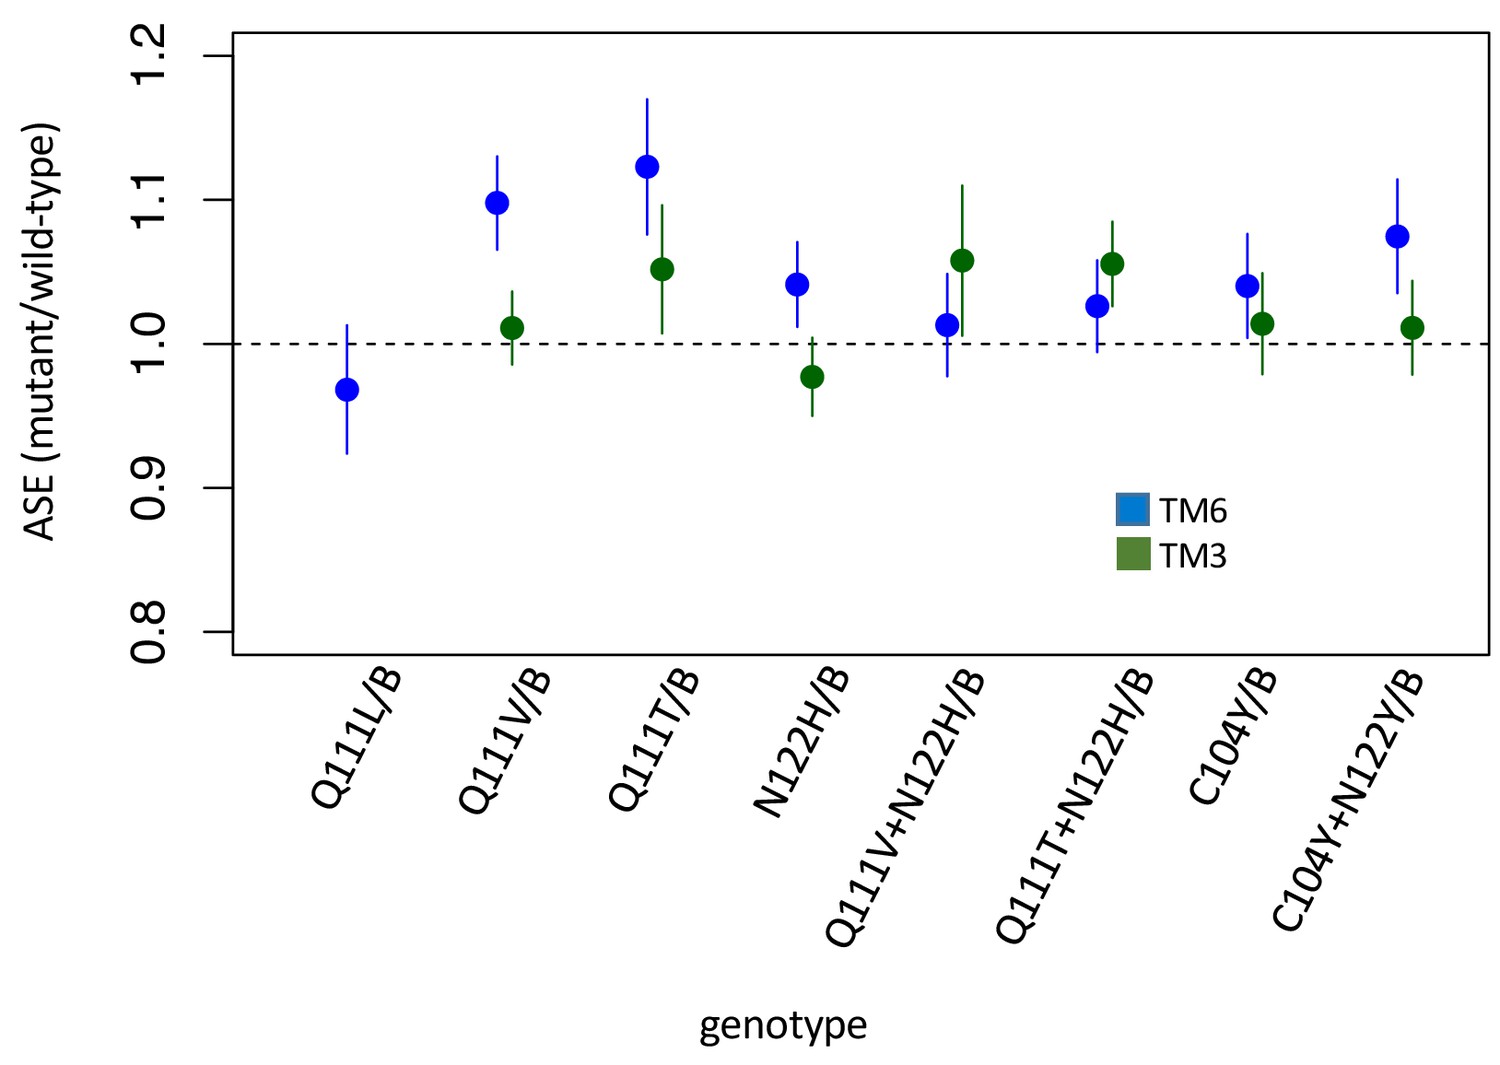
Allele-specific expression (ASE) in heterozygous lines.
Allele-specific expression (ASE) in heterozygous lines. Estimates and 95% confidence intervals are based on Cochran-Mantel-Haenzel framework analysis – that is plotted is ‘relative risk’ of the mutant allele in the cDNA population (treatment) using genomic DNA as a control population (see Materials and methods). Equal expression of the two alleles corresponds to a value of 1. Estimates and confidence intervals are shown for alleles balanced over two standard balancer chromosomes, B = TM6 (blue) or TM3 (green) which carries a wild-type allele of ATPα1. While significant deviations from equal expression (correcting for multiple comparisons) are observed for Q111V/TM6, Q111T/TM6, C104Y+N122Y/TM6, Q111T+N122H/TM3, the magnitude of the differences are small and in favor of the mutant allele.
Figure 2—figure supplement 3
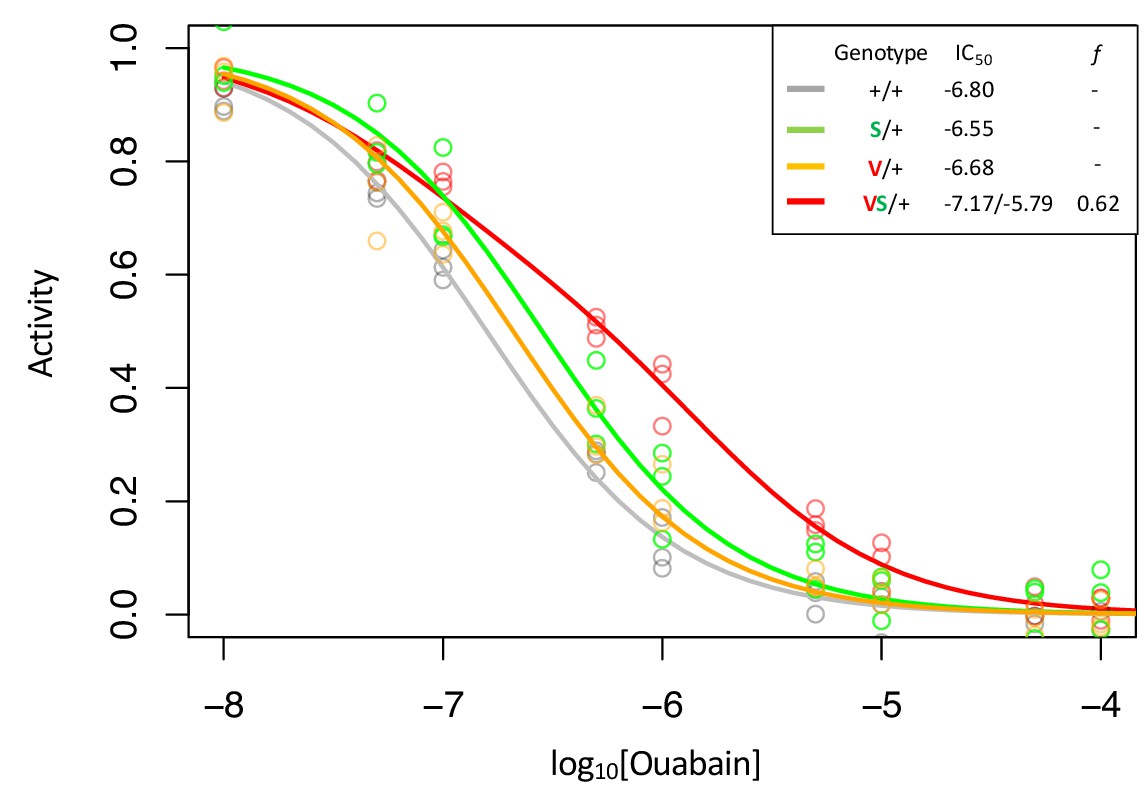
Enzyme inhibition curves for Q111V (V) with and without A119S (S).
Following Figure 2, inhibition curves are plotted for heterozygous individuals to allow comparison of the effects of these substitutions in the presence and absence of A119S. Points represent biological replicates, which is the means across technical replicates. Curves for the engineered wild-type strain (+/+) and A119S/+ are plotted for comparison. The inhibition curve for Q111V/+ appears to be monophasic suggesting that either the mutant Q111V enzyme is inactive (i.e. f = 0), or like A119S, it has small effects on CG-insensitivity. In contrast, Q111V in combination with A119S (VS/+) results in a right-shifted curve indicating increased CG-insensitivity (IC50,2 = 1.6e-6). For VS/+, f = 0.62 with 95% CI 0.54–0.69.
Figure 3 with 2 supplements
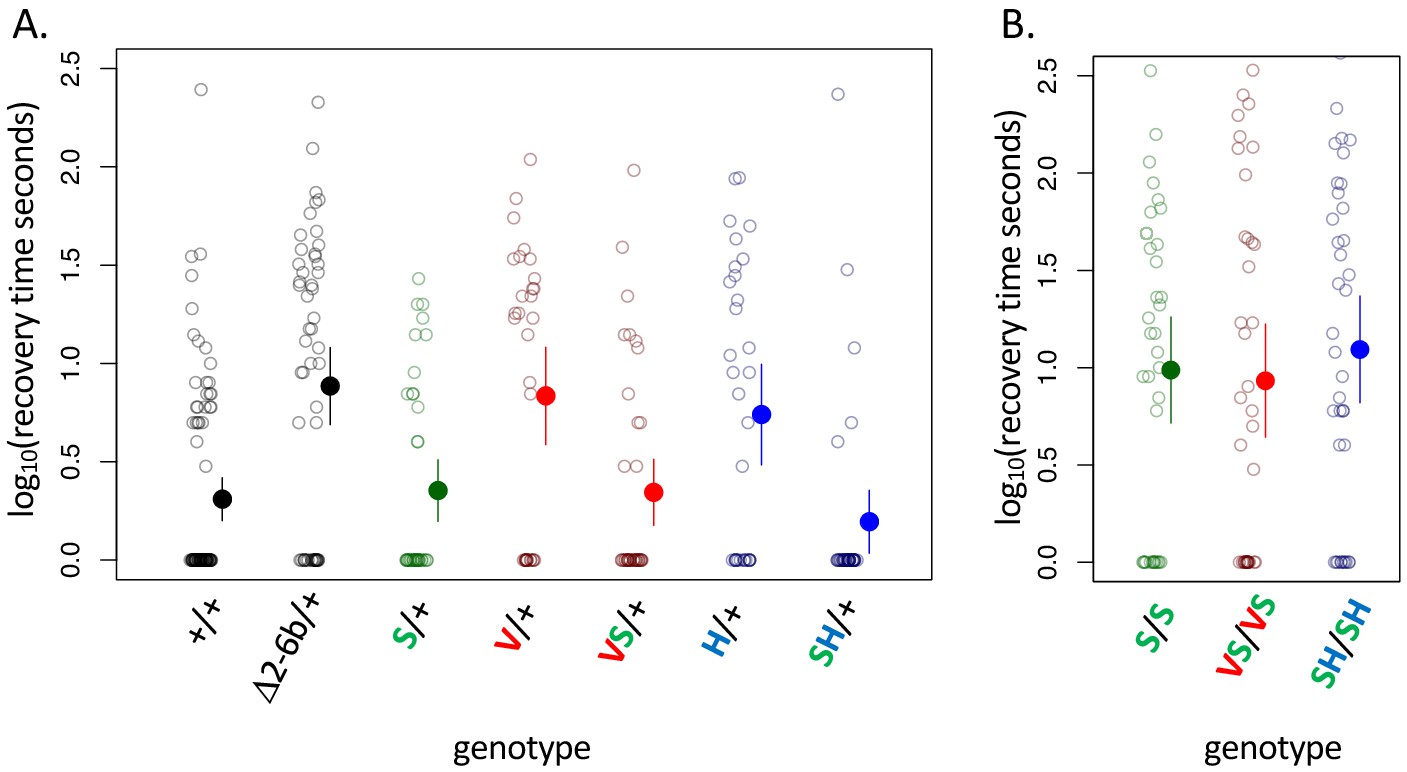
A119S ameliorates detrimental effects of CG-insensitivity substitutions on neural function.
Plotted are recovery times for individuals (open circles), and means with approximate 95% confidence bounds (solid circles with whiskers), following mechanical over-stimulation (aka, the ‘bang sensitivity’ assay). Flies heterozygous for loss-of-function ATPα1 substitutions are known to have significantly longer recovery times than wild-type flies (see for e.g. Δ2-6b/+ relative to +/+ in panel A, p=4.5e-7). (A) Distributions of recovery times for heterozygous flies (i.e. Mut/+) carrying individual substitutions A119S (S/+), Q111V (V/+) and N122H (H/+) and combinations VS/+ and SH/+. The recovery-time distributions for S/+, VS/+ and SH/+ are indistinguishable from the engineered wild-type strain (+/+). In contrast, recovery times are significantly longer than wild-type for lines with individual substitutions V/+ and H/+ (p=1.3e-5 and p=5.2e-4, respectively) and are indistinguishable from the loss-of-function deletion mutation Δ2-6b/+. (B) Recovery times for homozygous lines S/S, VS/VS and SH/SH are all significantly longer than for heterozygotes S/+, VS/+, and SH/+ (p<3.3e-3). These results demonstrate epistasis between substitutions at sites 119 and 111/122 at the level of neural function. A119 ameliorates the dominant dysfunction caused by Q111V and N122H but residual recessive neural dysfunction is still apparent in homozygotes that include A119S.
Figure 3—figure supplement 1
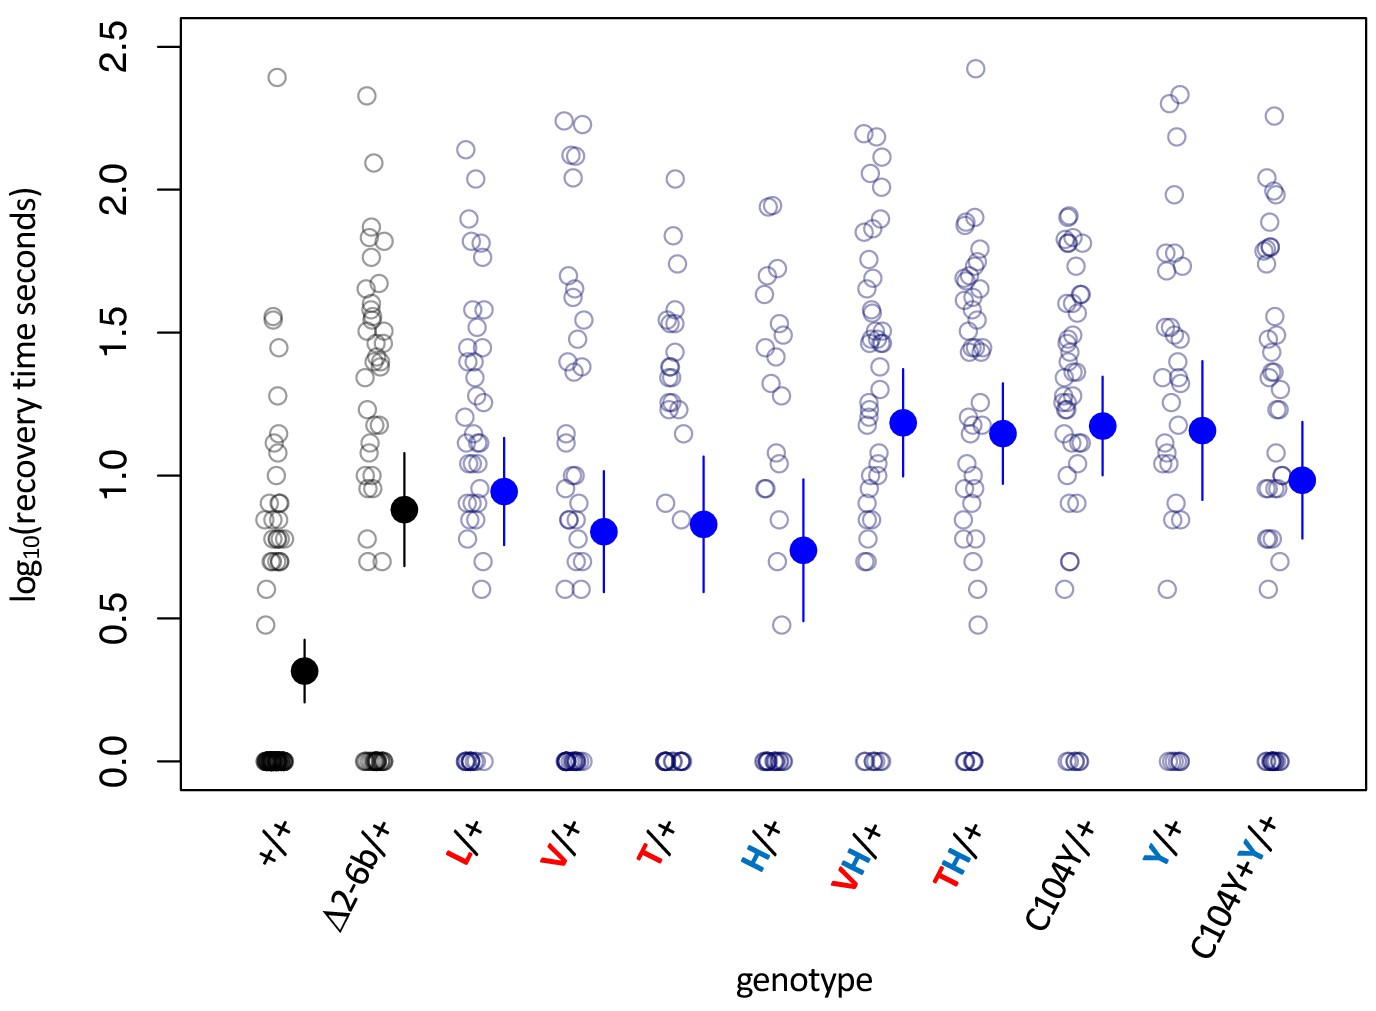
Bang sensitivity phenotypes of lines with heterozygous substitutions at sites 104, 111 and 122.
Bang sensitivity phenotypes of lines with heterozygous substitutions at sites 104, 111 and 122. Δ2-6b is a loss of function deletion of ATPα1. Red letters indicate substitutions at position 111; blue letters indicate substitutions at position 122. Labels: + = wild type; Δ2-6b = loss of function deletion of exons 2 through 6b; L = Q111L; V = Q111V; T = Q111T; H = N122H; Y = N122Y. All substitutions are heterozygous over the engineered wild-type allele (+). In all cases, the distributions for substitution lines (Mut/+) are significantly different than the engineered wild-type strain (+/+) (p<5e-5, Wilcoxon test with continuity correction, correcting for multiple tests).
Figure 3—figure supplement 2
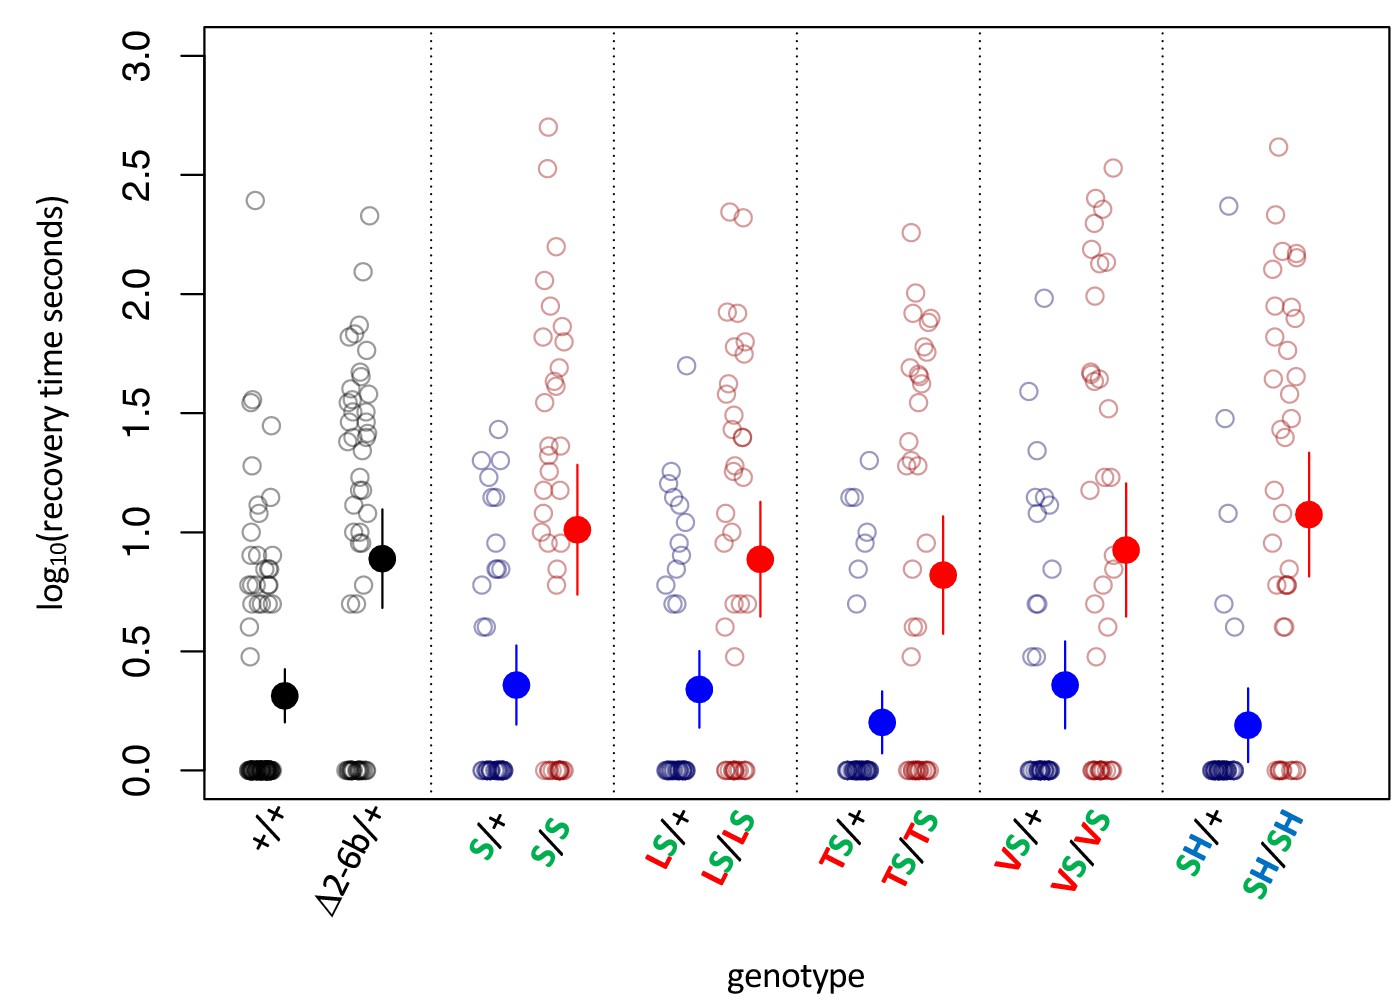
Bang sensitivity phenotypes of substitutions at sites 111 and 122 on the background of A119S.
Bang sensitivity phenotypes of substitutions at sites 111 and 122 on the background of A119S. Δ2-6b is a loss of function deletion of ATPα1. Red letters indicate substitutions at position 111; green letters at position 119; blue letters at position 122. Blue points and whiskers indicate substitutions that are heterozygous for wild-type allele (+). Red points and whiskers indicate data for homozygous substitutions. Labels: + = engineered wild-type allele; Δ2–6 = loss of function deletion of exons 2-6b; S = A119S; LS = Q111L+A119S; VS = Q111V+A119S; TS = Q111T+A119S; SH = A119S+N122H. In all cases, the distributions for heterozygotes (Mut/+) and homozygotes (Mut/Mut) are significantly different (p<0.005, Wilcoxon test with continuity correction, corrected for multiple tests).
Figure 4 with 1 supplement
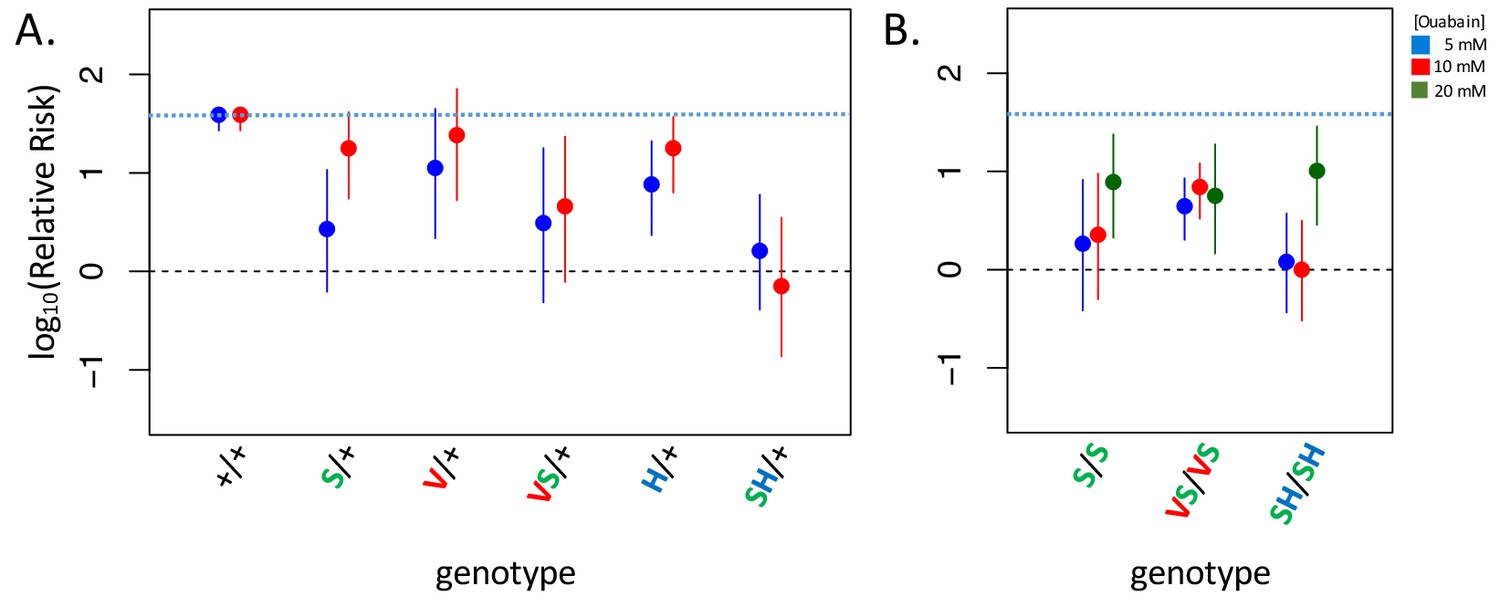
Adult survival upon 7 day exposure to the CG ouabain.
Plotted is the log relative risk for treatments (5, 10 or 20 mM ouabain) relative to no treatment controls (no ouabain) for (A) heterozygous strains and (B) homozygous strains. Estimates (points) and 95% confidence bounds (whiskers) were obtained using the Cochran-Mantel-Haenzel framework. Each estimate is based on three biological replicates of 20 flies per concentration. A value of 0 corresponds to equal probability of survival on treatment versus the no ouabain control indicating complete insensitivity to a given concentration of ouabain. Labels: + = engineered wild-type allele; S = A119S; V = Q111V; VS = Q111V+A119S; H = N122H; SH = A119S+N122H. These results reveal appreciable CG-insensitivity conferred by individual substitutions A119S (S/+ and S/S) and the recessive lethals Q111V (V/+) and N122H (H/+) compared to the engineered wild-type control strain (+/+).
Figure 4—figure supplement 1
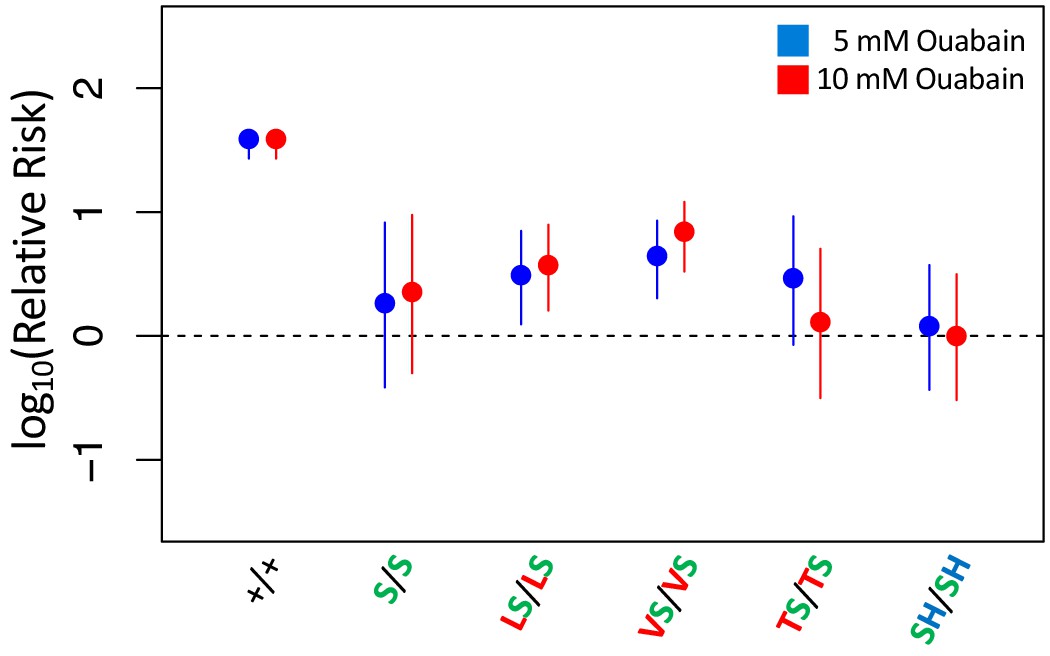
Adult survival of all homozygous strains with A119S upon 7 day exposure to CGs.
Adult survival of homozygous strains with A119S upon 7 day exposure to CGs. Plotted is the log relative risk of treatment, for 5 mM (blue) or 10 mM (red) ouabain, relative to no treatment controls (no ouabain) for homozygous strains. Points and whiskers represent estimates and 95% confidence bounds estimated using the Cochran-Mantel-Haenzel framework (Materials and methods). Each estimate is based in three biological replicates of 20 flies per concentration. A value of 0 corresponds to equal probability of survival of treatment versus control indicating complete insensitivity to the tested ouabain concentration. Labels: +/+ = engineered wild-type strain; S/S = A119S homozygote; LS/LS = Q111L+A119S homozygote; VS/VS = Q111V+A119S homozygote; TS/TS = Q111T+A119S homozygote; SH/SH = A119S+N122H homozygote.
Tables
Key resources table
| Reagent type (species) or resource | Designation | Source or reference | Identifiers | Additional information |
|---|---|---|---|---|
| Gene (Drosophila melanogaster) | ATPalpha1 | NA | FLYB:FBgn0027548 | |
| Strain, strain background (D. melanogaster) | ATPalpha1 △2-6b founder line, w[1118];;ATPa△2-6b attP/TM6B,Tb[1] | this paper | N/A | available on request |
| Strain, strain background (D. melanogaster) | 15 engineered variants of ATPalpha1 | this paper | N/A | See Supplementary file 2, available on request |
| Genetic reagent (D. melanogaster) | y[1], w[67c23], P{y[+mDint2]=Crey}1b;;D[*]/TM3, Sb[1] | Bloomington Drosophila Stock Center | BDSC:851 FLYB:FBst0000851; RRID:BDSC_851 | Source of Cre protein |
| Genetic reagent (D. melanogaster) | w[*];;ry[506] Dr[1]/TM6B, P{w[+mC]=Dfd-EYFP}3, Sb[1],Tb[1],ca[1] | Bloomington Drosophila Stock Center | BDSC:8704 FLYB:FBst0008704; RRID:BDSC_8704 | Balancer, chr 3 |
| Sequence-based reagent | PCR/sequencing primers, Sanger-based sequencing | this paper | N/A | ATPa1 H1-H2 Forward: AAAACTTGGAGCGCGATGGT; ATPa1 H1-H2 Reverse: ATACGGTCGCCGAACTTCAC |
| Sequence-based reagent | PCR/sequencing primers for Illumina-based sequencing | this paper | N/A | ATPa1 H1-H2 Forward 2834: GTCTCGTGGGCTCGGCGCTTTCAGACACATCCCGA; ATPa1 H1-H2 Forward 3185: TCGTCGGCAGCGTCTGAGAAAATGCCCGTCACGA |
| Sequence-based reagent | PCR-added linker primers, Illumina-based sequencing | this paper | N/A | ATPa1 H1-H2 i5: AATGATACGGCGACCACCGAGATCTACACnnnnnnnnTCGTCGGCAGCGTCA; ATPa1 H1-H2 i7: CAAGCAGAAGACGGCATACGAGATnnnnnnnnGTCTCGTGGGCTCGG; where ‘nnnnnnnn’=any sequence index |
| Chemical compound, drug | Ouabain | Sigma | Cat#: O3125 | |
| Chemical compound, drug | Porcine sodium potassium ATPase, cerebral cortex | Millipore-Sigma | Cat#: A7510 | |
| Recombinant DNA reagent | pGX-attB-ATPa2-6b | this paper | N/A | available on request |
| Software, algorithm | PAML v4.8 | PMID: 17483113 | RRID:SCR_014932 | http://abacus.gene.ucl.ac.uk/software/paml.html |
| Software, algorithm | BayesTraits v3.01 | PMID: 16685633 | RRID:SCR_014487 | http://www.evolution.rdg.ac.uk/BayesTraitsV3.0.1/BayesTraitsV3.0.1.html |
| Other | multiple sequence alignment (protein) | this paper | N/A | Supplementary file 3 |
| Other | multiple sequence alignment (nucleotide) | this paper | N/A | Supplementary file 4 |
Additional files
-
Supplementary file 1
Summary of amino acid variation at sites implicated in CG-sensitivity of ATPαone in surveyed species.
Columns correspond to 35 sites implicated in cardenolide-sensitivity with the addition of six additional sites of interest (112, 114, 119, 787, 874, 898). Following convention, position is standardized relative to the sheep (Ovis aries) sequence NM_001009360 minus five amino acid residues from 5'end. The reference sequence refers to the consensus sequence among non-specialist species. A dot indicates identity with the reference sequence and dashes indicate missing data. Species highlighted in green are specialists on cardiac glycoside (CG) containing plants.
- https://doi.org/10.7554/eLife.48224.004
-
Supplementary file 2
Includes sources of sequence data used in this study, references for phylogenetic relationships a list of transgenic strains generated in this study.
- https://doi.org/10.7554/eLife.48224.017
-
Supplementary file 3
Fasta nucleotide sequence alignment of all sequences used in this study.
- https://doi.org/10.7554/eLife.48224.018
-
Supplementary file 4
Fasta amino acid sequence alignment of all sequences used in this study.
- https://doi.org/10.7554/eLife.48224.019
-
Transparent reporting form
- https://doi.org/10.7554/eLife.48224.020
Download links
A two-part list of links to download the article, or parts of the article, in various formats.
Downloads (link to download the article as PDF)
Open citations (links to open the citations from this article in various online reference manager services)
Cite this article (links to download the citations from this article in formats compatible with various reference manager tools)
Adaptive substitutions underlying cardiac glycoside insensitivity in insects exhibit epistasis in vivo
eLife 8:e48224.
https://doi.org/10.7554/eLife.48224


