Evolution of asymmetric gamete signaling and suppressed recombination at the mating type locus
- University of Geneva, Switzerland
- University College London, United Kingdom
Figures
Figure 1
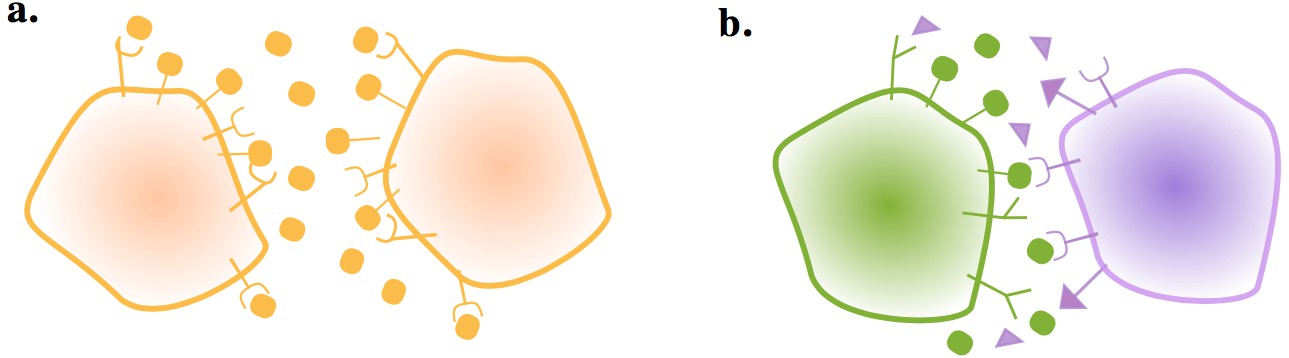
Gametes communicate through ligand and receptor molecules.
The ligand can be either membrane bound or released in the local environment. (a) When the interacting cells produce ligand and receptor symmetrically, the ligand will bind to receptors on its own membrane as well as those on the other cell. This may impair intercellular signaling. (b) Producing the ligand and receptor in an asymmetric manner resolves this issue.
Figure 2 with 1 supplement
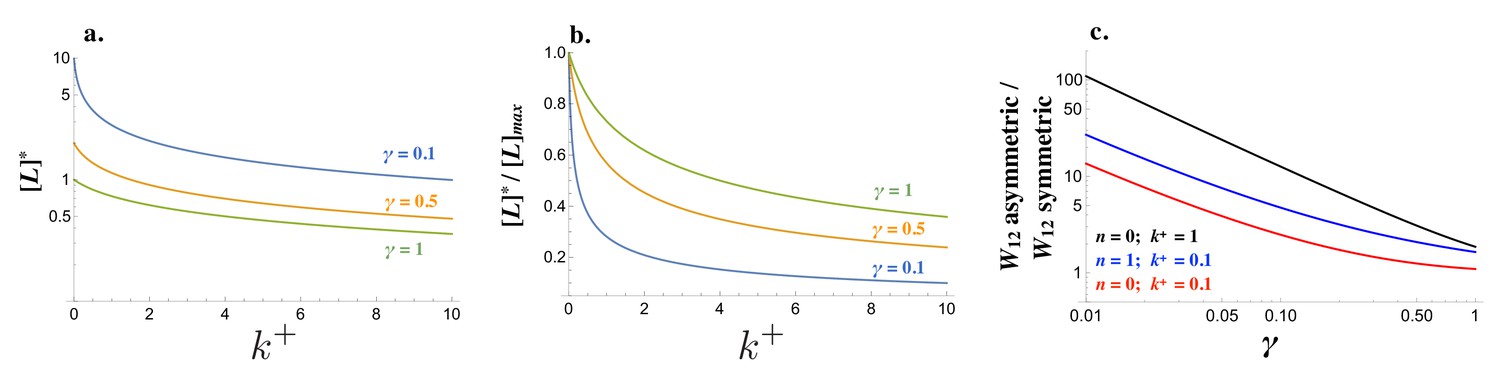
Signaling interactions between mating cells can be severely impaired due to ligand-receptor interactions in the same cell.
(a) The amount of free ligand in individual cells at steady state and (b) normalized amount of free ligand at steady state varies with the intracellular binding rate and degradation rate . (c) The relative amount of incoming signal for a cell that produces ligand and receptor asymmetrically versus symmetrically decreases with the degradation rate and values of intracellular binding . Other parameters used: .
Figure 2—figure supplement 1
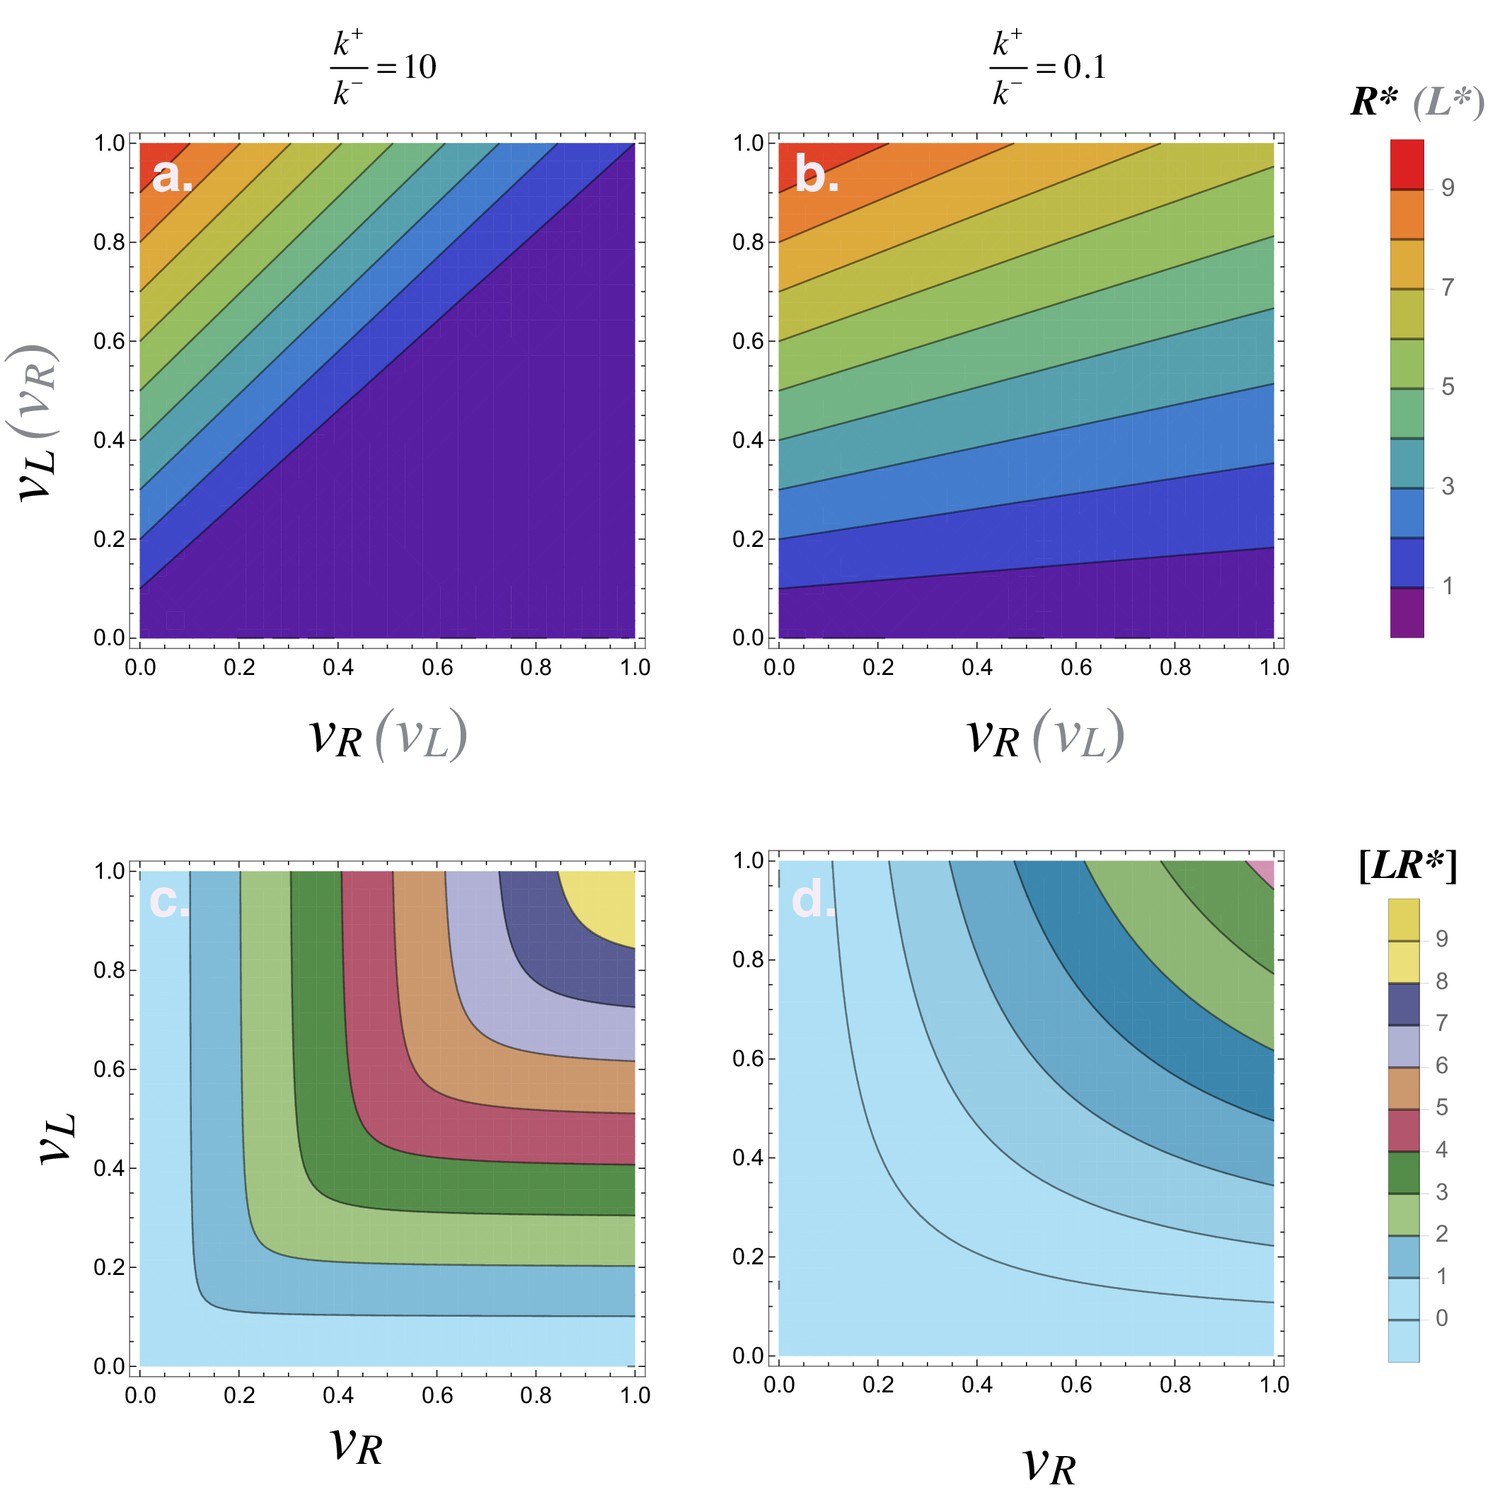
Steady state concentrations in individual cells.
Steady state concentration of the ligand and receptor in individual cells when varying the ligand and receptor production rates and for (a) and (b) . (c-d) show the concentration of ligand-receptor complexes for the same parameter variations. Other parameters used: .
Figure 3
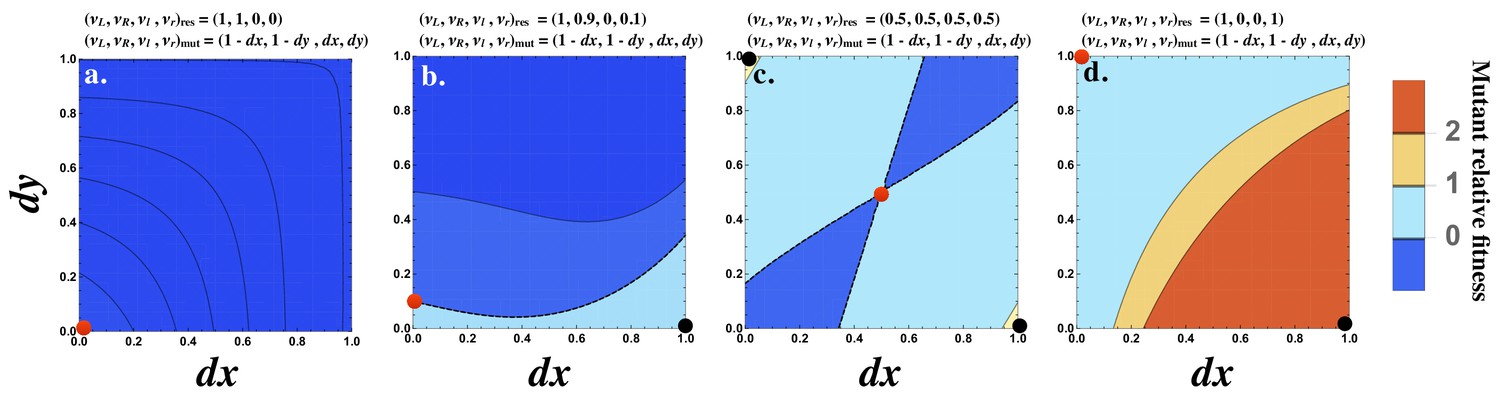
Fitness advantage of rare mutations conferring signaling asymmetry.
The fitness of a rare mutant is plotted relative to the resident . The production rate of the mutant cell is , where and are plotted on the and axes respectively. The resident production rate is shown as a red dot and varies (a) , (b) , (c) and (d) . The mutant () with maximum fitness is shown as a black dot. The contour where is marked by a black dashed line (b and c). The fitness difference is always negative in (a) and always positive in (d). Other parameters used: .
Figure 4 with 2 supplements
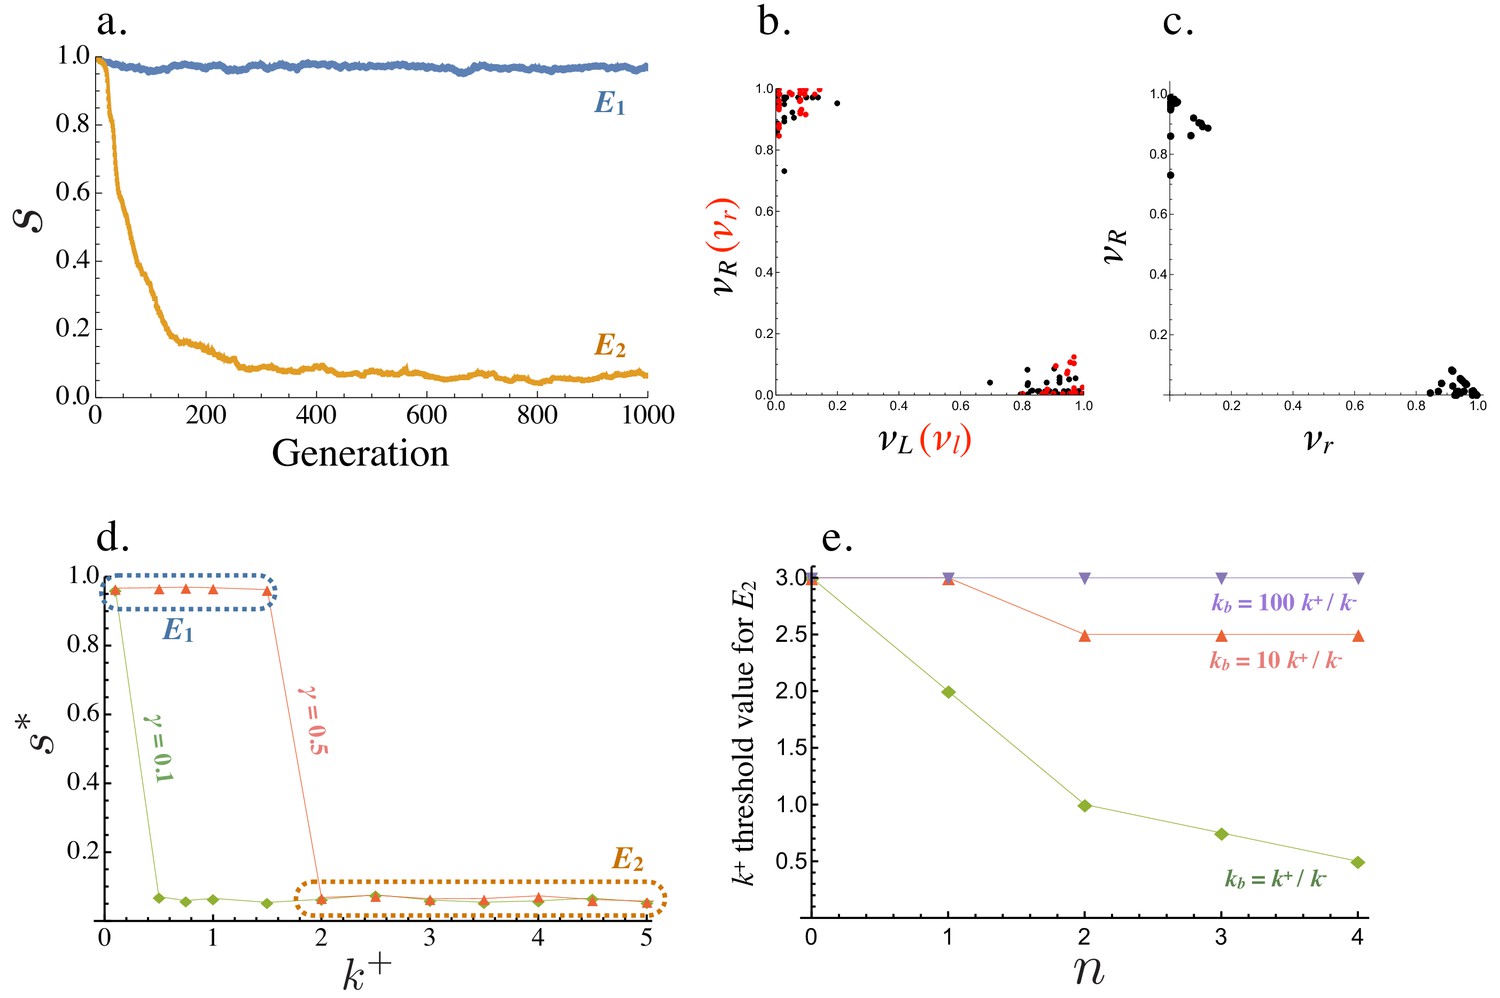
Evolution of asymmetric signaling.
(a) An example of evolution to the two signaling equilibria, ( full symmetry when ) and full asymmetry when ). (b) Production rates of individual cells in the population for the receptor-ligand pairs (black) and (red) at . (c) Production rates of individual cells for the two receptor types and at . (d) Steady state signaling symmetry against the intracellular binding rate () for different degradation rates (). (e) Threshold value of , beyond which evolves from , plotted versus the cost of self-binding (). The relationship is shown for different values of strength of between cell signaling () relative to strength of within cell signaling (). Other parameters used in numerical simulations are given in the Supplemental Material.
Figure 4—figure supplement 1
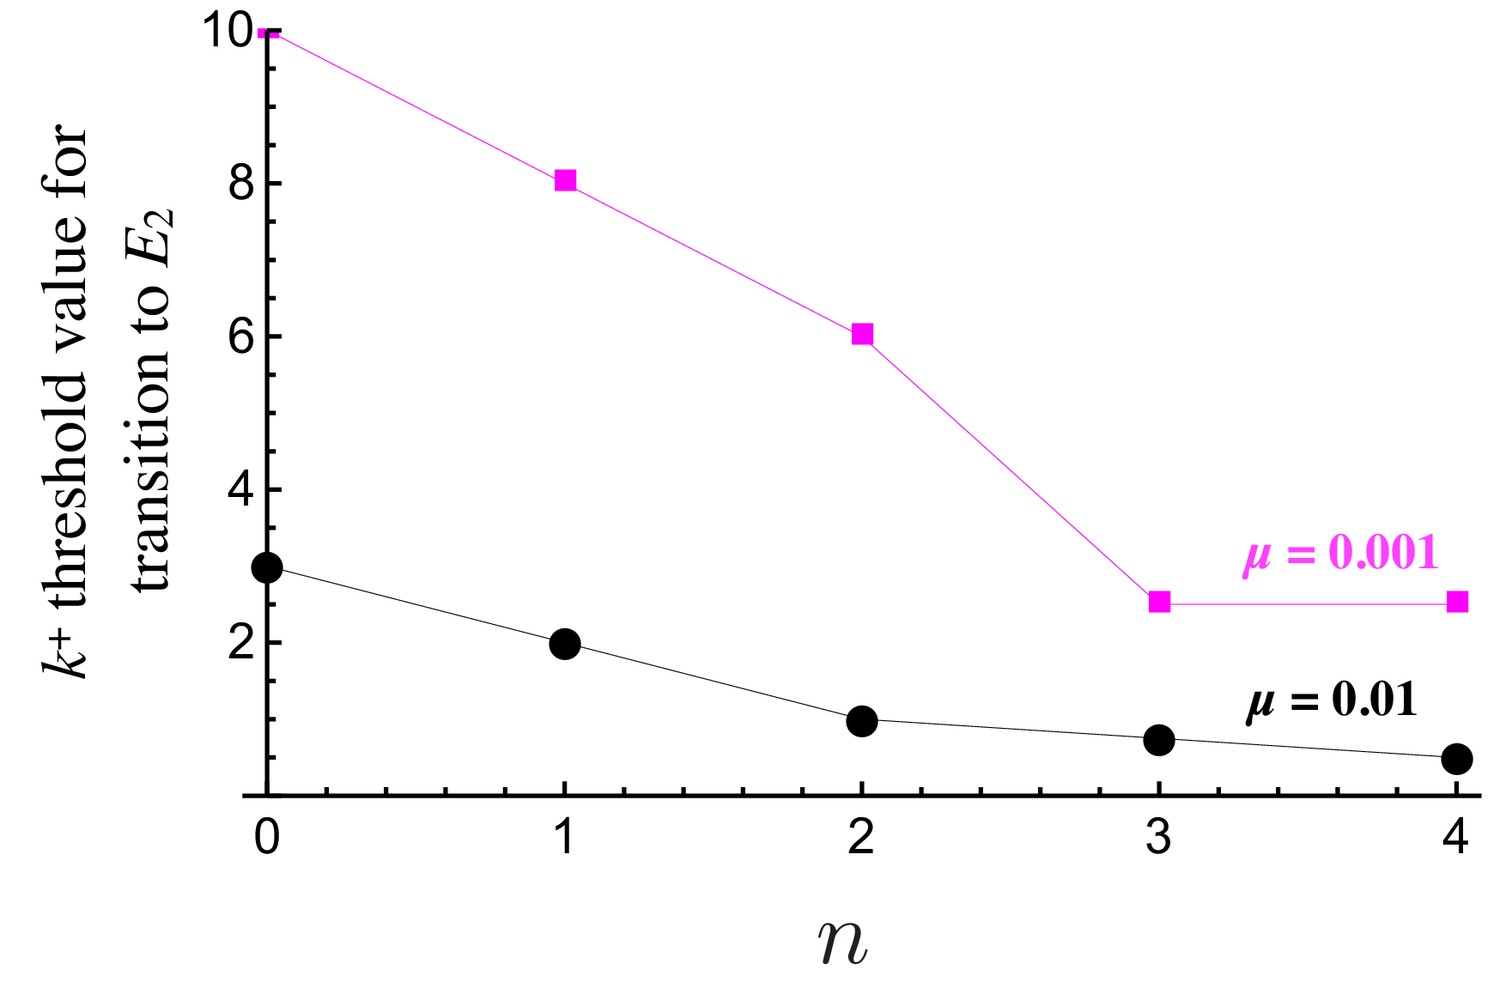
The role of mutation rates.
The threshold value of , beyond which becomes stable against , plotted versus which dictates the cost of self-binding for and to show that lower mutation rates require more stringent conditions for the evolution of signaling asymmetry. Population is initiated at and for all cells at time zero. for all ligand and receptor genes and , , , . Population size and number of cells allowed to mate .
Figure 4—figure supplement 2

Synergy and competition between the production rates of the two ligands (and receptors).
Steady state signaling asymmetry against the intracellular binding rate for and for different values of indicates synergy and indicates competition between the two types of ligands (and receptors). For the population only evolves asymmetric signaling for large values of . In this case is the maximum since the sum of the two production rates cannot exceed . Population is initiated at and for all cells at time zero. for all ligand and receptor genes and , , , . Population size and number of cells allowed to mate .
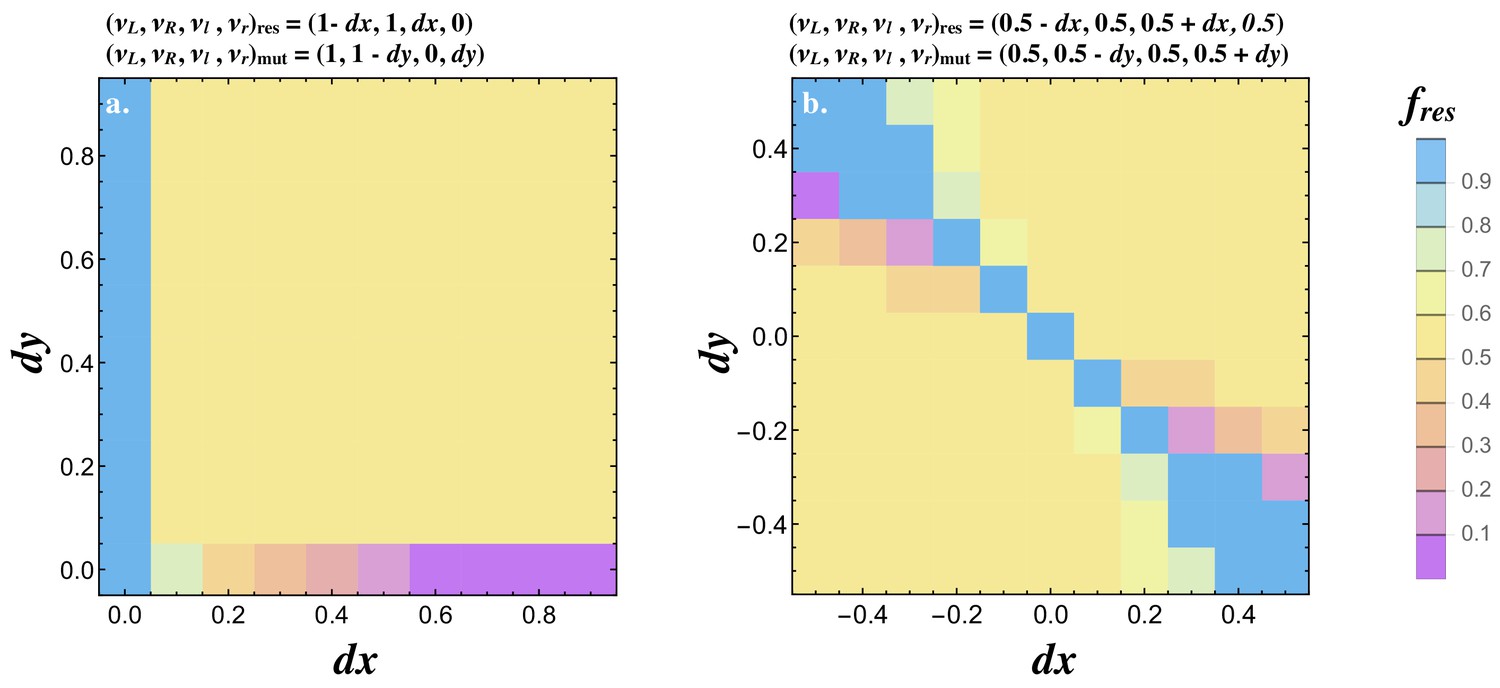
Figure 5

Invasion of .
Contour plots showing the steady state degree of symmetry () in a population with resident . Two mutations are introduced and at frequency and their fate is followed until they reach a stable frequency. No recurrent mutation is assumed. Orange contours inside the dotted line show the region where both mutants are eliminated and the resident persists (). All other colors indicate that the two mutants spread to equal frequency displacing the resident (). The degree of signaling symmetry at equilibrium is dictated by the magnitude of the mutations given by and . The different panels show (a) between cell signaling , mutation frequency and degradation rate , (b) lower mutation frequency , (c) high degradation rate and (d) weaker between cell signaling . The resident type is marked by a black dot at the origin. The frequency of the resident and two mutants at steady state was recorded and the heat maps show the average steady state value of for 20 independent repeats and the population size . Other parameters used and simulation details are given in the Supplementary Material.
Figure 6
Joint evolution of receptor and ligand asymmetry.
Contour plots show the equilibrium frequency of the resident () following the introduction of a mutatant when (a) and, , and (b) and . The mutant is introduced at a frequency and no recurrent mutation is assumed. Other parameters used and simulation details are given in the Supplemental Material.
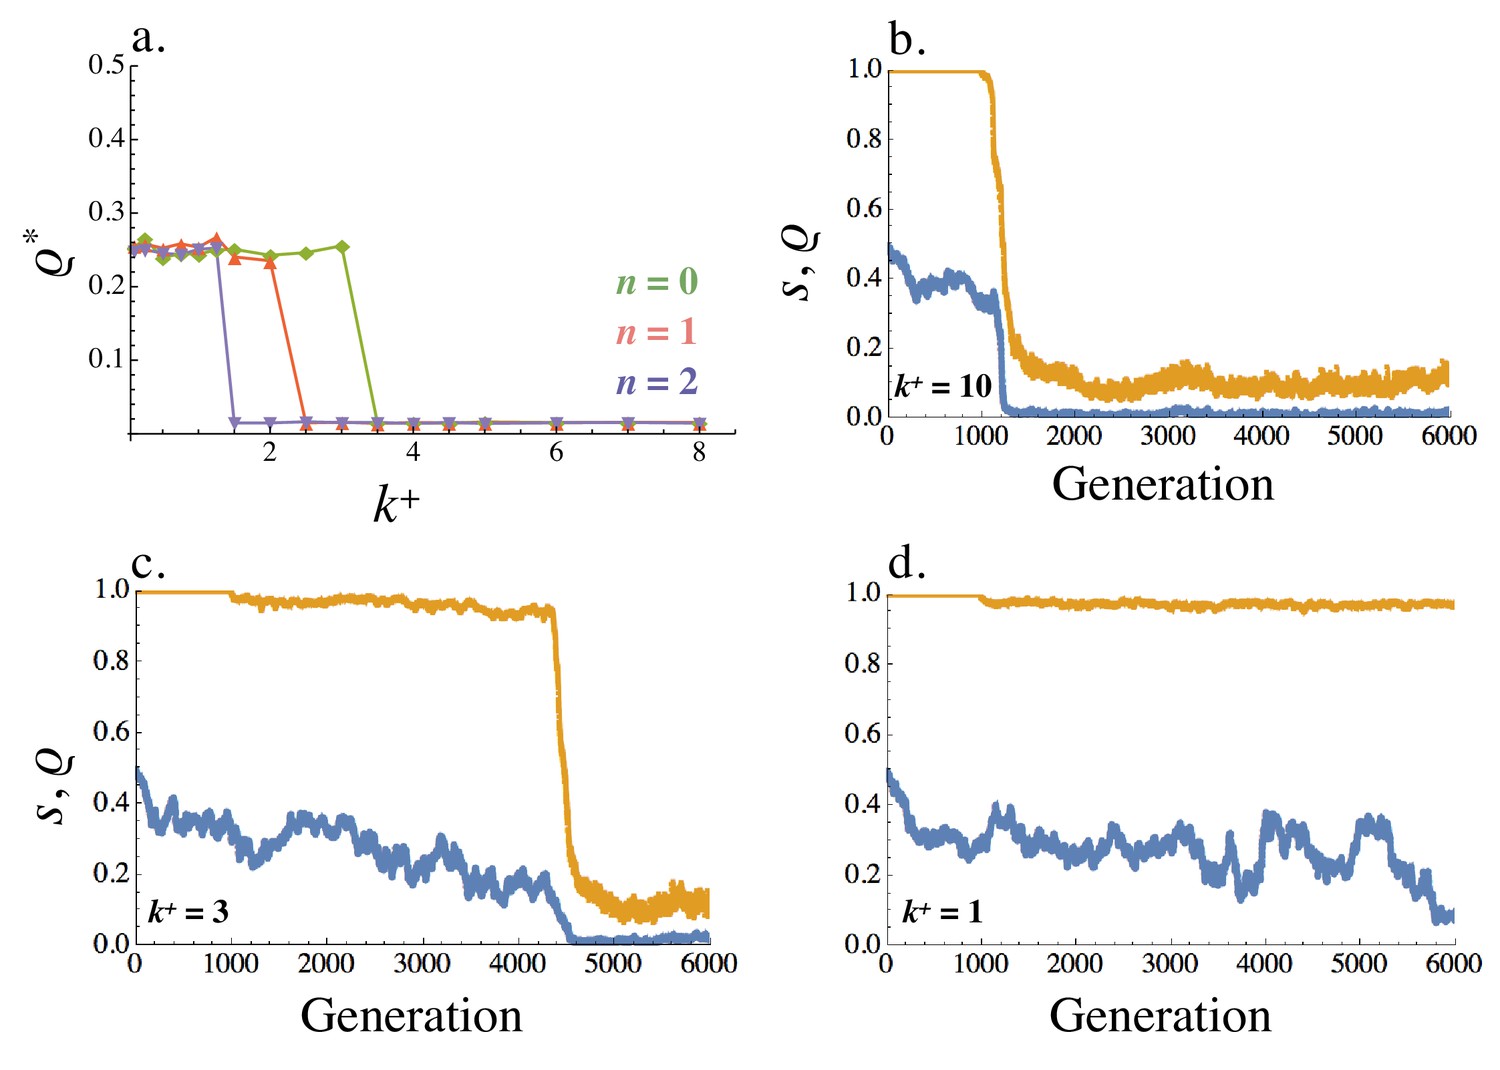
Figure 7

The effect of recombination on .
(a) An example of evolution of the two signaling equilibria, (for ) and (for ) given a fixed recombination rate . (b) Steady state varies with the recombination rate. (c–d) Production rates of individual cells in the population for receptor-ligand pairs (black) and (red) for recombination rates (c) , (d) and (e) . (f) Contour plot showing the steady state degree of symmetry () in a population with resident , given a recombination rate . Two mutations are introduced and at rate and their fate is followed until they reach a stable frequency. The population size for panels (a) - (e) and for panel (f). Other parameters used and simulation details are given in the Supplemental Material.
Figure 8
Equilibrium recombination rate .
(a) Averaged across the population, varies with (within cell binding rate) and (cost of self-binding). (b–d) Evolution of the recombination rate (blue) and signaling symmetry levels (orange) for different within cell binding rates: (b) , (c) and (d) . The recombination rate evolves under drift for the first 1000 generations, following which mutation at the ligand and receptor loci were introduced. When no asymmetry evolves the recombination rate fluctuates randomly between 0 and 0.5 (i.e. between its minimum and maximum value like a neutral allele). Other parameters used in simulations are given in the Supplemental Material.
Additional files
-
Transparent reporting form
- https://doi.org/10.7554/eLife.48239.014
Download links
A two-part list of links to download the article, or parts of the article, in various formats.
Downloads (link to download the article as PDF)
Open citations (links to open the citations from this article in various online reference manager services)
Cite this article (links to download the citations from this article in formats compatible with various reference manager tools)
Evolution of asymmetric gamete signaling and suppressed recombination at the mating type locus
eLife 8:e48239.
https://doi.org/10.7554/eLife.48239


