Electroporated recombinant proteins as tools for in vivo functional complementation, imaging and chemical biology
- Max Planck Institute of Molecular Physiology, Germany
- Leibniz Institute of Molecular Pharmacology (FMP Berlin), Germany
- Max Planck Society, Germany
- Umeå University, Sweden
- Weizmann Institute of Science, Israel
- University Duisburg-Essen, Germany
Figures
Figure 1 with 5 supplements
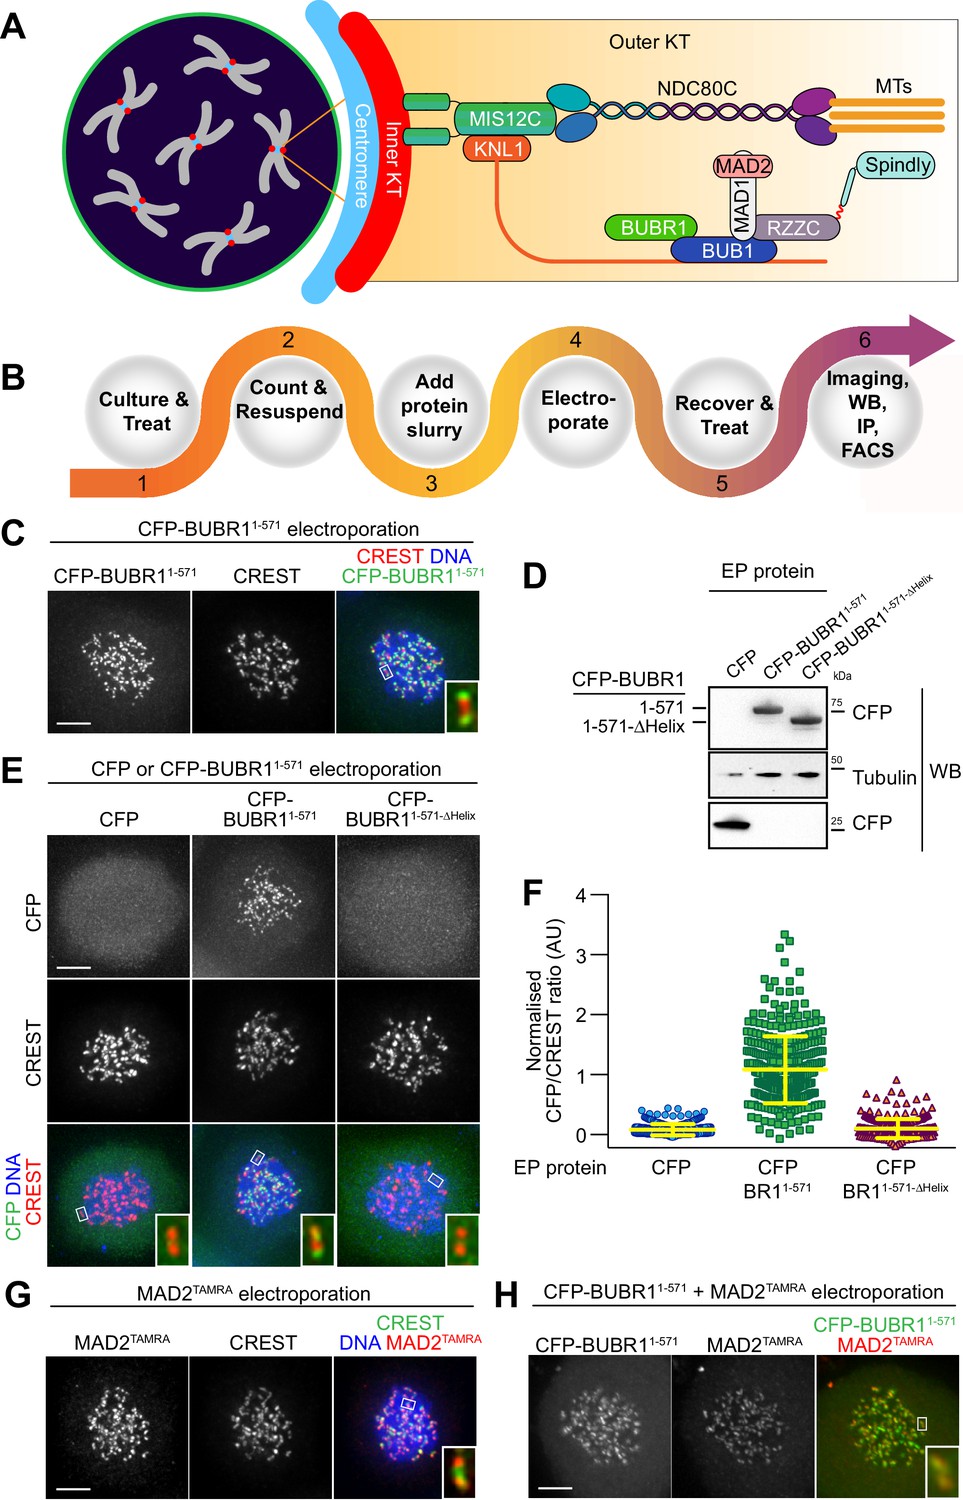
Delivery of spindle assembly checkpoint proteins by electroporation.
(A) Schematic outline of a mitotic cell with condensed chromosomes (gray) and centromeres (blue). The inner kinetochore (red) recruits several outer kinetochore proteins (orange gradient box), including the MIS12 (MIS12C) and the microtubule (MT) binding complex NDC80 (NDC80C). In turn, these complexes recruit the protein KNL1, the spindle assembly checkpoint (SAC) components BUB1, BUBR1, MAD1 and MAD2, and the outer kinetochore proteins RZZ and Spindly. (B) Overview of the electroporation (EP) work-flow using adherent cells. (1) Cells are cultured under defined growth conditions according to experimental requirements. (2) Prior to EP, cells are harvested by trypsinization, washed in PBS, counted and resuspended in EP buffer. (3) Recombinant protein diluted in EP buffer is added to cell slurries at desired concentrations (this stage is called EP slurry). (4) Cells are pulsed between 1 and 3-times to allow for efficient delivery of recombinant proteins. (5) Cells are tripsinised and then washed twice to remove non-incorporated proteins, and then plated on cover slips or culture flasks to allow for recovery. (6) After a recovery period, cells are suitable for analysis with a number of different read-outs and applications, including, amongst others, imaging, western blotting, immunoprecititaion (IP) and FACS analysis. (C) Following EP of CFP-BUBR11-571 and over-night recovery, cells were treated for 6 hr with nocodazole and then prepared for immunofluorescence analysis. Kinetochores were stained with the marker CREST and DNA with SiR-Hoechst-647. Insets represent magnifications of the boxed kinetochores. Scale bar = 5 µm. (D) CFP alone, CFP-BUBR11-571 and the BUB1-binding-deficient mutant CFP-BUBR11-571-ΔHelix were electroporated under the same conditions used in C. Protein extracts generated from electroporated cells were subjected to western blotting analysis with the indicated antibodies. (E) CFP-BUBR11-571-ΔHelix fails to localize to kinetochores. Kinetochores were stained with the marker CREST and DNA with SiR-Hoechst-647. Scale bar = 5 μm. (F) Quantification of KT levels for electroporated CFP proteins from cells shown in E. Each symbol represents a single cell. Yellow lines indicate median values ± interquartile range. (G) SAC protein MAD2TAMRA electroporated into cells display proper localization to unattached kinetochores. Kinetochores were stained with the marker CREST and DNA with DAPI. Scale bar = 5 μm. Insets represent magnifications of the indicated KT. (H) Simultaneous electroporation of CFP-BUBR11-571 and MAD2TAMRA results in proper localization to kinetochores of nocodazole-treated HeLa cells. Insets represent magnifications of the indicated kinetochore. Scale bar = 5 µm.
Figure 1—figure supplement 1
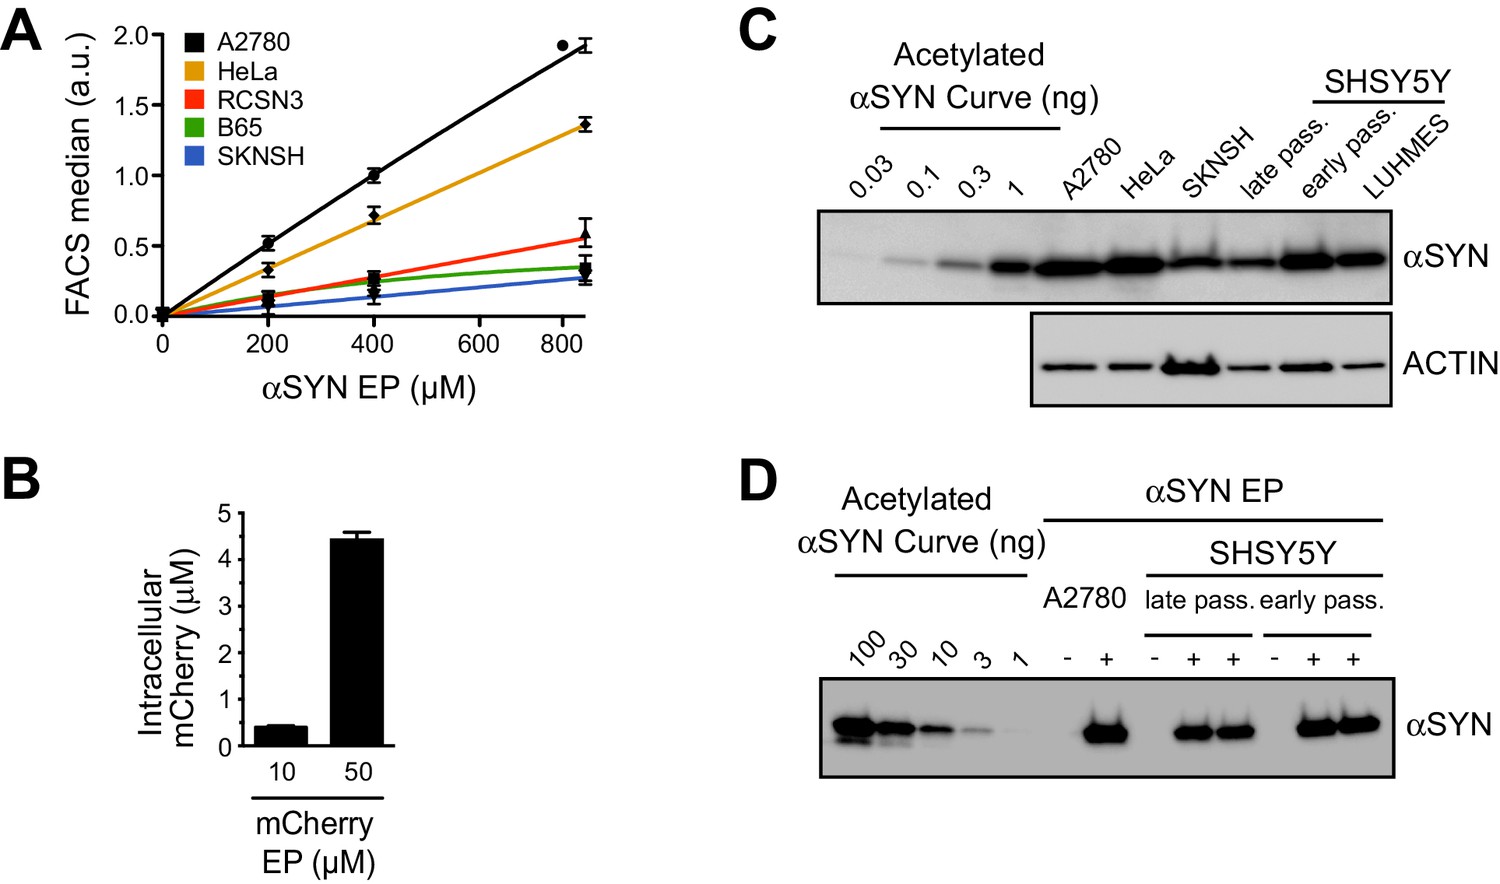
Measuring protein uptake levels upon electroporation of multiple cell lines.
(A) Quantification of EP-mediated protein uptake by flow cytometry across different cell lines. Median fluorescence intensities (MFI) determined by flow cytometry of EP-processed cells harboring Atto488-labeled α-synuclein (αSYN) plotted against αSYN input concentrations in the respective EP mixtures. Linear uptake efficiencies are evident for all cell lines despite cell-type specific differences in general uptake properties. MFI values were corrected for average cell sizes and corresponding volumes. Lines correspond to linear fits connecting individual measurement points. Error bars are SDM from four independent samples. (B) Quantification of EP-mediated protein uptake by fluorimetric analysis. Extracts from HeLa cells electroporated with mCherry and analyzed with a fluorimeter show that uptake is proportional to the input protein concentration. Fluorescence intensity of protein extracts generated from a known number of cells that were electroporated with different amounts of recombinant mCherry were quantified with a fluorimeter and plotted against an input titration curve. The values obtained were subtracted for the intensity values measured from a mock EP sample. Graph represents mean values ± SD. (C) Western blotting analysis of whole cell lysates to detect endogenous αSYN levels in A2780, HeLa, SK-N-SH, early- and late-passage SH-SY5Y and undifferentiated LUHMES cells. Defined concentrations of recombinant N-terminally acetylated αSYN serve as input control. Average intracellular concentrations are in the range of 0.05 to 0.5 µM, calculated based on experimentally determined cell volumes (Theillet et al., 2016). (D) By comparison to the endogenous levels determined in panel C, cells electroporated with 400 µM αSYN in the EP slurry harbor ~100 fold higher levels of the recombinant protein (see input concentrations for reference).
Figure 1—figure supplement 2
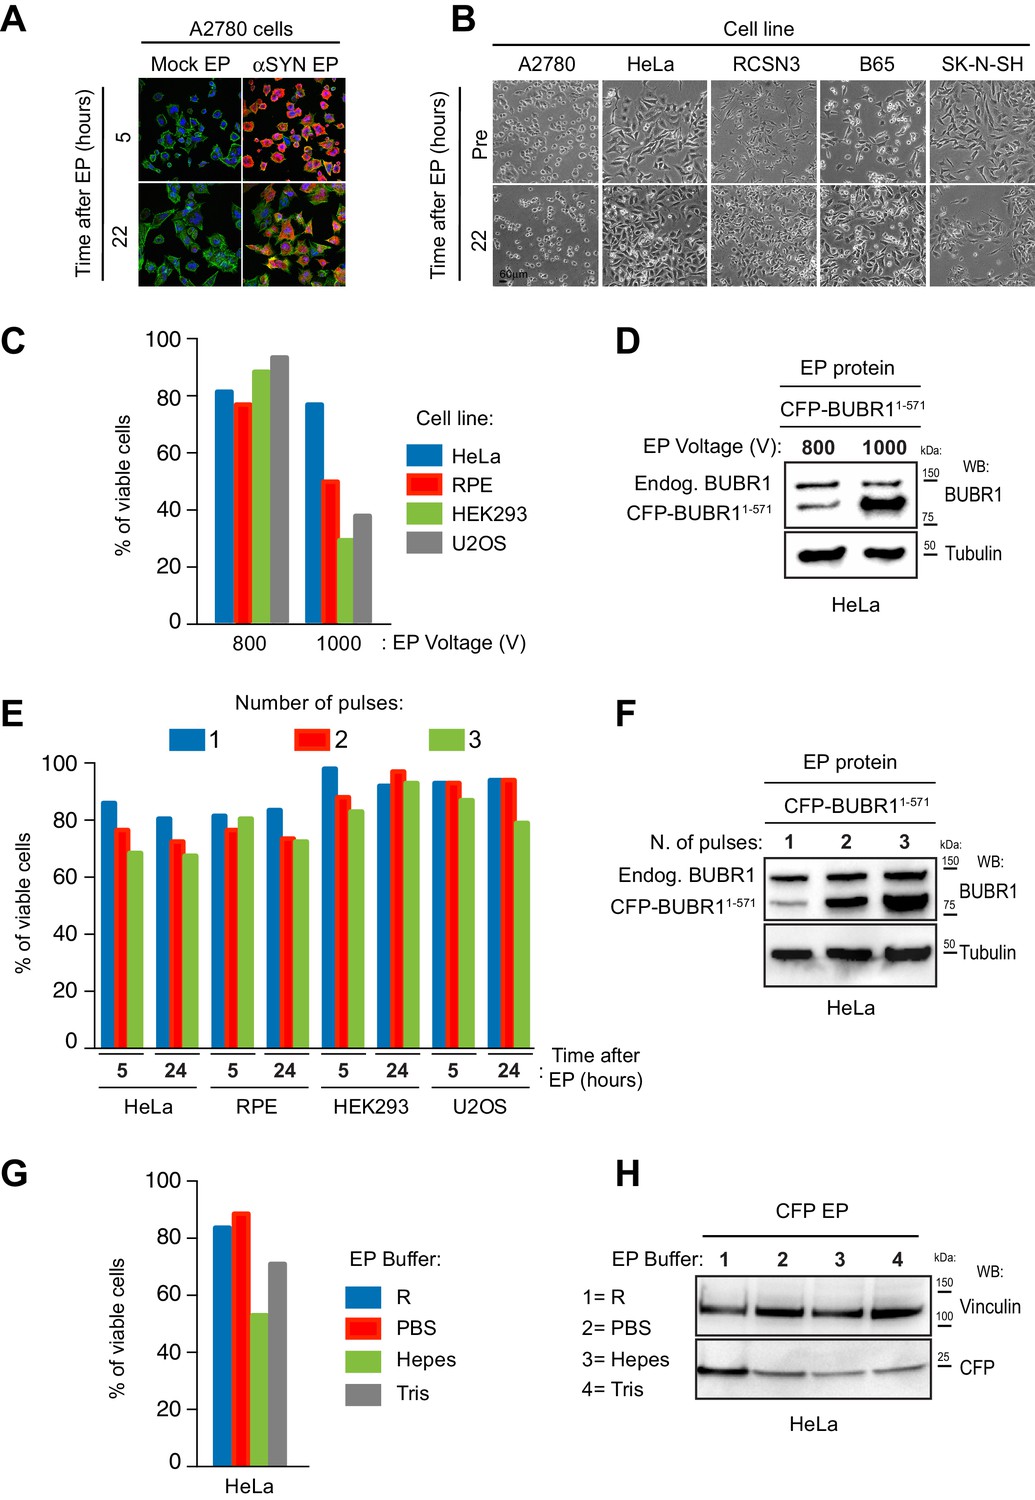
Analysis of cell viability and protein uptake in multiple cell lines electroporated with different EP settings.
(A) Electroporation of αSYN in A2780 cells produces low levels of cell damage. Panels show anti-αSYN immunofluorescence detection in A2780 cells at different time-points following batch EP and recovery. DNA is shown in blue (DAPI), actin in green (phalloidin) and αSYN in red. Note that most cells harbor αSYN (high penetrance) and that intracellular protein levels are similar between cells (uniform delivery efficiency). 22 hr after EP, adherent cells regain their physiological cell morphologies, an indication that EP caused low cytotoxicity. Mock EP was carried out without recombinant αSYN in the EP mixture. (B) EP does not have major cytotoxic effects across different cell lines. Bright field analysis of neuronal (RCSN-3, B65, SK-N-SH) and non-neuronal (A2780, HeLa) cell lines electroporated with α-synuclein (αSYN) to inspect cell morphology and viability. (C) Viability of RPE, HEK293 and U2OS cells is sensitive to EP voltage. Cell lines were electroporated with recombinant CFP and then stained with Trypan blue to measure viability at 5 hr after EP. Settings used for the delivery were either 800V/2 × 25 msec pulses or 1000 V/2 × 35 msec pulses. (D) Western blotting analysis of whole cell lysates from HeLa cells electroporated with CFP-BUBR11-571 and with voltage settings as in panel C. (E) Effect of the number of EP pulses on cell viability. Cells electroporated with recombinant CFP and using an increasing number of EP pulses were stained with Trypan blue to measure viability at the indicated time points after EP. HeLa cells were subjected to 1000 V/35 msec pulses while RPE, HEK293 and U2OS to 800 V/25 msec pulses. Values indicated for the two pulses/5 hr time points are the same shown in panel C. (F) Correlation between number of EP pulses and the cellular intake of recombinant protein. Western blotting analysis of HeLa cells electroporated with recombinant CFP-BUBR11-571 using 1000 V and an increasing number of 35 msec pulses. Endog. = endogenous. (G) Effects of the EP buffers on cell viability. HeLa cells electroporated with CFP using the indicated buffers and settings of 1000 V/2 × 35 msec were analysed for viability with Trypan blues staining at 5 hr following EP. (H) Effect of different EP buffer on cellular intake of recombinant protein. Western blotting analysis of whole cell lysates from cells in G.
Figure 1—figure supplement 3
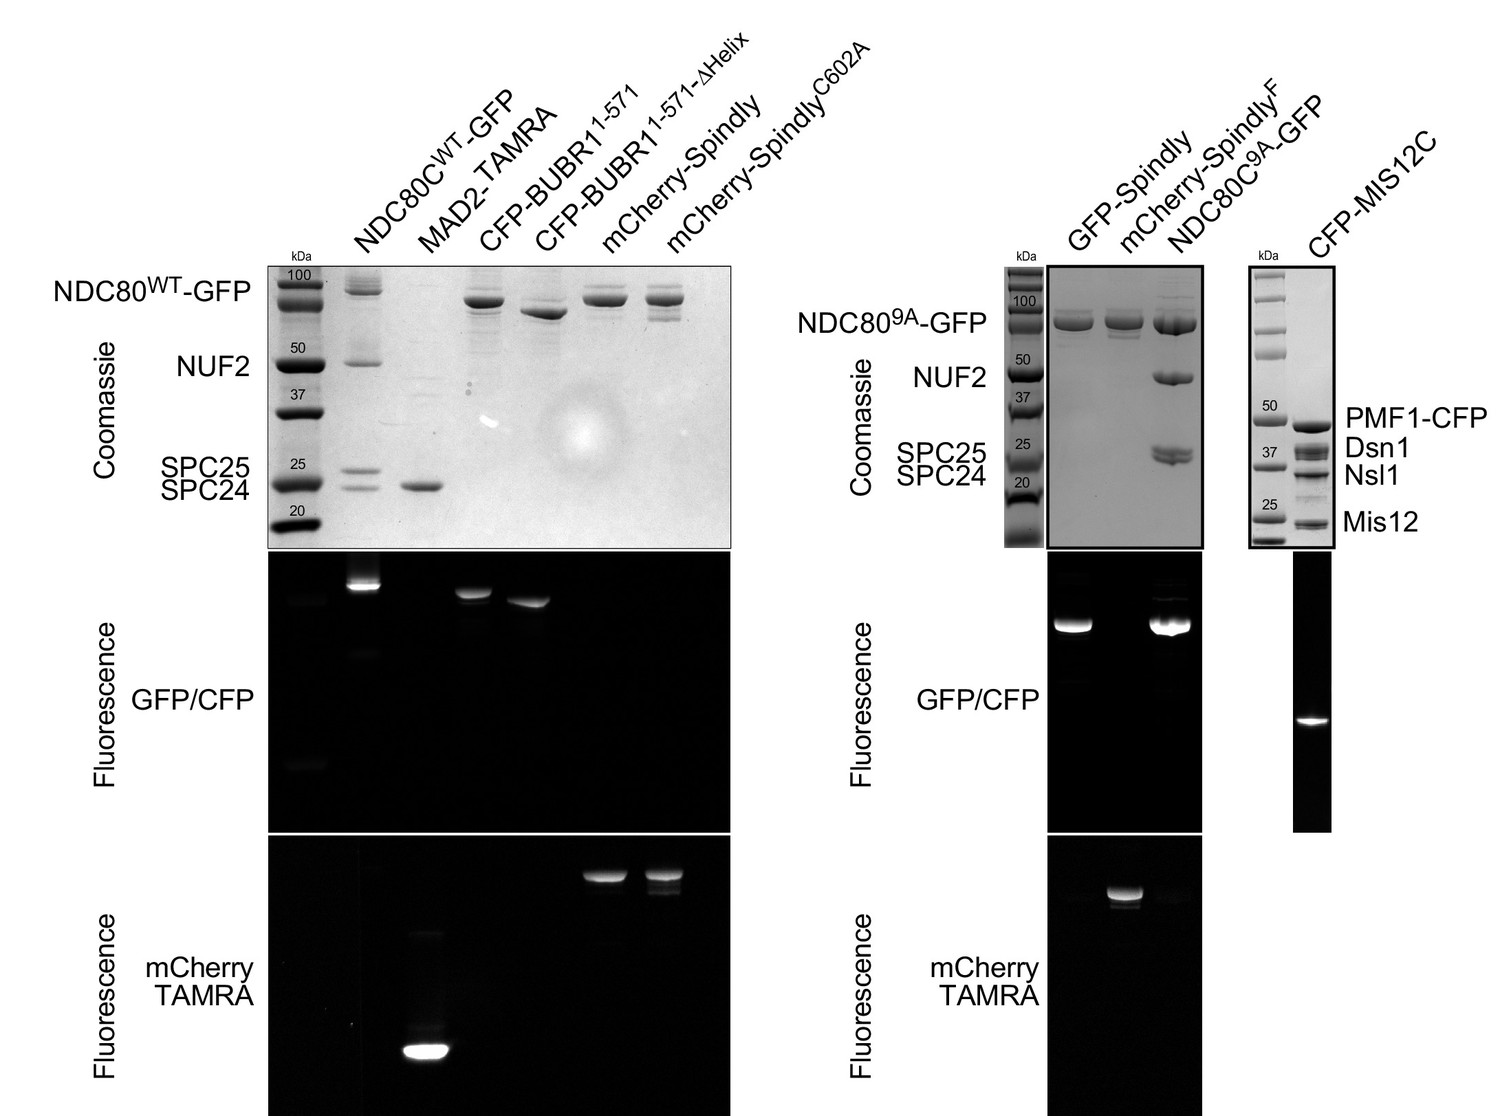
Recombinant proteins used for this study.
Protein samples employed in this study were run on an acrylamide gel and imaged by coomassie staining or for the indicated fluorophore. Note: the gel representing fluorescent CFP-MIS12 was run with a sample that was not boiled (to preserve fluorescence) and this resulted in a faster migration.
Figure 1—figure supplement 4
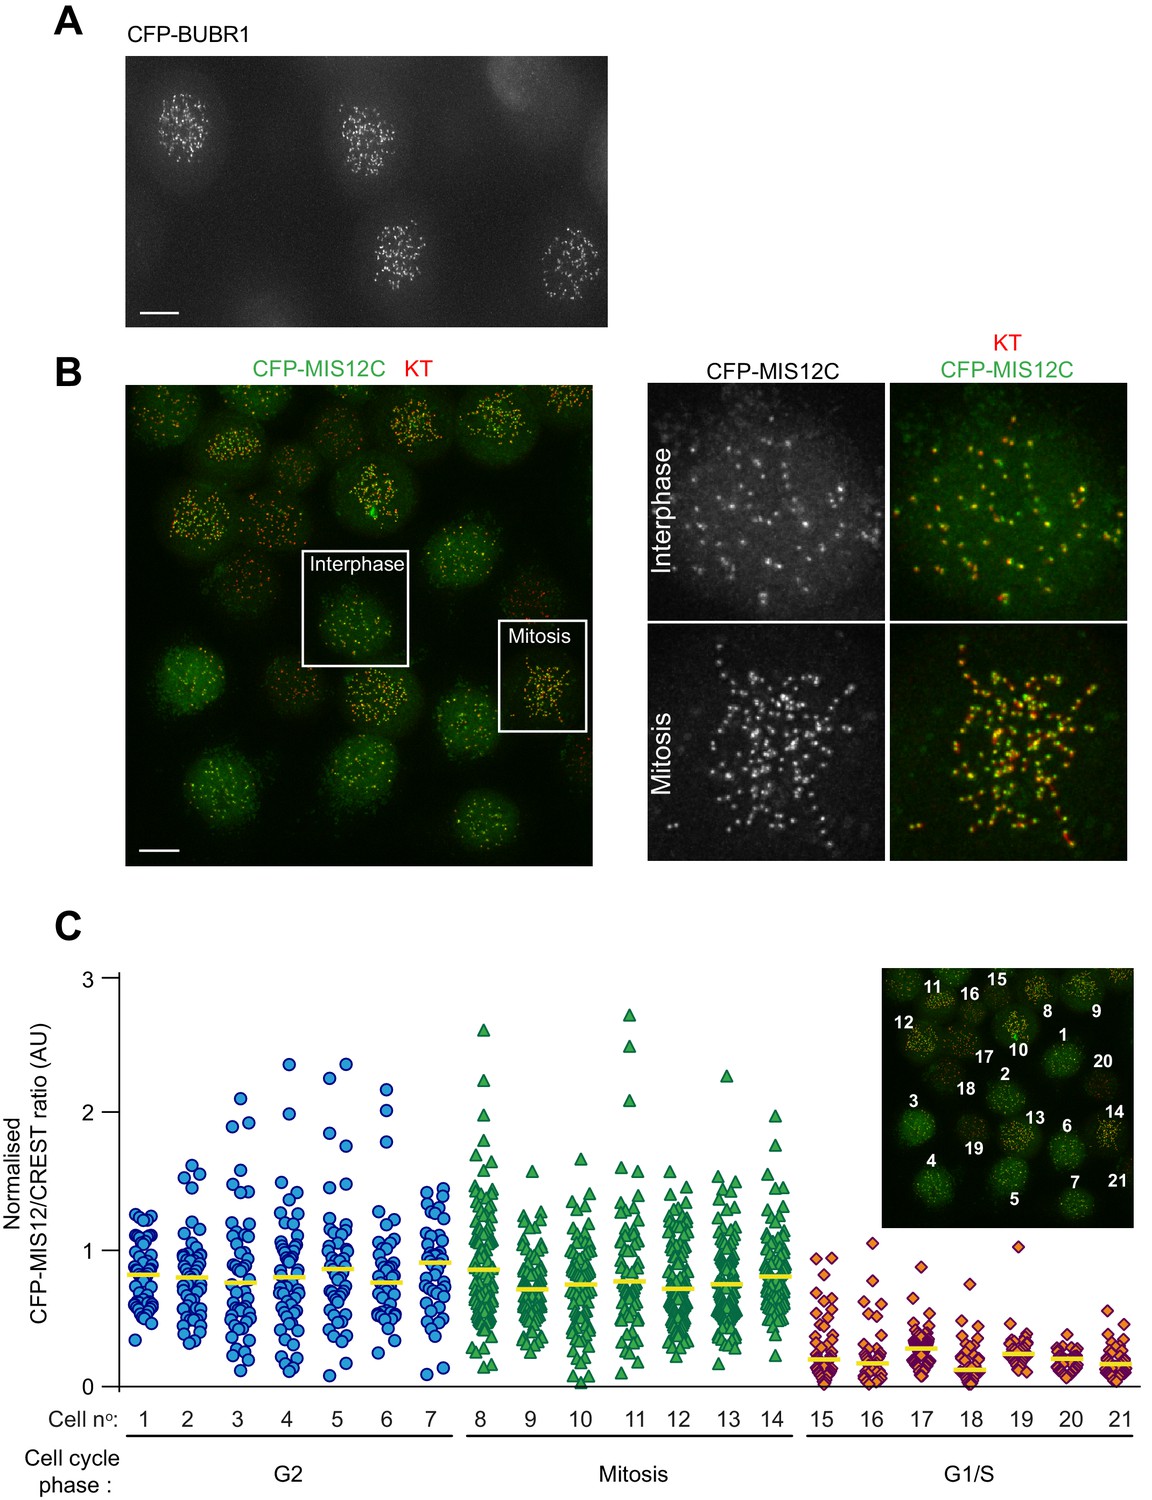
EP is highly efficient and produces uniform protein levels between different recipient cells.
(A) representative imaging field shows HeLa cells electroporated with either CFP-BUBR1 (A) or CFP-MIS12C (B) and, after recovery, treated with nocodazole for 4 hr. Insets in B represent magnification of the indicated cells. KTs were stained with the marker CREST. Scale bar = 5 μm. (C) Quantification of KT levels for electroporated CFP-MIS12C from cells in panel B. Individual cell numbers are indicated in the small inset. Cell phases were assigned based on cell morphology and size. Each symbol represents a single KT. Yellow lines indicate median.
Figure 1—figure supplement 5
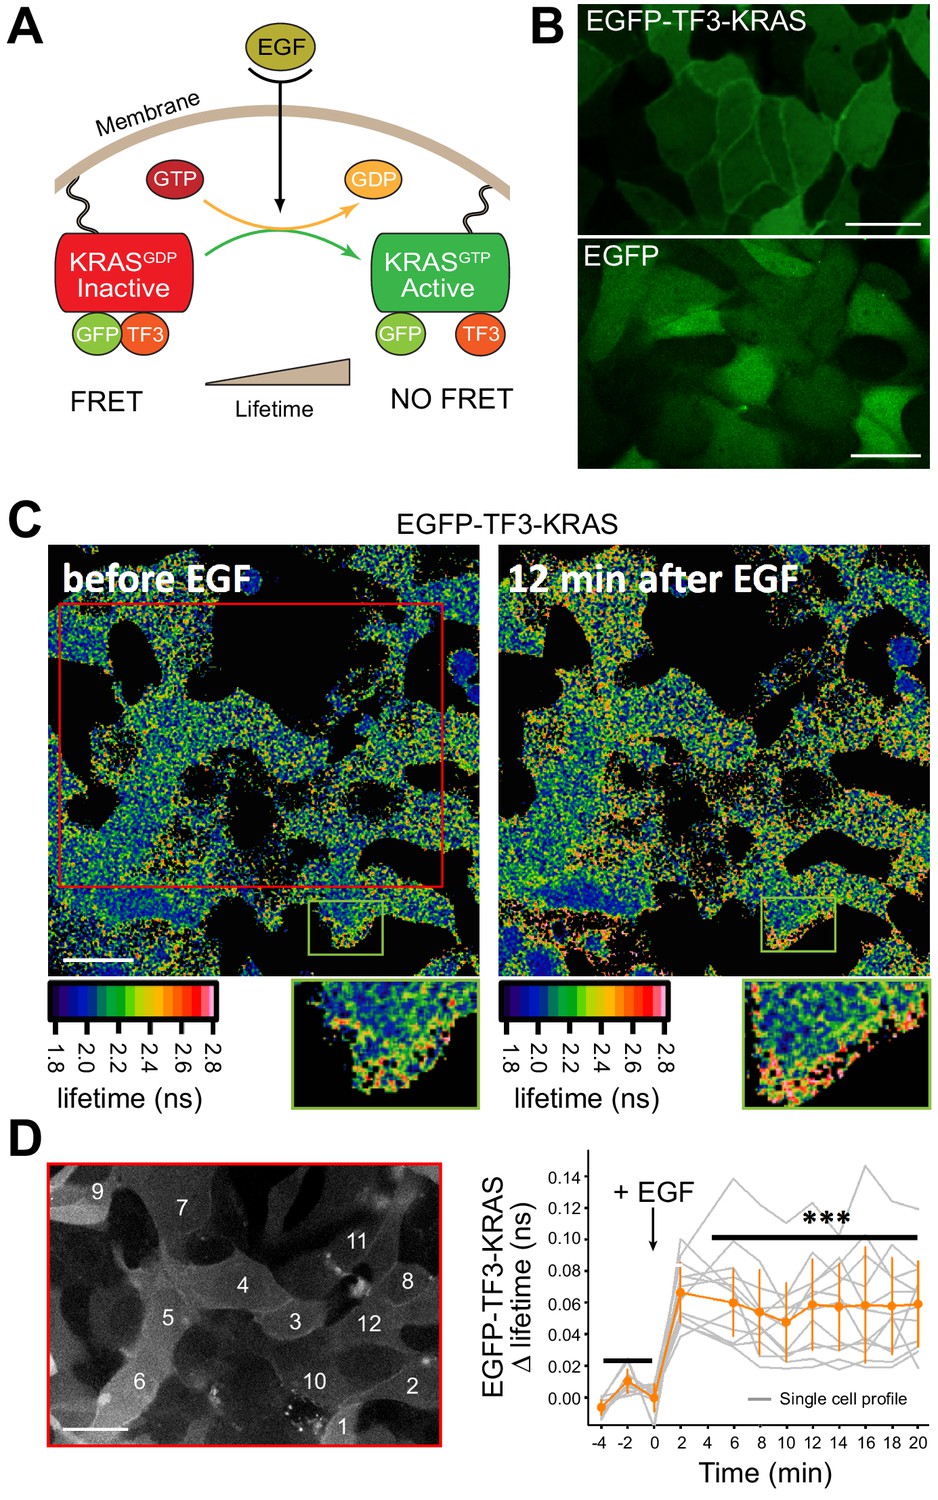
Live-cell FLIM-FRET on EP-delivered proteins.
(A) Schematic representation of the activation of the membrane-bound EGFP-TF3-KRAS FRET-sensor. Treatment with EGF results in a conformational change which results in a loss of FRET between the fluorescent moieties of the sensor and an increase in the donor fluorescence lifetime measured by FLIM-FRET live microscopy. (B) Membrane localization of EP-delivered EGFP-TF3-KRAS in serum-starved MDCK interphase cells. Scale bar = 5 μm. (C) Analysis of spatiotemporal dynamics of electroporated EGFP-TF3-KRAS signaling by live-cell FLIM-FRET imaging. Upon EGF stimulation, the conformational switch in intracellular EGFP-TF3-KRAS results in loss of FRET signal and a subsequent increase in the lifetime of the GFP-donor. Lifetime values for each pixel are shown color-coded. Scale bar = 5 μm. (D) Activity of electroporated EGFP-TF3-KRAS is qualitatively and quantitatively identical to the one obtained in EGFP-TF3-KRAS microinjection experiments (Voss et al., 2016). Graph shows single cell readouts of fluorescence lifetime profiles. Gray traces represent individual measurements while orange line represents the mean. Error bars are SDM. Scale bar = 5 μm.
Figure 2 with 1 supplement
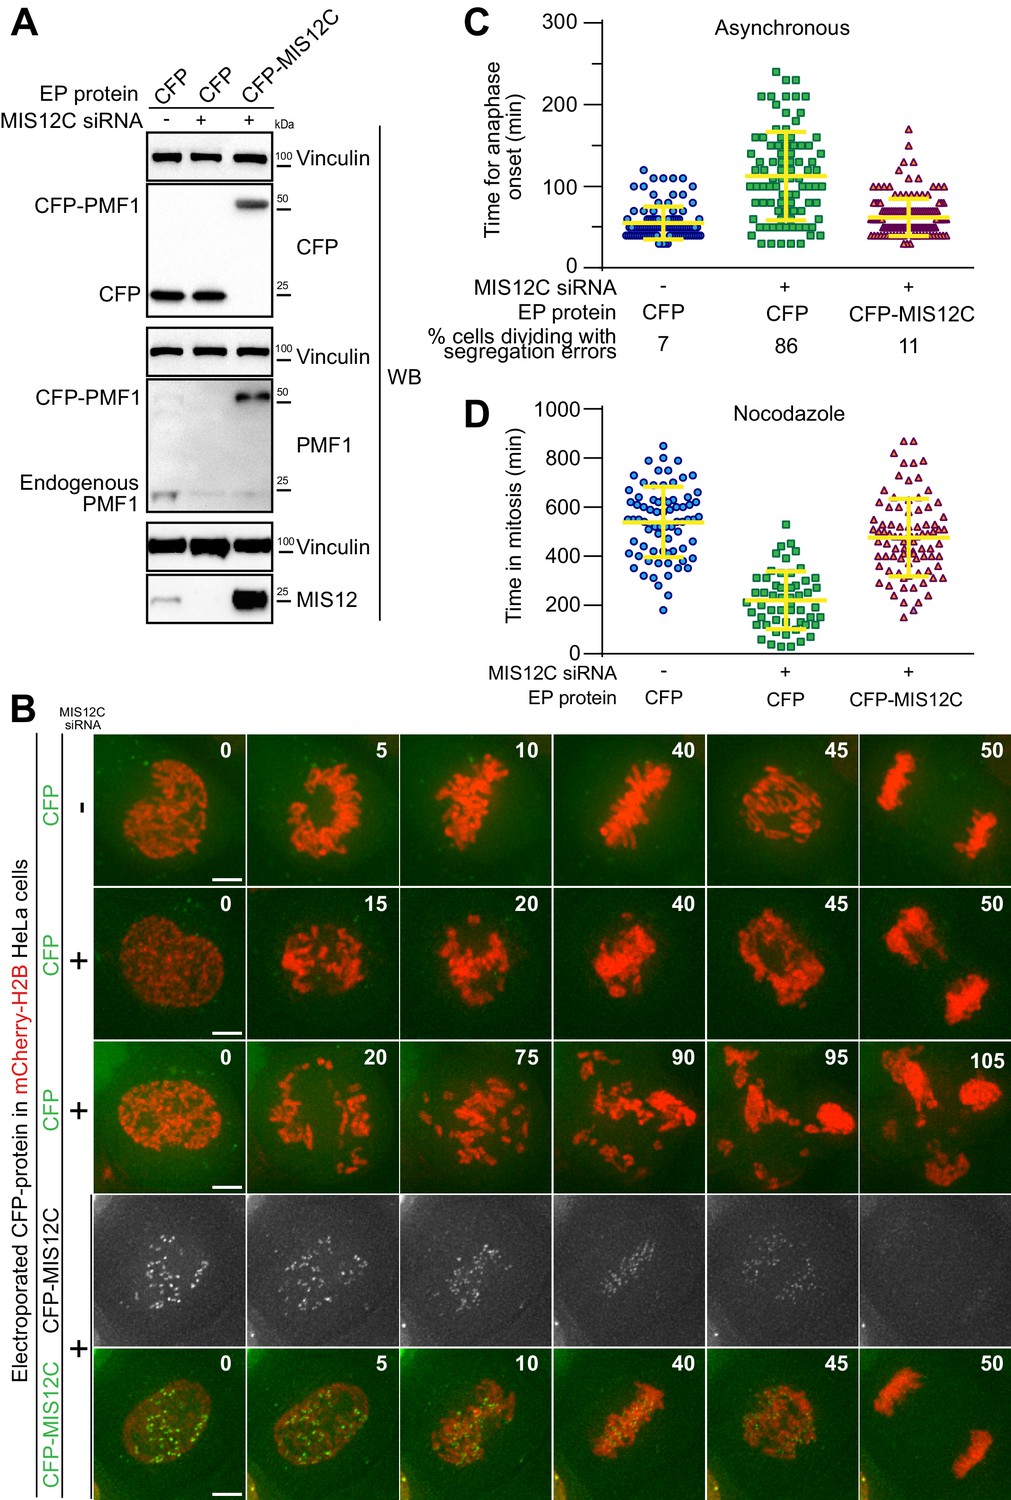
Electroporated MIS12 complex targets kinetochores and functionally complements depletion of the endogenous complex.
(A) The indicated proteins, including CFP-labeled recombinant MIS12C, were electroporated in mCherry-H2B-expressing HeLa cells previously treated with siRNAs to deplete the endogenous MIS12C. Western blotting of cellular protein levels in extracts was performed and showed a depletion in MIS12 and PMF1 levels of 93,7% and 87,6% respectively. (B) Frames collected at the indicated time points (min) of time-lapse live-cell fluorescence microscopy movies depict chromosome congression and segregation of cells from A. Two representative phenotypes observed in cells with depleted MIS12C that were concomitantly electroporated with CFP as control are shown. Green and red signal represent, respectively, CFP proteins and DNA. Scale bar = 5 µm. (C) Quantification of chromosome segregation timing and defects in cells from A-B. Each symbol represents a measure of a single cell mitotic duration until anaphase onset (based on DNA and cell morphology). Yellow lines indicate mean values ± SD. (D) Electroporated CFP-MIS12C rescues SAC defects in H2B-mCherry HeLa cells depleted for endogenous MIS12C. Duration of mitosis (based on DNA and cell morphology) of individual cells treated as in A but imaged in the presence of nocodazole 0.3 μM. Yellow lines indicate mean values ± SD.
Figure 2—figure supplement 1
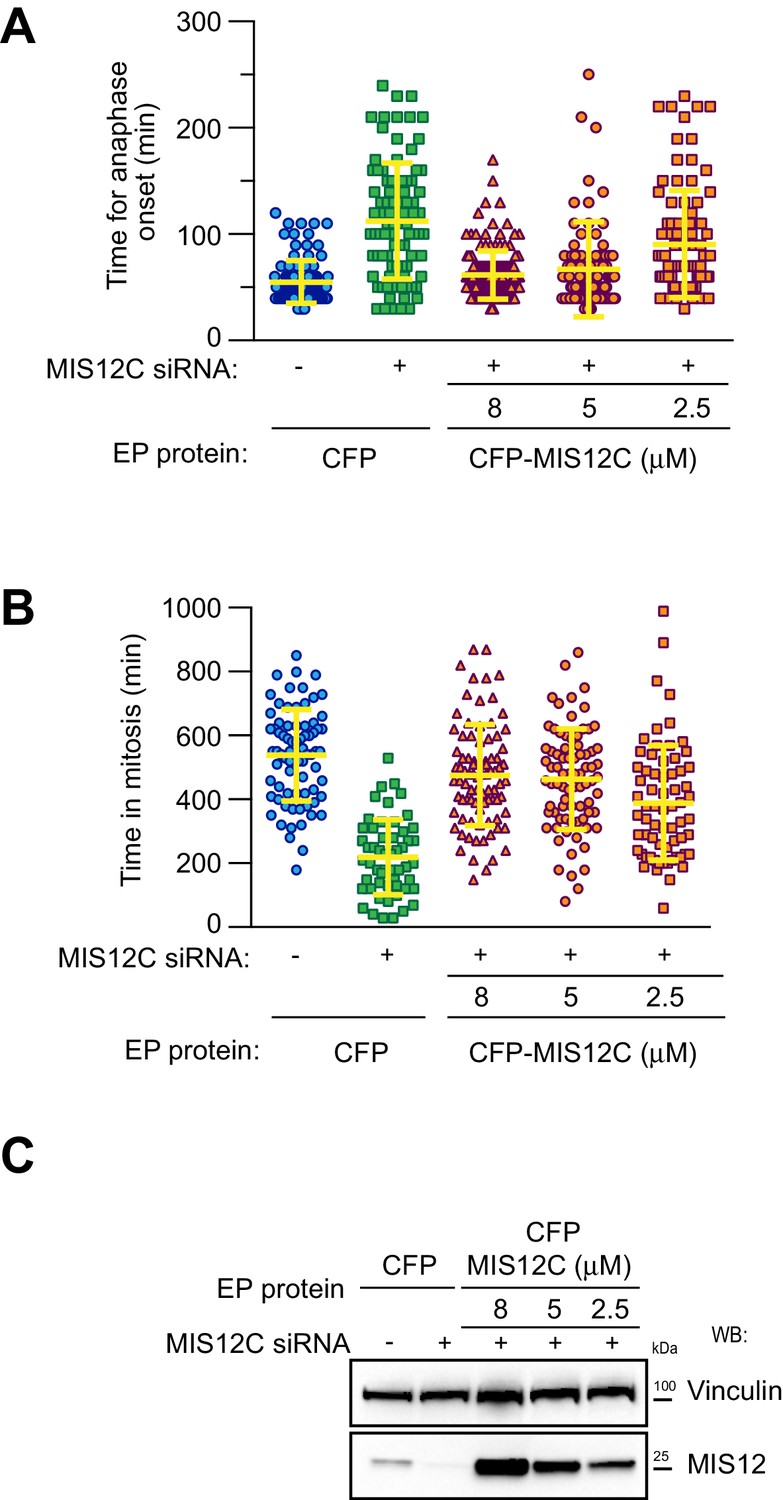
Electroporation of MIS12 complex at different EP-slurry concentrations.
(A) Quantification of chromosome segregation timing in H2B-mCherry HeLa cells depleted for endogenous MIS12C and electroporated with decreasing concentrations of recombinant CFP-MIS12C in the EP-slurry. Each symbol represents a measure of a single cell mitotic duration until anaphase onset (based on DNA and cell morphology). Yellow lines indicate mean values ± SD. Values indicated for Control/CFP, siRNA/CFP and siRNA/CFP-MIS12C 8 μM are the same shown in Figure 2C. (B) Duration of mitosis (based on DNA and cell morphology) of H2B-mCherry HeLa cells treated as in A but imaged in the presence of nocodazole 0.3 μM. Yellow lines indicate mean values ± SD. Values indicated for Control/CFP, siRNA/CFP and siRNA/CFP-MIS12C 8 μM are the same shown in Figure 2D. (C) Western blotting of MIS12 cellular levels in extracts from A-B.
Figure 3
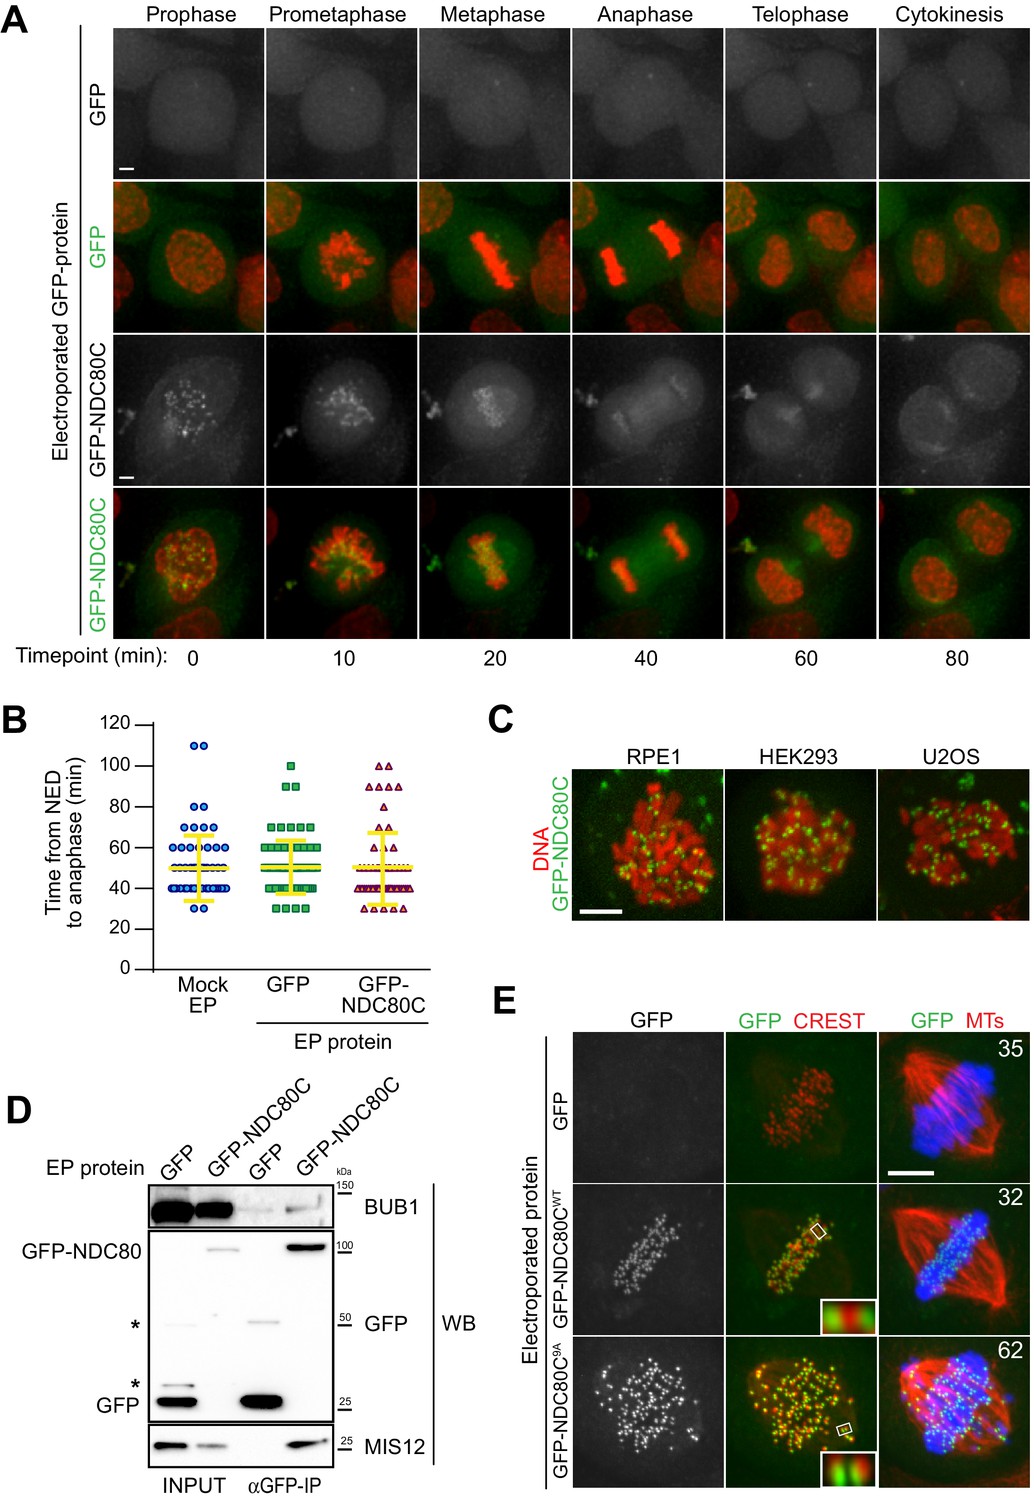
Cellular delivery of a protein complex with an exceptionally large hydrodynamic radius.
(A) GFP-labeled recombinant NDC80CWT binds to kinetochores and its localization is compatible with normal mitotic progression. Panels show timepoints of time-lapse movies for asynchronously growing HeLa cells electroporated with recombinant GFP proteins and imaged live every 10 min. DNA was stained with SiR-Hoechst-647 and is shown in red. Scale bar = 5 µm. (B) Quantification of time periods until anaphase onset for each of the conditions in panel A. Each symbol represents a single cell. Yellow lines indicate mean values ± SD. (C) Additional human cell lines were electroporated with GFP-NDC80C. RPE1 cells are non-transformed human retinal pigmented epithelium cells. HEK293 cells are human epithelium kidney cells. U2OS cells are human osteosarcoma cells. Following recovery and staining with SiR-Hoechst-647 DNA dye, cells were imaged live and display a clearly visible kinetochore localization of the delivered GFP-NDC80C complex. Scale bar = 5 µm. (D) Immunoprecipitation analysis of protein extracts from cells treated as in A shows that EP-delivered GFP-NDC80CWT establishes normal interactions with its endogenous KT partners. Western blotting panels show immunoprecipitates performed with α-GFP beads and probed with the indicated antibodies. (E) An error correction assay for the EP-delivery of a GFP-NDC80C9A mutant shows a dominant-negative effect on the correction of improper KT-MT attachments. Panels display representative images of electroporated HeLa cells treated with STLC to accumulate erroneous synthelic KT-MT attachments, followed by STLC washout, release into MG132 (proteasome inhibitor that prevents mitotic exit), and fixation 150 min after STLC-release. Inability to correct erroneous attachments results in uncongressed chromosomes. Control cells were electroporated with GFP alone. Numbers represent the percentage of cells with uncongressed chromosomes for each condition. KTs were labeled with anti-CREST immunostaining, microtubules (MT) with an anti-TUBULIN antibody and DNA with DAPI. Insets represent magnifications of the indicated KT. Scale bar = 5 µm.
Figure 4
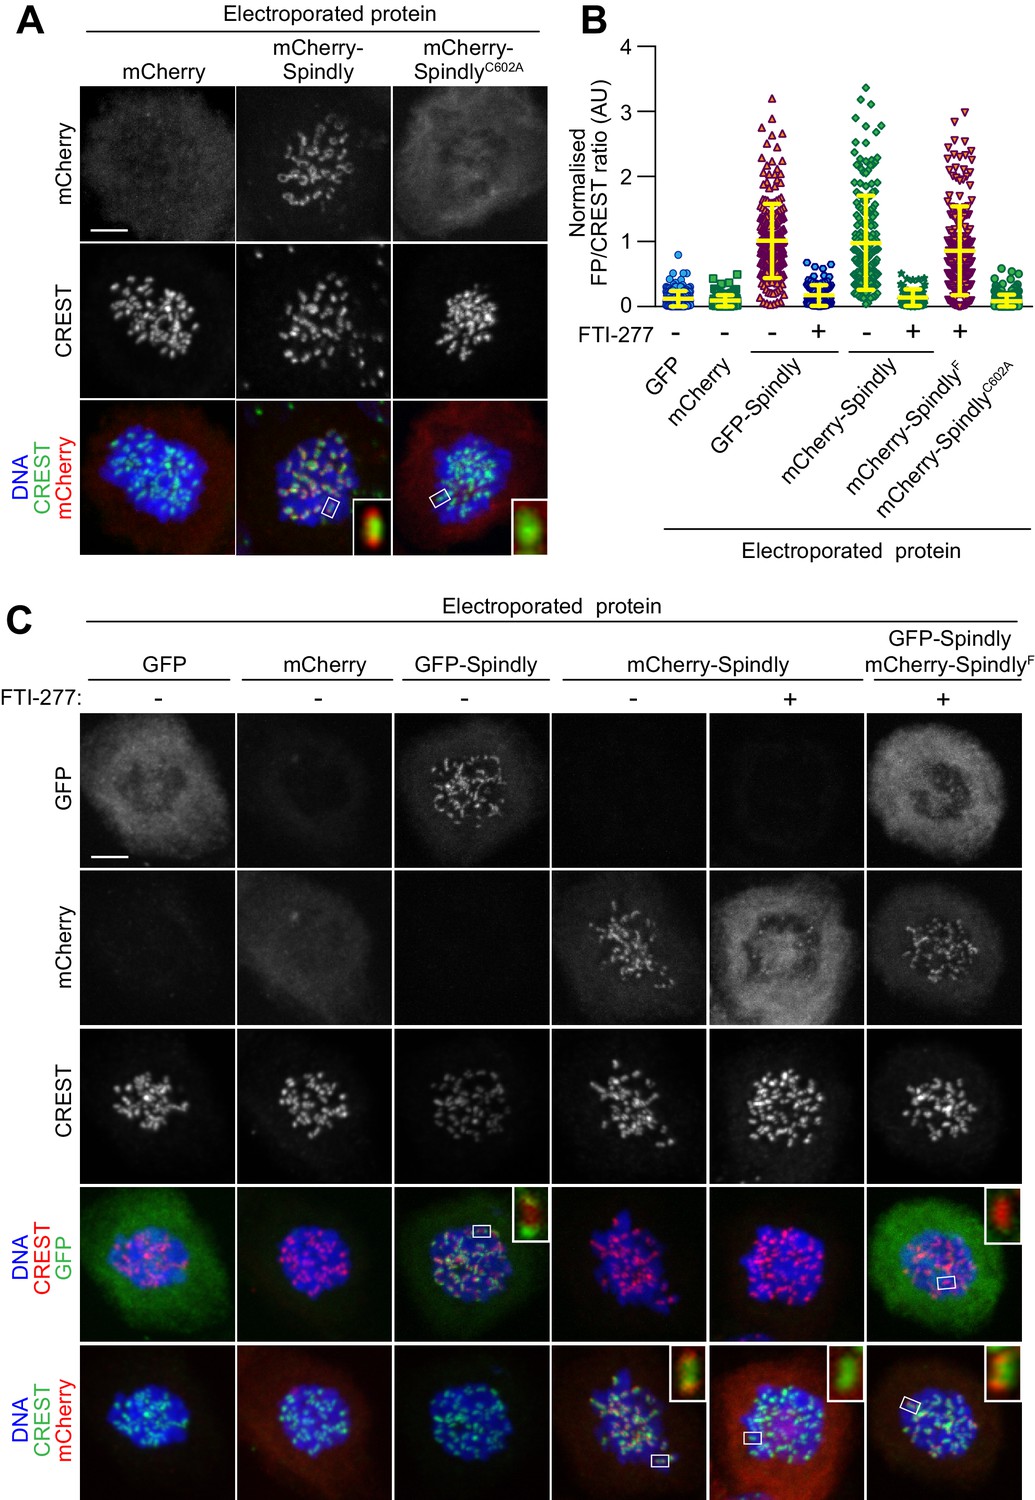
In vitro farnesylation allows Spindly localization when farnesyl transferase is inhibited.
(A) Kinetochore localization of unmodified recombinant Spindly depends on cellular farnesylation. Panels show representative images of cells transduced with unfarnesylated mCherry-Spindly in nocodazole-treated HeLa cells. Mutation of Cys602 to alanine prevents farnesylation upon EP and reduces KT levels of the delivered protein. Kinetochores were stained with CREST antibodies and DNA with DAPI. Controls cells were electroporated with mCherry. Insets represent magnifications of the indicated kinetochores. Scale bar = 5 µm. (B) Quantification of KT levels for electroporated Spindly from cells in A and C. Each symbol represents a single cell. Yellow lines indicate mean values ± SD. (C) In vitro farnesylation of mCherry-Spindly before EP bypasses the need of cellular farnesylation to achieve kinetochore localization. Cells treated with the farnesyl-transferase inhibitor FTI-277 were electroporated with either GFP, GFP-Spindly, mCherry, mCherry-Spindly, or in vitro pre-farnesylated mCherry-Spindly (mCherry-SpindlyF) and then processed for immunofluorescence analysis. Kinetochores were stained for CREST and DNA with DAPI. Insets represent magnifications of the indicated KT. FP = Fluorescent protein. Scale bar = 5 µm.
Videos
Video 1
Live imaging movie of the cell shown in Figure 2B (Ctrl+CFP).
Images show GFP-signal in green and DNA signal in red.
Video 2
Live imaging movie of the cell shown in Figure 2B (siRNA+CFP example 1).
https://doi.org/10.7554/eLife.48287.011
Video 3
Live imaging movie of the cell shown in Figure 2B (siRNA +CFP example 2).
https://doi.org/10.7554/eLife.48287.012
Video 4
Live imaging movie of the cell shown in Figure 2B (siRNA +CFP-MIS12C).
https://doi.org/10.7554/eLife.48287.013
Video 5
Live-imaging of asynchronous HeLa cells electroporated with recombinant GFP.
Fluorescence time-lapse images show GFP signal (left panel), DNA signal (central panel) and a merge (right panel).
Video 6
Live-imaging of asynchronous HeLa cells electroporated with GFP-NDC80C.
https://doi.org/10.7554/eLife.48287.016
Video 7
Live-imaging movie of cells shown in Figure 3A–B (Mock).
Images show GFP-signal in green and DNA signal in red.
Video 8
Live-imaging movie of cells shown in Figure 3A-B (GFP).
https://doi.org/10.7554/eLife.48287.018
Video 9
Live-imaging movie of cells shown in Figure 3A–B (GFP-NDC80C).
https://doi.org/10.7554/eLife.48287.019Tables
Key resources table
| Reagent type (species) or resource | Designation | Source or reference | Identifiers | Additional information |
|---|---|---|---|---|
| Cell line (Human) | HeLa | Imaging Facility, IFOM-IEO Campus, Milan, Italy | De Antoni et al., 2012. DOI: 10.1083/jcb.201205119 | |
| Cell line (Human) | mCherry-H2B HeLa | Imaging Facility, IFOM-IEO Campus, Milan, Italy | De Antoni et al., 2012. DOI: 10.1083/jcb.201205119 | |
| Cell line (Human) | RPE-Tir1 | Kindly provided by the laboratory of Prof. Don Cleveland | Holland et al., 2012.DOI: 10.1073/pnas.1216880109 | |
| Cell line (Human) | U2OS | Kindly provided by the laboratory of Dr. Alex Bird | ||
| Cell line (Human) | HEK293 | Kindly provided by the laboratory of Dr. Alex Bird | ||
| Cell line (Canine) | MDCK | Kindly provided by the laboratory of Dr. Yao-Wen Wu | Voss et al., 2016. DOI: 10.1073/pnas.1613999113 | |
| Cell line (Human) | A2780 | Kindly provided by the laboratory of Dr. Philip Selenko | Theillet et al., 2016. DOI: 10.1038/nature16531 | |
| Cell line (Human) | RCSN3 | Kindly provided by the laboratory of Dr. Philip Selenko | Theillet et al., 2016. DOI: 10.1038/nature16531 | |
| Cell line (Human) | B65 | Kindly provided by the laboratory of Dr. Philip Selenko | Theillet et al., 2016. DOI: 10.1038/nature16531 | |
| Cell line (Human) | SKNSH | Kindly provided by the laboratory of Dr. Philip Selenko | Theillet et al., 2016. DOI: 10.1038/nature16531 | |
| Cell line (Human) | SHSY5Y | Kindly provided by the laboratory of Dr. Philip Selenko | Theillet et al., 2016. DOI: 10.1038/nature16531 | |
| Recombinant DNA reagent | pBIG1 with NDC80C-9A (NDC80C9A-GFP and SPC25-HIS) | This paper | See Materials and methods | |
| Recombinant DNA reagent | pBIG1 with CFP-MIS12C (CFP-PMF1 and Dsn1-HIS) | This paper | See Materials and methods | |
| Recombinant DNA reagent | pFl- BUBR11-571(∆432–484) (HIS-BUBR1mTurquoise2) | This paper | See Materials and methods | |
| Sequence-based reagent | siRNA for Dsn1 | Sigma-Aldrich | GUCUAUCAGUGUCGAUUUA | |
| Sequence-based reagent | siRNA for Nsl1 | Sigma-Aldrich | CAUGAGCUCUUUCUGUUUA | |
| Sequence-based reagent | siRNA for Mis12 | Sigma-Aldrich | GACGUUGACUUUCUUUGAU | |
| Peptide, recombinant protein | MAD2-TAMRA | Musacchio laboratory | Faesen et al., 2017. DOI: 10.1038/nature21384 | |
| Peptide, recombinant protein | CFP-BUBR11-571 | Musacchio laboratory | Faesen et al., 2017. DOI: 10.1038/nature21384 | |
| Peptide, recombinant protein | NDC80C-GFP | Musacchio laboratory | Weir et al., 2016. DOI: 10.1038/nature19333 | |
| Peptide, recombinant protein | SPINDLY-GFP/mCherry | Musacchio laboratory | Mosalaganti et al., 2017. DOI: 10.1083/jcb.201611060 | |
| Peptide, recombinant protein | EGFP-K-RAS D30C Tf3 | Kindly provided by the Wu's laboratory | Voss et al., 2016. DOI: 10.1073/pnas.1613999113 | |
| Peptide, recombinant protein | α-Synuclein | Kindly provided by the Selenko's Laboratory | Theillet et al., 2016. DOI: 10.1038/nature16531 | |
| Commercial assay or kit | NEON Transfection System | Thermo Fisher | MPK5000S | |
| Commercial assay or kit | NEON Transfection 100 µl Kit | Thermo Fisher | MPK10025 | |
| Commercial assay or kit | Nucleofector Device | Lonza | AAB-1001 | |
| Chemical compound, drug | SiR-DNA kit | SphiroChrome | SC007 | |
| Software, algorithm | Imaris 9 | Bitplane |
Additional files
-
Transparent reporting form
- https://doi.org/10.7554/eLife.48287.021
Download links
A two-part list of links to download the article, or parts of the article, in various formats.
Downloads (link to download the article as PDF)
Open citations (links to open the citations from this article in various online reference manager services)
Cite this article (links to download the citations from this article in formats compatible with various reference manager tools)
Electroporated recombinant proteins as tools for in vivo functional complementation, imaging and chemical biology
eLife 8:e48287.
https://doi.org/10.7554/eLife.48287


