Dissection of central clock function in Drosophila through cell-specific CRISPR-mediated clock gene disruption
- Columbia University Medical Center, United States
Figures
Figure 1
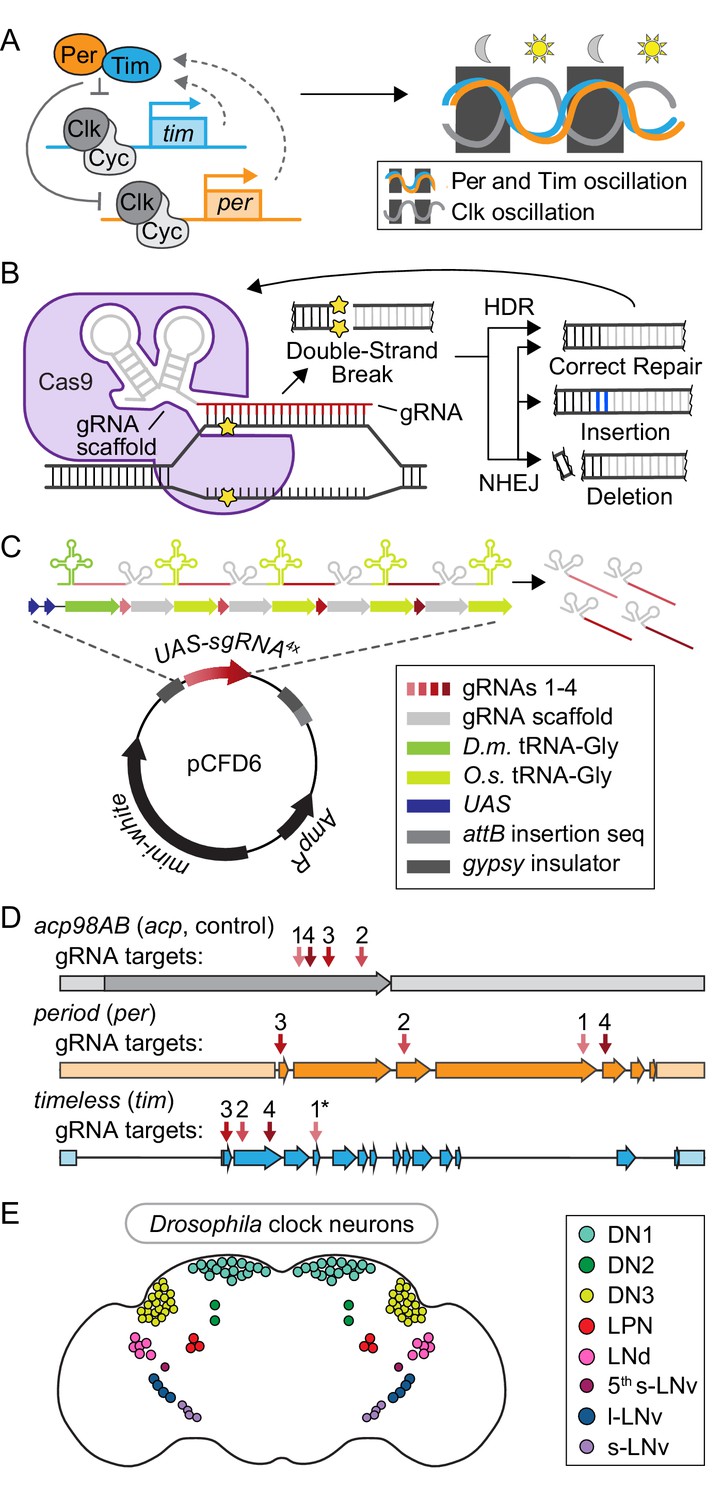
Toolbox for cell-specific, CRISPR-mediated disruption of core circadian regulators.
(A) Schematic of the transcriptional/translational negative feedback loop that drives rhythmic expression and activity of the four core circadian regulators: Period (Per), Timeless (Tim), Clock (Clk), and Cycle (Cyc). (B) Diagram of CRISPR-Cas9 mediated DNA damage and repair pathways. (C) Diagram of plasmid (pCFD6, adapted from Port and Bullock, 2016) used to generate UAS-sgRNA4x transgenic flies. D.m. = Drosophila melanogaster. O.s. = Oryza sativa, Asian rice. (D) Diagram showing sgRNA target sites for acp98AB (acp, gray), period (per, orange), and timeless (tim, blue), numbered in order of 5’−3’ position in the respective UAS-sgRNA4x construct. Arrows = exons; shaded rectangles = promoters and UTRs. *tim sgRNA one has a single base pair deletion in the Cas9-binding scaffold region (see Materials and methods). (E) Diagram of ~150 clock neurons organized into the following anatomical and functional clusters in the Drosophila brain: dorsal neurons (DN1, DN2, DN3), lateral posterior neurons (LPN), dorsal lateral neurons (LNd), and small and large ventral lateral neurons (s-LNv, 5th s-LNv, l-LNv).
Figure 2 with 5 supplements
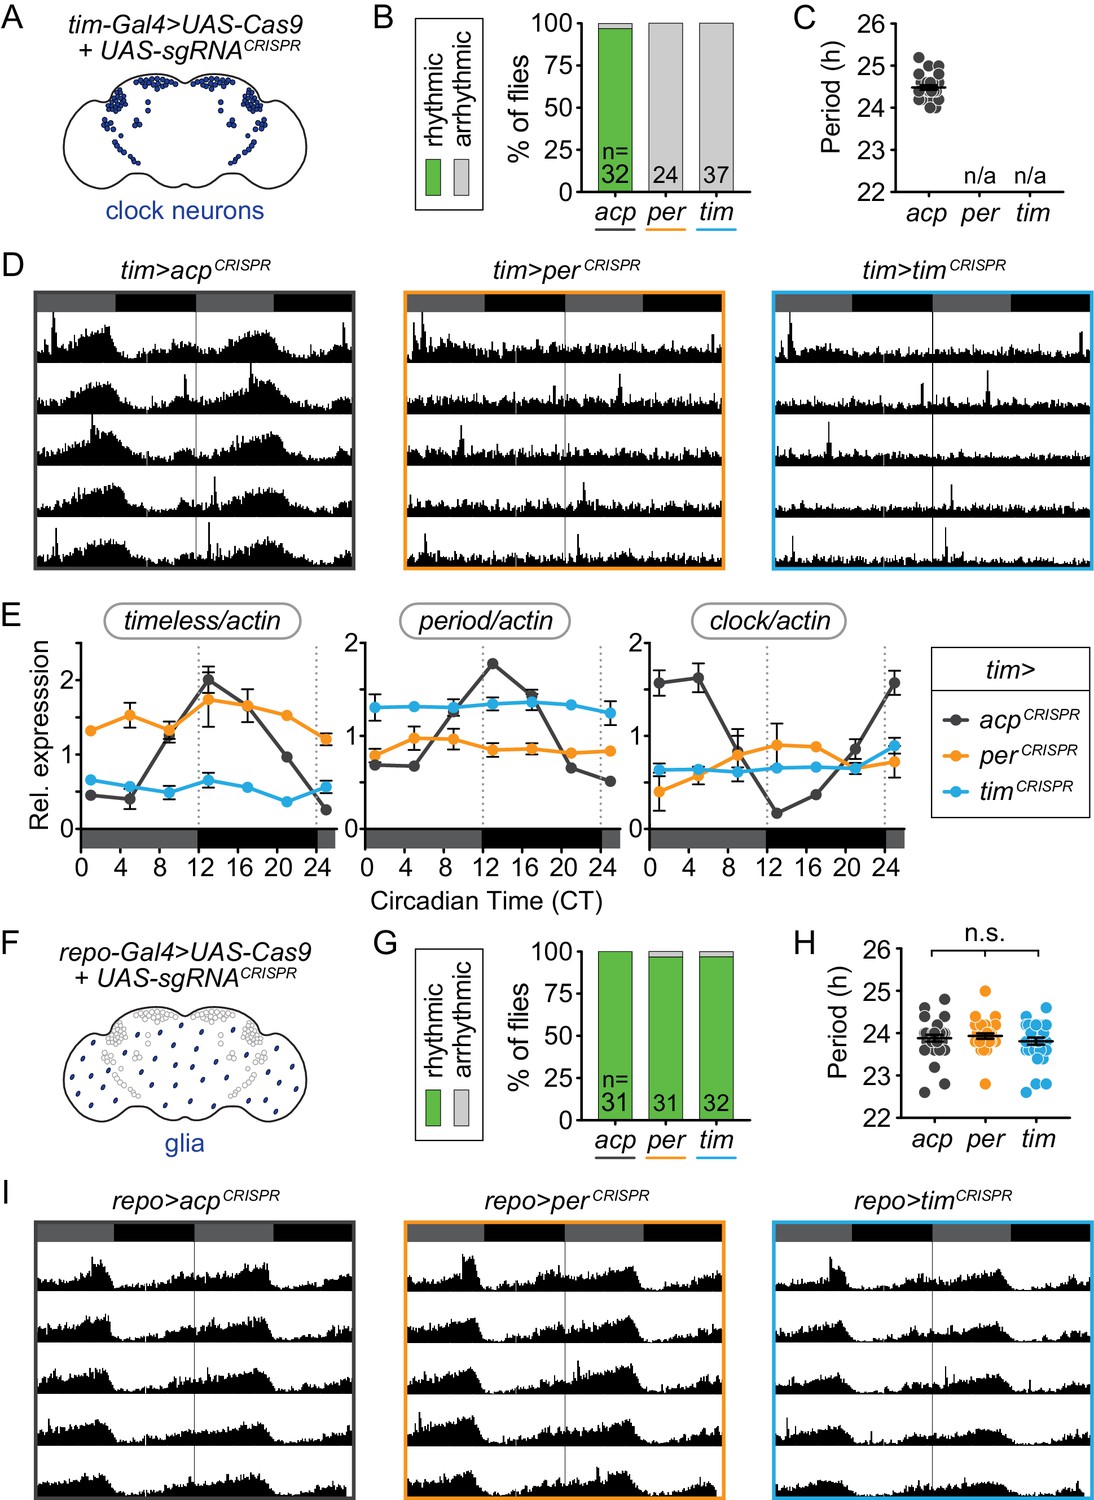
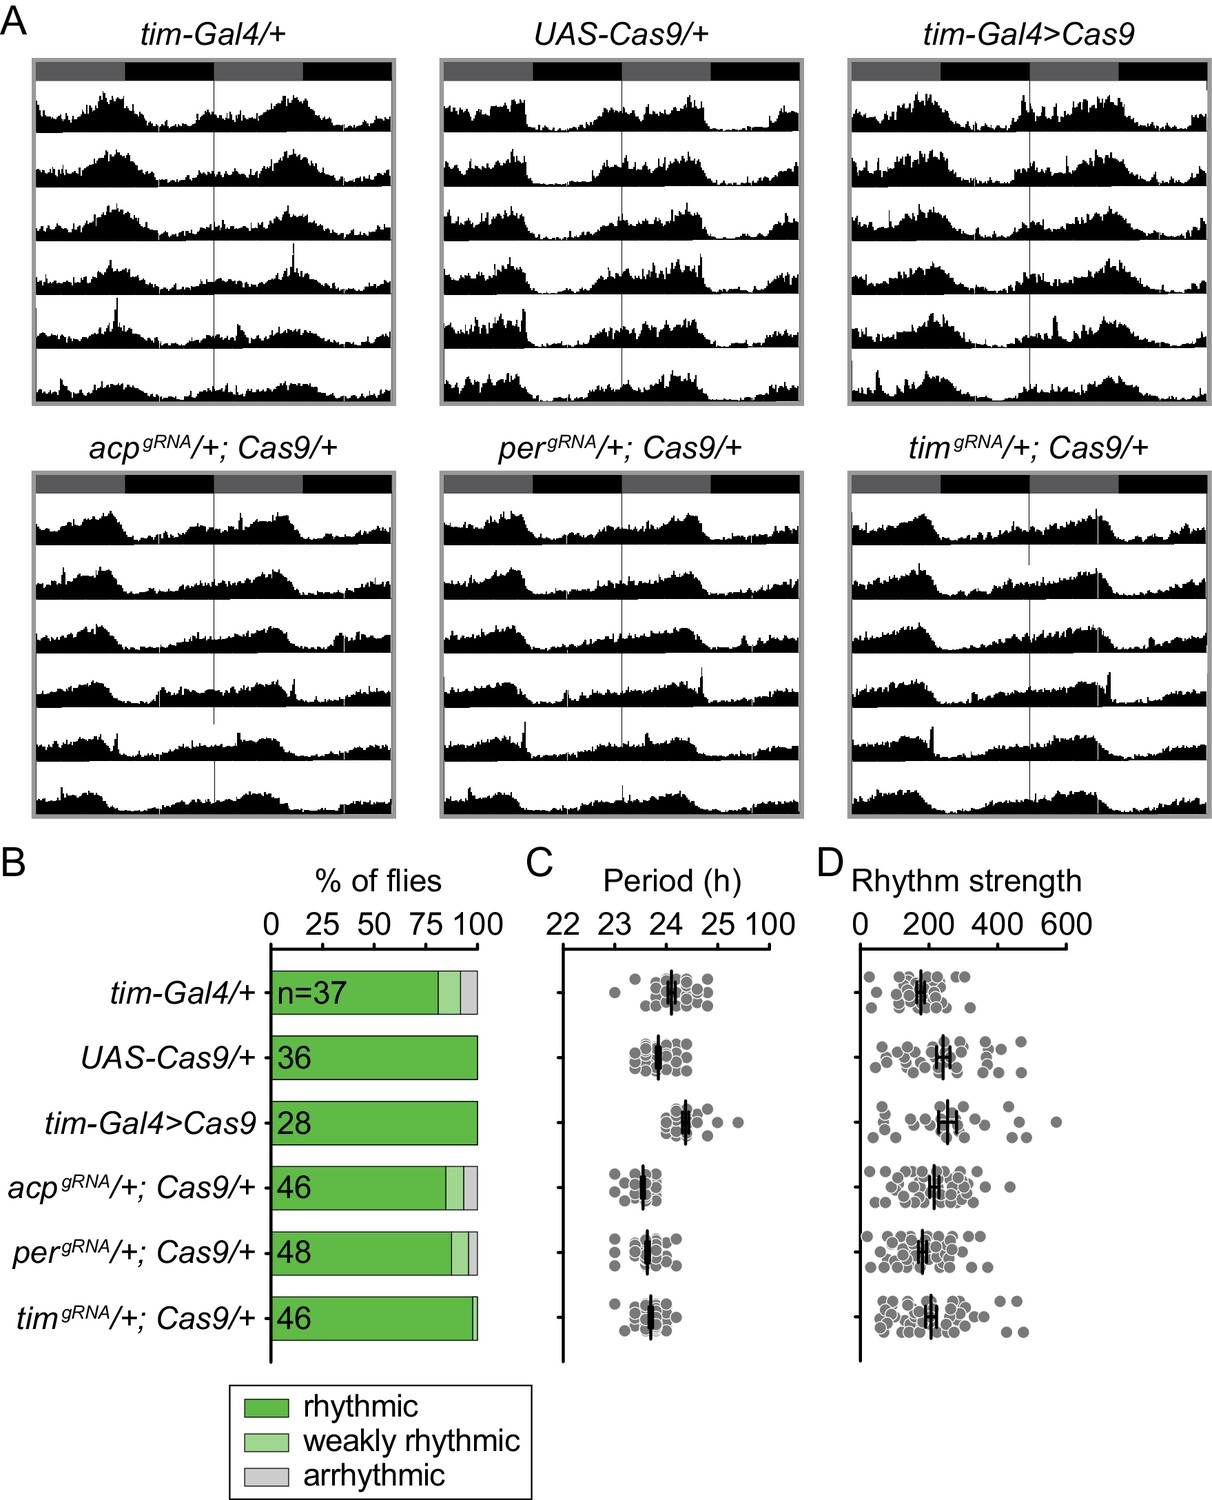
Cell-specific disruption of per or tim in circadian (Tim+) cells but not glial (Repo+) cells causes loss of behavioral rhythmicity.
(A) Diagram of clock neurons targeted for CRISPR-mediated gene disruption using tim-Gal4. (B) Disruption of per or tim in all clock neurons caused complete loss of behavioral rhythmicity. (C) Scatter plot showing the period of rhythmic flies with tim-Gal4-driven disruption of acp, per, or tim. (D) Actograms showing average activity in constant darkness of flies with tim-Gal4-driven disruption of acp, per, or tim. Activity data is double-plotted, with six days of activity displayed. Dark gray rectangles = subjective day, black rectangles = subjective night. (E) Relative mRNA levels, measured by qRT-PCR over a 24-hour period, of the core circadian genes timeless (left), period (middle), and clock (right) in heads of tim-Gal4 CRISPR flies. JTK analysis revealed that only acp-targeted flies display statistically significant rhythmic cycling indicative of circadian oscillation of all three genes. (F) repo-Gal4 targets most glia for CRISPR-mediated gene disruption. (G) repo-Gal4-driven, CRISPR-mediated gene disruption in glia had no effect on behavioral rhythmicity. (H) Scatter plot showing the period of rhythmic flies with repo-Gal4-driven disruption of acp, per, or tim. (I) Actograms show average activity of flies in constant darkness with repo-Gal4-driven disruption of acp, per, or tim in glia.
Figure 2—figure supplement 1
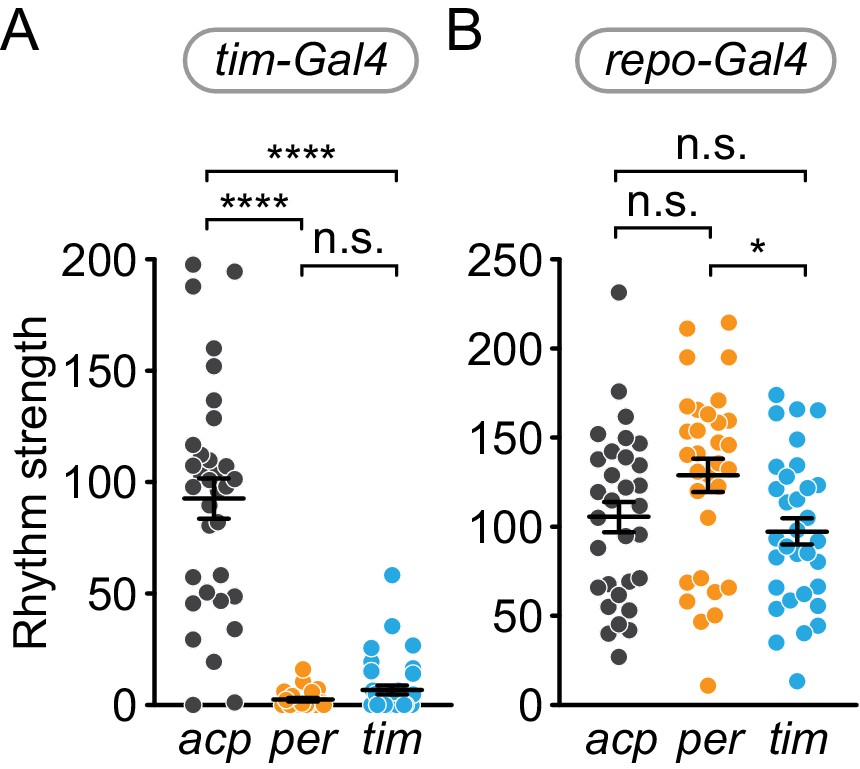
Cell-specific disruption of per or tim in circadian (Tim+) cells but not glial (Repo+) cells causes loss of rhythm strength.
χ2 peak height values (rhythm strength) for (A) tim-Gal4, (B) repo-Gal4, targeting of acp (gray), per (orange), or tim (blue). Significance determined by one-way ANOVA followed by Tukey’s multiple comparisons test (for normally distributed samples; B) or Kruskal-Wallis nonparametric ANOVA (to account for non-normality of samples; A) followed by Dunn’s multiple comparisons test; reported p-values are multiplicity adjusted to account for multiple comparisons. ****: p<0.0001; *: p<0.05; n.s.: not significant, p>0.05.
Figure 2—figure supplement 2
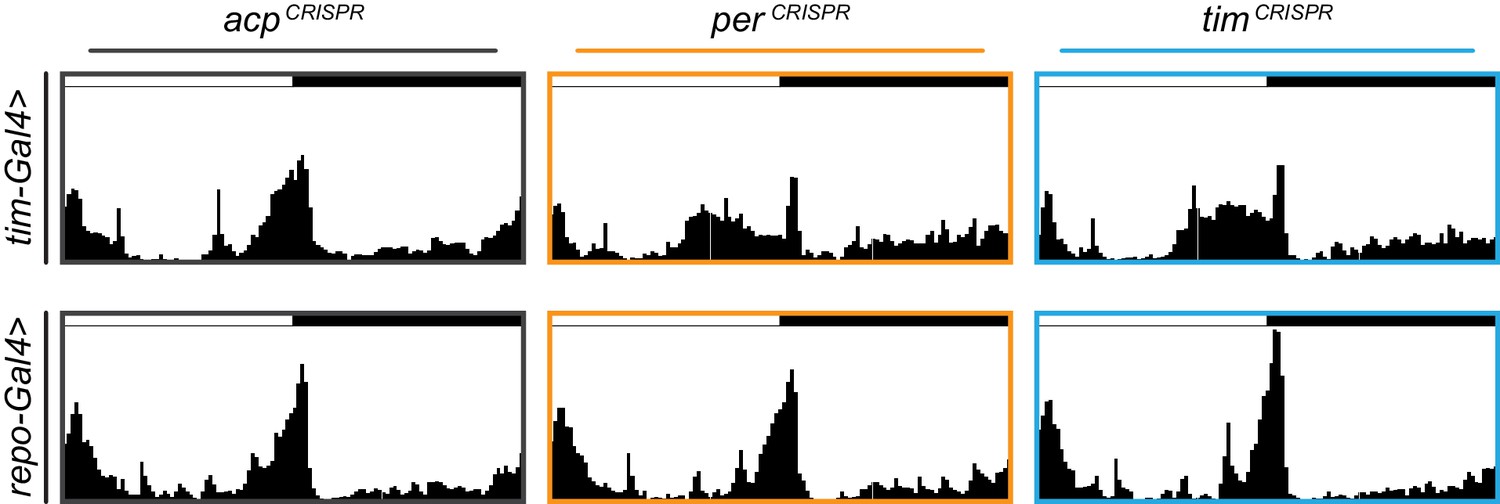
Average actograms for tim-Gal4 and repo-Gal4 targeted flies under 12 hr:12 hr light:dark conditions.
Average actograms for the first day in LD for (A) tim-Gal4 and (B) repo-Gal4 targeting of acp (gray), per (orange), or tim (blue).
Figure 2—figure supplement 3
Rhythmicity analysis of control flies.
(A) Average actograms showing the activity in constant darkness of flies with single copies of the CRISPR tool transgenes used in this study. None of the genotypes should have CRISPR-mediated gene disruption. Activity data are double-plotted, with seven days of activity displayed. Dark gray rectangles = subjective day, black rectangles = subjective night. (B) Presence of tim-Gal4 or CRISPR transgenes does not affect behavioral rhythmicity. (C) Scatter plot showing the period of rhythmic control flies. (D) χ2 peak height values (rhythm strength).
Figure 2—figure supplement 4
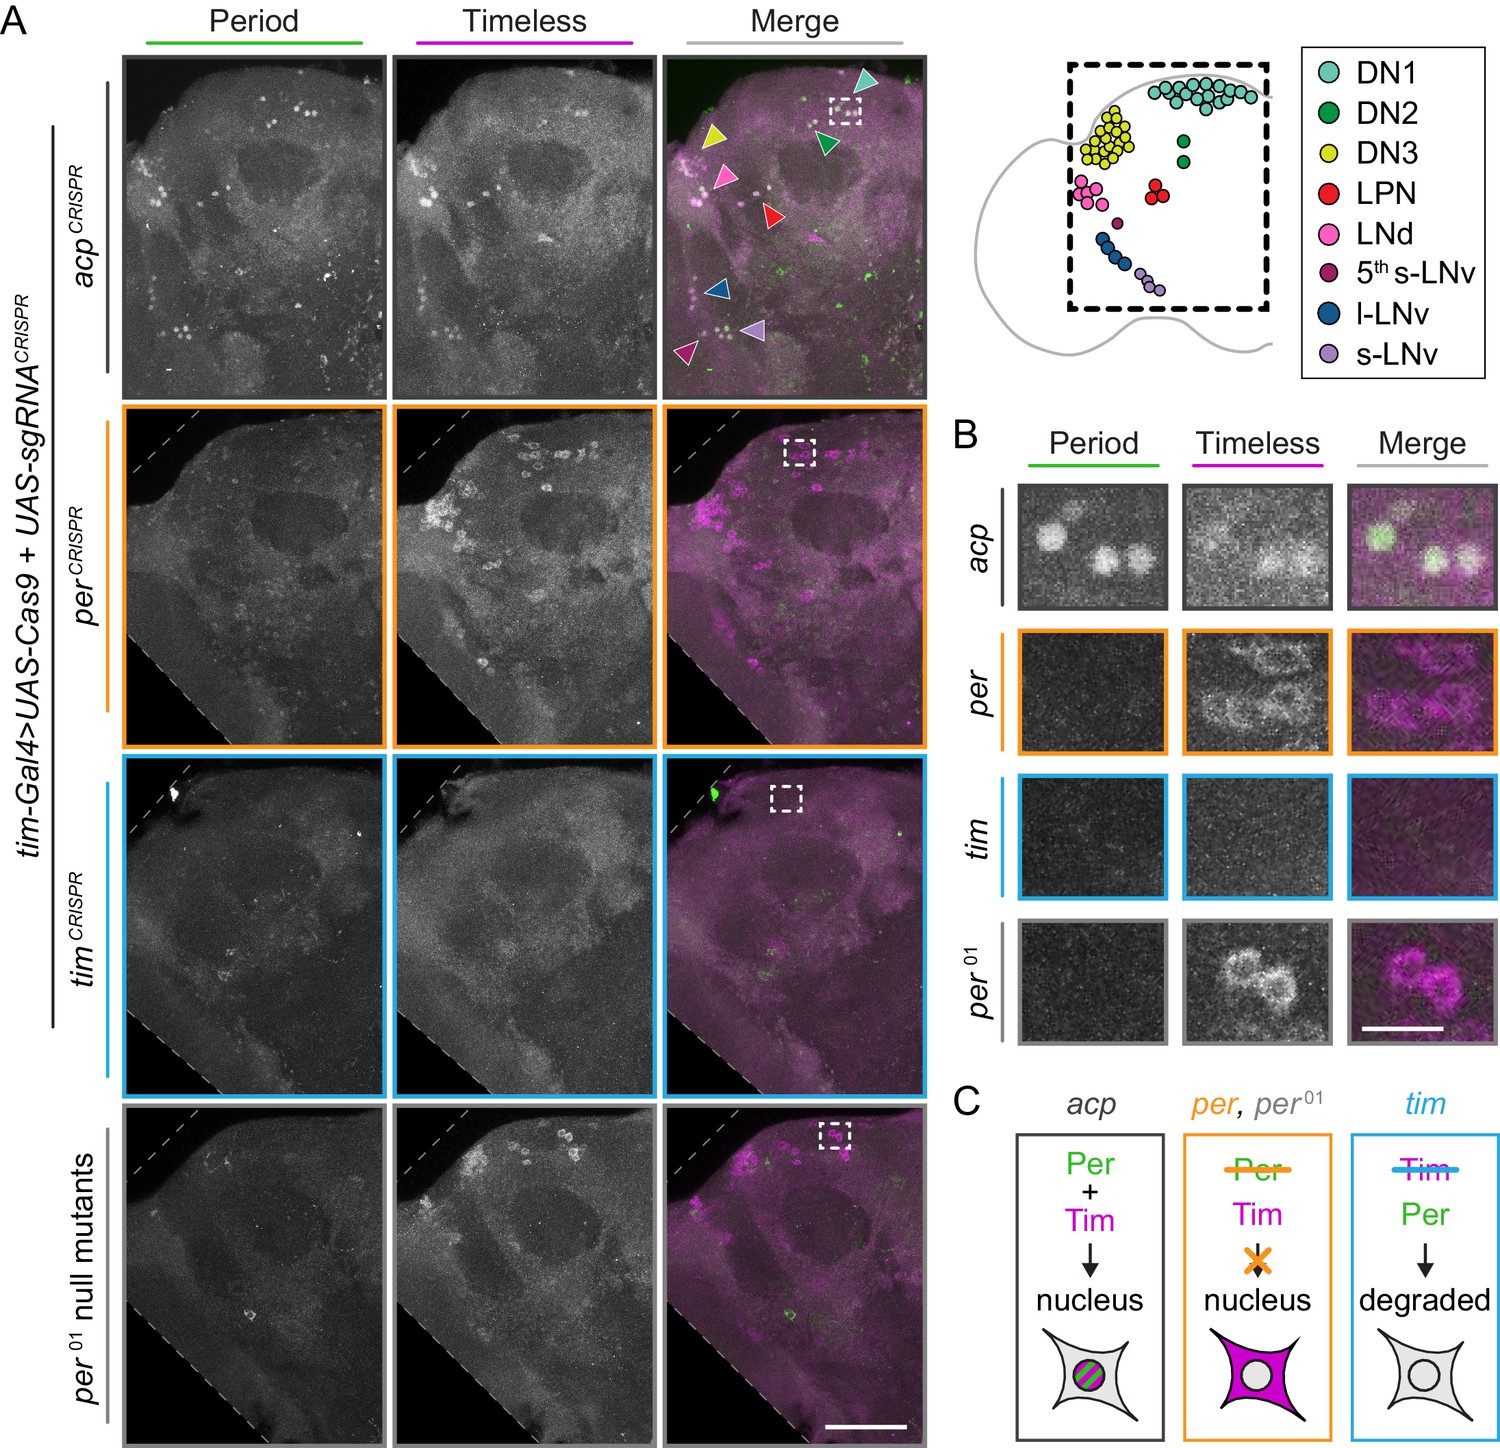
CRISPR-targeting of per or tim in Tim+ neurons leads to overall loss of Per and Tim protein.
(A) Maximum intensity projections of tim-Gal4>acpCRISPR, tim-Gal4>perCRISPR, tim-Gal4>timCRISPR, and per01 null brains at ZT0 with immunohistochemistry for Period (green) and Timeless (magenta) with schematic of clock neuron clusters; scale bar = 50 μm. (B) Higher magnification inset from boxed region in A; scale bar = 10 μm (C) Schematic showing expected staining pattern based on Per and Tim stability and requirements for nuclear entry.
Figure 2—figure supplement 5
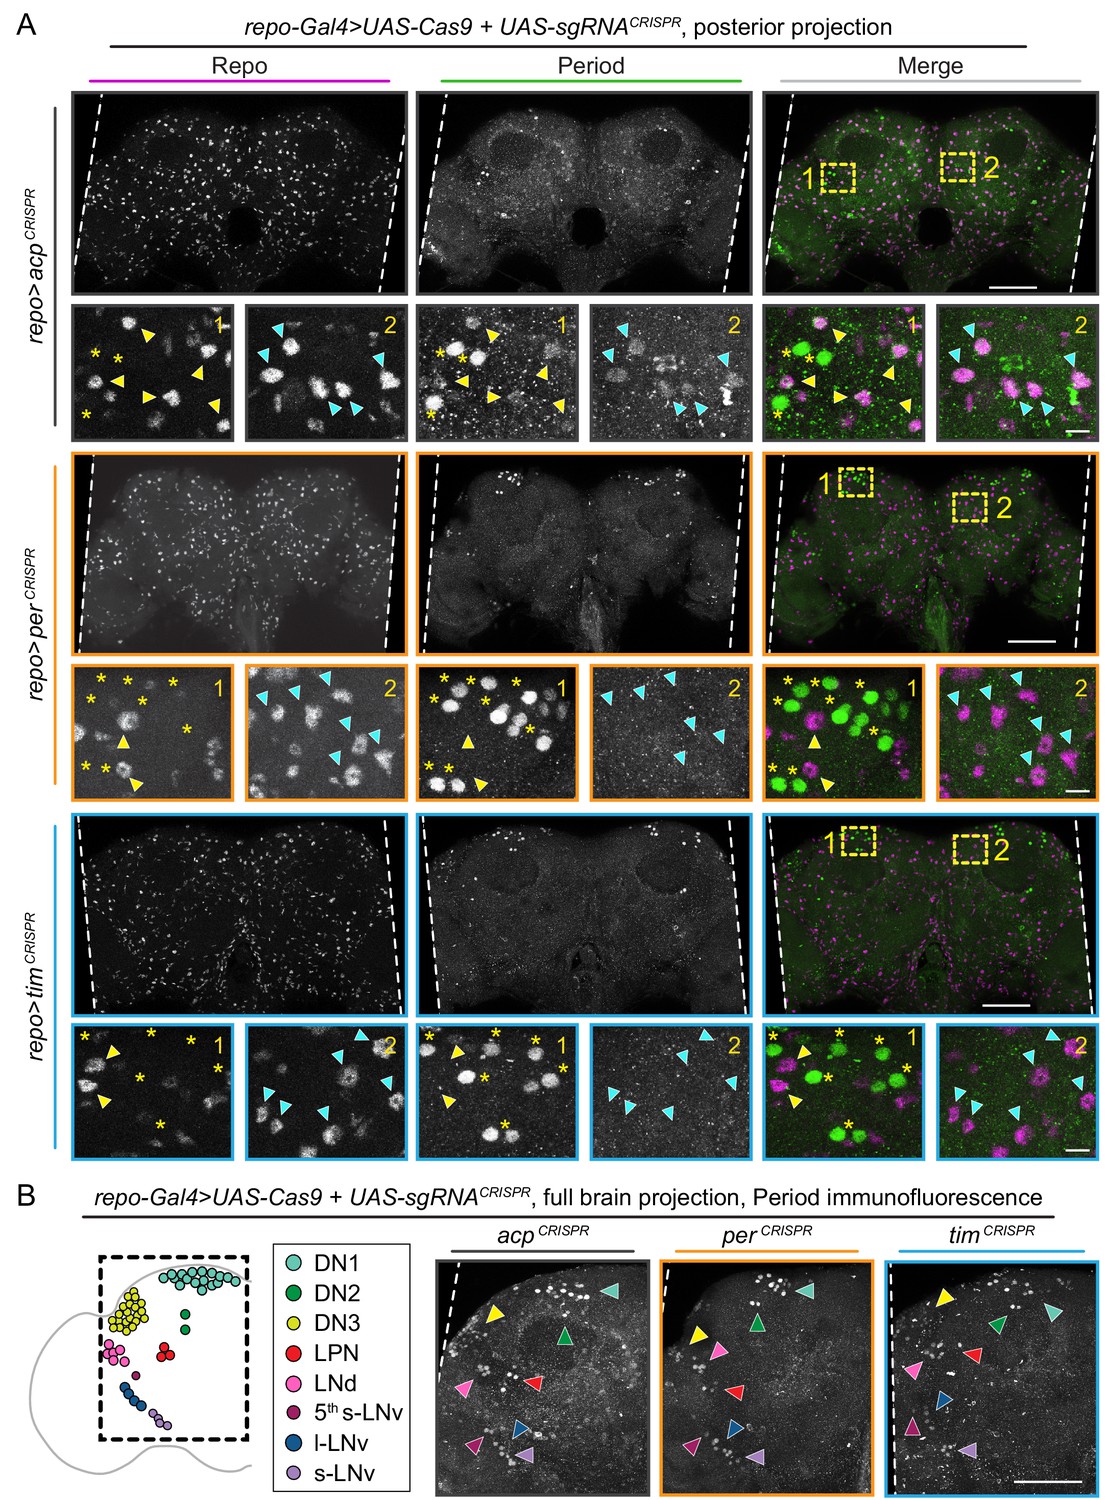
CRISPR-targeting of per or tim in Repo+ glia leads to overall loss of Per protein in glia but not neurons.
(A) 15 μm-thick (10 slices x 1.5 μm slice thickness) posterior maximum intensity projections of repo-Gal4>acpCRISPR, repo-Gal4>perCRISPR, and repo-Gal4>timCRISPR brains at ZT0 with immunohistochemistry for Repo (magenta) and Period (green); scale bar = 50 μm. Insets show high-magnification views of the same projections; scale bar = 5 μm. Arrowheads indicate Repo+ nuclei; asterisks indicate Repo- (likely neuronal) nuclei. (B) Schematic of clock neuron clusters (left) with full-thickness maximum intensity projections of samples shown in (A) with immunohistochemistry for Period (grayscale); scale bar = 50 μm.
Figure 3 with 4 supplements
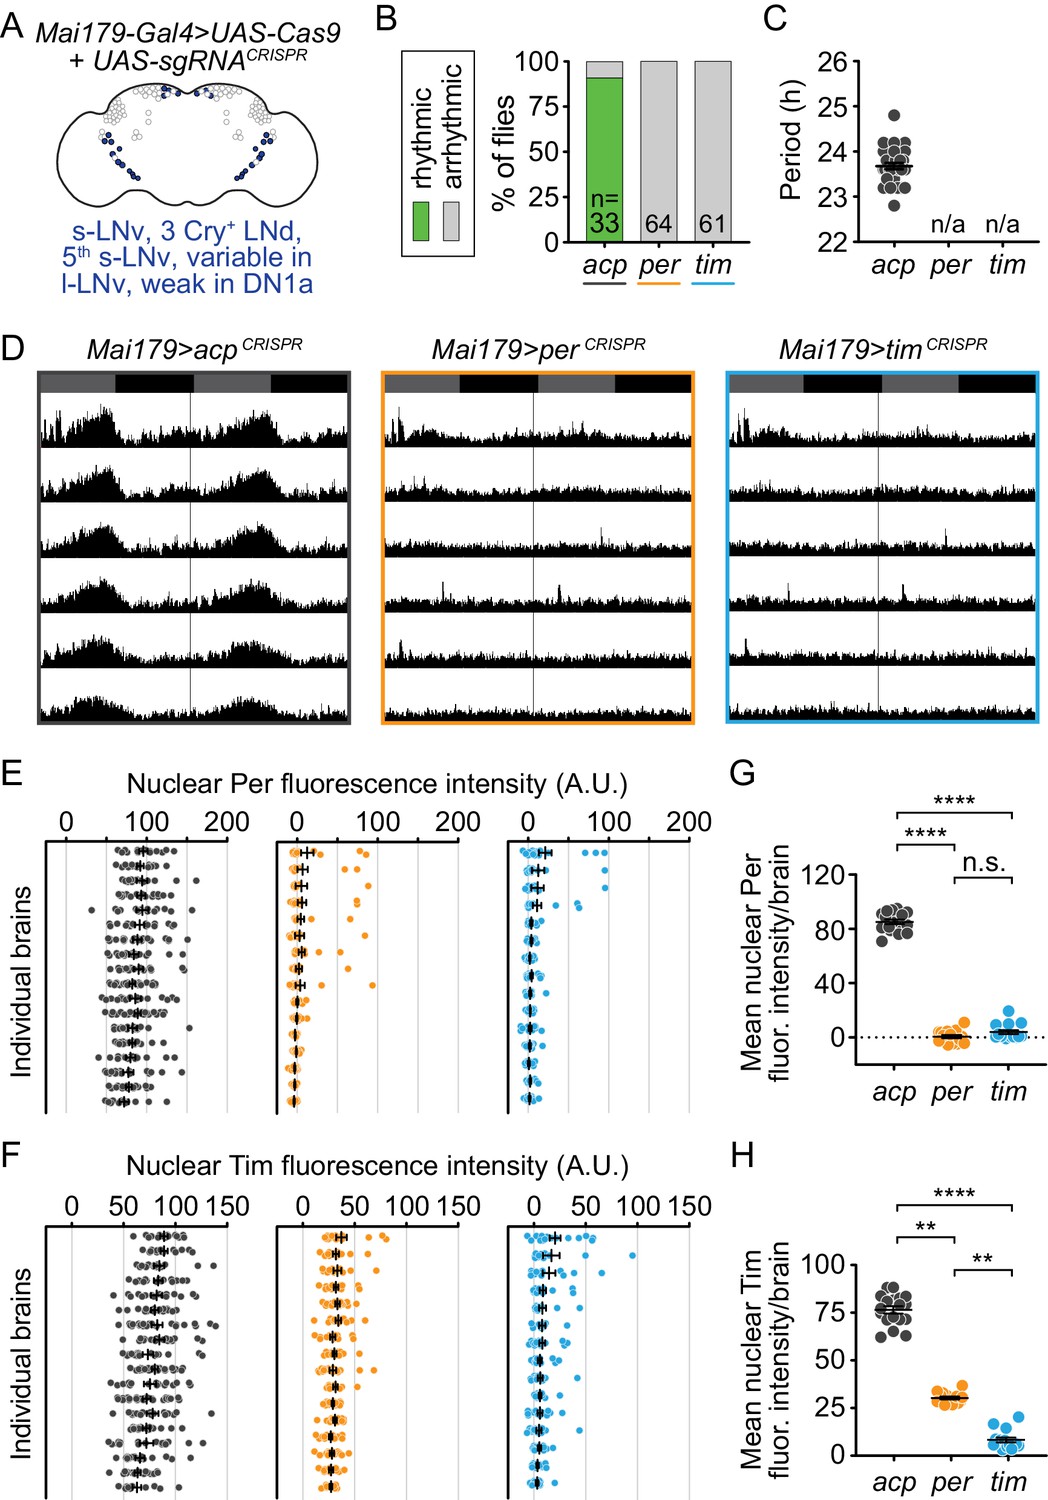
Cell-specific disruption of per or tim in Mai179+ neurons causes complete loss of behavioral rhythmicity and efficient loss of the targeted protein.
(A) Diagram of the circadian neuron subset marked by Mai179-Gal4. (B) Disruption of per or tim in Mai179+ neurons caused complete loss of behavioral rhythmicity. (C) Scatter plot showing the period of rhythmic flies with Mai179-Gal4-driven disruption of acp, per, or tim. (D) Average actograms showing the activity of flies in constant darkness with Mai179-Gal4-driven disruption of acp, per, or tim. Six days of activity are displayed, double-plotted. Dark gray rectangles = subjective day, black rectangles = subjective night. (E and F) Background-subtracted nuclear fluorescence intensity of Per (E) or Tim (F) at ZT0 in GFP+ neurons, grouped by brain with mean ± SEM shown. Individual brains are shown in the same order in both E and F. (G and H) Mean nuclear fluorescence intensity of Per (G) or Tim (H) at ZT0 in GFP+ neurons, averaged per brain (acp n = 18; per n = 16; tim n = 15). **: p<0.01; ****: p<0.0001; n.s.: not significant, p>0.05. Significance determined by Kruskal-Wallis nonparametric ANOVA (to account for non-normality of samples) followed by Dunn’s multiple comparisons test; reported p-values are multiplicity adjusted to account for multiple comparisons.
Figure 3—figure supplement 1
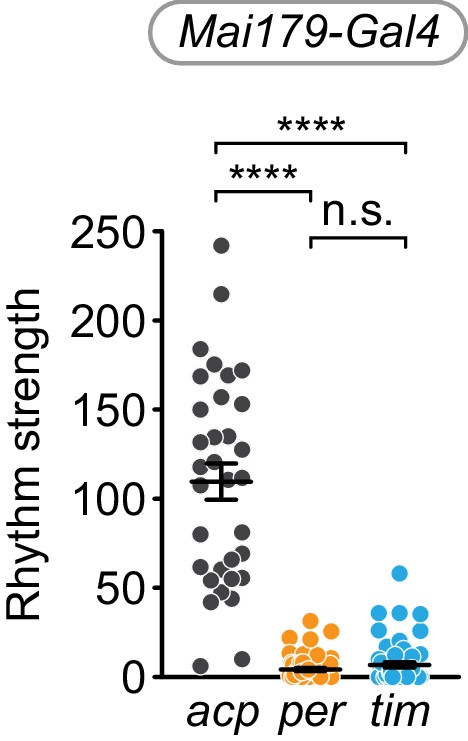
Cell-specific disruption of per or tim in Mai179+ cells causes loss of rhythm strength.
χ2 peak height values (rhythm strength) for Mai179-Gal4 targeting of acp (gray), per (orange), or tim (blue). Significance determined by Kruskal-Wallis nonparametric ANOVA (to account for non-normality of samples) followed by Dunn’s multiple comparisons test; reported p-values are multiplicity adjusted to account for multiple comparisons. ****: p<0.0001; n.s.: not significant, p>0.05.
Figure 3—figure supplement 2
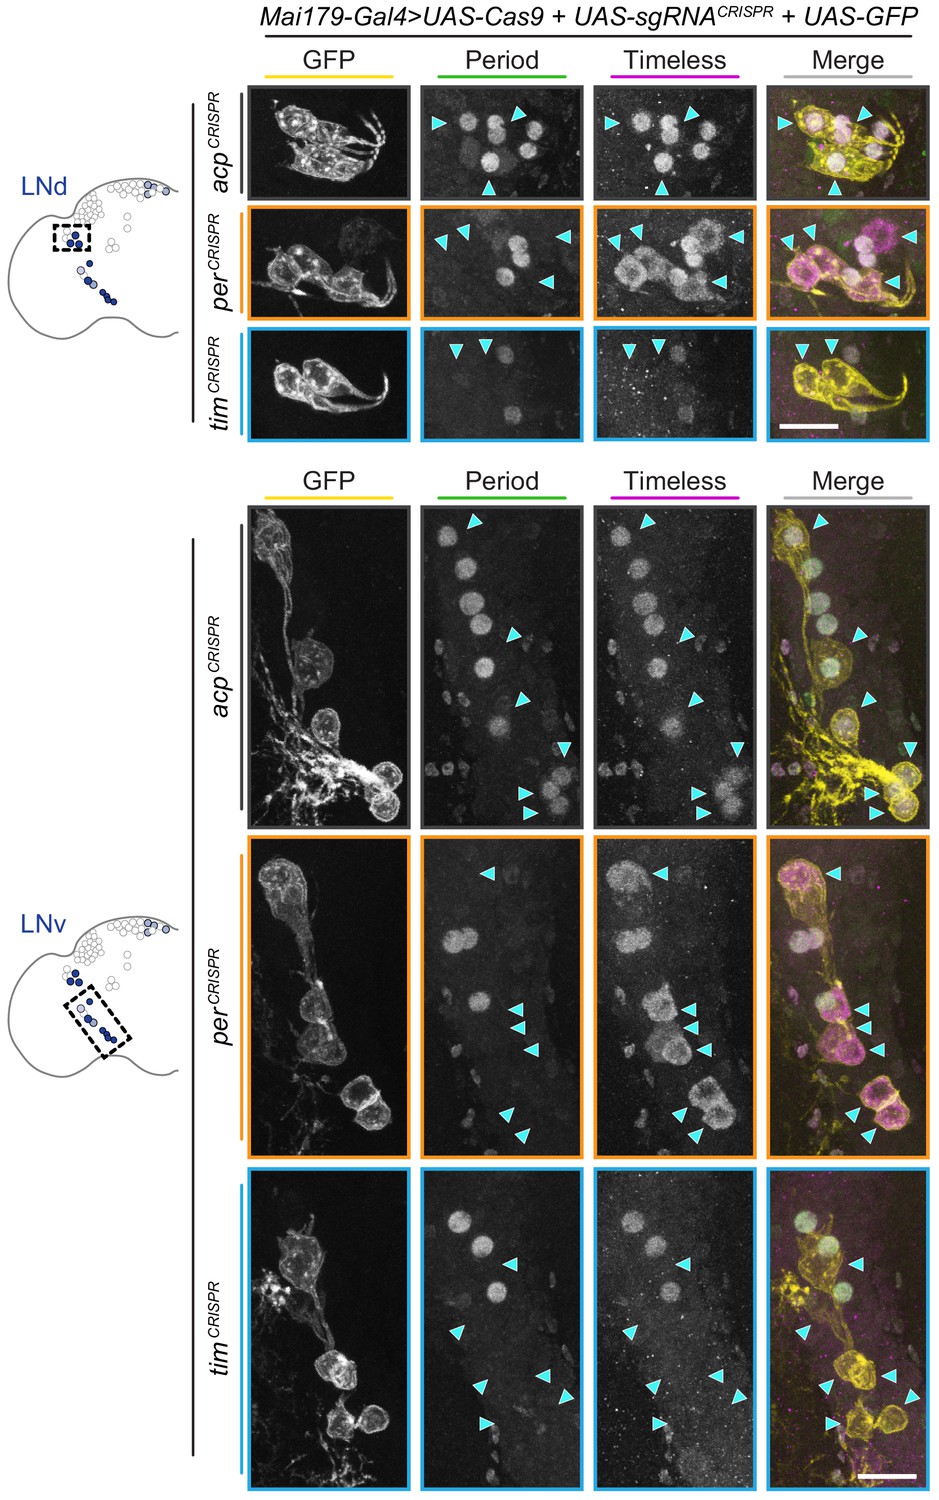
Period and Timeless immunohistochemistry in Mai179-Gal4-driven CRISPR flies.
Maximum intensity projections of Mai179-Gal4-driven GFP+ dorsal lateral (LNd, top) and ventral lateral (LNv, bottom) neurons with immunohistochemistry for GFP (yellow), Period (green) and Timeless (magenta); scale bar = 10 μm. Arrowheads indicate GFP+ (CRISPR-targeted) cells.
Figure 3—figure supplement 3
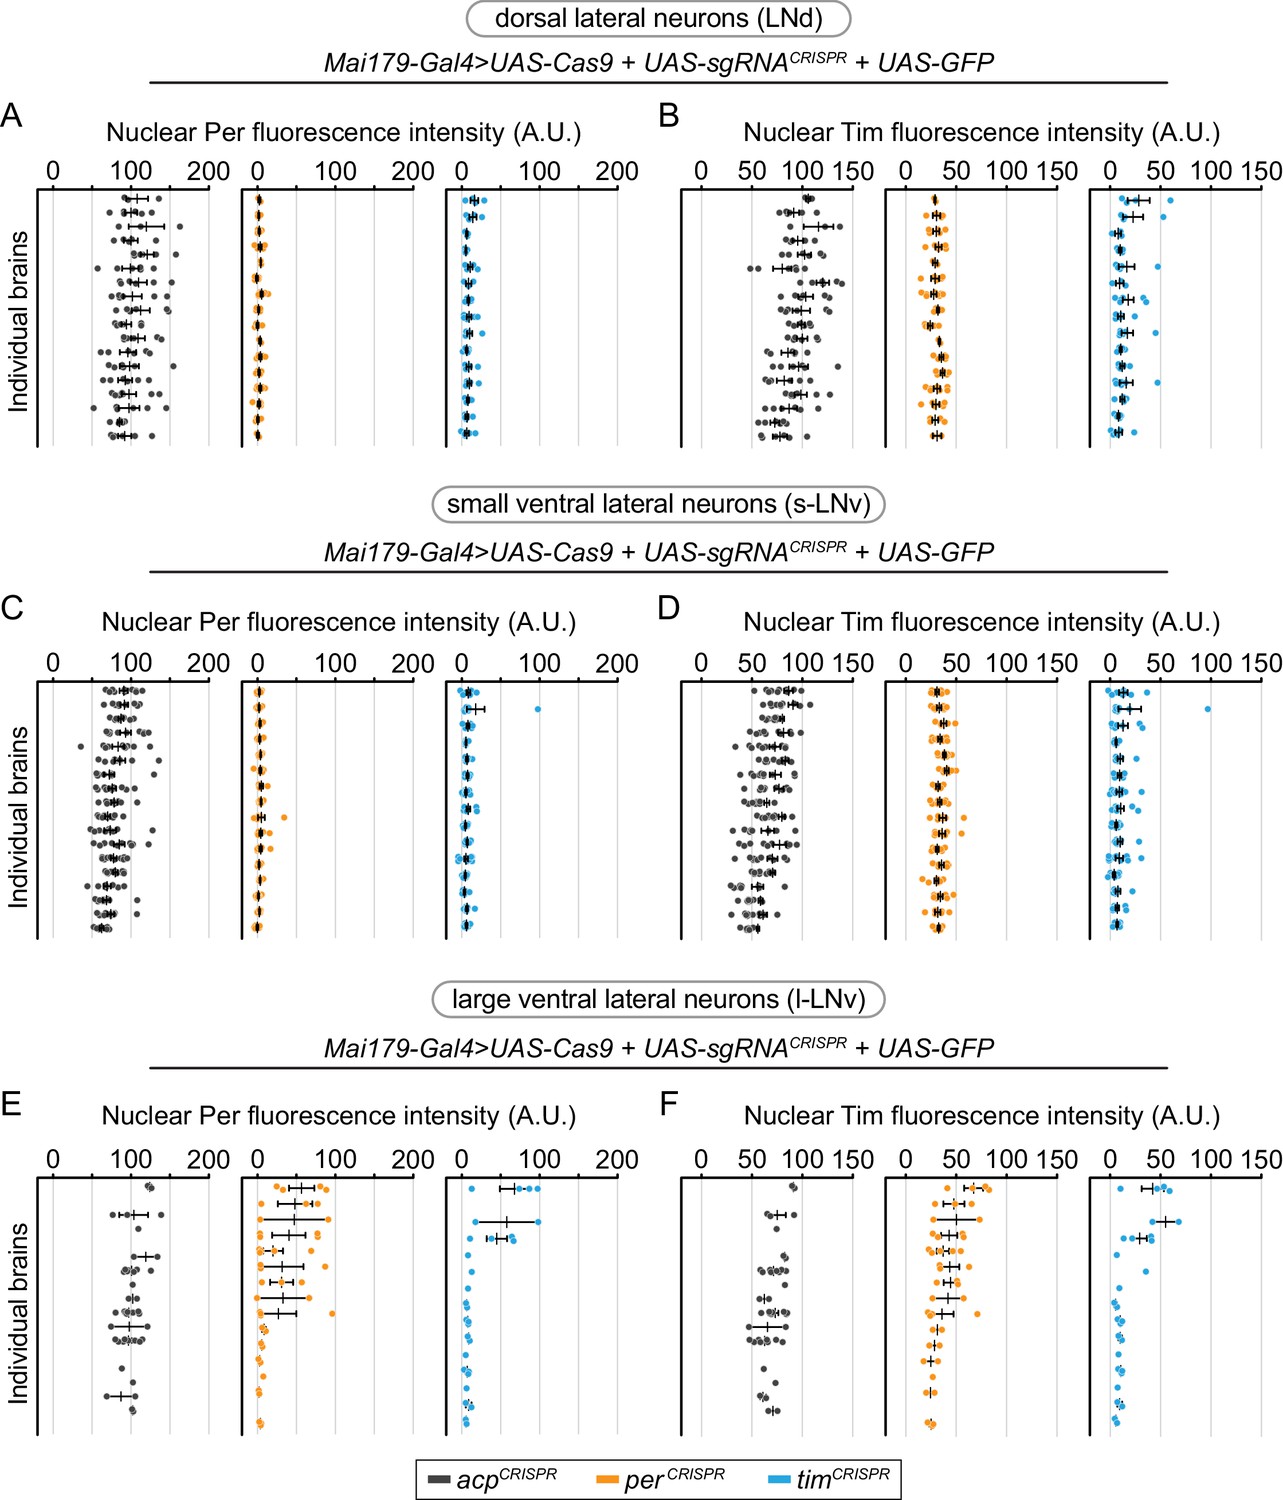
Cell-specific disruption of per or tim in Mai179+ neurons is most efficient in dorsal lateral (LNd) and small ventral lateral (s-LNv) neurons.
Background-subtracted nuclear fluorescence intensity of Per (A, C, E) or Tim (B, D, F) at ZT0 in GFP+ neurons, grouped by brain and separated by cell type (A, B: dorsal lateral neurons; C, D: small ventral lateral neurons; E, F: large ventral lateral neurons) with mean ± SEM shown. Individual brains are shown in the same order in all graphs (acp n = 18; per n = 16; tim n = 15 brains).
Figure 3—figure supplement 4
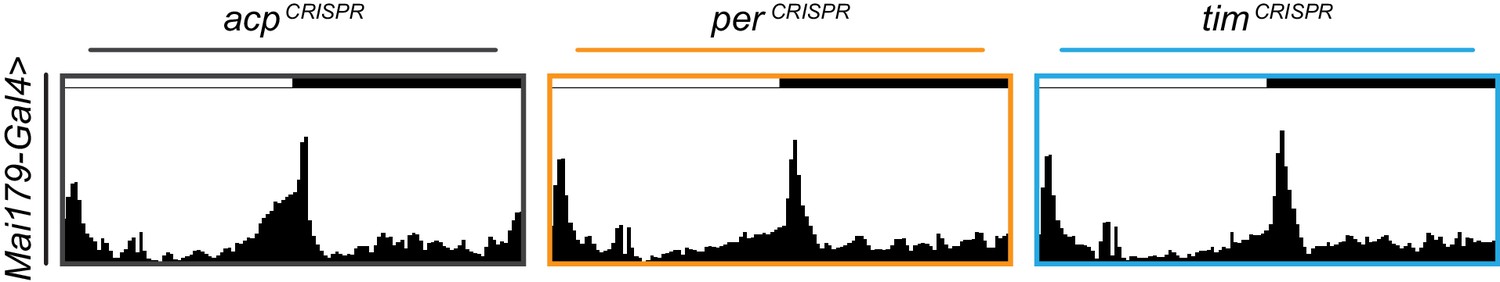
Average actograms for Mai179-Gal4 targeted flies under 12 hr:12 hr light:dark conditions.
Average actograms for the first day in LD for Mai179-Gal4 targeting of acp (gray), per (orange), or tim (blue).
Figure 4 with 4 supplements
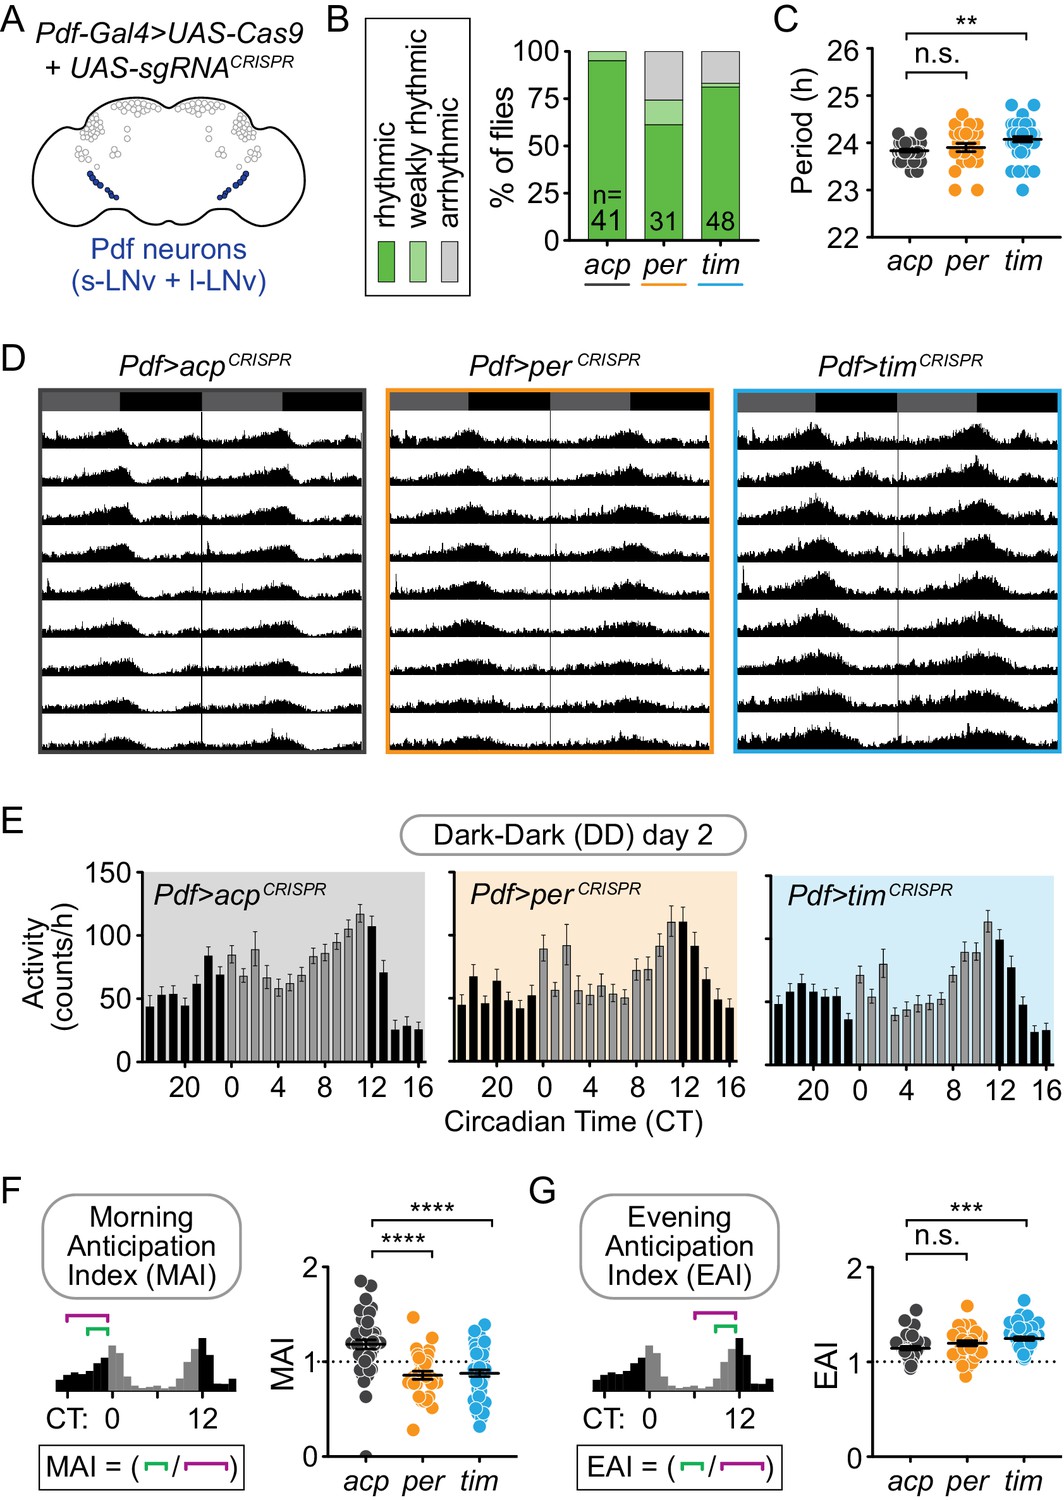
Cell-specific disruption of per or tim in Pdf+ neurons causes incomplete loss of behavioral rhythmicity and loss of morning anticipation in constant darkness.
(A) Diagram showing Pdf+ circadian neurons. (B) CRISPR-mediated disruption of per or tim in Pdf+ neurons using the Pdf-Gal4 driver caused incomplete loss of behavioral rhythmicity. (C) Scatter plot showing the period of rhythmic flies with Pdf-Gal4-driven disruption of acp, per, or tim. (D) Actograms showing average activity of flies in constant darkness with Pdf-Gal4-driven disruption of acp, per, or tim. Nine days of activity are displayed, double-plotted. Dark gray rectangles = subjective day, black rectangles = subjective night. (E) Average hourly activity counts during the second day of complete darkness (DD Day 2; gray bars = CT 0–11, black bars = CT 12–23). Mean number of beam breaks per hour is shown ± SEM. (F) Morning Anticipation Index (MAI) was calculated by dividing the average hourly activity for CT 21–23 by the average hourly activity for CT 18–23. (G) Evening Anticipation Index (EAI) was calculated by dividing the average hourly activity for CT 9–11 by the average hourly activity for CT 6–11. For scatter plots, each point represents an individual fly and mean ± SEM is shown; ***: p<0.001; ****: p<0.0001; n.s.: not significant, p>0.05. Significance determined by Kruskal-Wallis nonparametric ANOVA (to account for non-normality of samples) followed by Dunn’s multiple comparisons test; reported p-values are multiplicity adjusted to account for multiple comparisons.
Figure 4—figure supplement 1
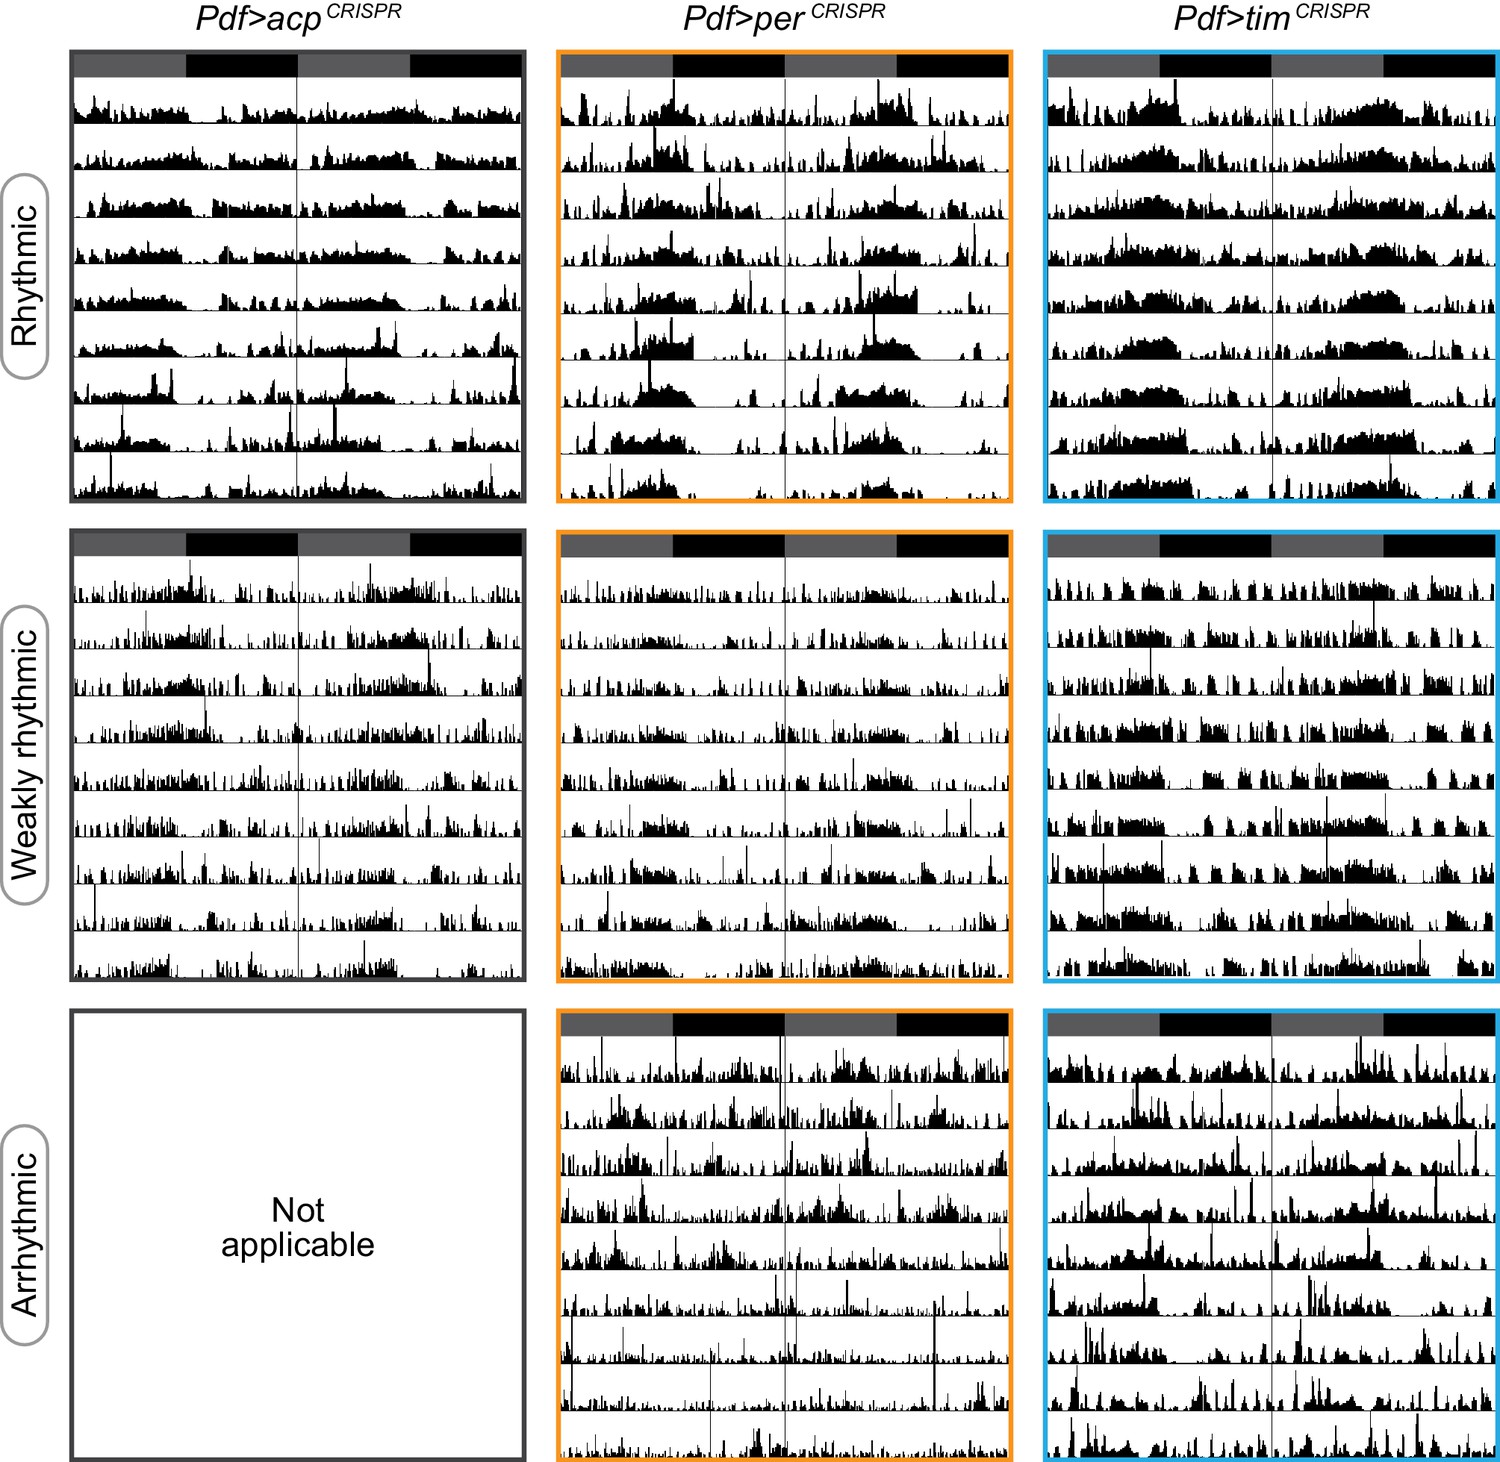
Representative actograms for each phenotypic class.
Representative single-fly actograms of Pdf-Gal4>acpCRISPR (gray), perCRISPR (orange), or timCRISPR (blue) flies blindly scored as rhythmic (top row), weakly rhythmic (middle row), or arrhythmic (bottom row; no Pdf-Gal4>acpCRISPR flies were scored as arrhythmic).
Figure 4—figure supplement 2
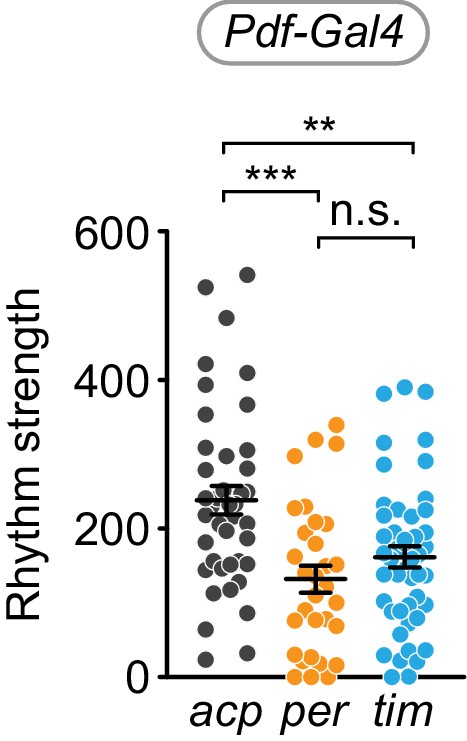
Cell-specific disruption of per or tim in Pdf+ cells causes reduction in rhythm strength.
χ2 peak height values (rhythm strength) for Pdf-Gal4 targeting of acp (gray), per (orange), or tim (blue). Significance determined by one-way ANOVA followed by Tukey’s multiple comparisons test; reported p-values are multiplicity adjusted to account for multiple comparisons. ***: p<0.001; **: p<0.01; n.s.: not significant, p>0.05.
Figure 4—figure supplement 3
Average actograms for Pdf-Gal4 targeted flies under 12 hr:12 hr light:dark conditions.
Average actograms for the first day in LD Pdf-Gal4 targeting of acp (gray), per (orange), or tim (blue).
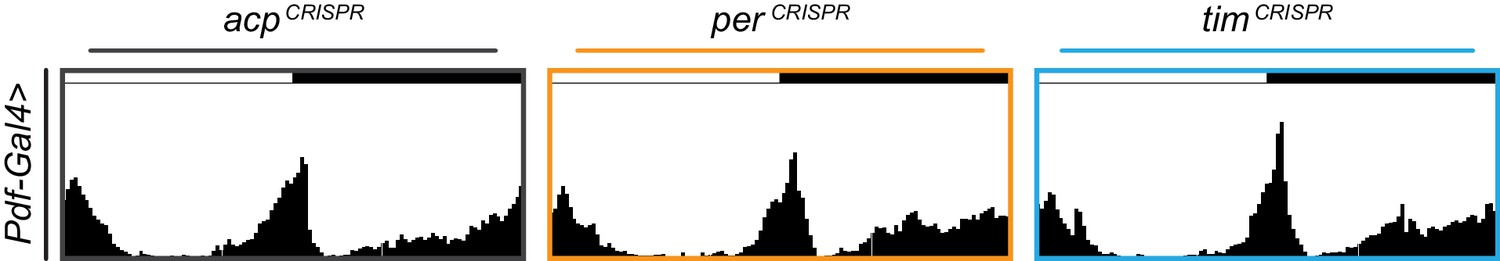
Figure 4—figure supplement 4
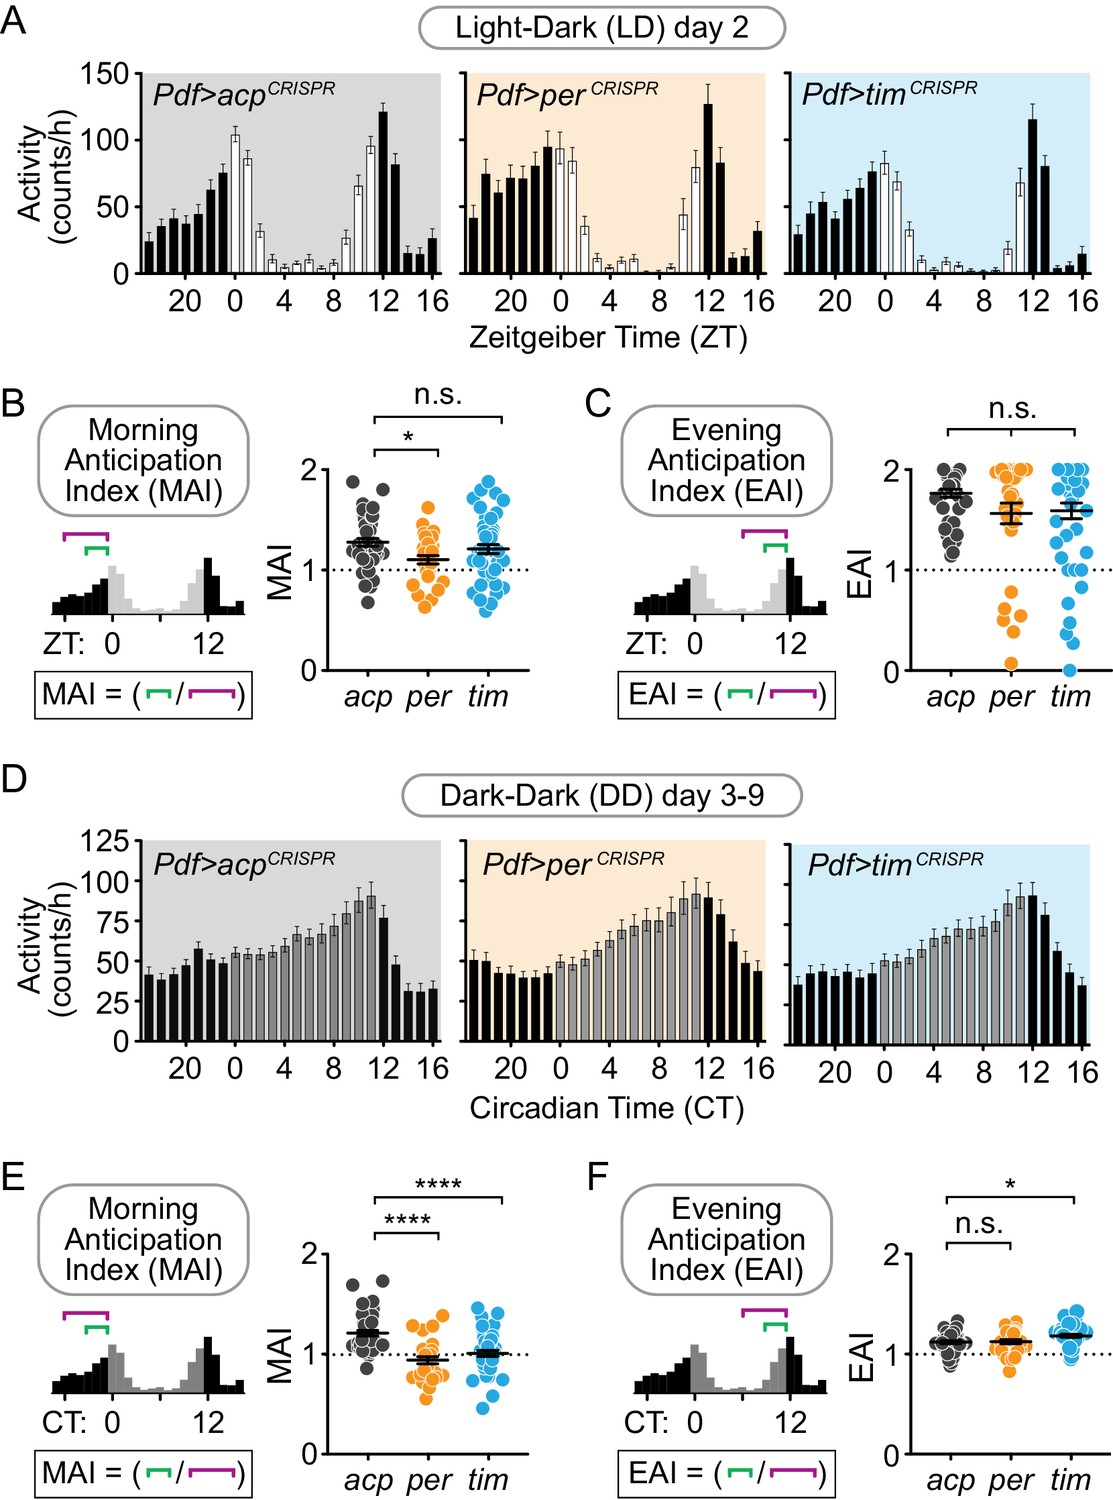
Cell-specific disruption of per or tim in Pdf+ neurons causes loss of the morning anticipatory peak under constant conditions.
(A and D) Average hourly activity counts for one day under a 12 hr:12 hr light-dark schedule (A; white bars = ZT 0–11, black bars = ZT 12–23) or averaged over days 3–9 of complete darkness (D; gray bars = CT 0–11, black bars = CT 12–23); mean number of beam breaks per hour is shown ± SEM. (B and E) Morning Anticipation Index (MAI) calculated by dividing the average hourly activity for ZT (B) or CT (E) 21–23 by the average hourly activity for ZT or CT 18–23. (acp n = 42; per n = 31; tim n = 48). (C and F) Evening Anticipation Index (EAI) calculated by dividing the average hourly activity for ZT (C) or CT (F) 9–11 by the average hourly activity for ZT or CT 6–11. For scatter plots, each point represents an individual fly and mean ± SEM is shown. Significance determined by one-way ANOVA followed by Tukey’s multiple comparisons test (for normally distributed samples; (B and F) or Kruskal-Wallis nonparametric ANOVA (to account for non-normality of samples; (C and E) followed by Dunn’s multiple comparisons test; reported p-values are multiplicity adjusted to account for multiple comparisons. *: p<0.05; ****: p<0.0001; n.s.: not significant, p>0.05.
Figure 5 with 1 supplement
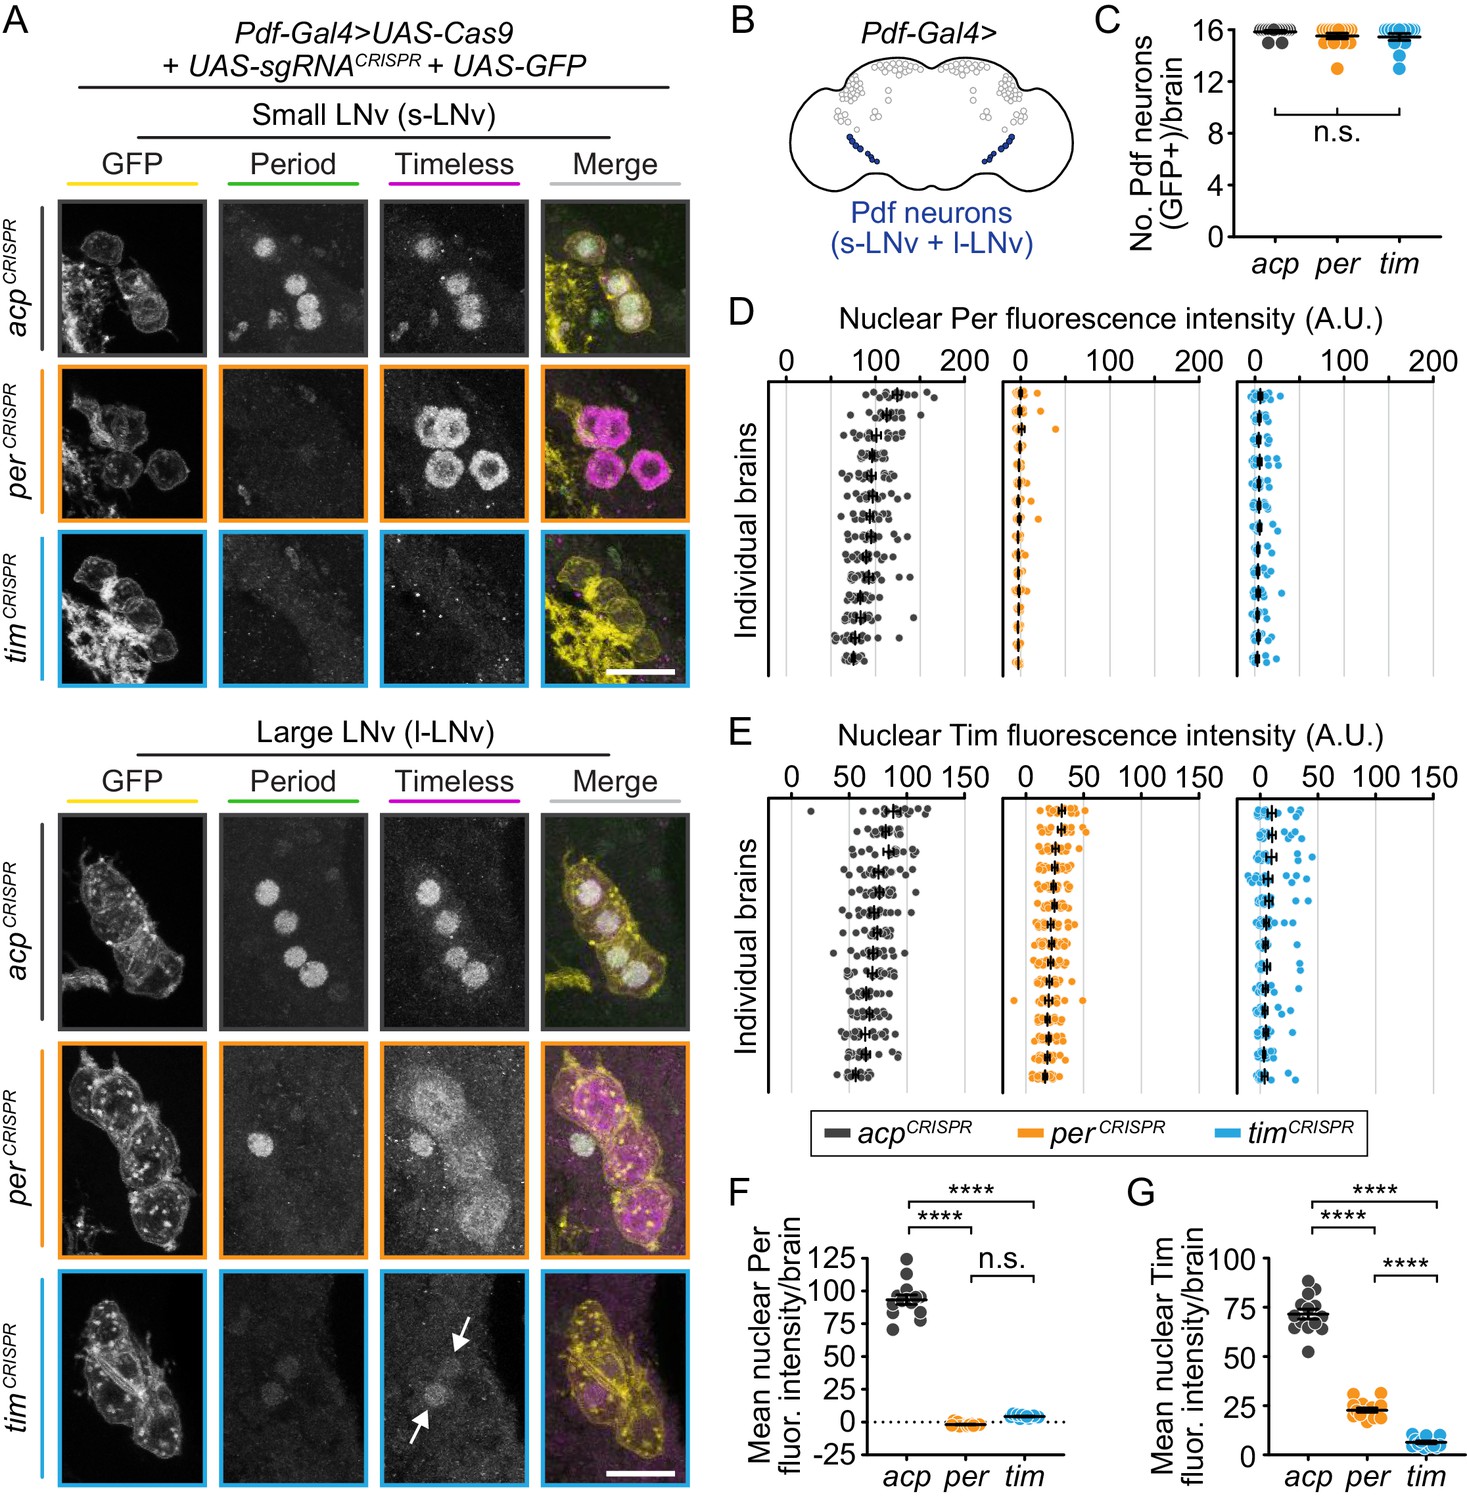
CRISPR-mediated disruption of per or tim in Pdf+ neurons leads to efficient loss of the targeted protein.
(A) Maximum intensity projections of Pdf-Gal4-driven GFP+ small and large ventral lateral neurons (s- and l-LNv) with immunohistochemistry for GFP (yellow), Period (green) and Timeless (magenta) at ZT0. Scale bar = 10 μm; arrows indicate CRISPR-targeted nuclei with residual protein signal. (B) Diagram showing Pdf-Gal4 expression in the 4 large and four small ventral lateral neurons (l- and s-LNv), bilaterally. (C) Quantification of the number of GFP+ neurons per brain (acp n = 14; per n = 15; tim n = 13 brains). (D and E) Background-subtracted nuclear fluorescence intensity of Per (D) or Tim (E) at ZT0 in GFP+ neurons, grouped by brain with mean ± SEM shown. (F and G) Mean nuclear fluorescence intensity of Per (G) or Tim (H) at ZT0 in GFP+ neurons, averaged per brain (acp n = 14; per n = 16; tim n = 14 brains). ****: p<0.0001; n.s.: not significant, p>0.05. Significance was determined by one-way ANOVA followed by Tukey’s multiple comparisons test; reported p-values are multiplicity adjusted to account for multiple comparisons.
Figure 5—figure supplement 1
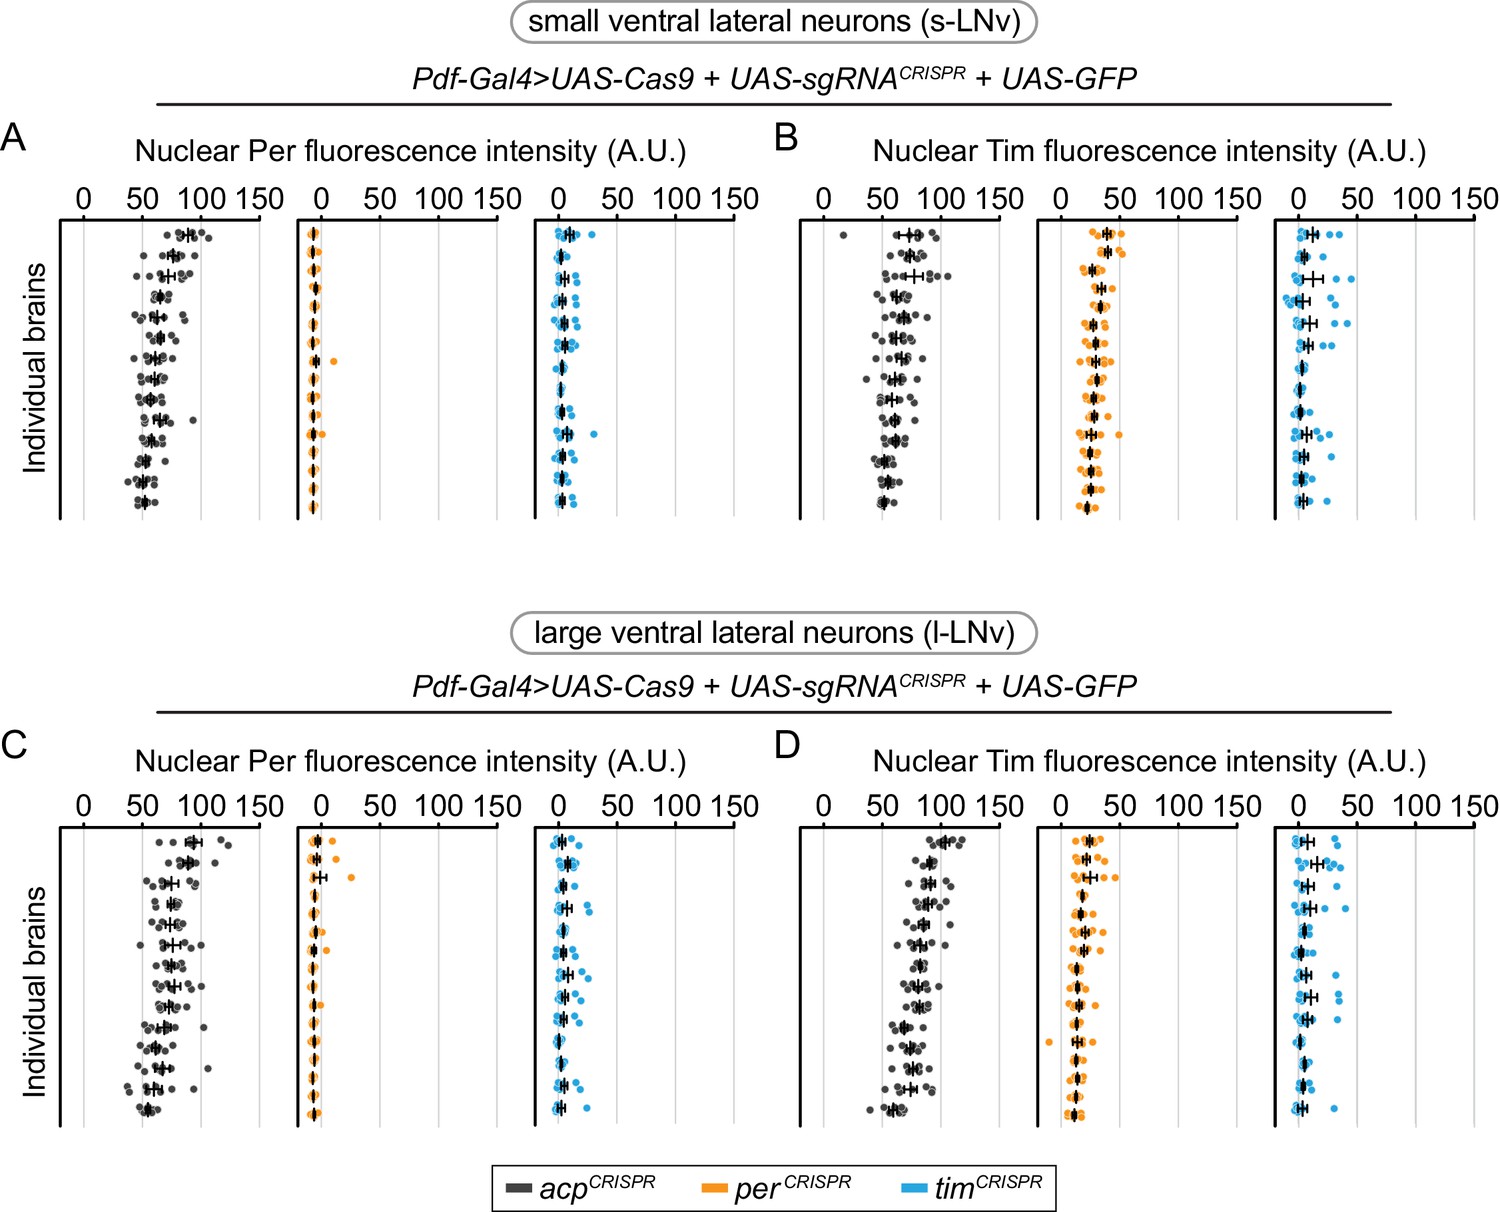
Cell-specific disruption of per or tim in Pdf+ neurons has similar efficiency in small ventral lateral (s-LNv) and large ventral lateral (l-LNv) neurons.
Background-subtracted nuclear fluorescence intensity of Per (A, C) or Tim (B, D) at ZT0 in GFP+ neurons, grouped by brain and separated by cell type (A, B: small ventral lateral neurons; C, D: large ventral lateral neurons) with mean ± SEM shown. Individual brains are shown in the same order in all graphs (acp n = 14; per n = 16; tim n = 14 brains).
Figure 6 with 4 supplements

Cell-specific disruption of per or tim in Mai179+Pdf – neurons does not affect behavioral rhythmicity.
(A) Diagram showing circadian neurons targeted using Mai179-Gal4; Pdf-Gal80. (B) CRISPR-mediated disruption of per or tim in Mai179+Pdf– neurons did not affect overall rhythmicity. (C) Scatter plot showing the period of rhythmic flies with Mai179-Gal4; Pdf-Gal80-driven disruption of acp, per, or tim. (D) Average actograms showing the activity of flies in constant darkness with Mai179-Gal4; Pdf-Gal80-driven disruption of acp, per, or tim. Six days of activity are displayed, double-plotted. Dark gray rectangles = subjective day, black rectangles = subjective night. (E and F) Background-subtracted nuclear fluorescence intensity of Per at ZT0 in (E) RFP+ LNds (magenta) and the 5th s-LNv (light green) and (F) PDF+ s- (purple) and l-LNv neurons (dark green), grouped by brain with mean ± SEM shown (acp n = 10; per n = 9; tim n = 10). *: p<0.05; n.s.: not significant, p>0.05. Significance was determined by one-way ANOVA followed by Tukey’s multiple comparisons test; reported p-values are multiplicity adjusted to account for multiple comparisons.
Figure 6—figure supplement 1
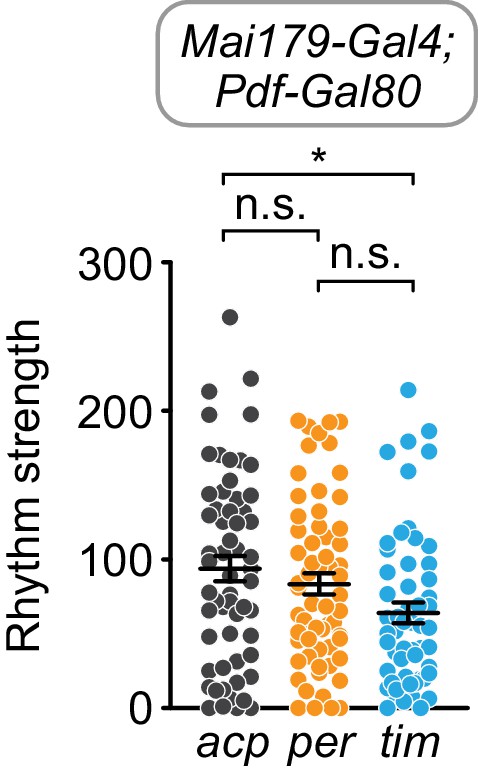
Cell-specific disruption of tim, but not per, in Mai179+Pdf- cells causes a slight reduction in rhythm strength.
χ2 peak height values (rhythm strength) for Mai179-Gal4; Pdf-Gal80 targeting of acp (gray), per (orange), or tim (blue). Significance determined by Kruskal-Wallis nonparametric ANOVA (to account for non-normality of samples) followed by Dunn’s multiple comparisons test; reported p-values are multiplicity adjusted to account for multiple comparisons. *: p<0.05; n.s.: not significant, p>0.05.
Figure 6—figure supplement 2
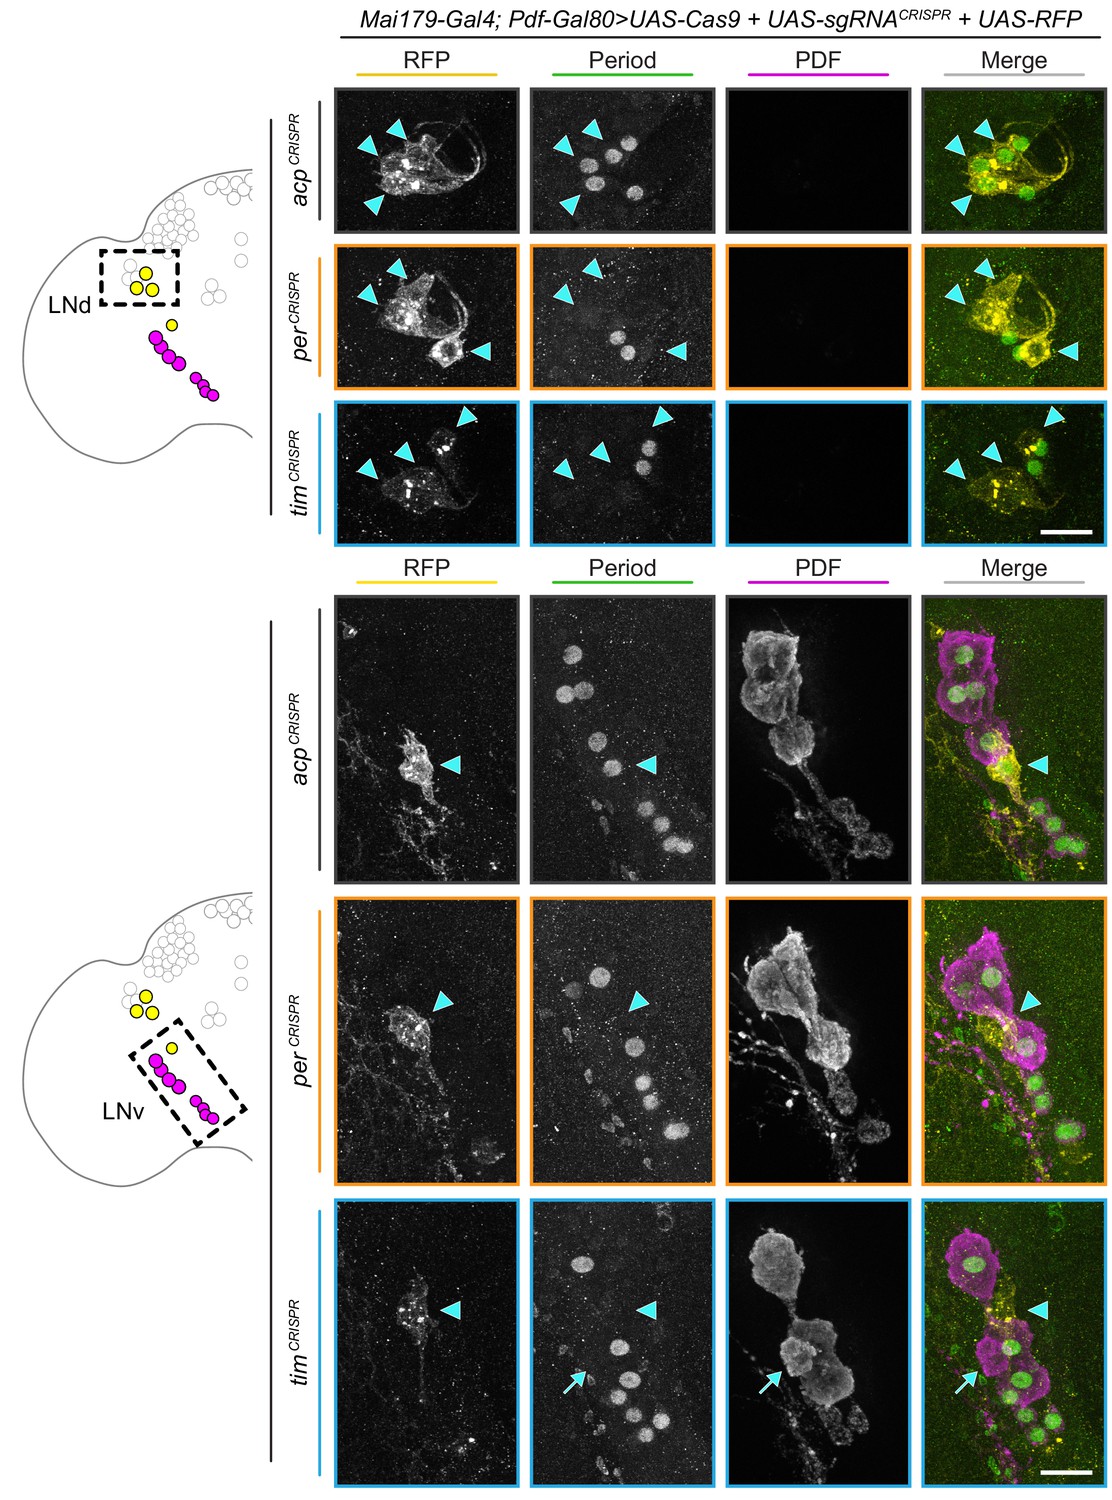
Mai179-Gal4; Pdf-Gal80-driven CRISPR-targeting protects PDF+ cells from gene disruption.
Maximum intensity projections of Mai179-Gal4; Pdf-Gal80-driven RFP+ dorsal lateral (LNd, bottom) and ventral lateral (s-LNv, 5th s-LNv, l-LNv; bottom) neurons with immunohistochemistry for RFP (yellow), Period (green) and PDF (magenta); scale bar = 10 μm. Arrowheads indicate RFP+ (CRISPR-targeted) cells; arrow indicates rare PDF+ cell that has escaped Pdf-Gal80 protection and undergone CRISPR-mediated gene disruption.
Figure 6—figure supplement 3
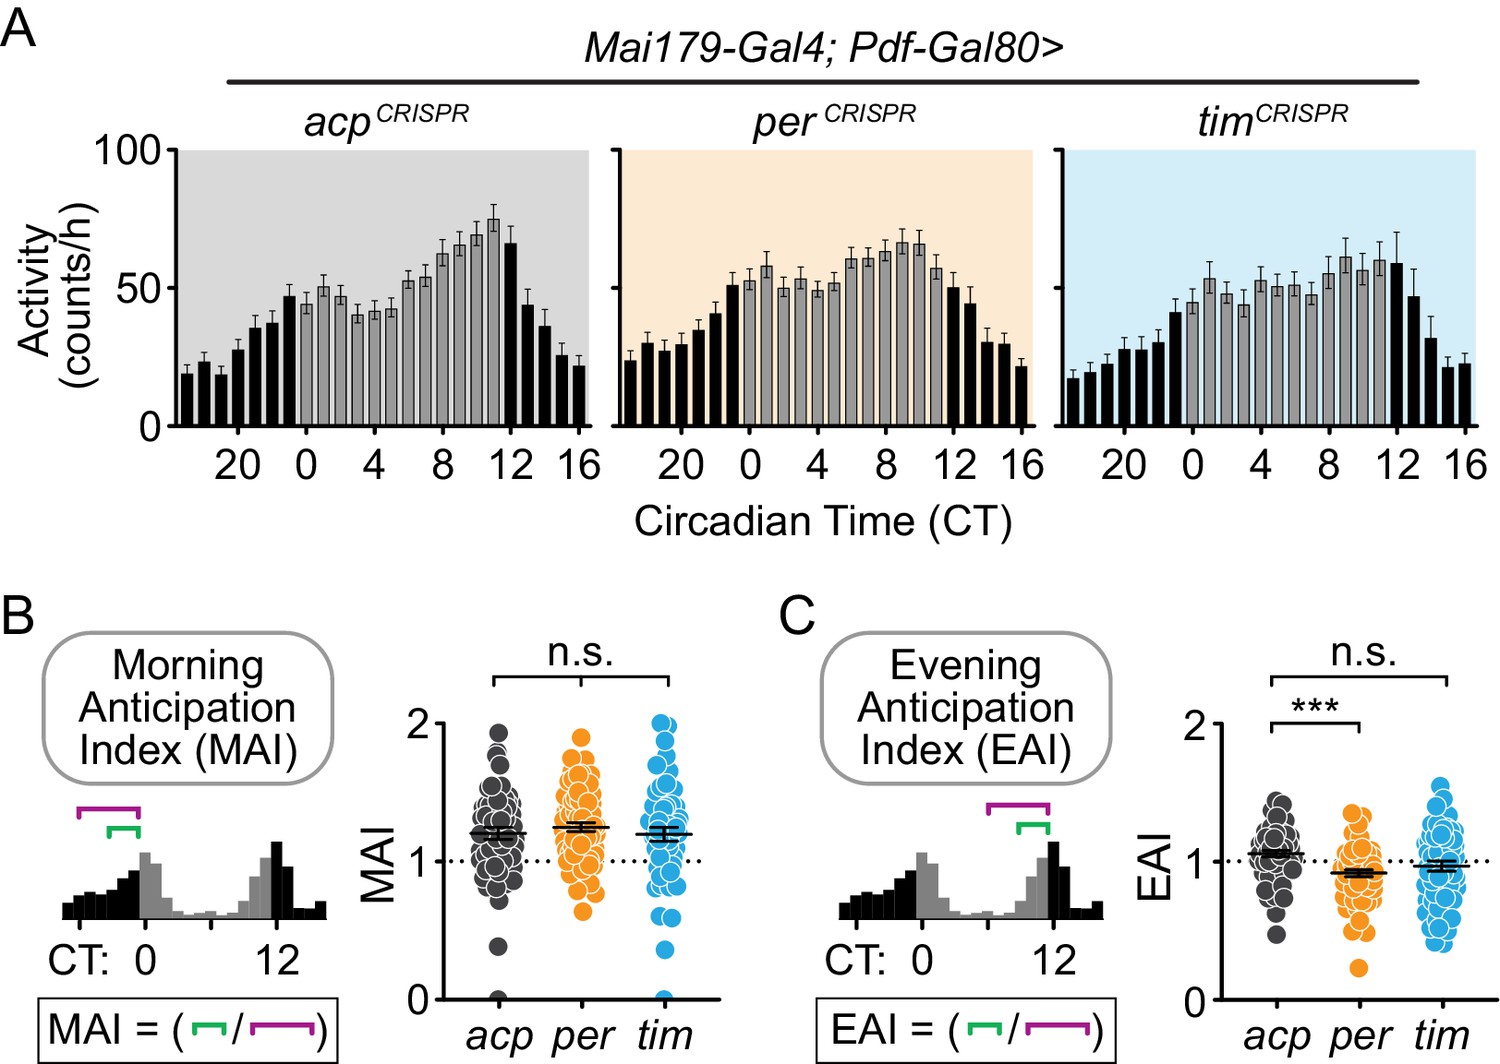
Cell-specific disruption of per in Mai179+Pdf – neurons causes loss of the evening anticipatory peak under constant conditions.
(A) Average hourly activity counts during the second day of complete darkness (DD Day 2; gray bars = CT 0–11, black bars = CT 12–23). Mean number of beam breaks per hour is shown ± SEM. (acp n = 58; per n = 63; tim n = 55) (B) Morning Anticipation Index (MAI) was calculated by dividing the average hourly activity for CT 21–23 by the average hourly activity for CT 18–23. (C) Evening Anticipation Index (EAI) calculated by dividing the average hourly activity for CT 9–11 by the average hourly activity for CT 6–11. For scatter plots, each point represents an individual fly and mean ± SEM is shown. Significance determined by Kruskal-Wallis nonparametric ANOVA (to account for non-normality of samples) followed by Dunn’s multiple comparisons test; reported p-values are multiplicity adjusted to account for multiple comparisons. ***: p<0.001; n.s.: not significant, p>0.05.
Figure 6—figure supplement 4
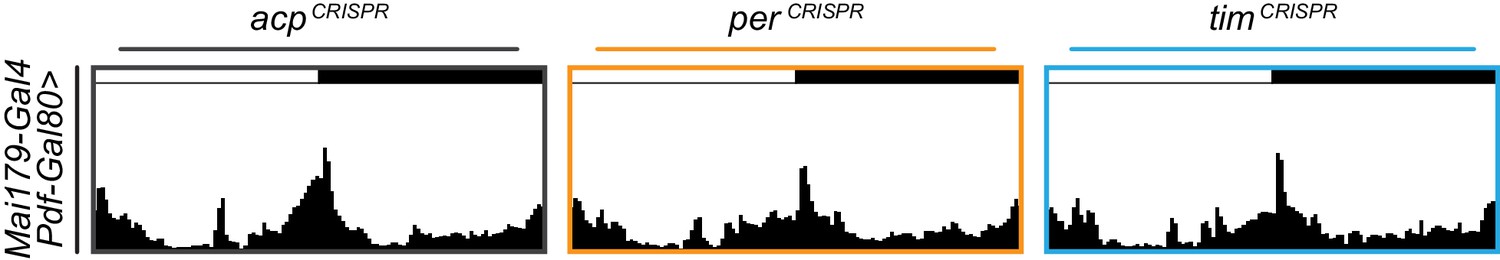
Average actograms for Mai179-Gal4; Pdf-Gal80 targeted flies under 12 hr:12 hr light:dark conditions.
Average actograms for the first day in LD for Mai179-Gal4; Pdf-Gal80 targeting of acp (gray), per (orange), or tim (blue).
Tables
Key resources table
| Reagent type (species) or resource | Designation | Source or reference | Identifiers | Additional information |
|---|---|---|---|---|
| Genetic reagent (D. melanogaster) | per01 | other | FLYB:FBal0013649 | Obtained from Jaga Giebultowicz |
| Genetic reagent (D. melanogaster) | UAS-sgRNA-acp98AB4x | this paper | Available upon request, will be deposited at BDSC | |
| Genetic reagent (D. melanogaster) | UAS-sgRNA-per4x | this paper | Available upon request, will be deposited at BDSC | |
| Genetic reagent (D. melanogaster) | UAS-sgRNA-tim3x | this paper | Available upon request, will be deposited at BDSC | |
| Genetic reagent (D. melanogaster) | UAS-Cas9.2 | Bloomington Drosophila Stock Center | BDSC:58986 FLYB:FBti0166500 | |
| Genetic reagent (D. melanogaster) | UAS-myr-GFP | Bloomington Drosophila Stock Center | BDSC:32198 FLYB:FBti0131964 | |
| Genetic reagent (D. melanogaster) | UAS-myr-GFP | Bloomington Drosophila Stock Center | BDSC:32197 FLYB:FBti0131941 | |
| Genetic reagent (D. melanogaster) | tim-Gal4 | Bloomington Drosophila Stock Center | BDSC:7126 FLYB:FBti0017922 | |
| Genetic reagent (D. melanogaster) | repo-Gal4 | Bloomington Drosophila Stock Center | BDSC:7415 FLYB:FBti0018692 | |
| Genetic reagent (D. melanogaster) | Mai179-Gal4 | other | FLYB:FBti0017959 | Obtained from Charlotte Helfrich-Förster |
| Genetic reagent (D. melanogaster) | Pdf-Gal4 | Bloomington Drosophila Stock Center | BDSC:6900 | |
| Genetic reagent (D. melanogaster) | Pdf-Gal80 | other | FLYB:FBtp0019042 | Obtained from Michael Rosbash |
| Recombinant DNA reagent | pCFD6 | Addgene | Cat#73915 | |
| Software, algorithm | Clocklab | Actimetrics | ||
| Software, algorithm | FIJI | PMID: 22743772 | Open source program | |
| Software, algorithm | Prism 8 | GraphPad | ||
| Antibody | Polyclonal Chicken anti-GFP | Abcam | Cat#ab13970 | (1:1000) |
| Antibody | Polyclonal Rabbit anti-Per | PMID: 1613555 | (1:1000) Obtained from Michael Rosbash | |
| Antibody | Polyclonal Rat anti-Tim | PMID: 8625406 | (1:1000) Obtained from Amtia Sehgal and Michael Young | |
| Antibody | Polyclonal Chicken anti-RFP | Rockland Immunochemicals | Cat#600-901-379 | (1:200) |
| Antibody | Monoclonal Mouse anti-PDF | Developmental Studies Hybridoma Bank PMID: 15930393 | Cat#PDF C7 | (1:10) |
| Antibody | Monoclonal Mouse anti-Repo | Developmental Studies Hybridoma Bank PMID: 12167411 | Cat#8D12 anti-Repo | (1:20) |
| Antibody | AlexaFluor 488-conjugated Donkey anti-Chicken | Jackson Immunoresearch | Cat#703-545-155 | (1:200) |
| Antibody | AlexaFluor 594-conjugated Donkey anti-Rabbit | Jackson Immunoresearch | Cat#711-585-152 | (1:200) |
| Antibody | AlexaFluor 647-conjugated Donkey anti-Rat | Jackson Immunoresearch | Cat#712-605-153 | (1:200) |
| Antibody | Cy3-conjugated Donkey anti-Chicken | Jackson Immunoresearch | Cat#703-165-155 | (1:200) |
| Antibody | AlexaFluor 647-conjugated Donkey anti-Mouse | Jackson Immunoresearch | Cat#715-605-151 | (1:200) |
| Sequence-based reagent | clock-fwd | This paper | qPCR primer GGATAAGTCCACGGTCCTGA | |
| Sequence-based reagent | clock-rev | This paper | qPCR primer CTCCAGCATGAGGTGAGTGT | |
| Sequence-based reagent | period-fwd | This paper | qPCR primer CGAGTCCACGGAGTCCACACACAACA | |
| Sequence-based reagent | period-rev | This paper | qPCR primer AGGGTCTGCGCCTGCCC | |
| Sequence-based reagent | timeless-fwd | This paper | qPCR primer CCGTGGACGTGATGTACCGCAC | |
| Sequence-based reagent | timeless-rev | This paper | qPCR primer CGCAATGGGCATGCGTCTCTG | |
| Sequence-based reagent | Actin5C-fwd | This paper | qPCR primer TTGTCTGGGCAAGAGGATCAG | |
| Sequence-based reagent | Actin5C-rev | This paper | qPCR primer ACCACTCGCACTTGCACTTTC |
Additional files
-
Supplementary file 1
Percent rhythmicity values using Lomb-Scargle periodogram automated analysis.
Individual flies were classified as rhythmic if difference between amplitude and the value, according to Lomb-Scargle periodogram quantifications, of the best fit line was greater >150, using a p<0.001 statistical cutoff.
- https://doi.org/10.7554/eLife.48308.026
-
Supplementary file 2
Primers to clone inserts for UAS-sgRNA construct assembly.
- https://doi.org/10.7554/eLife.48308.027
-
Supplementary file 3
Summary of all rhythmicity parameters for all experiments.
- https://doi.org/10.7554/eLife.48308.028
-
Supplementary file 4
Quantification of all circadian locomotor activity and immunohistochemistry data.
Data are grouped into different sheets within spreadsheet by main figure, genotype, and data type (activity or IHC).
- https://doi.org/10.7554/eLife.48308.029
-
Transparent reporting form
- https://doi.org/10.7554/eLife.48308.030
Download links
A two-part list of links to download the article, or parts of the article, in various formats.
Downloads (link to download the article as PDF)
Open citations (links to open the citations from this article in various online reference manager services)
Cite this article (links to download the citations from this article in formats compatible with various reference manager tools)
Dissection of central clock function in Drosophila through cell-specific CRISPR-mediated clock gene disruption
eLife 8:e48308.
https://doi.org/10.7554/eLife.48308


