Retro-2 protects cells from ricin toxicity by inhibiting ASNA1-mediated ER targeting and insertion of tail-anchored proteins
- Stanford University, United States
- Harvard University, United States
- Brown University, United States
- Stanford University Chemistry, Engineering, and Medicine for Human Health (ChEM-H), United States
Figures
Figure 1 with 1 supplement
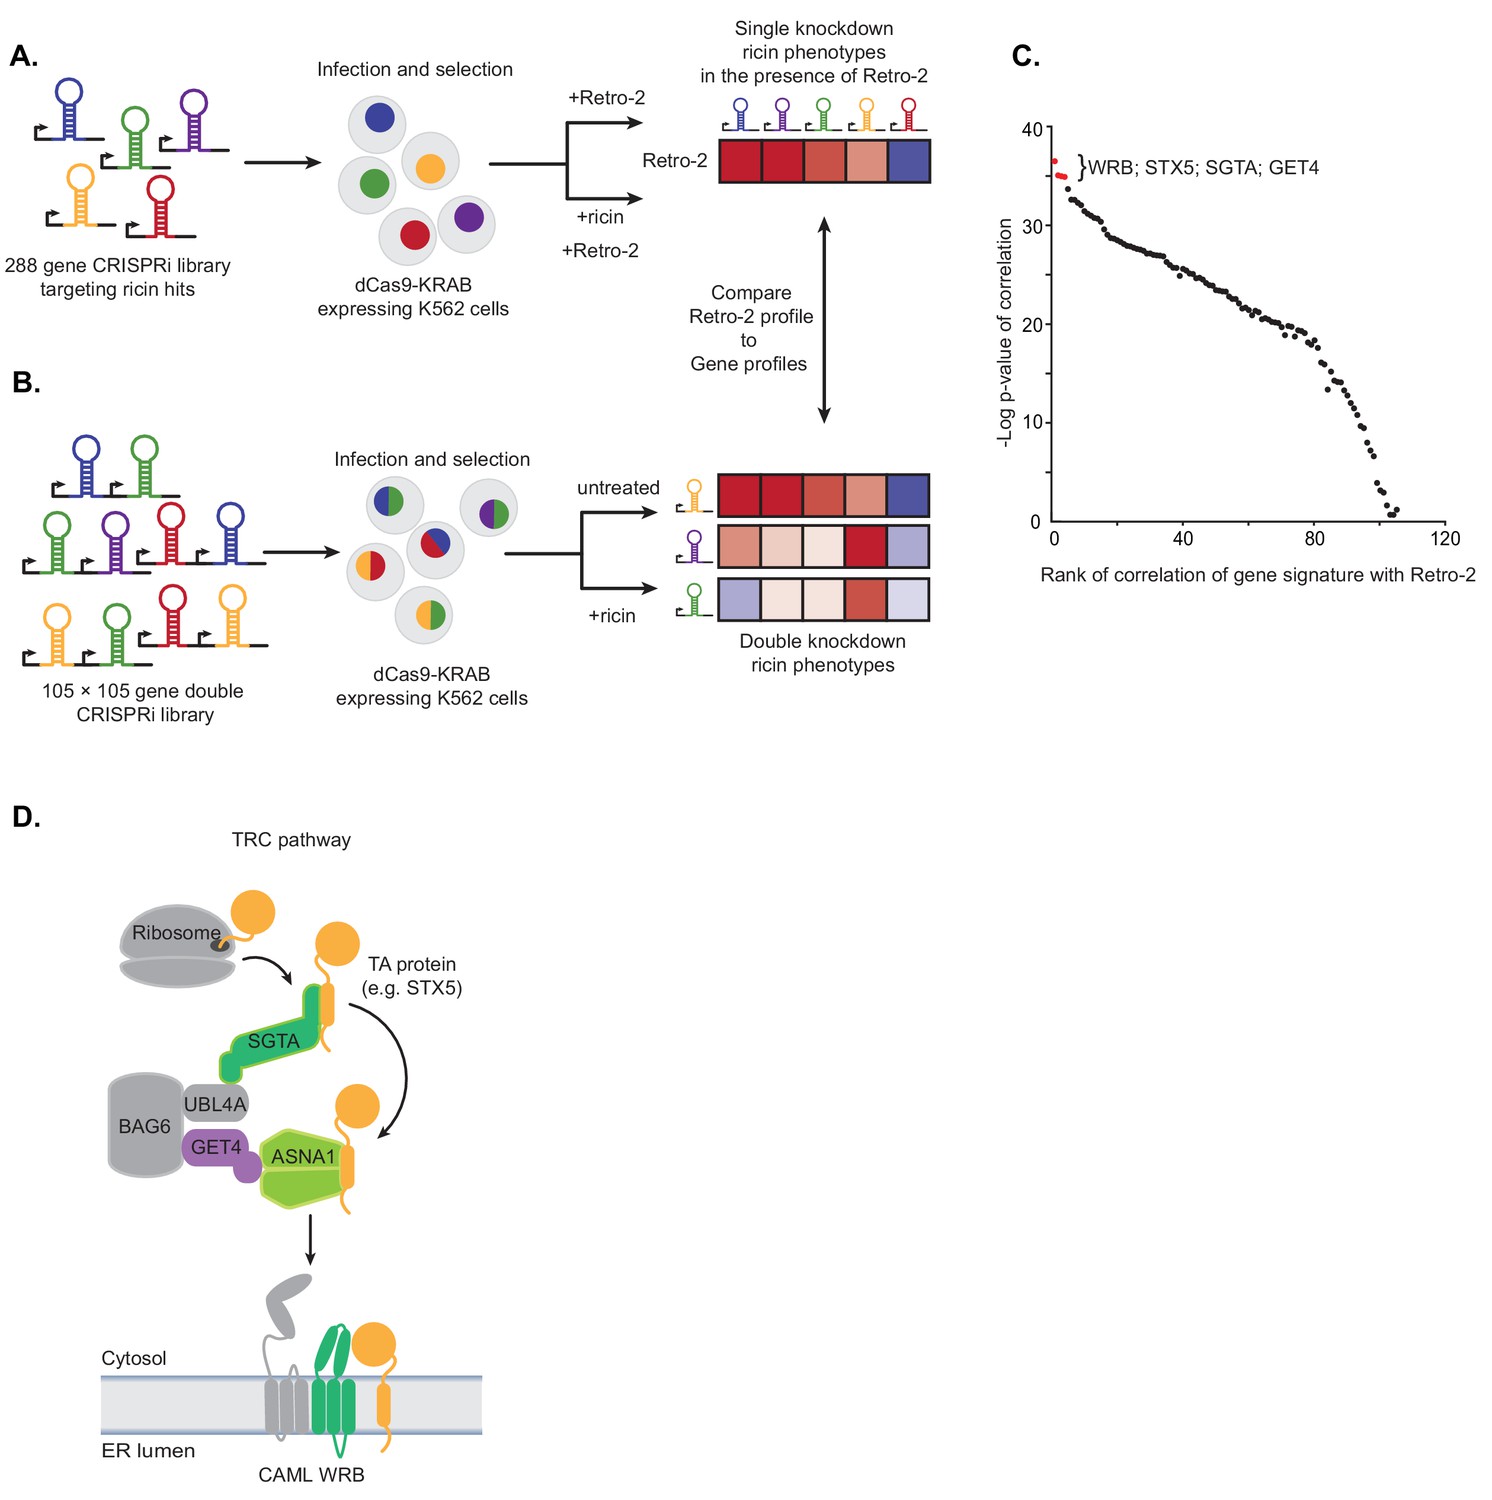
Single and paired-gene CRISPRi screens implicate TRC pathway inhibition as the MOA of Retro-2.
(A) Schematic of single-gene CRISPRi screen. A 288 gene library with 10 guides per gene targeting previously identified ricin hits and 2000 negative controls was lentivirally infected into a K562 cell line expressing a dCas9-KRAB fusion. The pool was then grown in replicate in the presence of 10 µM Retro-2 and presence or absence of 2.5 ng/µL ricin. The ricin phenotypes of the gene knockdowns in the presence of Retro-2 yielded a genetic profile of Retro-2. (B) Schematic of paired-gene CRISPRi screen. A library of 105 × 105 genes with three guides per gene and 50 negative controls were lentivirally infected into a K562 cell line expressing a dCas9-KRAB fusion. The pool was then grown in replicate in the presence or absence of ricin. For each of the genes included, the ricin phenotype of the double knockdowns represent a genetic profile. (C) Summary of paired-guide screen results. The genetic profile of each gene in the paired-gene CRISPRi screen (the ricin phenotype of each other gene in that background) was correlated (Pearson) with the genetic profile of Retro-2 (the ricin phenotype of each gene in the presence of Retro-2 as measured in the single-gene CRISPRi screen). The x-axis is the rank of the Pearson correlation coefficient. The y-axis is the negative log10 p-value of the correlation. The top four ranked genes are labeled and highlighted in red. (D) Schematic of the TRC pathway with the candidates from the single and pair-gene CRISPRi screens highlighted in color.
-
Figure 1—source data 1
Sequencing counts for single gene screens.
- https://doi.org/10.7554/eLife.48434.004
-
Figure 1—source data 2
Results for single gene screens.
- https://doi.org/10.7554/eLife.48434.005
-
Figure 1—source data 3
Sequencing counts for double gene screens.
- https://doi.org/10.7554/eLife.48434.006
-
Figure 1—source data 4
Results for double gene screens.
- https://doi.org/10.7554/eLife.48434.007
Figure 1—figure supplement 1
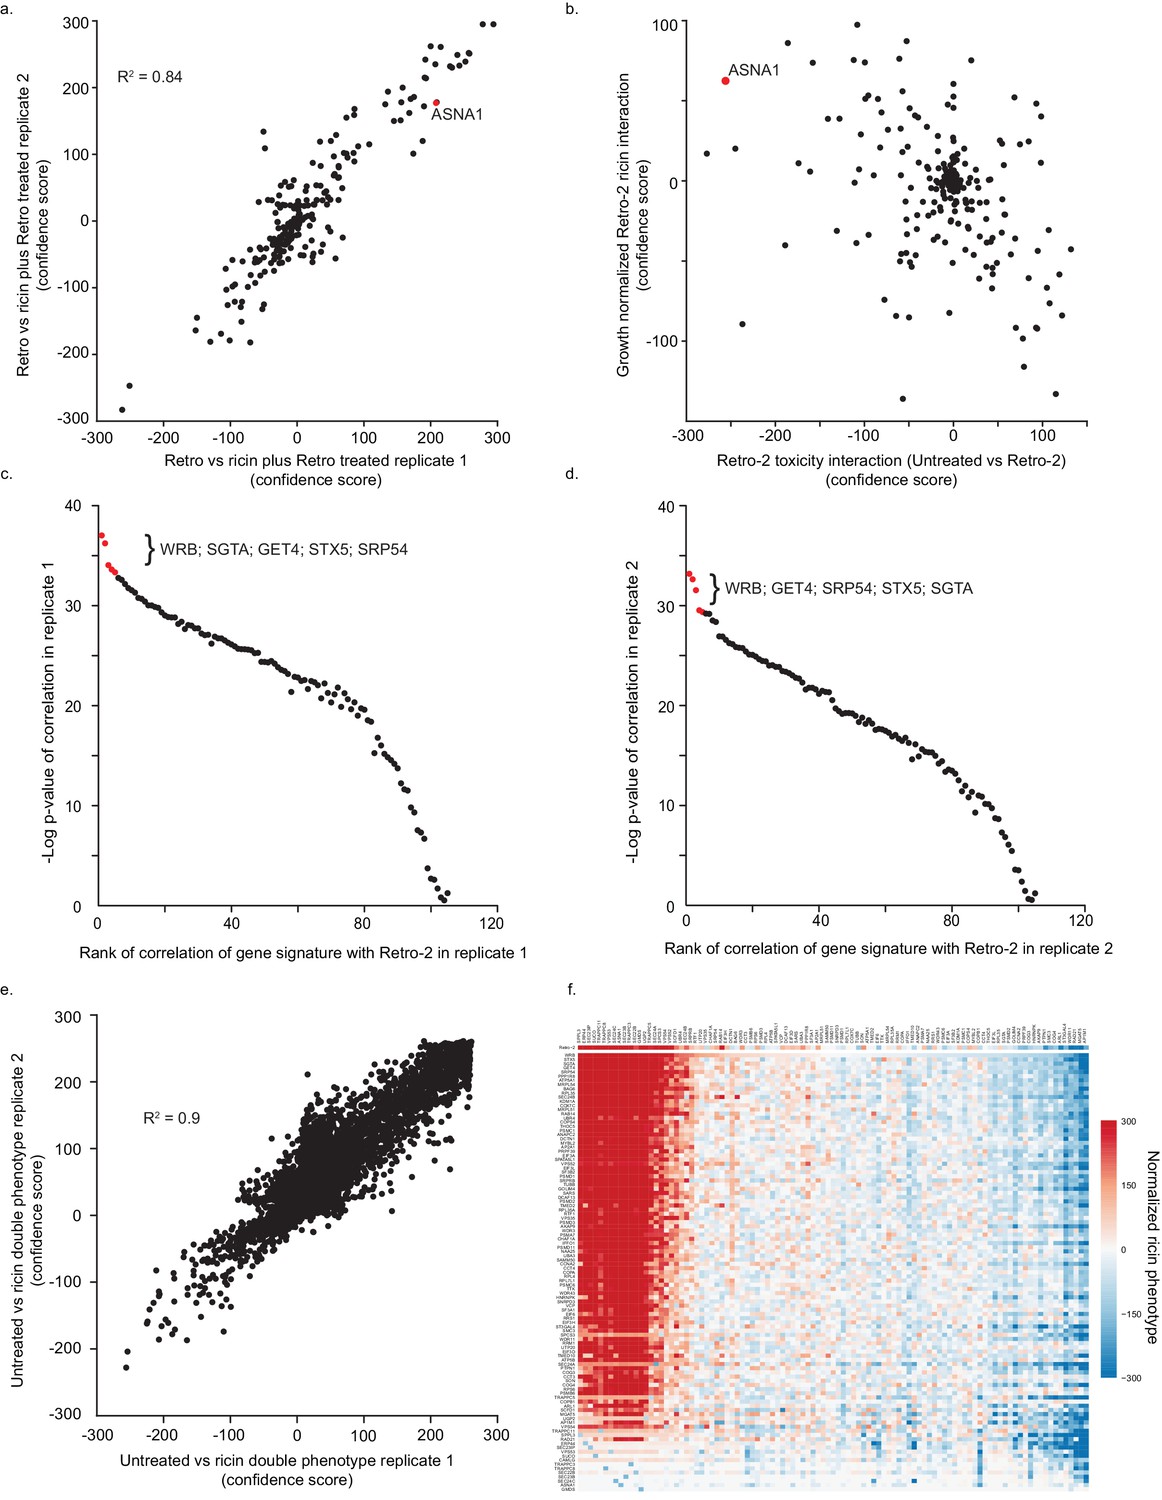
Genetic profile analysis of ricin phenotypes for Retro-2 and candidate genes.
(A) Reproducibility of genes’ knockdown effect on ricin resistance in the presence of Retro-2 for the CRIPSRi single-gene screen. The value is calculated by comparing the enrichment of guides targeting each gene between the Retro-2 treated and ricin plus Retro-2 treated conditions. (B) Modifiers of Retro-2 activity. The x-axis indicates the change in growth phenotypes of gene knockdowns in the presence of Retro-2, calculated by comparing enrichment of guides between untreated and Retro-2 treated conditions. A positive value indicates that the gene knockdown is less toxic in the presence of Retro-2, and a negative value indicates that the gene knockdown is more toxic in the presence of Retro-2. The y-axis indicates the change in protective activity of a gene knockdown in the presence of Retro-2, normalized for the change in gene toxicity, calculated by comparing enrichments of guides between ricin and ricin plus Retro-2 treated conditions, normalizing for the guide enrichment between untreated and Retro-2 treated conditions. A positive value indicates that a knockdown is more protective against ricin in the presence of Retro-2, while a negative value indicates that a knockdown is less protective against ricin in the presence of Retro-2. (C) Summary of single-gene CRISPRi results. The y-axis indicates the ricin phenotype of genes in the presence of 10 µM Retro-2, calculated by comparing the enrichment of guides targeting each gene between the Retro-2 and Retro-2 plus 2.5 ng/µL ricin conditions. A positive value indicates the gene knockdown is protective against ricin and a negative value indicates the gene knockdown is sensitizing against ricin. The x-axis is similarly the change in ricin phenotype in the presence/absence of 10 µM Retro-2, calculated by comparing the ricin treated conditions to the ricin plus Retro-2 treated conditions. A positive value indicates that the gene knockdown is more protective or less sensitizing to ricin in the presence of Retro-2 while a negative value indicates the gene knockdown is less protective or more sensitizing in the presence of Retro-2. Top 100 genes are determined by the absolute value of the x-axis. ASNA1 is highlighted in red. (D,E) Reproducibility of genetic profiles. Genetic profiles for genes can be determined using single replicates of the paired-gene CRISPRi screen. The genetic profile measured by (D) replicate one or (E) replicate two can then be compared to the profile of Retro-2 from the single-gene CRISPRi screen. (F) Reproducibility of double phenotypes measured in the paired-CRISPRi screen. Positive scores indicate that the pair of knockdowns is protective against ricin; negative scores indicates sensitization. (G) Summary of paired-gene screen. The y-axis shows all 105 genes and their phenotypic profiles in the pairwise CRISPR experiment as well as the phenotypic profile of Retro-2 in the single-gene experiment. The x-axis shows all 101 genes tested in both experiments. Each entry is the normalized ricin phenotype of the double gene knockdown (or the single gene knockdown in the Retro-2 treated sample). The normalized ricin phenotype was calculated as the enrichment for all 9 pairs of sgRNAs targeting both genes (3 × 3 per gene pair) comparing untreated and ricin treated samples. The median ricin phenotype for each row was then subtracted from each entry. Order of rows indicates the rank of correlation of each gene to Retro-2. Order of columns is the ranked order of scores for the top correlate, WRB.
Figure 2 with 1 supplement
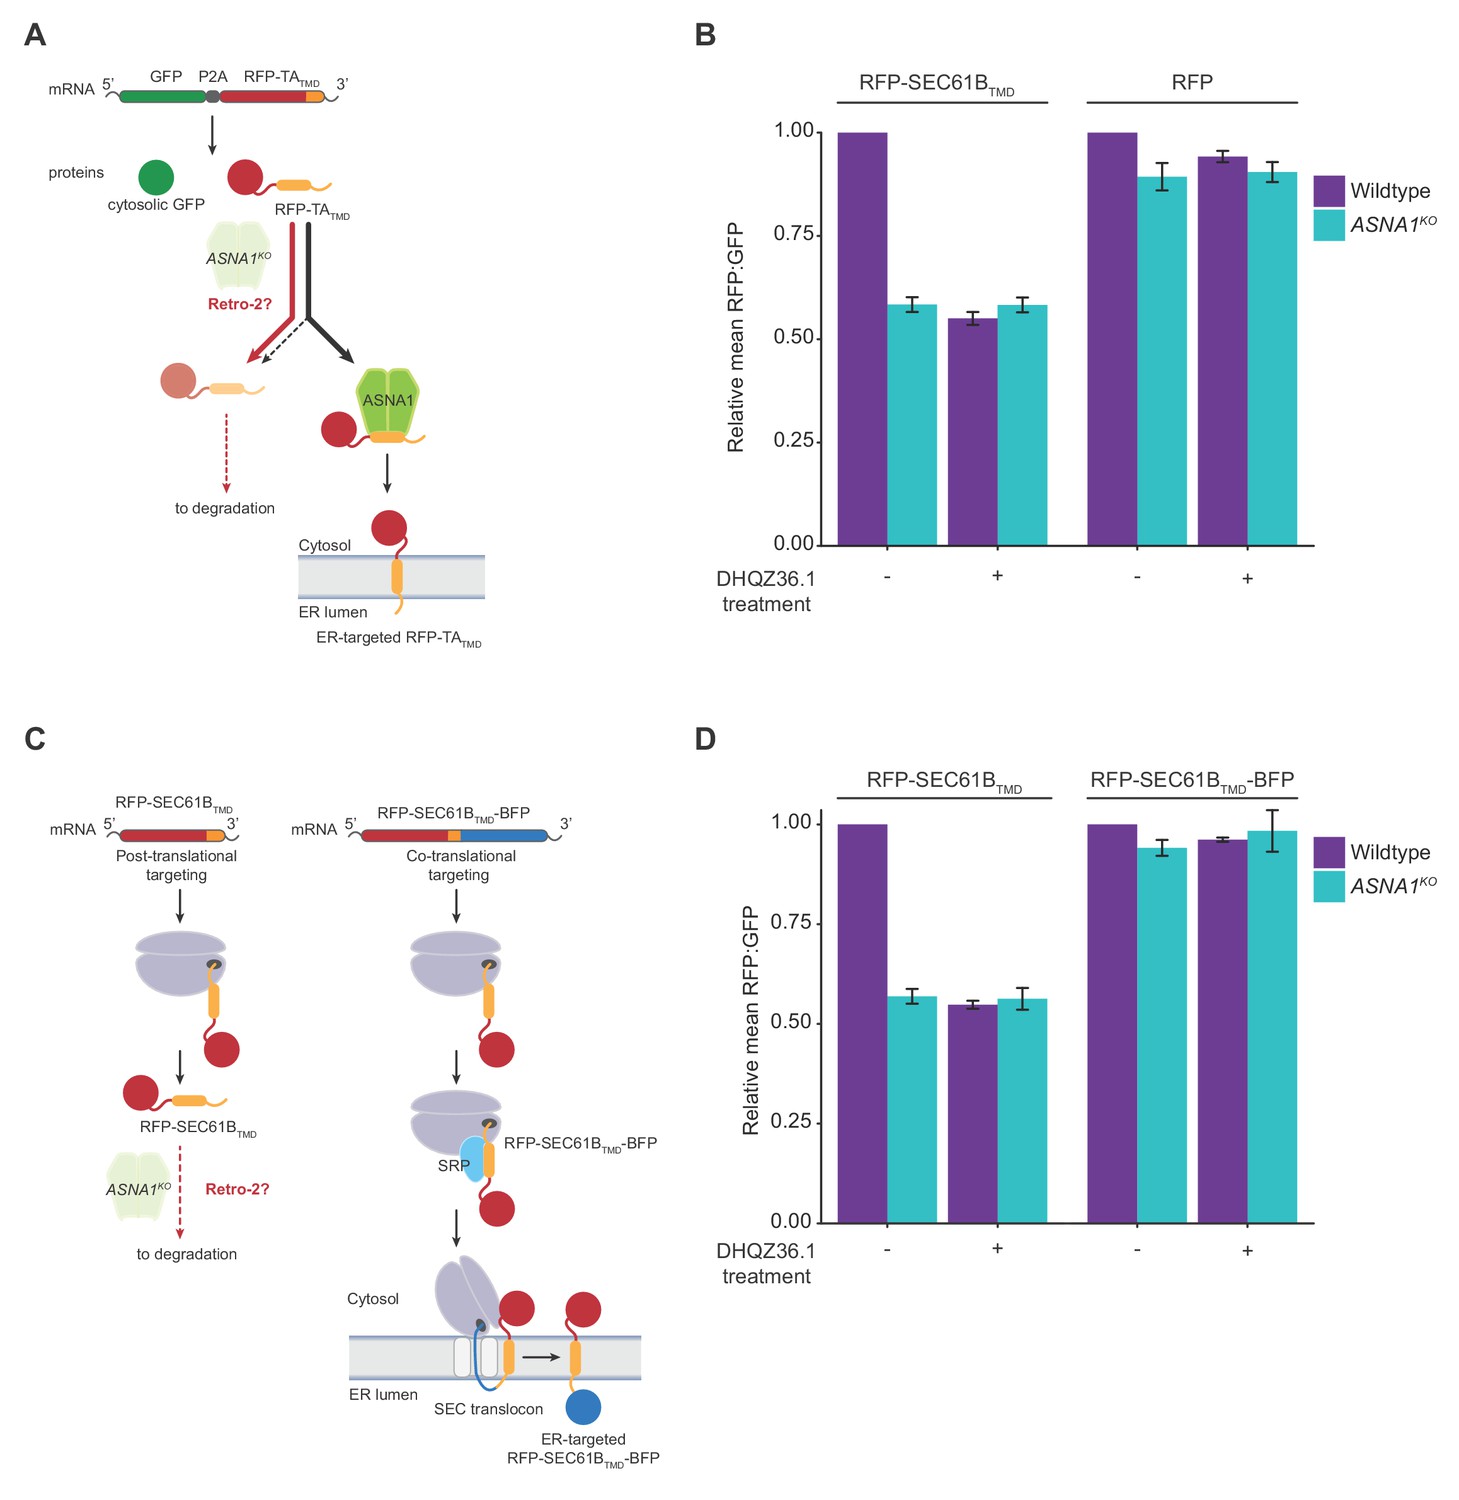
Retro-2 diverts newly-synthesized TA proteins from ER targeting to degradation.
(A) Schematic of the dual-colour reporter consisting of a self-cleaving P2A peptide between a GFP and a RFP with a C-terminal TMD. Genetic and chemical perturbations to targeting pathways will promote destabilization of RFP-TATMD, as TA proteins are diverted for degradation by accessory TRC pathway components (not shown) if they are not efficiently captured by ASNA1. (B) Wildtype and ASNA1KO HEK293T cell lines with indicated reporters were pre-treated with 3 µM DHQZ36.1 for 1 hr prior to induction with dox for approximately 18 hr and FACS analysis. Shown are bar graphs of reporter RFP to GFP ratios with standard deviations derived from three experiments as relative means to their corresponding mock-treated wildtypes. (C) Schematic of the post-translational and co-translational ER targeting of RFP-SEC61BTMD. and RFP- SEC61BTMD-BFP, respectively. (D) Cells with indicated genotypes and reporters were treated and analyzed as in part b).
Figure 2—figure supplement 1
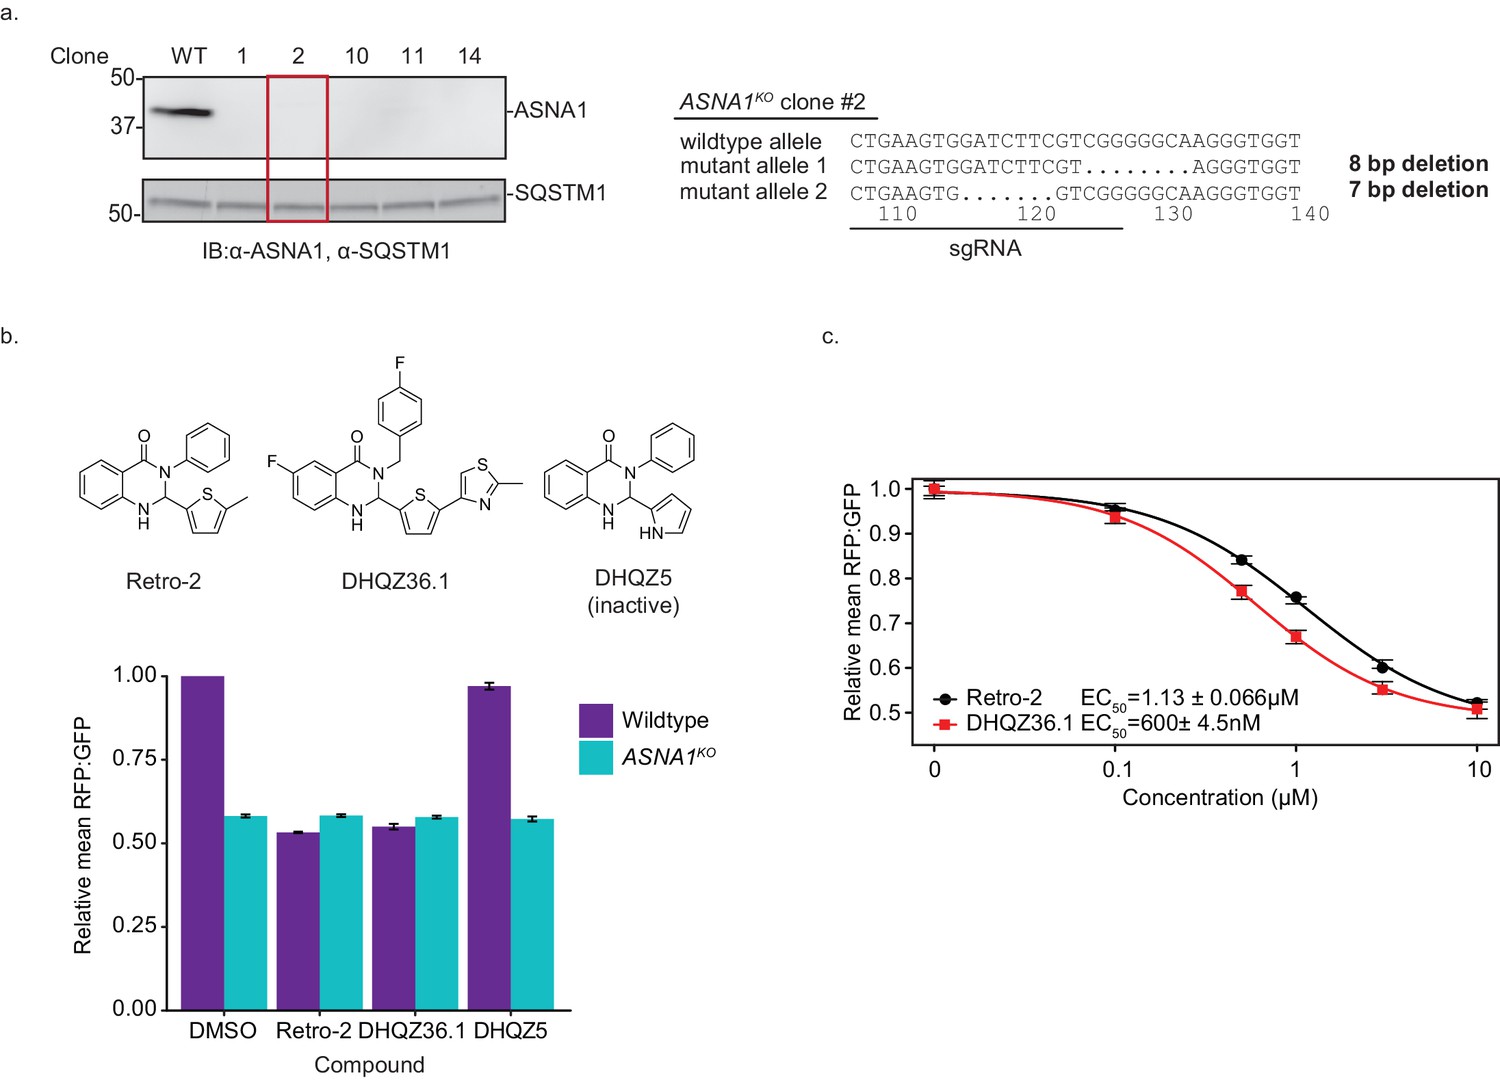
ASNA1 knockout and Retro-2/DHQZ36.1 treatment destabilize the transmembrane domain of STX5.
(A) Left: Whole-cell lysates were prepared from wildtype and ASNA1KO HEK293T cells and subjected to SDS-PAGE and visualized by immunoblotting (IB). SQSTM1 was used as the loading control. ASNA1KO clone #2 (marked in red) was carried forward for the rest of the experiments. Right: Sequencing for ASNA1KO clone #2 at the ASNA1 locus. The line represents the sgRNA used to make the deletion. (B) Top: Chemical structures for Retro-2, DHQZ36.1 and DHQZ5. Bottom: Wildtype and ASNA1KO HEK293T cell lines expressing the GFP-2A-RFP-SEC61BTMD reporter were pre-treated with the indicated compound for 1 hr prior to induction with dox for approximately 18 hr and FACS analysis. Cells were treated with 10 µM Retro-2, 3 µM DHQZ36.1 or 10 µM DHQZ5. Shown are bar graphs of reporter RFP to GFP ratios as relative means ± standard deviation (three experiments) to mock-treated wildtype cells. (C) Wildtype HEK293T cells expressing the GFP-2A-RFP-SEC61BTMD reporter were pre-treated with Retro-2 (black circles) or DHQZ36.1 (red squares) for 1 hr prior to induction with dox for approximately 18 hr and FACS analysis. Shown are the dose-response curves for the reporter RFP to GFP ratios as relative means (three experiments) to the mock-treated cells. The dose response was modeled using the four-parameter logistic regression to determine the half maximal effective concentration (EC50 ± standard error). Error bars for the means represent the standard error calculated from the four-parameter logistic regression.
Figure 3 with 1 supplement
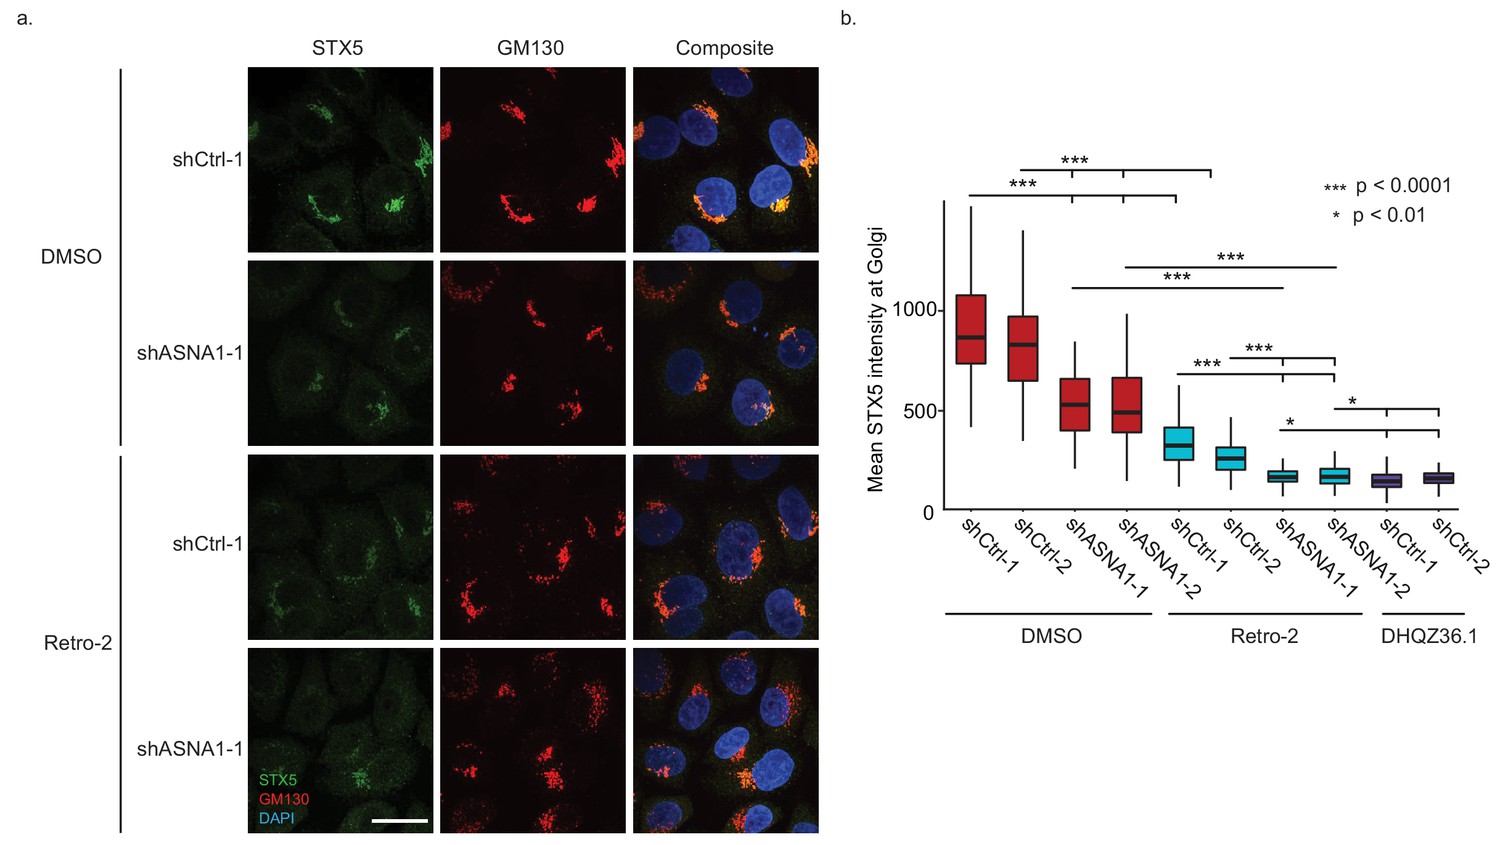
ASNA1 knockdown and Retro-2 treatment both decrease the abundance of Golgi-localized STX5, an ASNA1 substrate.
(A) HeLa cells expressing either ASNA1-targeting or scrambled control (shCtrl) shRNAs were treated for 24 hr with DMSO or 10 μM Retro-2 before fixation and staining for STX5, a Golgi marker (GM130), and a nuclear marker (DAPI). Shown are maximal signal projections of z-stacked confocal micrographs taken with a 100× objective and made without contrast or LUT adjustments. Scale bar represents 25 µm and applies to all images. (B) HeLa cells were treated as in part a) but including additional shRNAs and the hyperactive Retro-2 analog DHQZ36.1. Images were collected using a 60× objective and quantitatively analyzed. Shown are box plots of per cell mean STX5 intensity at GM130-marked Golgi for the indicated treatments. Asterisks specify significant differences between treatments as calculated by the MW U test.
Figure 3—figure supplement 1
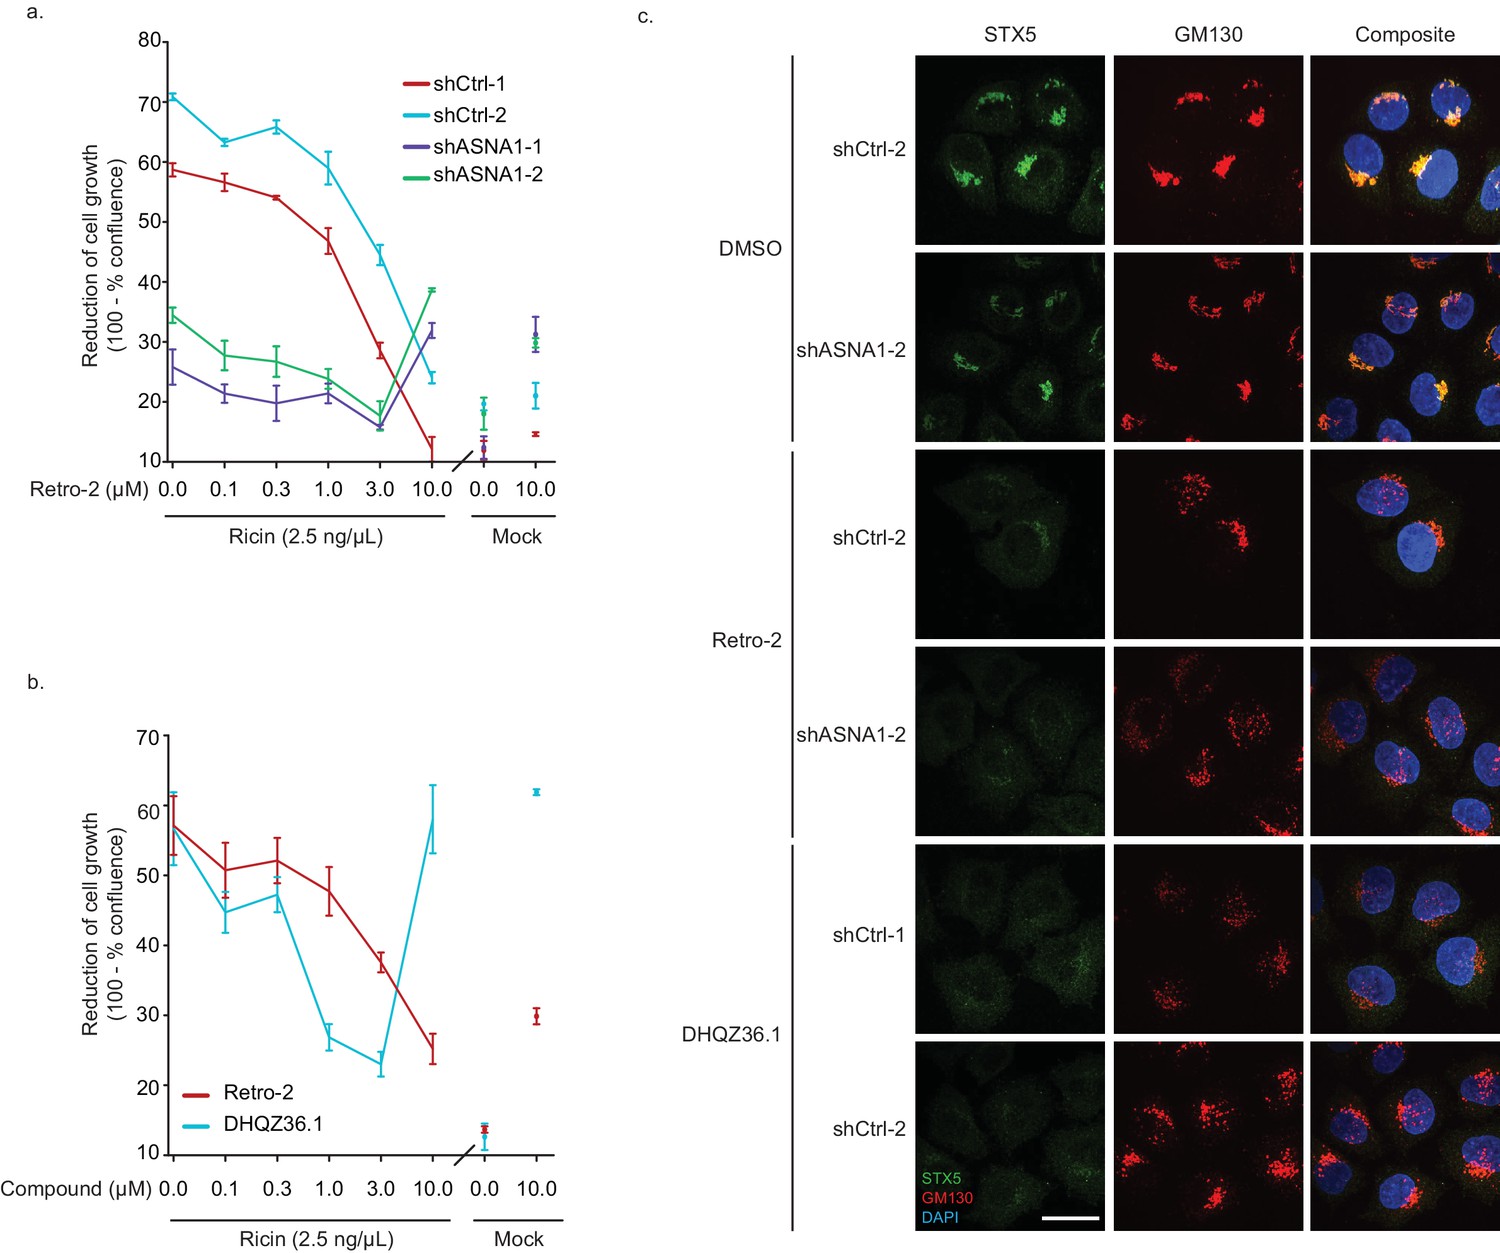
Effect of ASNA1 knockdown or Retro-2 and DHQZ36.1 in HeLa cells.
(A) Dose curves for the protective effect of Retro-2 against ricin cytotoxicity in HeLa cells expressing either shRNAs targeting ASNA1 or scrambled negative controls. Cells are pretreated with the indicated drug concentration, then treated with ricin for 24 hr. Ricin was washed out and cells were imaged for 72 hr on an Incucyte. Confluency of cells was calculated using phase images and is presented as 100 minus the percent confluency. (B) Dose curves for DHQZ36.1 relative to Retro-2. Cells were treated and imaged as above. (C) Additional confocal images of HeLa cells expressing either ASNA1-targeting or scrambled control (shCtrl) shRNAs, treated with DMSO, 10 µM Retro-2 or 3 µM DHQZ36.1, which were used for quantitative analysis in Figure 3b. Cells were fixed and imaged as in Figure 3a. Scale bar represents 25 µm and applies to all images.
Figure 4 with 2 supplements
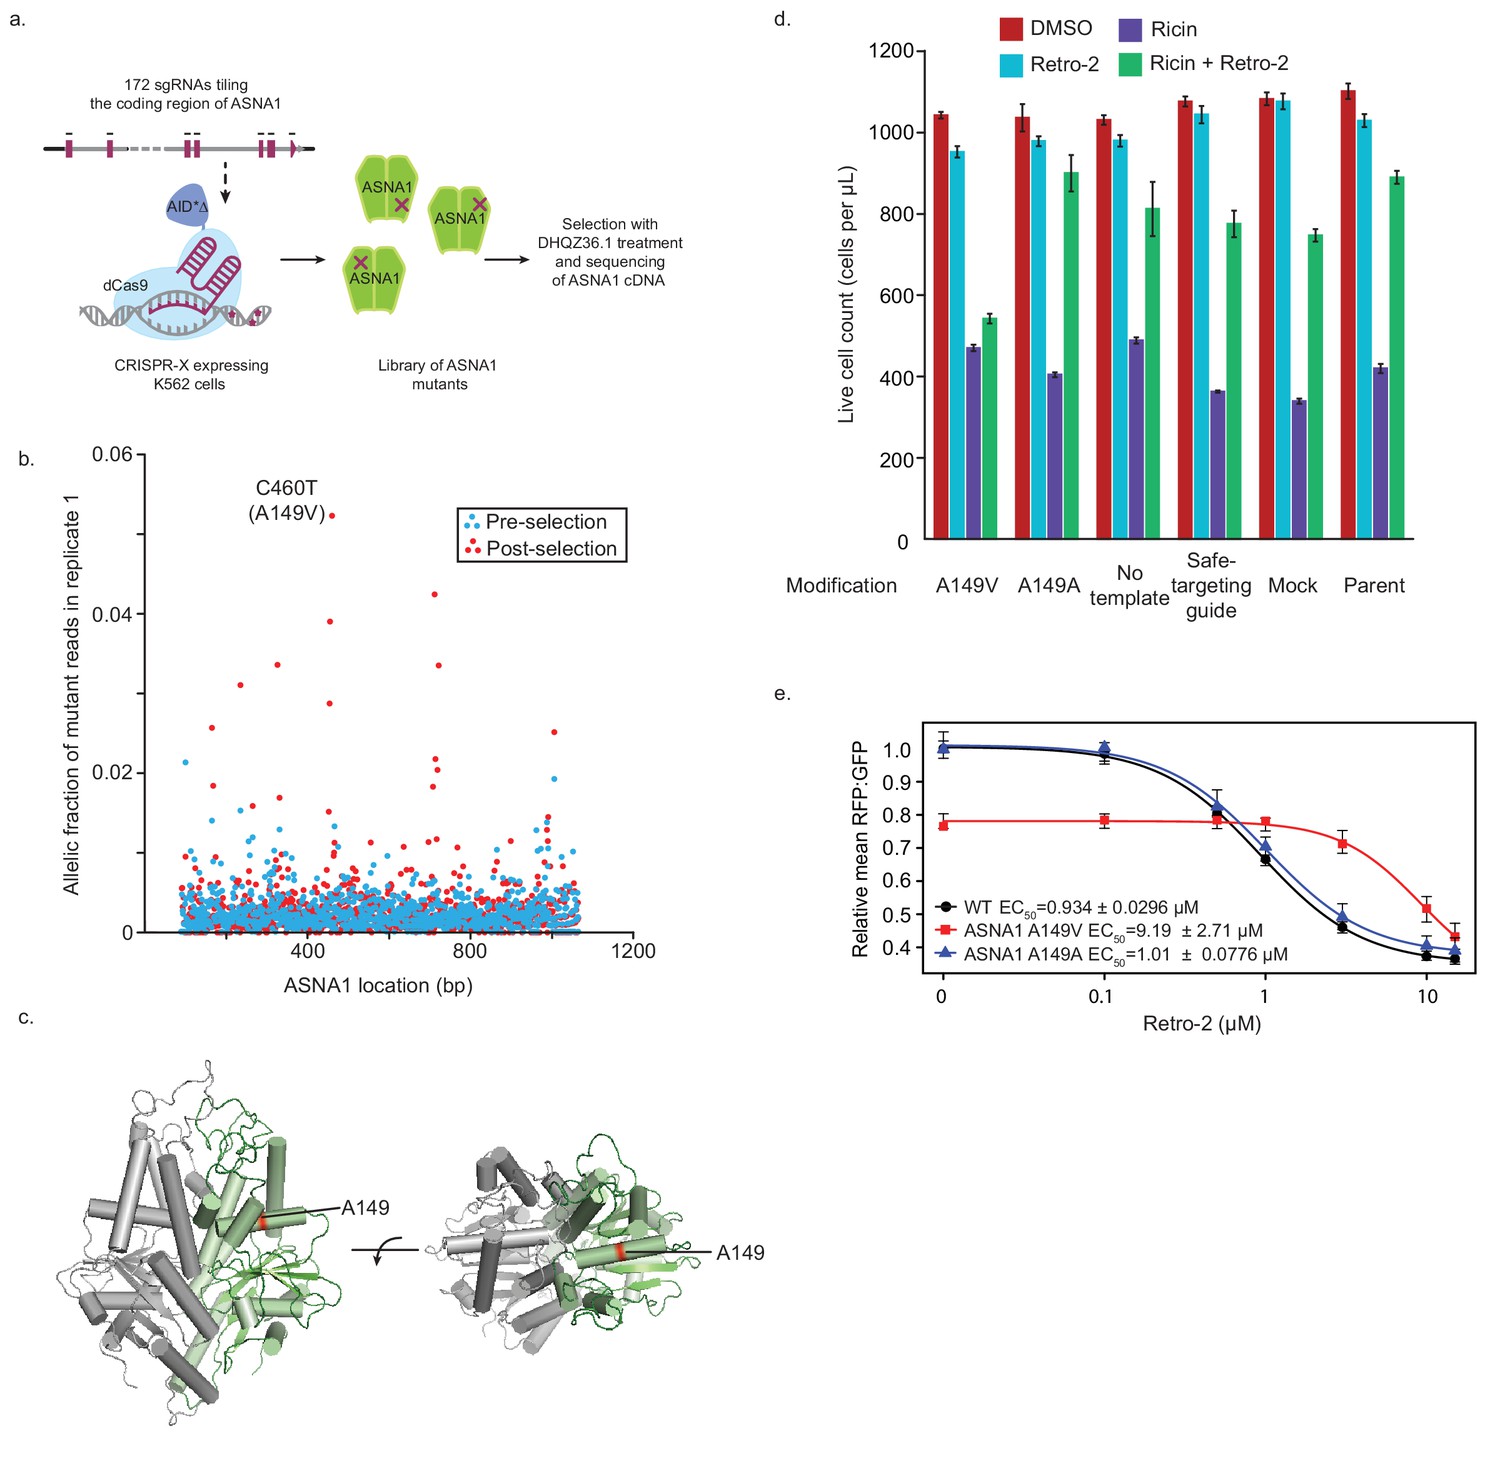
Isolation and characterization of A149V ASNA1, a Retro-2-resistance allele.
(A) Schematic of ASNA1 mutagenesis by CRISPR-X. A 172 sgRNA library tiling the ASNA1 coding region was lentivirally infected in a K562 cell line expressing a dCas9-AID*Δ N-terminal fusion. The pool was then grown in duplicate in the presence of 20 μM DHQZ36.1 for 4 weeks. ASNA1 was amplified separately from cDNA of naive and treated cell populations before being sequenced by Nextera XT. (B) Plot of the frequency of ASNA1 alleles across the gene-body (x-axis) in the initial CRISPR-X population (pre-selection) and in one replicate of the selected population. Allelic fraction was calculated by determining the per-base variant frequency that is the number of reads which contain a mutated base at a given position vs the number of reads which contain the wildtype base at that position. Bases which had less than 500× read coverage were excluded, resulting in no resolution of the 5’/3’ ends of ASNA1. The top selected mutation in both replicates is highlighted. (C) A homology model of human ASNA1 (SWISS-MODEL: O43681) with the location of the top mutated residue, A149, enriched after selection by DHQZ36.1 toxicity highlighted in red on one ASNA1 (colored in green) of the homodimer. (D) A149V was installed by homology directed repair in a K562 cell line expressing Cas9. The resulting mutant line was treated with ricin toxin in the presence of 10 μM Retro-2 or DMSO. Live cells were counted using forward/side scatter by cytometry. Shown are bar graphs of the mean with standard error from three technical replicates. Also shown are data for five control lines treated in the same way. See Materials and methods for further details. (E) Clonal wildtype (black circles), ASNA1 A149V (C460T) (red squares), and ASNA1 A149A (C461T) (blue triangles) K562 cell lines with the GFP-2A-RFP-SEC61BTMD reporter were pre-treated with Retro-2 with the indicated concentrations for 1 hr prior to induction with dox for approximately 18 hr and FACS analysis. Shown are the dose-response curves for the reporter RFP to GFP ratios as relative means (three experiments) to mock-treated wildtype cells. The dose response was modeled using the four-parameter logistic regression to determine the half maximal effective concentration (EC50 ± standard error). Error bars for the means represent the standard error calculated from the four-parameter logistic regression.
-
Figure 4—source data 1
Results for CRISPR-X experiments to identify ASNA-1 mutations resistant to Retro-2.
- https://doi.org/10.7554/eLife.48434.015
Figure 4—figure supplement 1
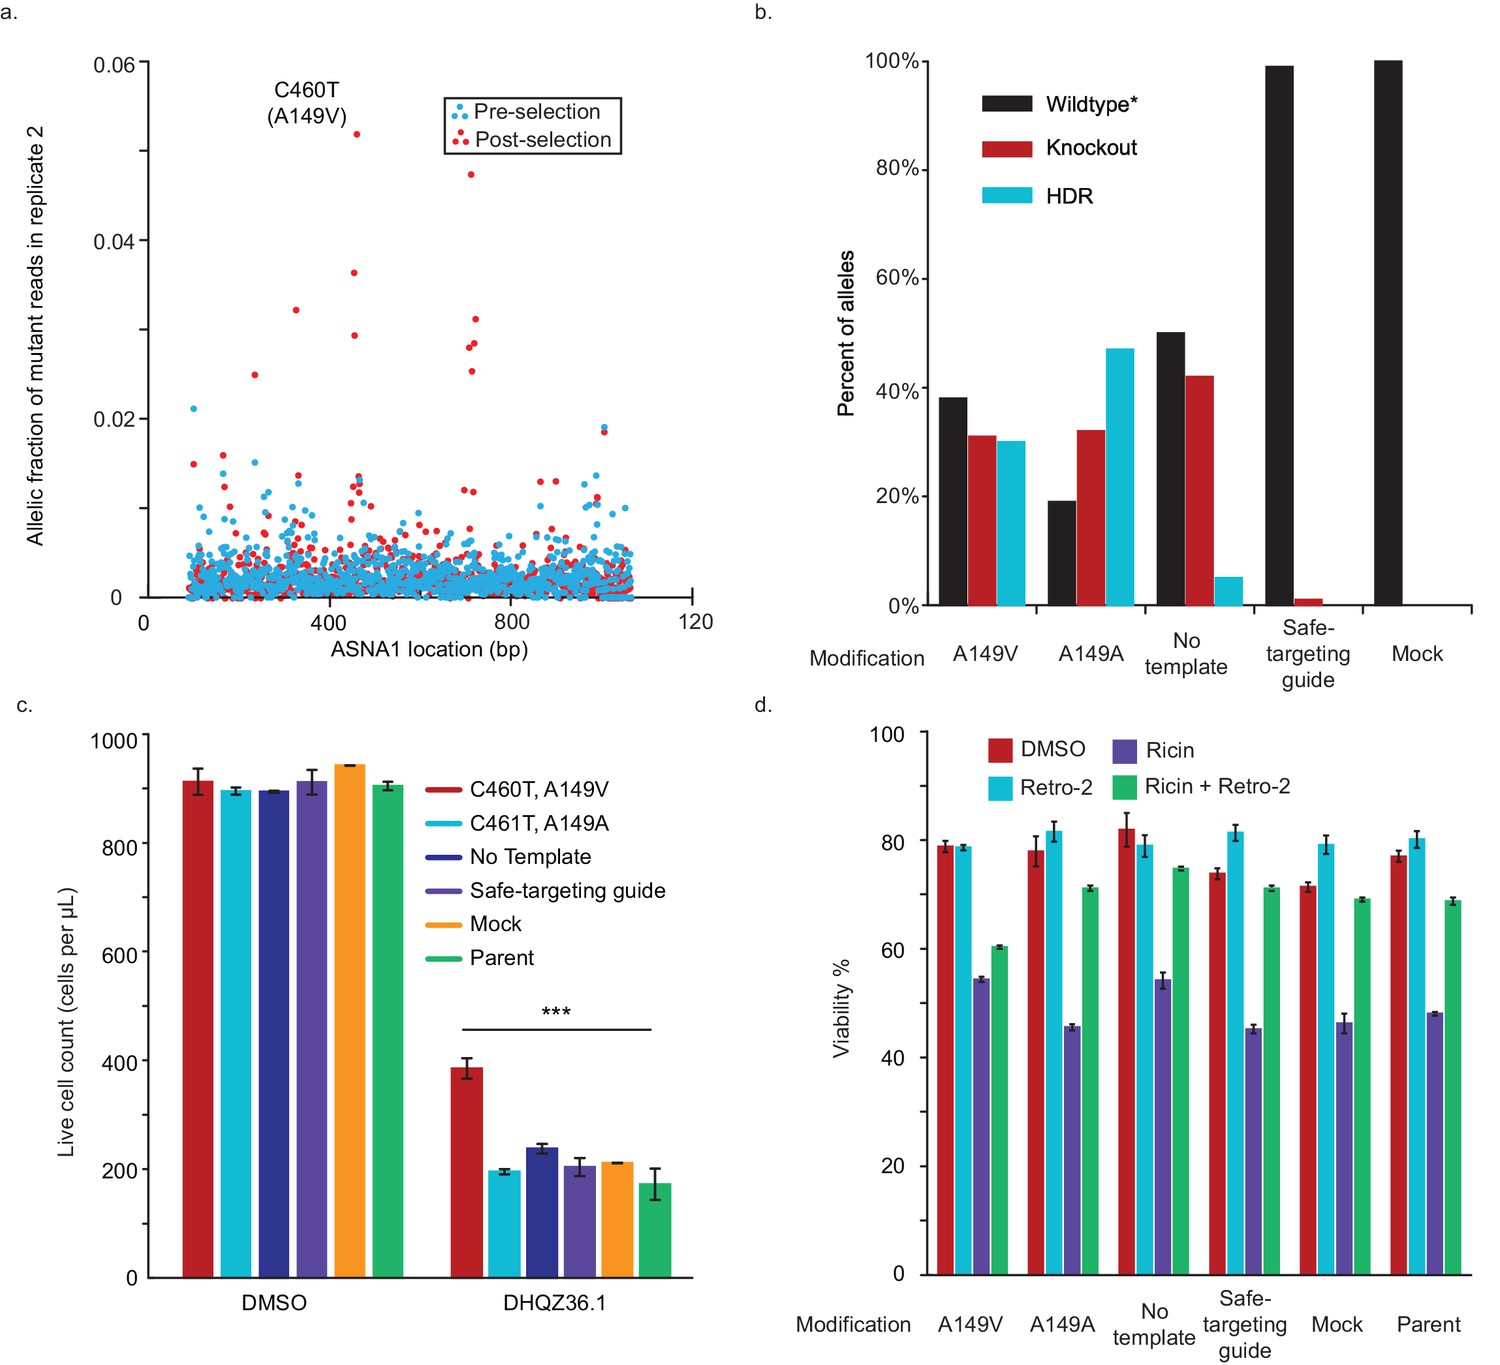
Replication and validation of CRISPR-X screen.
(A) Allelic fraction of ASNA1 mutations post-selection for second replicate. The frequency of mutations across the gene-body of ASNA1 in the second replicate of the selected population. Top mutation in both replicates is C460T, which results in an alanine to valine coding mutation (A149V). Allelic fraction was calculated by determining the per-base variant frequency that is the number of reads which contain a mutated base at a given position vs the number of reads which contain the wildtype base at that position. (B) A149V substitution was installed using homology directed repair (HDR) in a Cas9-expressing K562 line. As negative controls, the synonymous, PAM-breaking mutant C461T (A149A) was also installed, along with a no template, a safe-targeting guide, mock, and parent control line. HDR and knockout frequencies were then monitored via Sanger sequencing of pooled cells and quantified using ICE. Alleles were considered wildtype* if they did not contain the intended mutation and had either no change or a frame-preserving insertion/deletion. (C) ASNA1 A149V is resistant to DHQZ36.1-induced toxicity. Indicated pooled cell populations were treated with 20 µM DHQZ36.1 for four days and live cells were counted using forward/side scatter. Error bars indicate standard error of the mean from three technical replicates. (D) Indicated cell populations were treated with ricin toxin in the presence of 10 µM Retro-2 or DMSO. Viability of treated cells was measured by cytometry on the basis of forward/side-scatter. Shown are bar graphs of the mean with standard error from three technical replicates. Also shown are data for five control lines treated in the same way. See Materials and methods for further details.
Figure 4—figure supplement 2
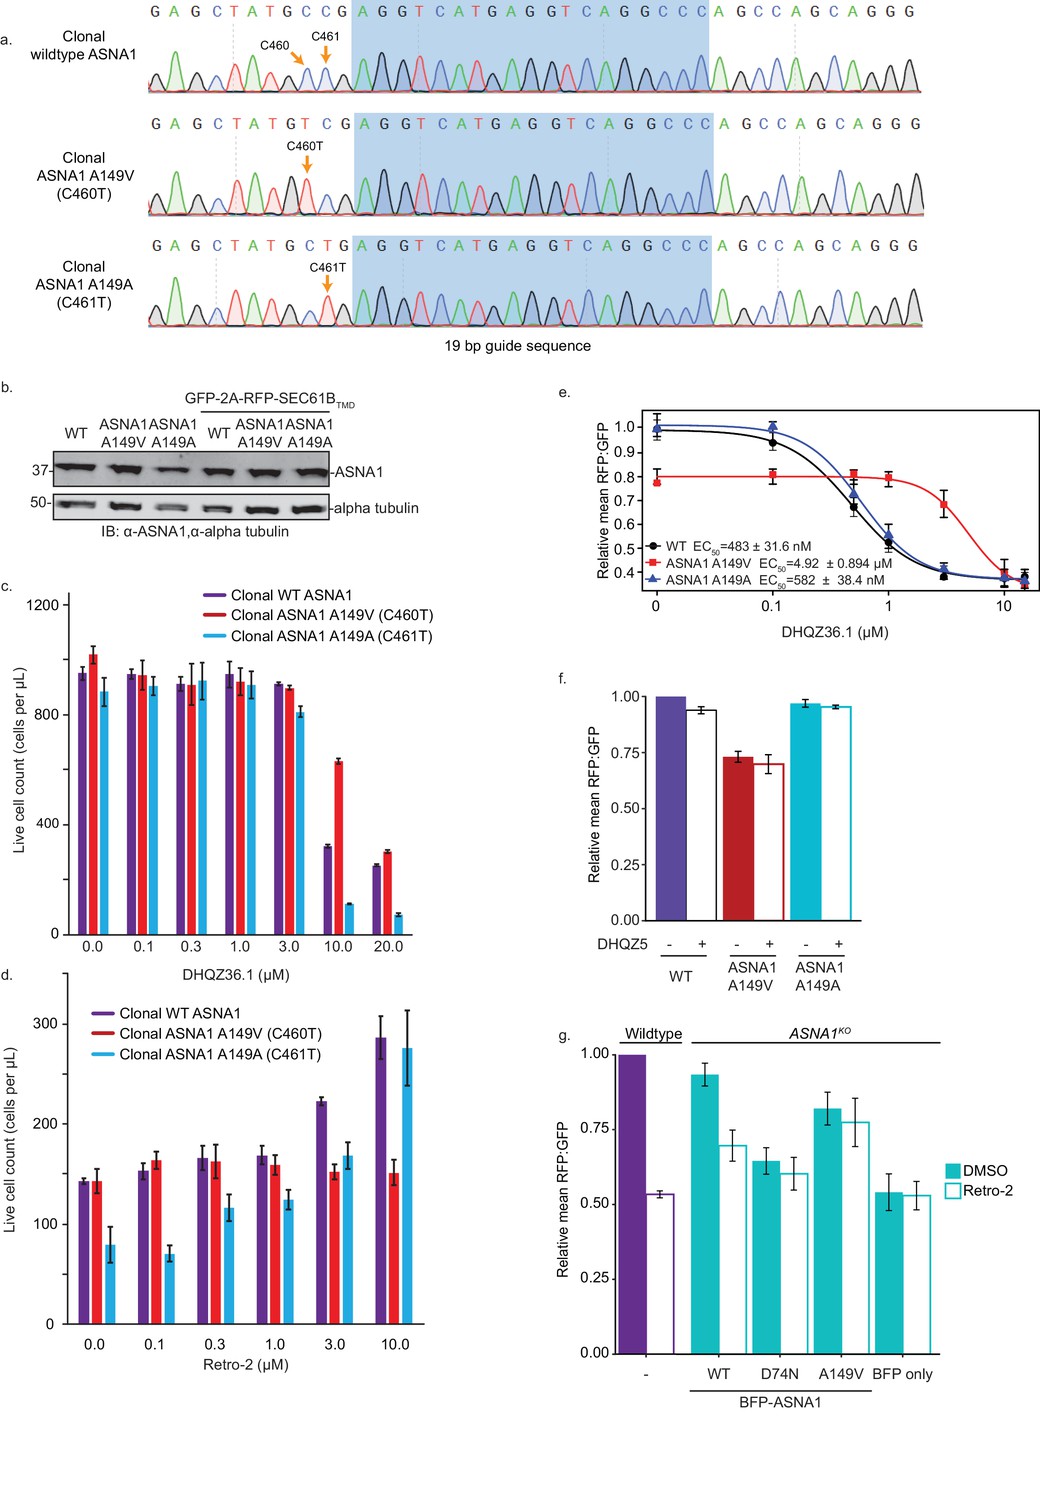
Characterization of clonal ASNA1 A149V cells.
(A) Clonal K562 lines containing the mutant A149V (C460T), synonymous A149A (C461T), and wildtype ASNA1 alleles were generated by single cell sorting of edited pools. Homozygous ASNA1 alleles were confirmed by Sanger sequencing. (B) Whole lysates were prepared from clonal wildtype, ASNA1 A149V (C460T), and ASNA1 A149A (C461T) K562 cells either lacking or transduced with the GFP-2A-RFP-SEC61BTMD TA reporter. Samples were subjected to SDS-PAGE and visualized by immunoblotting (IB). Alpha tubulin served as the loading control. (C) Clonal lines were treated with various concentrations of DHQZ36.1 for 5 days and the number of live cells was then counted by cytometry, using FSC/SSC to determine viability. Error bars represent error of the mean from three replicates. (D) The ricin sensitivity and Retro-2 rescue of clonal K562 lines. Cells were pretreated for 24 hr in the indicated Retro-2 concentration before treated with ricin toxin for 24 hr. 72 hr later live cell number was assessed using cytometry and forward/side scatter. Error bars represent error of the mean from three replicates. (E) Clonal wildtype (black circles), ASNA1 A149V (C460T) (red triangles), and ASNA1 A149A (C461T) (blue triangles) K562 cell lines with the GFP-2A-RFP-SEC61BTMD reporter were pre-treated with DHQZ36.1 for 1 hr prior to induction with dox for approximately 18 hr and FACS analysis. Shown are the dose-response curves for the reporter RFP to GFP ratios as relative means (three experiments) to mock-treated wildtype cells. The dose response was modeled using the four-parameter logistic regression to determine the half maximal effective concentration (EC50 ± standard error). Error bars for the means represent the standard error calculated from the four-parameter logistic regression. (F) Clonal wildtype, ASNA1 A149V (C460T), and ASNA1 A149A (C461T) K562 cell lines with the GFP-2A-RFP-SEC61BTMD reporter were pre-treated with the 10 µM DHQZ5 or mock-treated with DMSO for 1 hr prior to induction with dox for approximately 18 hr and FACS analysis. Shown are bar graphs of reporter RFP to GFP ratios with standard deviations derived from three experiments as relative means to mock-treated wildtype cells. (G) ASNA1KO HEK293T cells expressing GFP-2A-RFP-SEC61BTMD were transiently transfected with indicated BFP-ASNA1 variants or BFP. The resulting transfected cells and untransfected wildtype control were pre-treated with 10 µM Retro-2 for 1 hr prior to induction with dox for 24 hr and FACS analysis. Shown are bar graphs of the means ± standard deviation (three experiments) of RFP to GFP ratios normalized to untransfected wildtype.
Figure 5 with 2 supplements
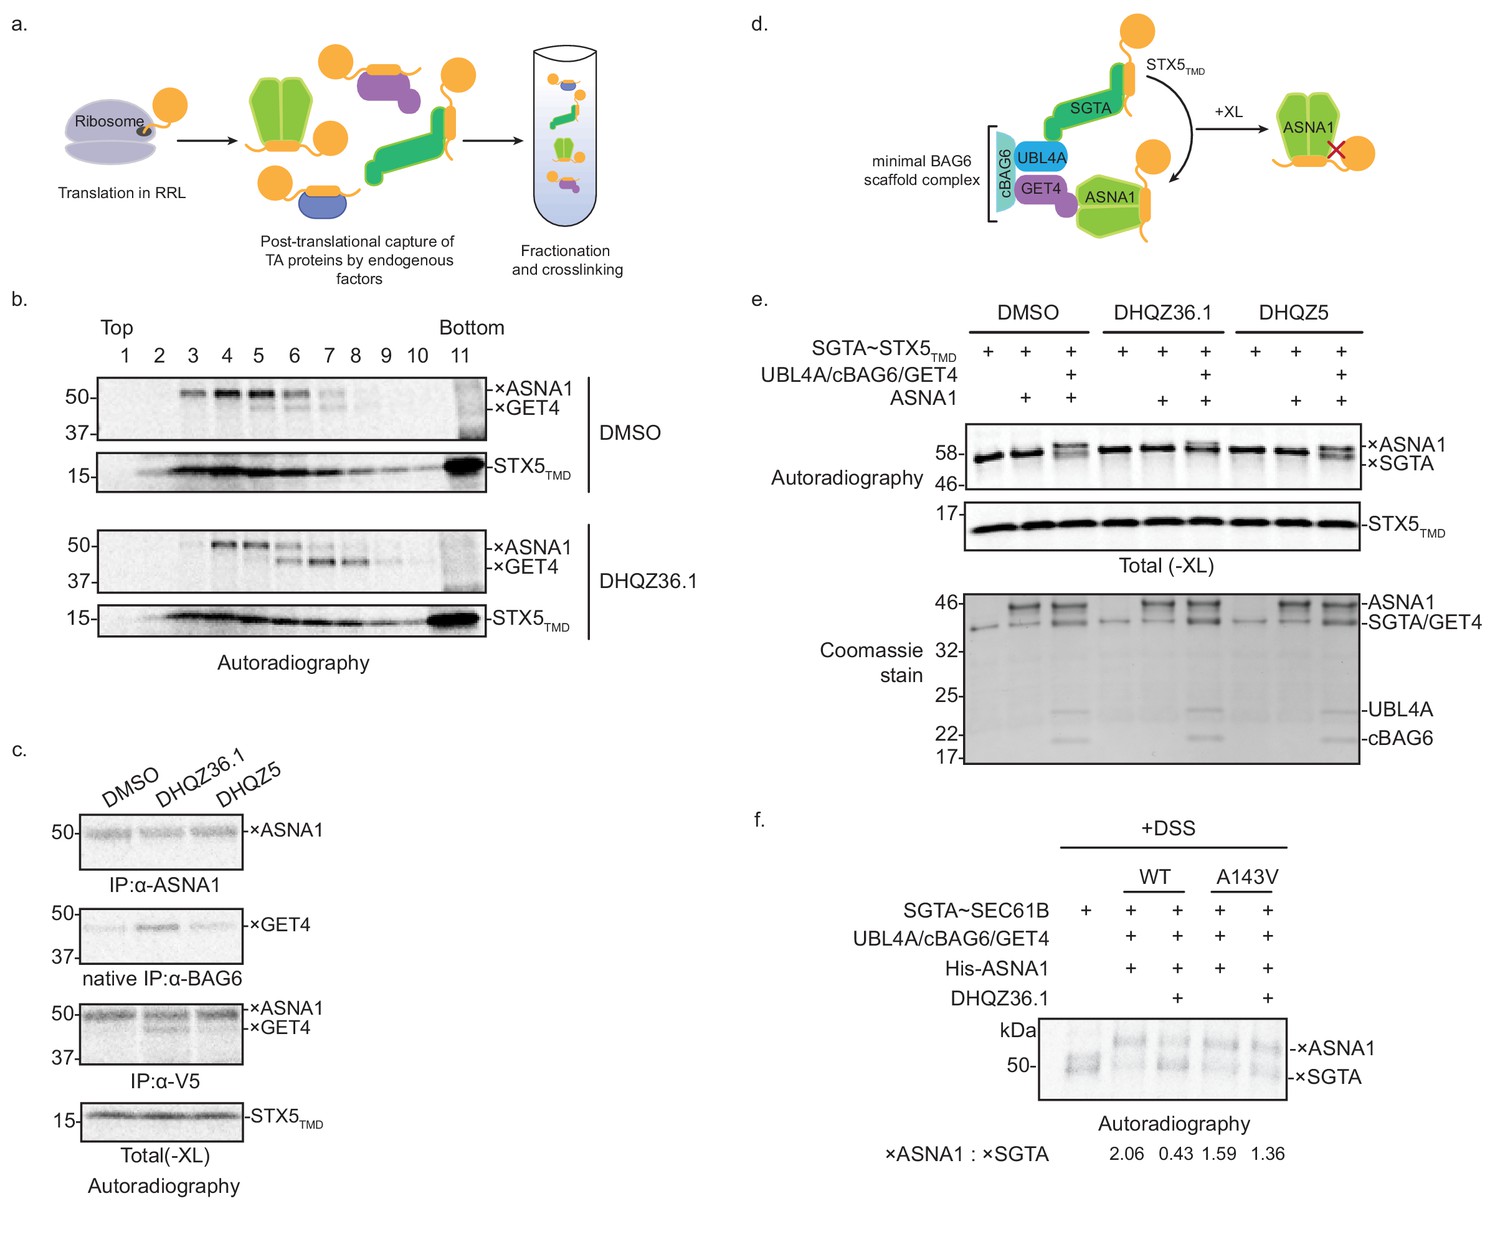
DHQZ36.1 blocks substrate transfer from SGTA to ASNA1 in vitro.
(A) Schematic of the fractionation and crosslinking assay to monitor the cytosolic interactions of in vitro translated TA proteins. After translation in crude rabbit reticulate lysate (RRL), the TA proteins are captured by endogenous factors. (B) In vitro translation of a model TA substrate comprising of the cytosolic domain of SEC61B, the TMD of STX5 and a C-terminal V5 epitope (STX5TMD) in the presence of 35S-methionine and 15 µM DHQZ36.1 in RRL. Completed lysate reactions were subjected to size fractionation by centrifugation in a 5–25% sucrose gradient and their individual fractions chemically crosslinked with 0.250 mM bismaleimidohexane (BMH). Samples were resolved by SDS-PAGE and visualized by autoradiography. Adducts to STX5TMD are denoted with ×. (C) 35S-methionine-labeled model TA substrate STX5TMD, which has a C-terminal V5 epitope, was translated in crude RRL lysate in the presence of 15 µM of the indicated compounds. Translation reactions were subjected to chemical crosslinking (XL) with 0.250 mM BMH. Non-crosslinked samples were directly analyzed by SDS-PAGE. Crosslinked adducts to the TA protein substrate or ASNA1 were analyzed after denaturing immunoprecipitation (IP) with α-V5 or α-ASNA1 antibodies, respectively. For crosslinked products to GET4, samples were subjected to a non-denaturing IP with α-BAG6 antibody, which maintains the BAG6/GET4 interaction. Samples were visualized by autoradiography. Adducts to STX5TMD are denoted with ×. (D) Schematic of the TA protein transfer assay used in part e). Model TA substrate STX5TMD bound to SGTA is scaffolded into proximity with ASNA1 by a minimal BAG6 complex comprising the indicated components (see Shao et al., 2017 for more details). Substrate transfer to ASNA1 is detected by chemical crosslinking (XL) with BMH. (E) Purified SGTA bound to STX5TMD (SGTA~STX5TMD) and indicated recombinant TRC pathway components were incubated in the presence of 15 µM of DHQZ36.1 or DHQZ5 or mock treated (DMSO). Completed reactions were subjected to chemical crosslinking (XL) with 0.250 mM BMH. Crosslinked samples were resolved by SDS-PAGE and visualized by autoradiography (top) and Coomassie blue staining (bottom). Adducts to STX5TMD are denoted with ×. (F) The complex of 35S-methionine labeled SEC61B and SGTA (SGTA~SEC61B) was generated using the PURE system. Transfer reactions were assembled with wildtype ASNA1 or the putative Retro-2-resistant mutant of ASNA1 (A143V) in the presence of 1 µM DHQZ36.1. Substrate transfer to wildtype and mutant ASNA1 was detected by chemical crosslinking with disuccinimidyl suberate (DSS). Adducts to SEC61B are denoted with × and quantified using ImageJ.
Figure 5—figure supplement 1

In vitro analysis of DHQZ36.1’s effect on ER targeting.
(A) Crude RRL lysate was size-separated on a 5–25% sucrose gradient. The fractions were subjected to SDS-PAGE and visualized by immunoblotting for BAG6, ASNA1, SGTA, and GET4. (B) Uncropped version of the gels shown in Figure 5B. (C) In vitro translation of SEC61B in the presence of 35S-methionine and 15 µM DHQZ36.1 in crude rabbit reticulate lysate (RRL). Completed lysate reactions were subjected to size fractionation by centrifugation in a 5–25% sucrose gradient and their individual fractions chemically crosslinked with 0.250 mM bismaleimidohexane (BMH). Crosslinked samples were resolved by SDS-PAGE and visualized by autoradiography. Adducts to SEC61B are denoted with ×. (D) 35S-methionine-labeled SEC61B, which has C-terminal V5 epitope, was translated in crude RRL lysate in the presence of 15 µM of the indicated compounds. Translation reactions were subjected to chemical crosslinking (XL) with 0.250 mM BMH. Non-crosslinked samples were directly analyzed by SDS-PAGE. Crosslinked adducts to the TA protein substrate or ASNA1 were analyzed after denaturing immunoprecipitation (IP) with α-V5 or α-ASNA1 antibodies, respectively. For crosslinked products to GET4, samples were subjected to a non-denaturing IP with α-BAG6 antibody, which maintains the BAG6/GET4 interaction. Samples were visualized by autoradiography. Adducts to SEC61B are denoted with ×. (E) Representative data for SGTA~TA protein complex formation. In vitro translation of model TA substrate STX5TMD in the presence of 35S-methionine in PURE system supplemented with recombinant SGTA (final concentration of ~14 µM). Completed reactions were subjected to size fractionation by centrifugation in a 5–25% sucrose gradient. Fractions were analyzed by SDS-PAGE and visualized by Coomassie blue staining (top) and autoradiography (bottom). Fractions 3, 4, and five were pooled together and used as source of SGTA~STX5TMD in Figure 5E. * is a component of the PURE system (Mateja et al., 2015). (F) The complex of 35S-methionine labeled SEC61B and SGTA (SGTA~SEC61B) was generated using the PURE system. The transfer reactions were assembled with recombinant TRC pathway components in the presence of 15 µM of the indicated compounds and subjected to chemical crosslinking (XL) with 0.250 mM BMH. Samples were directly analyzed by SDS-PAGE, and autoradiography to visualize TA protein crosslinks (top), or Coomassie blue stain to detect the input proteins (bottom). Adducts to SEC61B are denoted with ×.
Figure 5—figure supplement 2
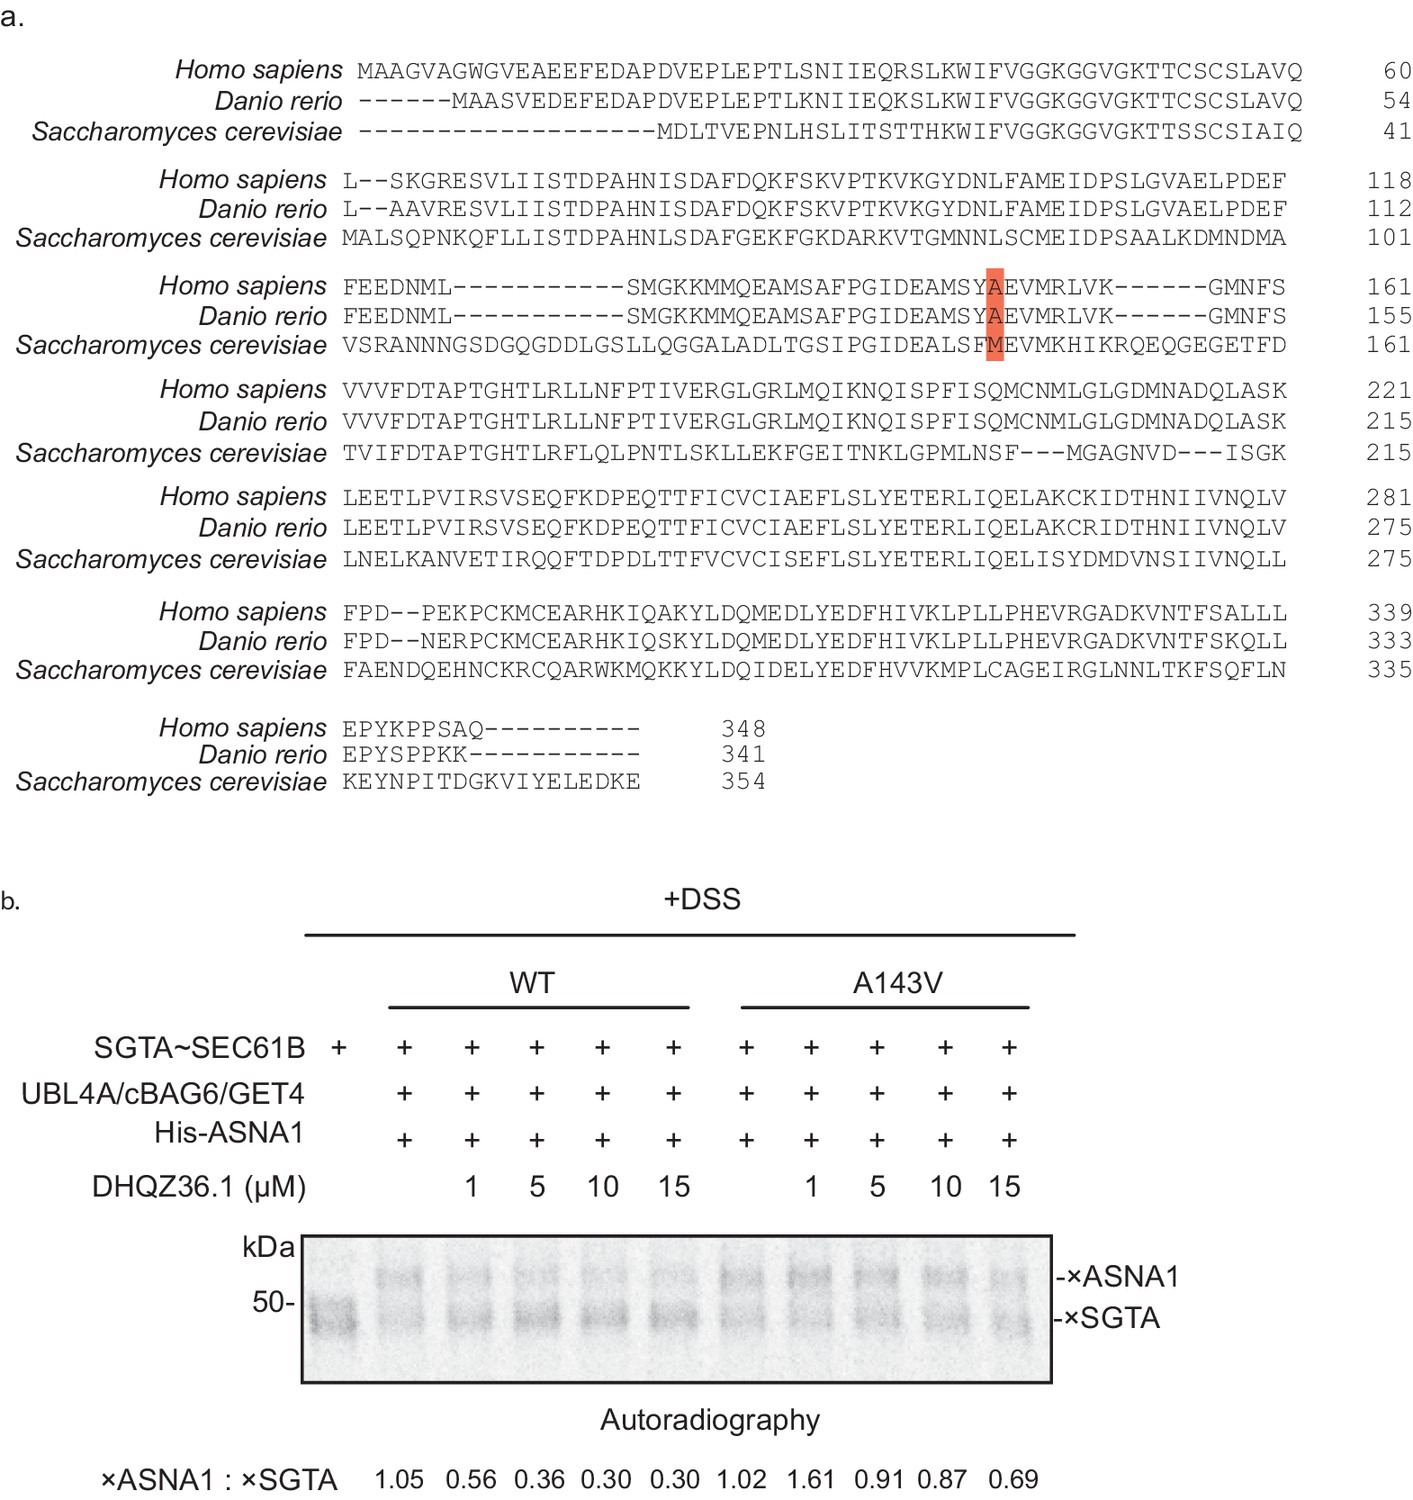
Biochemical analysis of mutant ASNA1.
(A) Clustal Omega amino acid sequence alignment of ASNA1 homologs from Homo Sapiens (NP_004308.2) and Danio rerio (NP_001002298.1) and Get3 from Saccharomyces cerevisiae (NP_010183.1). Highlighted in red is the location of the putative Retro-2 resistant residue. (B) The complex of 35S-methionine labeled SEC61B and SGTA (SGTA~SEC61B) was generated using the PURE system. Transfer reactions were assembled with wildtype ASNA1 or the putative Retro-2-resistant mutant of ASNA1 (A143V) in the presence of DHQZ36.1 at the indicated concentrations and subjected to chemical crosslinking with 0.200 mM disuccinimidyl suberate (DSS). Samples were directly analysed by SDS-PAGE and autoradiography to visualize TA protein crosslinks. Adducts to SEC61B are denoted with × and quantified using ImageJ.
Additional files
-
Transparent reporting form
- https://doi.org/10.7554/eLife.48434.019
Download links
A two-part list of links to download the article, or parts of the article, in various formats.
Downloads (link to download the article as PDF)
Open citations (links to open the citations from this article in various online reference manager services)
Cite this article (links to download the citations from this article in formats compatible with various reference manager tools)
Retro-2 protects cells from ricin toxicity by inhibiting ASNA1-mediated ER targeting and insertion of tail-anchored proteins
eLife 8:e48434.
https://doi.org/10.7554/eLife.48434


