Systematic genetic analysis of the MHC region reveals mechanistic underpinnings of HLA type associations with disease
- University of California, San Diego, United States
- Rady Children’s Hospital, University of California, San Diego, United States
- European Molecular Biology Laboratory, European Bioinformatics Institute, United Kingdom
Figures
Figure 1
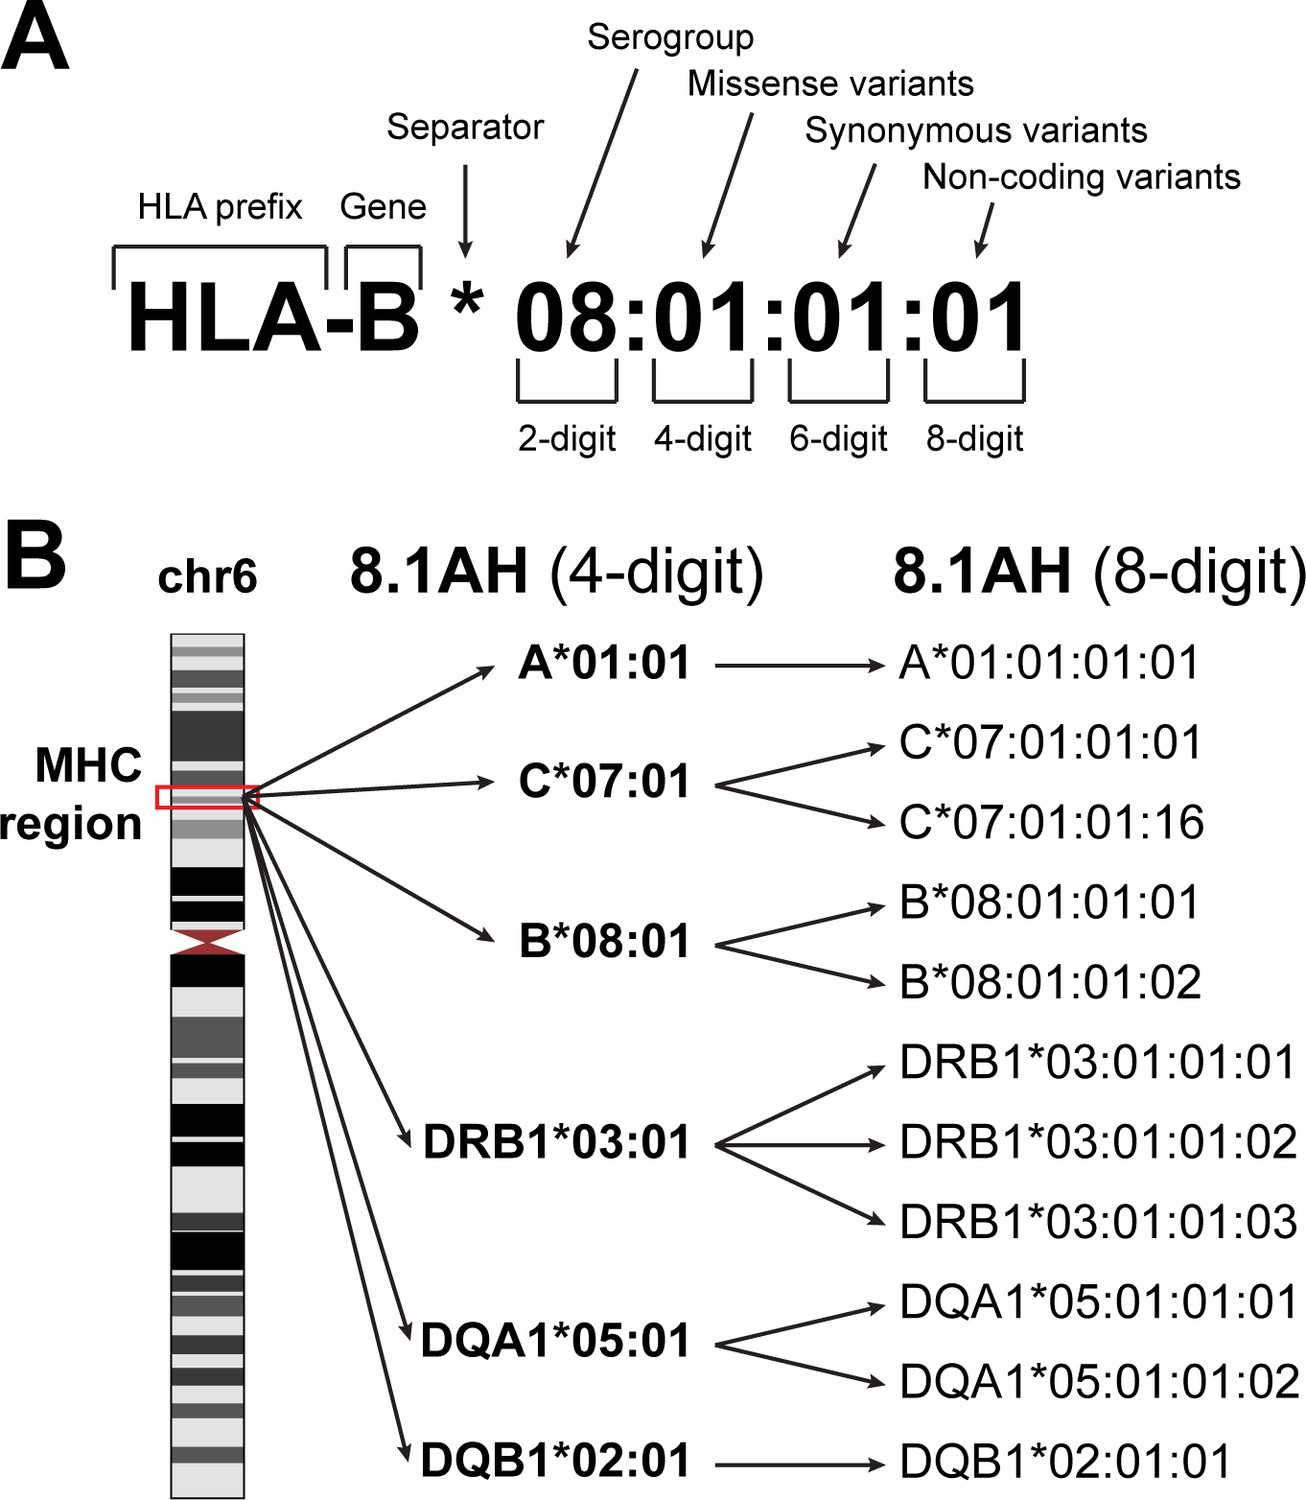
HLA nomenclature.
(A) Description of an HLA type (allele) using current standard nomenclature. The first two digits typically correspond to the serological antigen. The third and fourth digits distinguish HLA types that differ by one or more missense variants. The fifth and sixth digits distinguish HLA types that differ by one or more synonymous variants. The seven and eight digits distinguish HLA types that differ by noncoding variants. (B) The location of the MHC region on chromosome 6 (left). The 8.1 ancestral haplotype (8.1AH) is comprised of six HLA types (corresponding to six HLA genes) typically reported at four-digit resolution (middle). For each of the six HLA genes, we identified one to three eight-digit resolution HLA types that can be collapsed into their 8.1AH four-digit counterparts (right).
Figure 2 with 1 supplement

WGS coverage in MHC region and HLA types.
(A) SNP density distribution in consecutive 10 kb bins in the HLA region (chr6: 29690551, 33102442). The dashed lines represent the chromosome-wide SNP density in the iPSCORE (blue) and HipSci (red) WGS samples. The 30 HLA genes analysed in this study are represented by diamonds with green representing HLA Class I, purple HLA Class I pseudogenes, orange HLA Class II and yellow non-HLA genes. The four-digit HLA types for the six genes composing the 8.1AH are shown in red. (B) Read depth coverage of the HLA region for the iPSCORE WGS samples (top, red) and the HipSci WGS samples (bottom, blue) was calculated using consecutive 10 kb bins. Each line represents a single WGS sample, the black dashed lines represent the average coverage for the iPSCORE WGS samples (52X) and the HipSci WGS samples (38X). (C, D) Fraction of the 273 iPSCORE (C) and 377 HipSci (D) WGS samples with homozygous, heterozygous and undetermined alleles for each of the 30 HLA genes. For each sample, if one of the two alleles for an HLA gene was undetermined, we considered the HLA genotype as ‘undetermined’. (E) Twin concordance (iPSCORE: 25 monozygotic twin pairs), (F) Mendelian inheritance concordance (iPSCORE: 17 trios) and (G) Fibroblast-iPSC concordance (HipSci: 231 fibroblast-iPSC pairs) of HLA types at eight-digit resolution. Genes were sorted based on their genomic position and colored according to their class, as shown in panel A. The red dashed line represents the median across all genes.
Figure 2—figure supplement 1
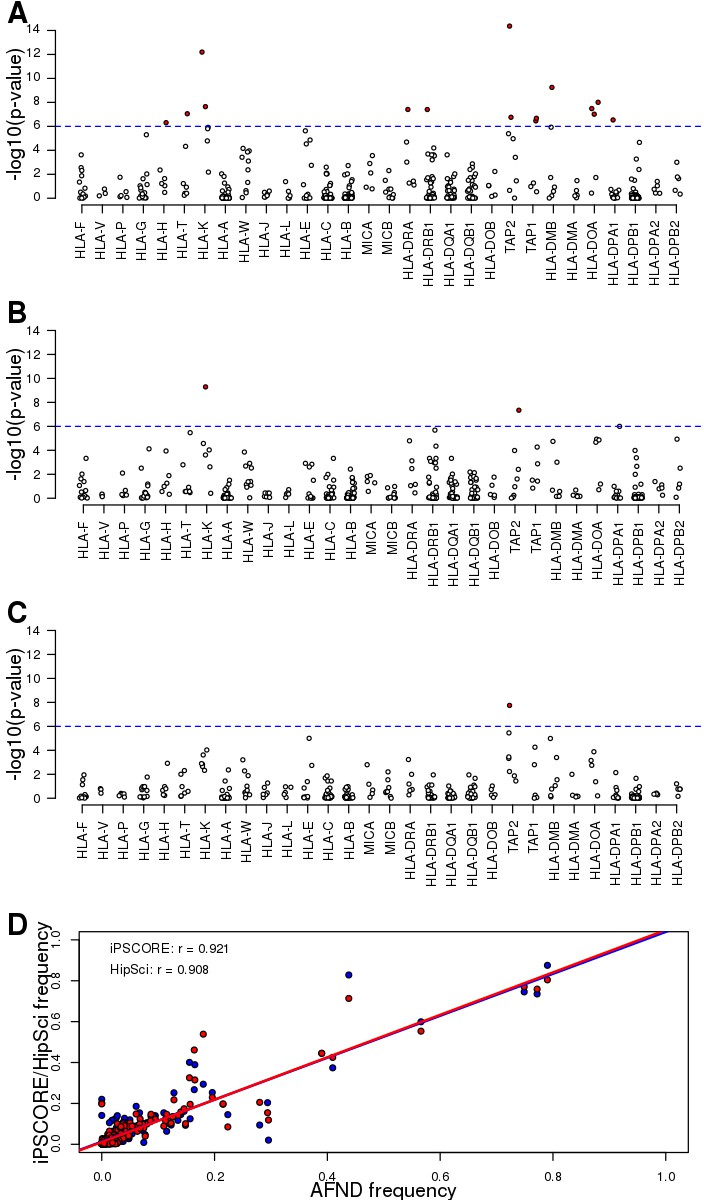
Allele frequencies of predicted HLA types.
(A–C) Scatterplots showing the Hardy Weinberg test p-value for each HLA allele across (A) all unrelated Caucasian individuals, (B) unrelated Caucasian iPSCORE individuals and (C) unrelated Caucasian HipSci individuals. Red dots represent significant deviations from HWE (Bonferroni-corrected p-values<0.1). (D) Correlation between HLA allele frequency at the 4-digit resolution (identified by collapsing 8-digit HLA types) between individuals in the Allele Frequency Net Database (AFND) and either iPSCORE (red) or HipSci (blue). Each dot represents the frequency for a given HLA allele for unrelated individuals.
Figure 3 with 2 supplements
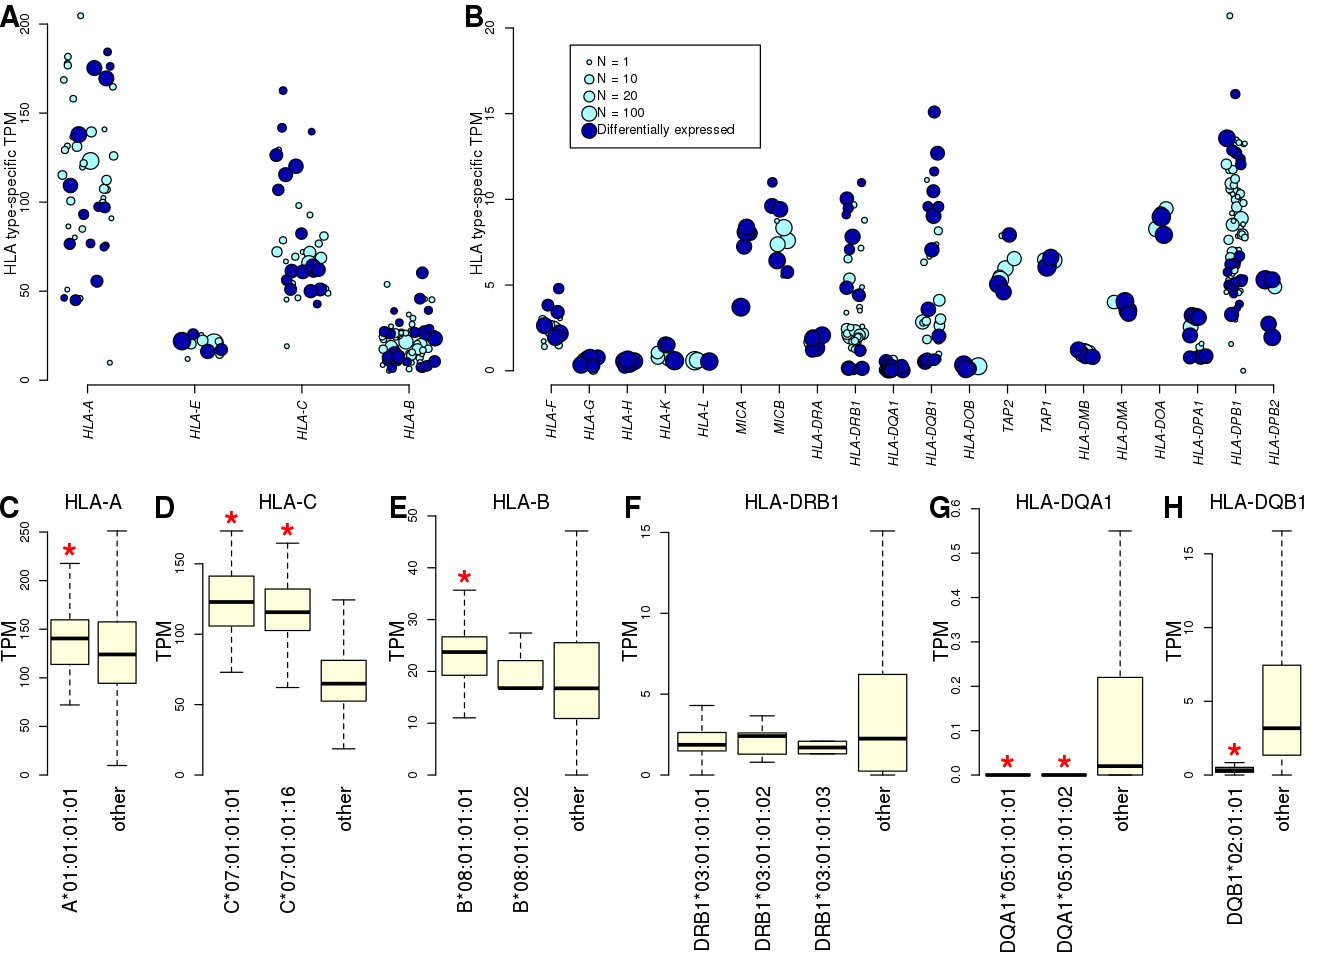
Allele-specific expression of HLA genes in iPSCs.
(A, B) Mean TPM expression across HLA types: (A) shows the four HLA genes with highest expression levels (mean TPM >20); and (B) shows lower expressed HLA genes (mean TPM <20). Each point represents one allele. Point size represents the number of individuals carrying each allele. All HLA types are shown, although differential gene expression analysis (Supplementary file 5) was performed only on those present in at least two individuals. Eight-digit HLA-types significantly associated with the expression of their cognate HLA gene are shown in dark blue. (C–H) Boxplots showing mean expression of the eight-digit 8.1AH HLA types (Figure 1) compared with the mean expression of all the other HLA types for the cognate gene. Red stars indicate that the mean expression of the ancestral haplotype HLA type is significantly different (Supplementary file 5).
Figure 3—figure supplement 1
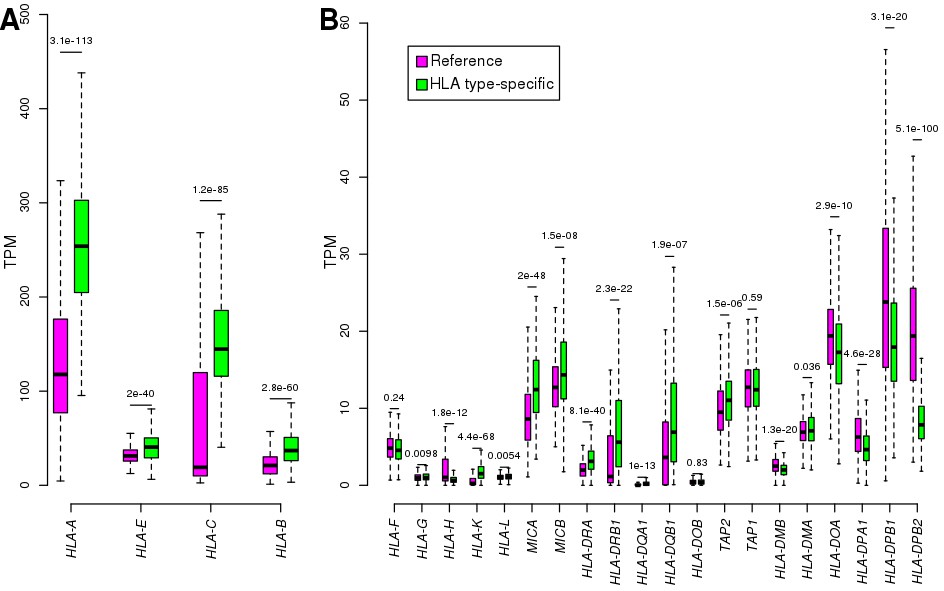
Comparing reference and HLA type-specific TPM.
For each of the 24 expressed HLA genes, boxplots show the distribution of TPM calculated by aligning RNA-seq reads to reference cDNA sequences (purple) and by aligning to HLA type-specific cDNA sequences (green): (A) shows the four HLA genes with highest expression levels (TPM >20); and (B) shows the HLA genes with mean TPM <20. To compare reference and HLA type-specific expression levels (TPMs), we transformed the HLA type-specific expression levels to gene-level expression by summing the expression of the two HLA types in each individual. Nominal p-values are shown for each gene (calculated using paired t-test between reference and HLA type-specific TPM in each sample). The HLA class I genes, which are expressed ubiquitously, tended to be expressed significantly higher using HLA type-specific alignments, whereas most class II genes, which are expressed mostly in immune cells, were expressed significantly lower in the iPSCs using the HLA type-specific alignments. For instance, we observed that in many samples the expression of HLA-C was low (<40 TPM) using reference alignments, but it increased more than four-fold using HLA-specific alignments; while HLA-DPB2 expression decreased in 98% of samples. Our analyses (here and in Figure S3) and those of others (Aguiar et al., 2019; Panousis et al., 2014) suggests that HLA gene expression level estimates are improved by aligning RNA-seq reads to HLA type-specific cDNA sequences.
Figure 3—figure supplement 2
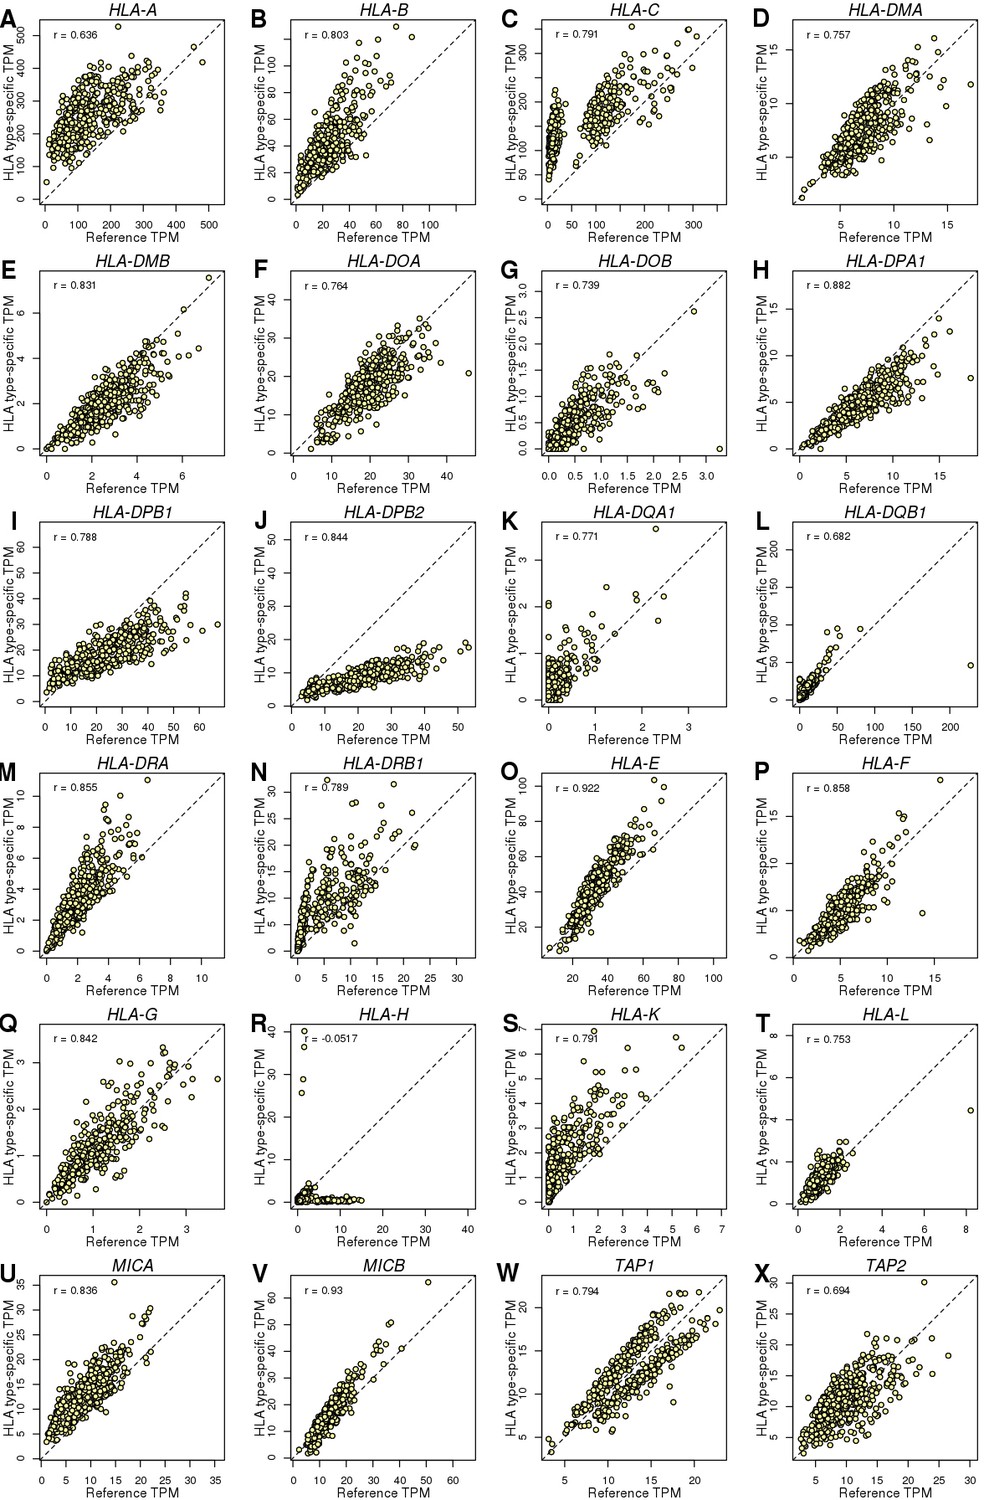
HLA genes – Reference versus HLA type-specific expression.
Scatterplots showing the differences between TPM calculated by aligning RNA-seq reads to reference cDNA sequences (X axis) and HLA type-specific cDNA sequences (Y axis). To determine whether aligning RNA-seq data to HLA type-specific cDNA sequences improved predicted gene expression levels, we tested the differences between reference and HLA type-specific TPM and found that their correlation ranged between −0.052 (HLA-H; panel R) and 0.93 (MICB; panel V). However, only HLA-H which had very low expression levels (median HLA type-specific TPM = 1.1) had correlation < 0.6. These data suggest that a substantial portion of the gene expression heterogeneity captured when estimating expression levels from RNA-seq reads aligned to HLA type-specific cDNA sequences is not detected when RNA-seq reads are aligned to reference cDNA sequences. We calculated this fraction as 1 – R2 and found that it accounts for 0.13 (MICB) to 0.59 (HLA-A).
Figure 4 with 5 supplements
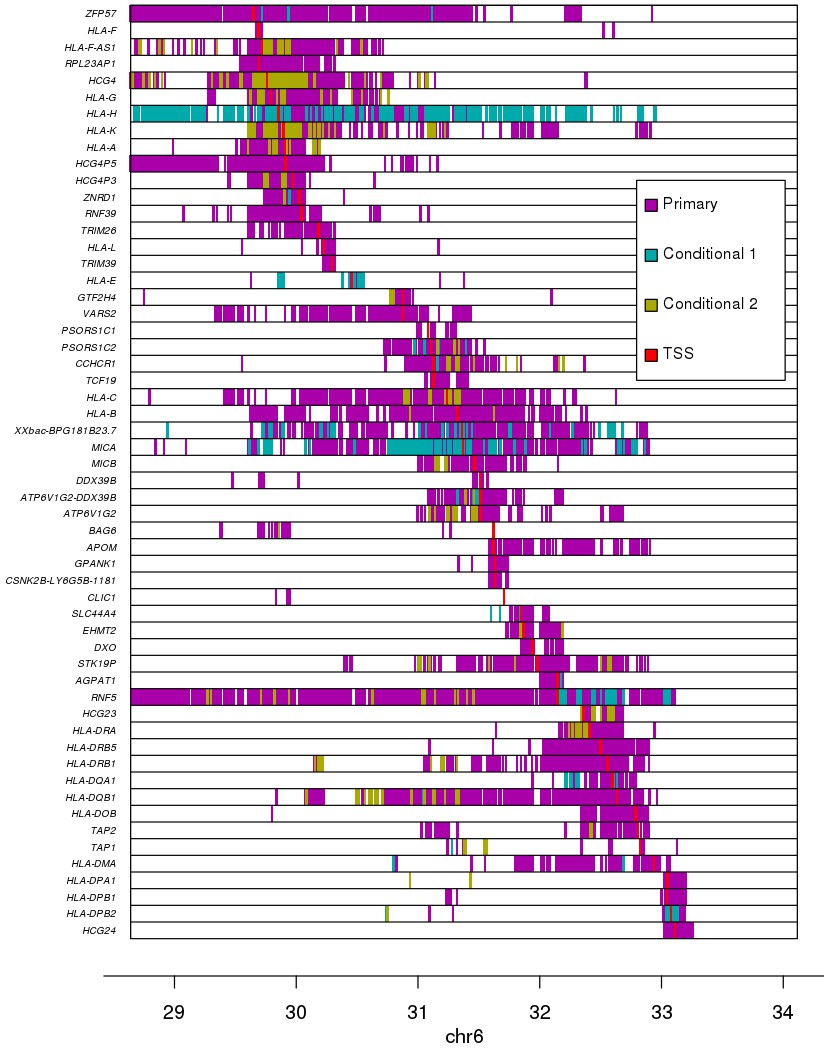
Associations between variants and gene expression levels in the MHC region.
eQTL associations for 56 genes in the MHC region. Colors represent whether each eQTL is primary or conditional: ‘conditional 1’ refers to eQTLs independent from the lead eQTL and ‘conditional 2’ refers to eQTLs independent from the lead eQTL and the lead ‘conditional 1’ eQTL. TSS for each gene is shown in red.
Figure 4—figure supplement 1
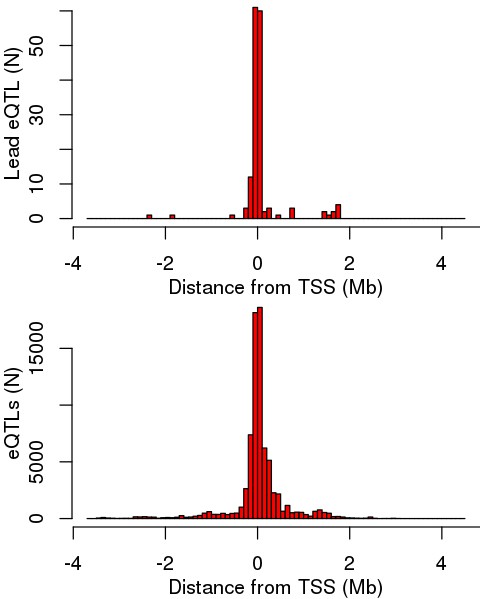
Distance of eQTLs from TSS.
Distance distributions for the lead eQTL (top) and for all significant primary eQTLs (bottom) from the TSS of the cognate eGene.
Figure 4—figure supplement 2

Lead eQTL associations for each eGene.
Boxplots showing the expression levels of each of the 56 eGenes divided by the genotype of the lead eQTL. Above each plot the gene name and position of the lead eQTL are shown. Below each box the genotype and the number of samples associated with each genotype are indicated.
Figure 4—figure supplement 3
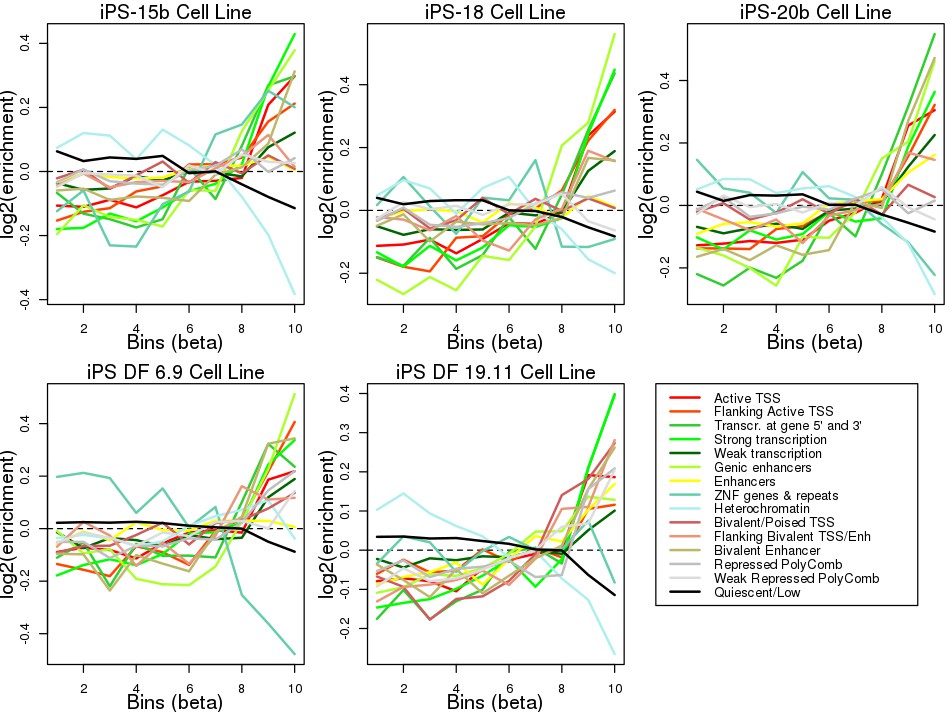
Enrichment of eQTLs in regulatory elements.
Plots showing the log2 enrichment of each chromatin mark in each of five Roadmap iPSC lines across ten eQTL effect size bins (X axis). To determine if the MHC eQTLs were enriched for localization in regulatory elements, we tested their overlap with chromatin states in five iPSC lines from the Roadmap Epigenomics Consortium (Kundaje et al., 2015). We determined the overlap of each of the 45,245 variants tested for eQTLs with 15 ChromHMM chromatin states (Ernst and Kellis, 2012) in each Roadmap iPSC line, divided all eQTLs into bins according to their absolute effect size and calculated the relative enrichment for each chromatin state in each bin (see Materials and methods). We observed that, across all five iPSC lines, larger effect size bins (corresponding to stronger eQTLs) were enriched for including variants at active transcription start sites (TSS), regions flanking active TSS, UTRs (defined as regions transcribed at 5’ and 3’), transcribed regions and, in two iPSC lines (iPS-20b and iPS DF 19.11) enhancers. Conversely, strong effect size bins were depleted for quiescent regions, heterochromatin and ZNF genes and repeats. These results show that eQTLs in the MHC region are enriched for occurring in regulatory elements active in iPSCs.
Figure 4—figure supplement 4
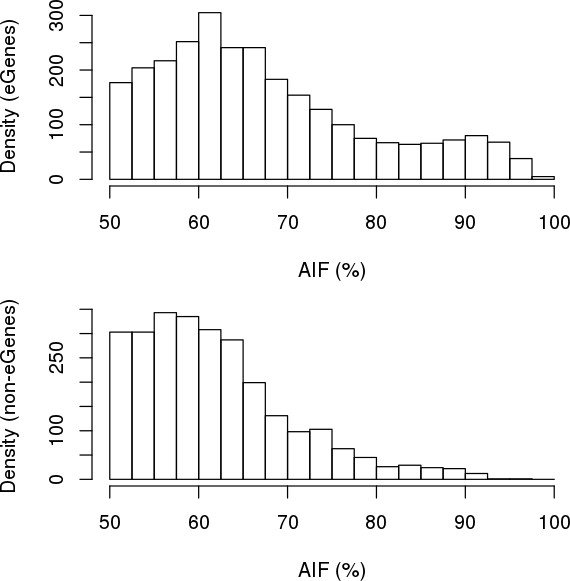
Comparing ASE between eGenes and non-eGenes.
The strength of ASE for each gene was defined as the fraction of RNA transcripts that were estimated to originate from the allele with higher expression (hereto referred to as ‘allelic imbalance fraction’, AIF). Histograms showing the distribution differences in AIF calculated using MBASED on 215 iPSCORE individuals between the 56 eGenes (top) and the 90 expressed genes in the MHC region that were not eGenes (bottom).
Figure 4—figure supplement 5
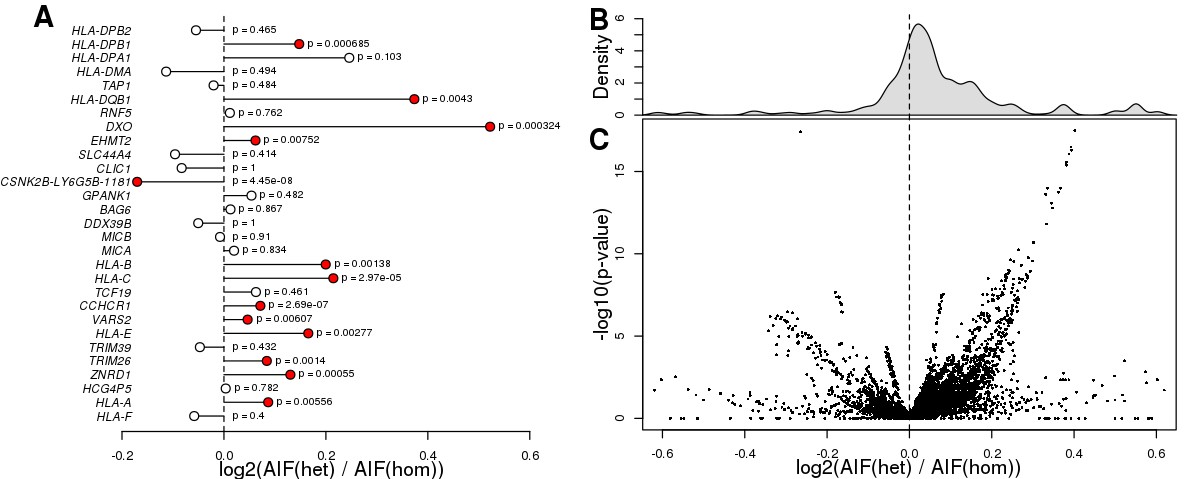
eGenes with heterozygous eQTL variants are enriched for ASE.
(A) Plot showing that eGenes in samples with a heterozygous lead eQTL have larger AIF than samples homozygous for the lead eQTL. There were 29 eGenes that could be tested (i.e., with at least one heterozygous coding variant with significant AIF, at least one sample heterozygous for the lead eQTL, and at least one homozygous sample). We examined ASE (calculated as the log2 of the ratio between the mean AIF for samples heterozygous for the lead eQTL and the mean AIF for the homozygous samples) for these 29 eGenes. We observed 13 eGenes with significantly different ASE distributions, 12 of which showed stronger ASE in samples with heterozygous lead eQTLs, and one (the chimera gene CSNK2B-LY6G5B-1181) which showed stronger ASE in samples with homozygous lead eQTLs (Benjamini-Hochberg-corrected p-values<0.1, Mann-Whitney U test). (B, C) Histogram and volcano plot showing that eGenes in samples with heterozygous eQTLs (primary and conditional) had more significant AIF than in samples with homozygous eQTLs. For each of the 29 eGenes examined in panel A, we tested all associated eQTLs (there were 39,891 eQTLs in total, corresponding to 21,739 variants). Each dot in the volcano plot represents the results of one eQTL-eGene pair (each eGene had thousands of primary and conditional eQTLs). We found that for 28,841 (72.3%) of the eQTL-eGene pairs, the eGene showed significantly increased ASE in samples with heterozygous eQTLs compared with samples carrying homozygous eQTLs. P-values were calculated using Mann-Whitney U test.
Figure 5
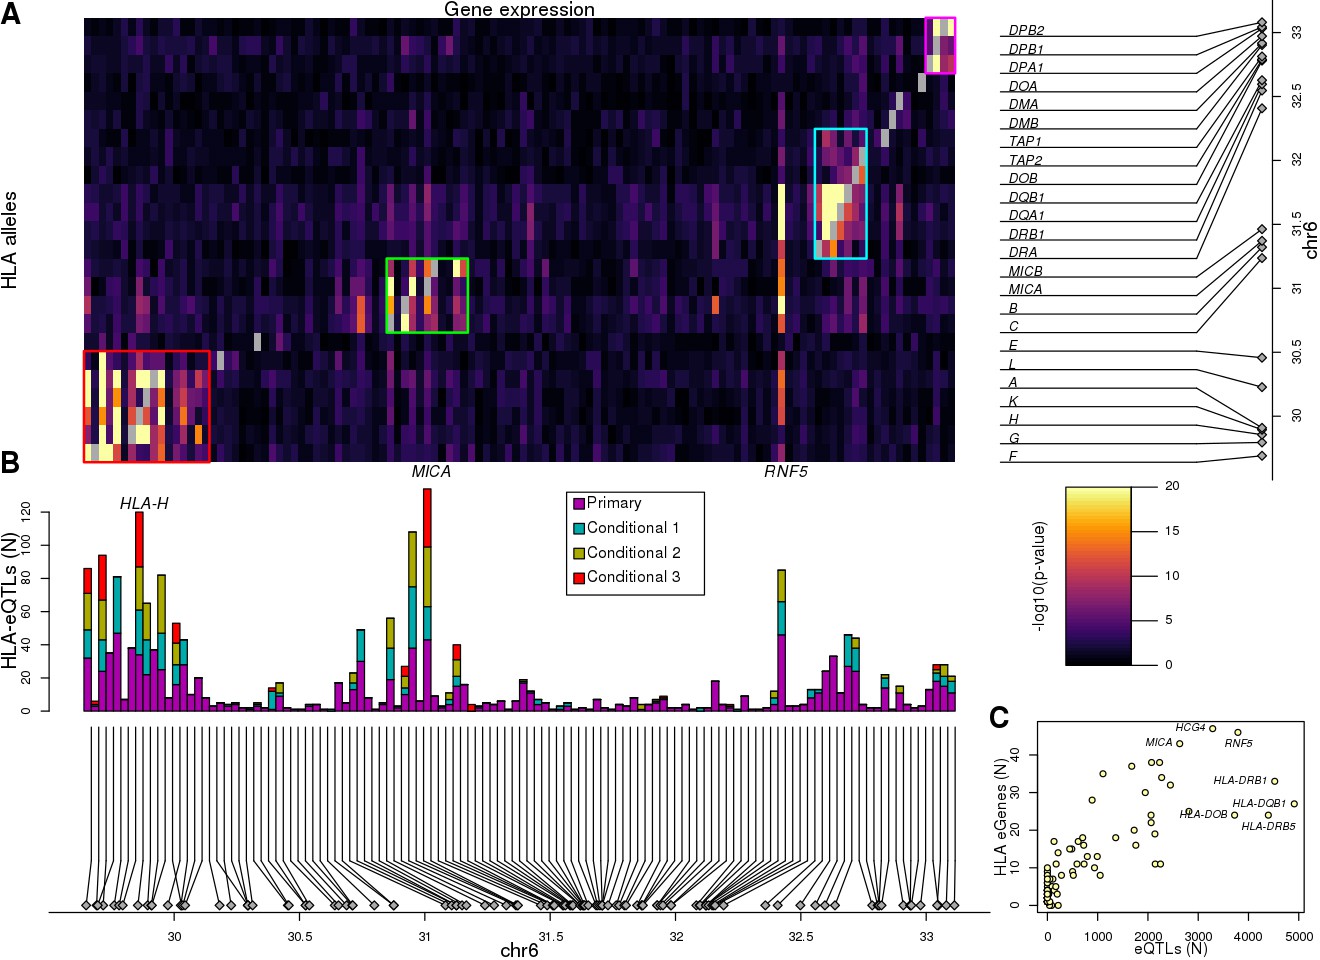
Associations between HLA types and gene expression levels in the MHC region.
(A) Heatmap showing the associations between HLA types at 8-digit resolution (Y axis) and the expression of 114 genes in the MHC region (X axis). For eGenes associated with multiple HLA-type eQTLs, only the most significant p-value is shown. Self-associations between the expression of each HLA gene and its HLA types were not considered (grey squares). Four different groups of genes with shared HLA-eQTLs are outlined in different colors. (B) Barplot showing for each of the 114 genes in the heatmap in (A), the number of primary and conditional associations (adjusted based on the lead eQTL, the top two independent eQTLs, or the top three independent eQTLs) between HLA types and gene expression levels. ‘Conditional 1’ refers to HLA-eQTLs conditional on the lead primary SNP eQTL, ‘Conditional 2’ refers to HLA-eQTLs conditional on the lead primary and lead conditional 1 eQTLs and ‘Conditional 3’ refers to HLA-eQTLs conditional on the lead primary, conditional 1 and conditional 2 eQTLs. (C) Scatterplot showing the number of primary eQTLs (X axis) and the number of primary HLA-type eQTLs (Y axis) for the 52 genes that had both eQTLs and HLA-type eQTLs.
Figure 6
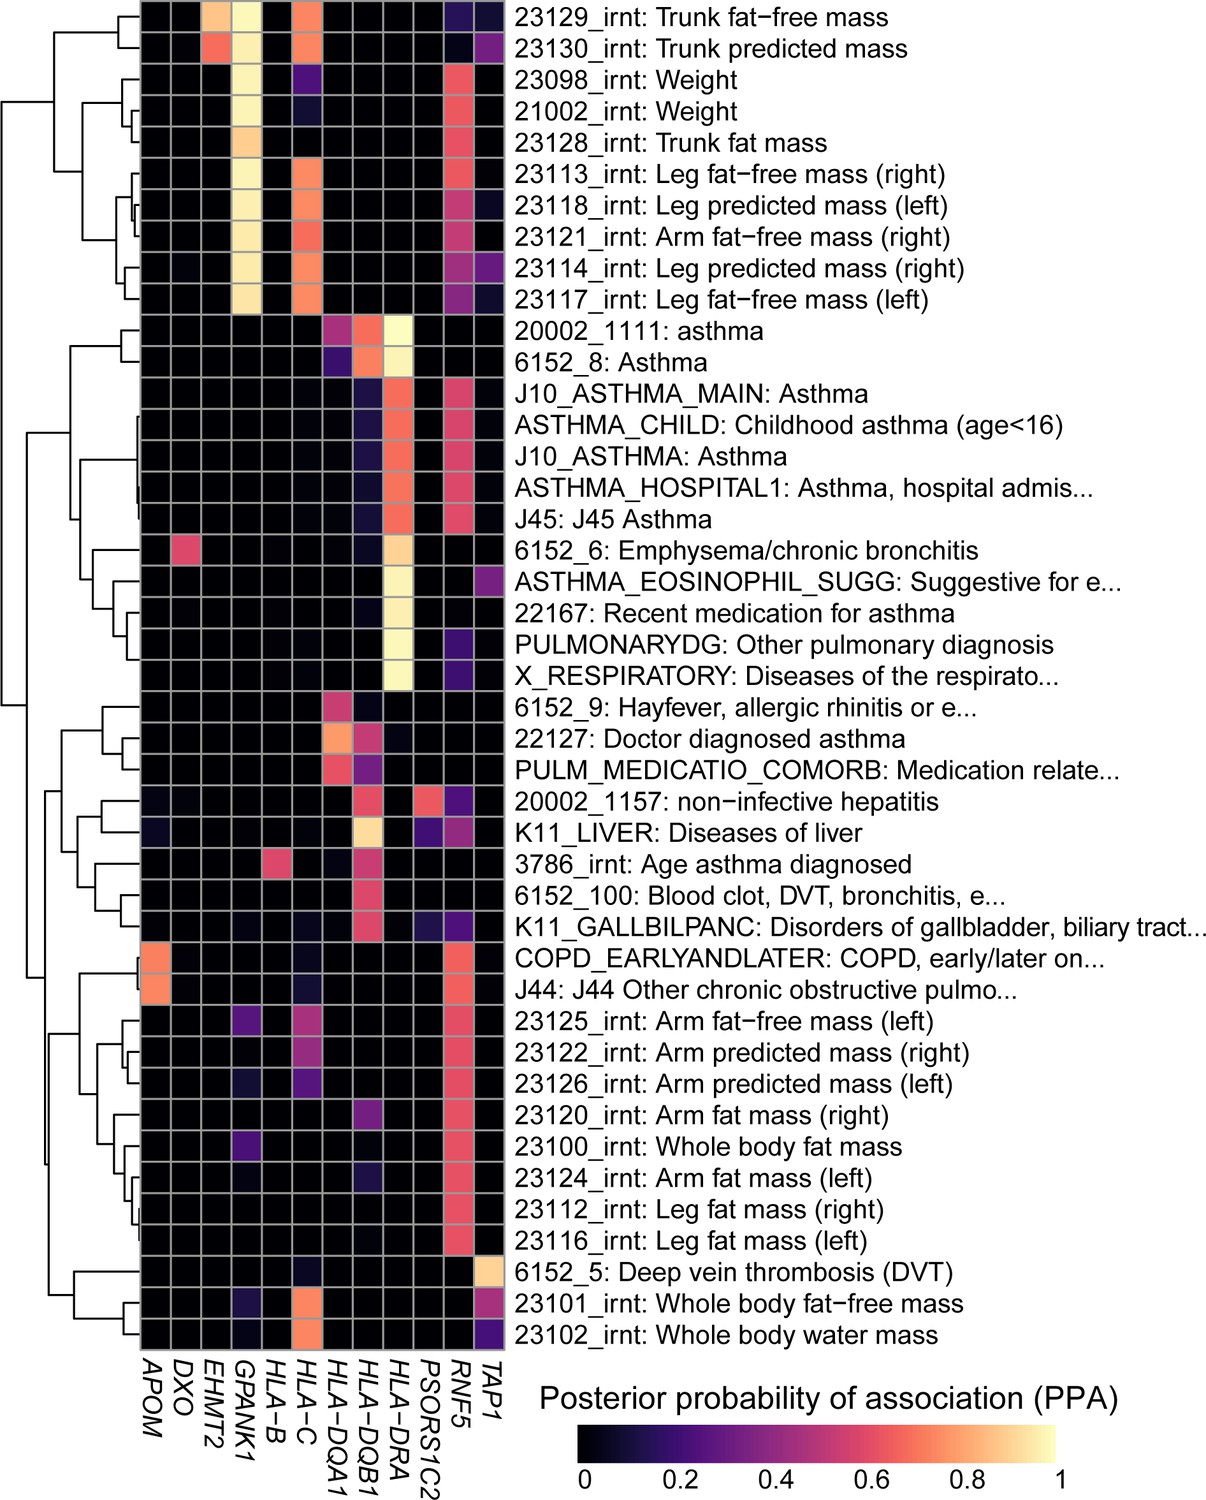
Colocalization results.
Heatmap showing the posterior probability of association (PPA) for colocalization (Giambartolomei et al., 2014) between an eQTL for the indicated eGene (columns) and a GWAS signal for the indicated trait (rows). GWAS traits in Supplementary file 8 were filtered to include those having at least one eGene with PPA > 0.5 and the following terms in their description: ‘asthma’, ‘pulmonary’, ‘mass’, ‘weight’, ‘fat’, ‘liver diseases’ and/or ‘biliary tract diseases’. Associations with PPA > 0.2 for all 4,083 UKBB traits are reported in Supplementary file 8.
Figure 7 with 1 supplement
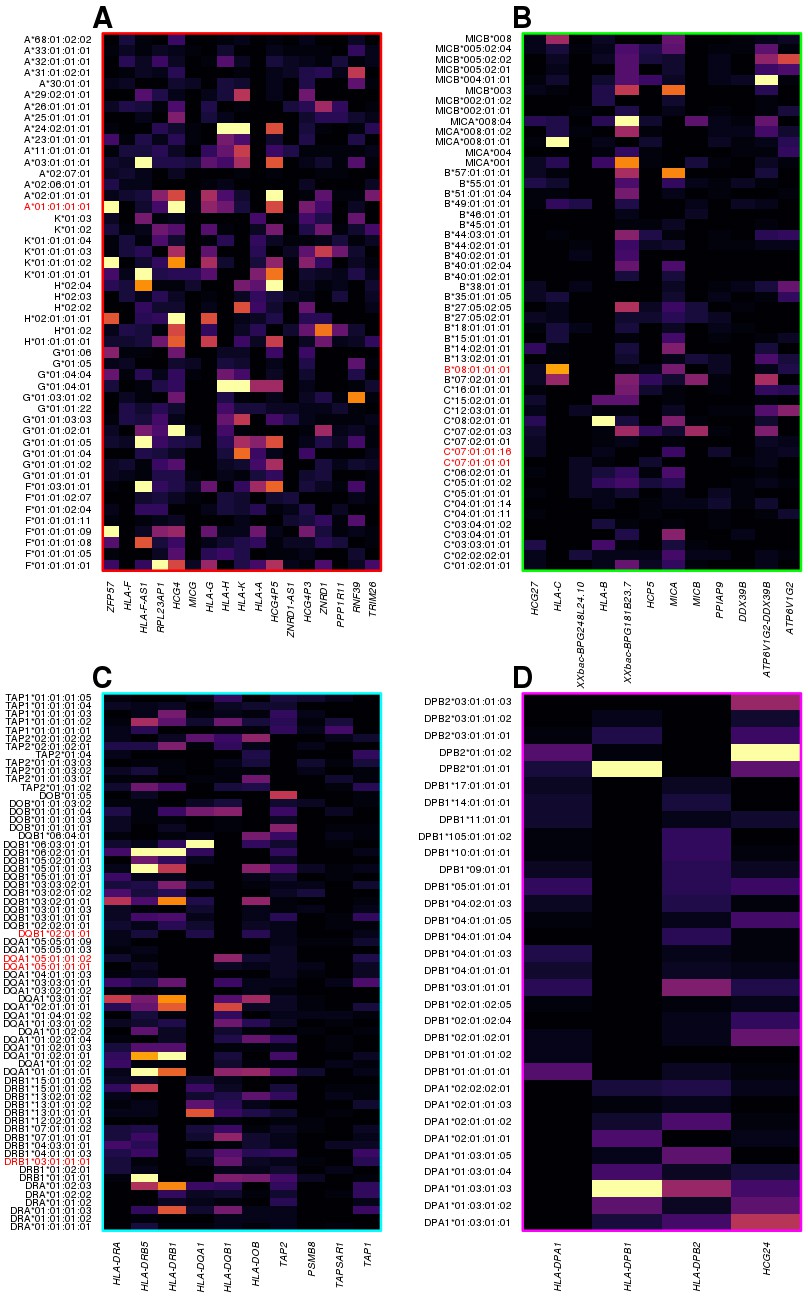
HLA-type eQTLs for HLA genes in the four clusters shown in Figure 6.
Heatmaps showing, for each of the four clusters identified in Figure 6, the associations between HLA-type eQTLs and gene expression. Each column represents an eGene, while rows represent all HLA-type eQTLs associated with other genes in the cluster. 8.1AH HLA types are highlighted in red. The heatmaps show that the HLA-type eQTLs capture regulatory variants associated with the expression levels of neighboring genes.
Figure 7—figure supplement 1
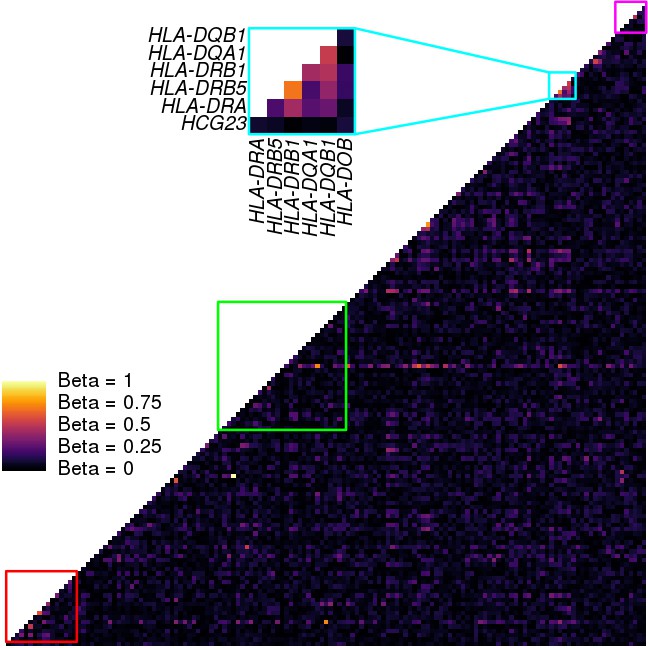
Coexpression analysis of the MHC region.
Heatmap showing the coexpression values between each pair of genes in the MHC region (146 expressed genes). Coexpression was calculated using a linear model that takes the covariates used in the eQTL analysis into account. Colored squares represent the clusters described in Figures 5,7. Only cluster three in the HLA class II region showed significant coexpression of HLA genes.
Figure 8 with 1 supplement
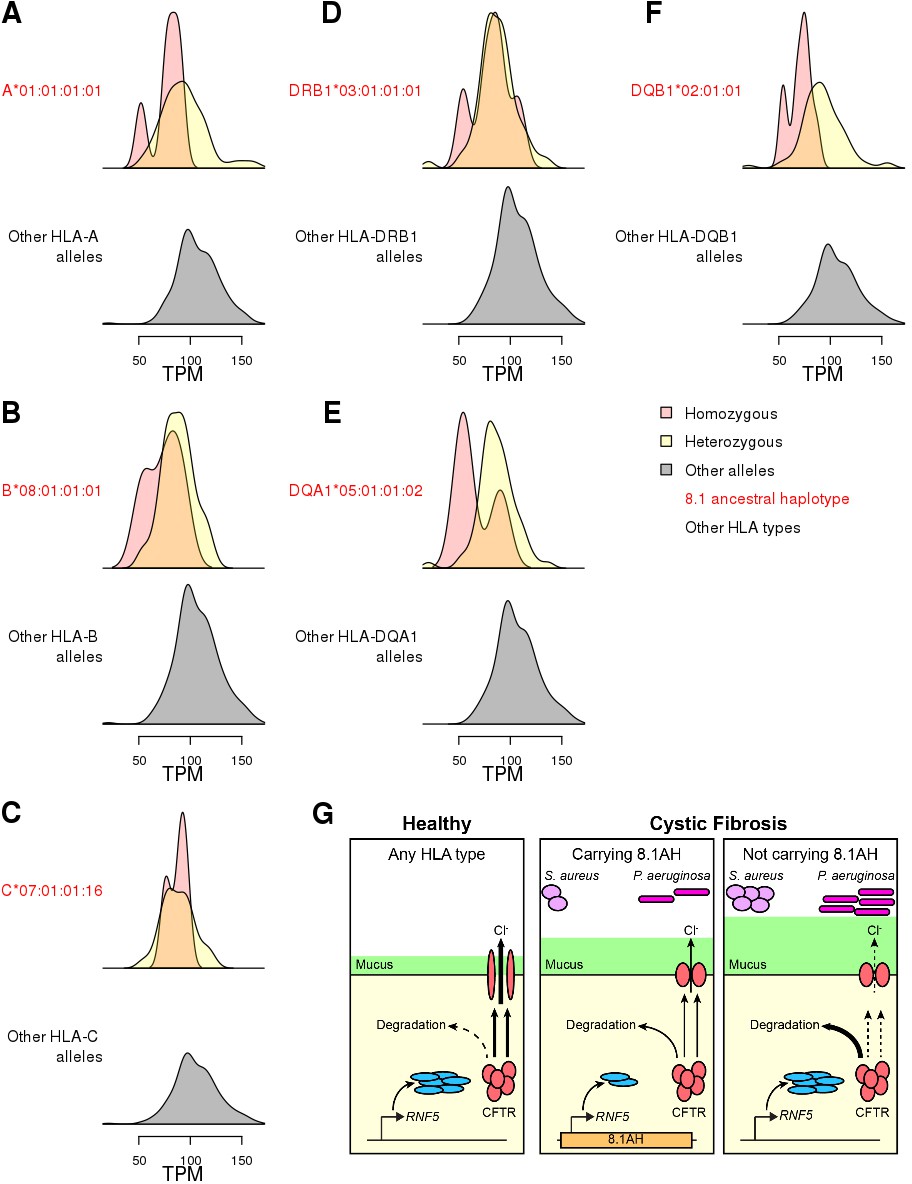
Associations between HLA-type eQTLs, RNF5 expression and Cystic Fibrosis.
(A–F) Distributions of RNF5 expression levels in samples that are homozygous (red) and heterozygous (yellow) for significant HLA-type eQTLs corresponding to 8.1AH HLA alleles. RNF5 expression distributions for all samples that do not carry the indicated 8.1AH HLA alleles are shown in grey. RNF5 expression distributions for all significant HLA-type eQTLs that are not part of the 8.1AH are shown in Figure 8—figure supplement 1. (G) Cartoon depicting proposed model of the molecular mechanisms underlying the associations between 8.1AH, RNF5 expression and CFTR function in CF. On the left, in healthy individuals, CFTR is correctly folded in the airway epithelium and Cl- ions can be secreted. On the right, in CF patients not carrying 8.1AH, CFTR is misfolded and high levels of RNF5 result in its degradation which, in turn, results in decreased Cl- secretion, mucus hypersecretion and colonization by S. aureus and P. aeruginosa. In the middle, in CF patients carrying 8.1AH, RNF5 is expressed at low levels, resulting in the lower levels of RNF5, less degradation of the misfolded mutated CFTR protein, improved Cl- secretion, lower mucus secretion and delayed colonization by S. aureus and P. aeruginosa.
Figure 8—figure supplement 1
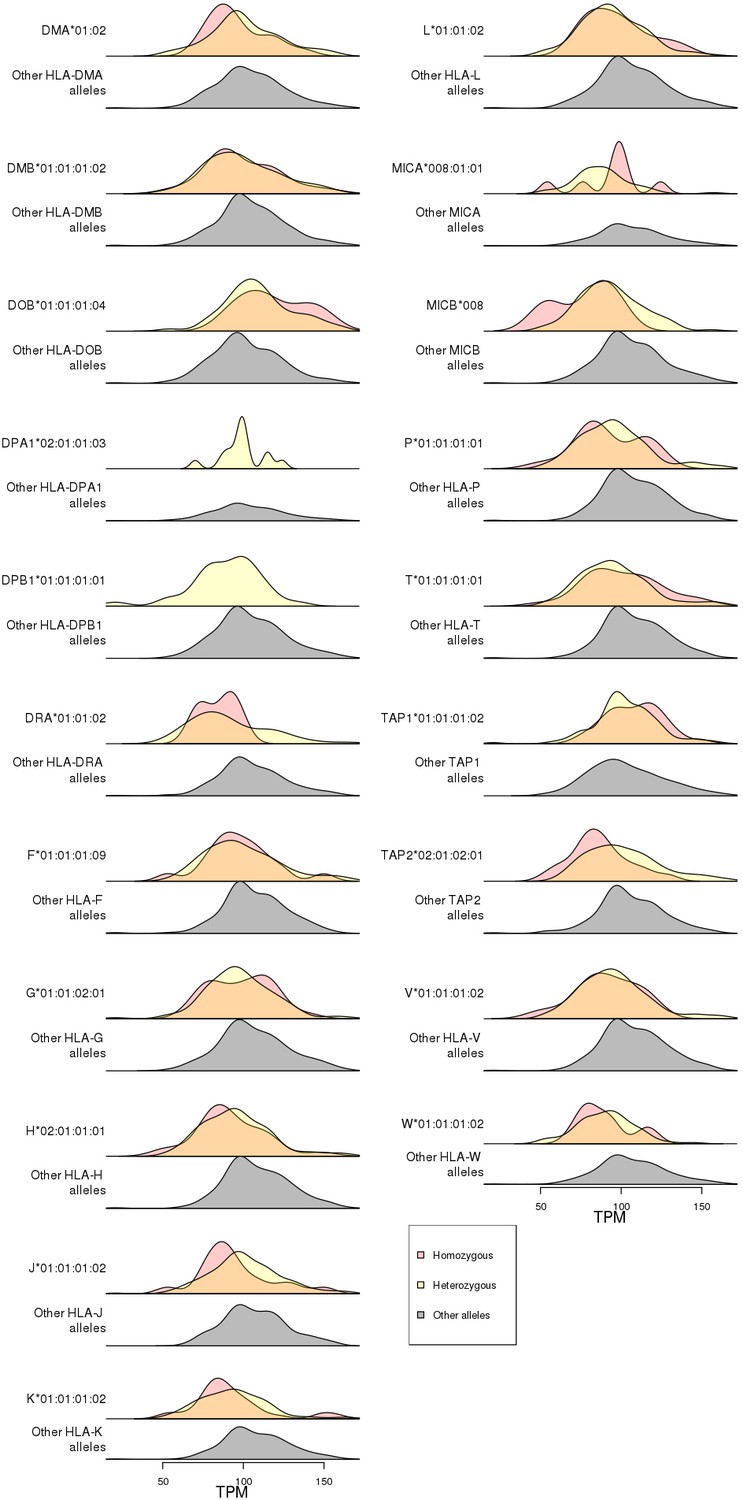
Association of RNF5 expression levels with HLA-type eQTLs.
Distributions of RNF5 expression levels in samples that are homozygous (red) and heterozygous (yellow) for significant HLA-type eQTLs not present in the 8.1 ancestral haplotype (Figure 8). RNF5 expression distributions for all samples that do not carry the indicated HLA alleles are shown in gray.
Tables
Key resources table
| Reagent type (species) or resource | Designation | Source or reference | Identifiers | Additional information |
|---|---|---|---|---|
| Software, algorithm | GATK | (Van der Auwera et al., 2013; Zhang et al., 2017) | ||
| Software, algorithm | HLA-VBSeq | (Nariai et al., 2015) | ||
| Software, algorithm | SAMtools version 1.2 | (Li et al., 2009) | ||
| Software, algorithm | STAR (2.5.0a) | (Dobin et al., 2013; Harrow et al., 2012) | ||
| Software, algorithm | RSEM (1.2.20) | (Li and Dewey, 2011) | ||
| Software, algorithm | bcftools | (Li et al., 2009) | ||
| Software, algorithm | lmekin (coxme package) | R 3.5.1 | ||
| Software, algorithm | MBASED | (Mayba et al., 2014) | ||
| Software, algorithm | coloc.abf (coloc package) | R 3.5.1 (Giambartolomei et al., 2014) |
Additional files
-
Supplementary file 1
HLA alleles in the 273 iPSCORE subjects and 146 HipSci individuals.
(A) HLA types for each iPSCORE individual which includes a row for each gene and a column for the first and second allele. Individuals may be heterozygous, homozygous, or undetermined for one or both alleles. Refer to the Materials and methods section for more details. (B) HLA types for 146 HipSci individuals. For each individual, HLA types derived from both fibroblasts and iPSCs are reported. Individuals with multiple iPSC clones are shown on multiple rows (one row per iPSC clone).
- https://cdn.elifesciences.org/articles/48476/elife-48476-supp1-v2.xlsx
-
Supplementary file 2
Unique identifiers for subjects, whole genome sequence and RNA-seq data.
The Supplementary File hows for the 446 iPSC samples used in the gene expression and eQTL analyses, the UUID identifiers for iPSCORE data and unique identifiers for HipSci data (subject ID, WGS ID and RNA-seq ID).
- https://cdn.elifesciences.org/articles/48476/elife-48476-supp2-v2.xlsx
-
Supplementary file 3
Description of iPSCORE study and HipSci study individuals’.
(A) Metadata for subjects in the iPSCORE resource which includes family information, sex, age at enrollment, ethnicity and whether an iPSC clone derived from the subject was used for gene expression analyses. Family information includes a family identifier as well as mother, father, trio and monozygotic twin of which the latter can be used to subset trios and twins respectively. The mother and father columns contain a unique identifier for subjects which participated in the study, empty if parents did not undergo WGS. Ethnicity information is reported in three distinct ways: 1) self-reported information; 2) self-reported information translated into one of seven groups (African American, Asian, European, Hispanic, Indian, Middle Eastern, and Multiple ethnicities reported); and 3) expected superpopulation (SP) from the 1000 Genomes Project. Individuals with iPSCs used in the gene expression analyses are indicated. (B) Metadata for HipSci subjects, including unique subject ID, sex, age at enrollment and ethnicity. All HipSci individuals were unrelated.
- https://cdn.elifesciences.org/articles/48476/elife-48476-supp3-v2.xlsx
-
Supplementary file 4
Expression levels of HLA genes.
Matrix showing TPM for each HLA gene (columns) in each of the 446 iPSC samples (rows). TPM values are shown for expression estimated obtained by aligning RNA-seq transcripts to (A) reference cDNA sequences and (B) HLA type-specific cDNA sequences. Row names include RNA-seq unique identifiers (Supplementary file 2).
- https://cdn.elifesciences.org/articles/48476/elife-48476-supp4-v2.xlsx
-
Supplementary file 5
Expression differences between HLA types.
For each gene, HLA type, the number of alleles across the 361 individuals with iPSCs, and mean expression (TPM) using HLA type-specific estimates. The p-value (t-test) was calculated by comparing the expression of the HLA type indicated in column B with the expression levels of all the other HLA types for the same cognate gene. The FDR (Benjamini-Hochberg) is shown in column F. All associations with FDR-adjusted p-value<0.05 were considered as significant.
- https://cdn.elifesciences.org/articles/48476/elife-48476-supp5-v2.xlsx
-
Supplementary file 6
eQTLs.
The table shows: (A) all the significant eQTLs and (B) the lead eQTL for each gene. eGene information, including gene ID, gene name and TSS position, is shown in columns (A-C). For each variant (position, reference allele, alternative allele, allele frequency and RS ID are shown in columns D-H), eQTL type (primary, conditional 1 or conditional 2), effect size (beta), standard error of beta, p-value and Bonferroni correction are provided (columns I-M). For the 56 eGenes with significant eQTLs at genome-wide level, we observed 76,809 eQTLs (72,473 primary, 2424 conditional 1 and 1912 conditional 2, Bonferroni-adjusted p-value<0.1, column M), corresponding to 27,200 distinct variants.
- https://cdn.elifesciences.org/articles/48476/elife-48476-supp6-v2.xlsx
-
Supplementary file 7
Enrichment of eGenes for ASE.
The table shows, for 39,891 eQTL-eGene pairs corresponding to 21,739 variants, the number of samples with ASE data in the eGene (i.e. the eGene has at least one heterozygous variant with sufficient sequencing coverage; column D), the number of samples heterozygous for the eQTL variant (column E), the mean allelic imbalance fraction (AIF) in the samples where the eQTL variant is heterozygous (column F) or homozygous (column G), the nominal p-value for the difference in AIF between heterozygous and homozygous samples (Mann-Whitney U test, column H) and Benjamini-Hochberg-adjusted p-value (column I). AIF was calculated using MBASED (Mayba et al., 2014) on 215 iPSCORE iPSCs (DeBoever et al., 2017).
- https://cdn.elifesciences.org/articles/48476/elife-48476-supp7-v2.xlsx
-
Supplementary file 8
Colocalization between eGenes and complex traits and disease.
Colocalization between the eQTLs for each eGene and 4,083 UKBB traits with posterior probability of association > 0.5 are shown. For each eGene-trait colocalization, the posterior probabilities of association for all hypotheses (0 = no associations; 1 = signal only from eQTLs; 3 = signal only from GWAS; 3 = different signals from eQTLs and GWAS; and 4 = same signal). Column K lists HLA-genes that have HLA-type eQTLs associated with the eGene in Column B. Column L lists all the HLA-type eQTLs associated with the eGene in Column B.
- https://cdn.elifesciences.org/articles/48476/elife-48476-supp8-v2.xlsx
-
Supplementary file 9
eQTL analysis showing associations between HLA types and gene expression.
(A) The table shows associations between the expression of each HLA gene and its HLA types (self-associations, eGene = HLA gene). For each association between eGene (columns A-B) and HLA allele (columns C-G), we show whether the HLA type was flagged because it did not pass the HWE threshold (column E, p>1×10⁻⁶, Figure 2—figure supplement 1), the primary HLA-type eQTL (Type = ‘primary’) and HLA-type eQTL conditional on the lead eQTL, the top two independent eQTLs and the top three independent eQTLs. Beta, SE of beta, p-value and Benjamini-Hochberg correction are provided for each HLA-type eQTL (primary and conditional). (B) The table shows all non-self HLA-type eQTLs.
- https://cdn.elifesciences.org/articles/48476/elife-48476-supp9-v2.xlsx
-
Supplementary file 10
Intersecting eGenes from eQTL and HLA-type eQTL analyses.
The table shows, for 118 eGenes (56 with eQTLs, 114 with HLA-type eQTLs, 52 over-lapping) the number of single-variant eQTLs (primary and conditional eQTLs), and the number of HLA-type eQTLs (primary and conditional).
- https://cdn.elifesciences.org/articles/48476/elife-48476-supp10-v2.xlsx
-
Transparent reporting form
- https://cdn.elifesciences.org/articles/48476/elife-48476-transrepform-v2.pdf
Download links
A two-part list of links to download the article, or parts of the article, in various formats.
Downloads (link to download the article as PDF)
Open citations (links to open the citations from this article in various online reference manager services)
Cite this article (links to download the citations from this article in formats compatible with various reference manager tools)
Systematic genetic analysis of the MHC region reveals mechanistic underpinnings of HLA type associations with disease
eLife 8:e48476.
https://doi.org/10.7554/eLife.48476


