High fat diet induces microbiota-dependent silencing of enteroendocrine cells
- Duke University School of Medicine, United States
Figures
Figure 1 with 2 supplements
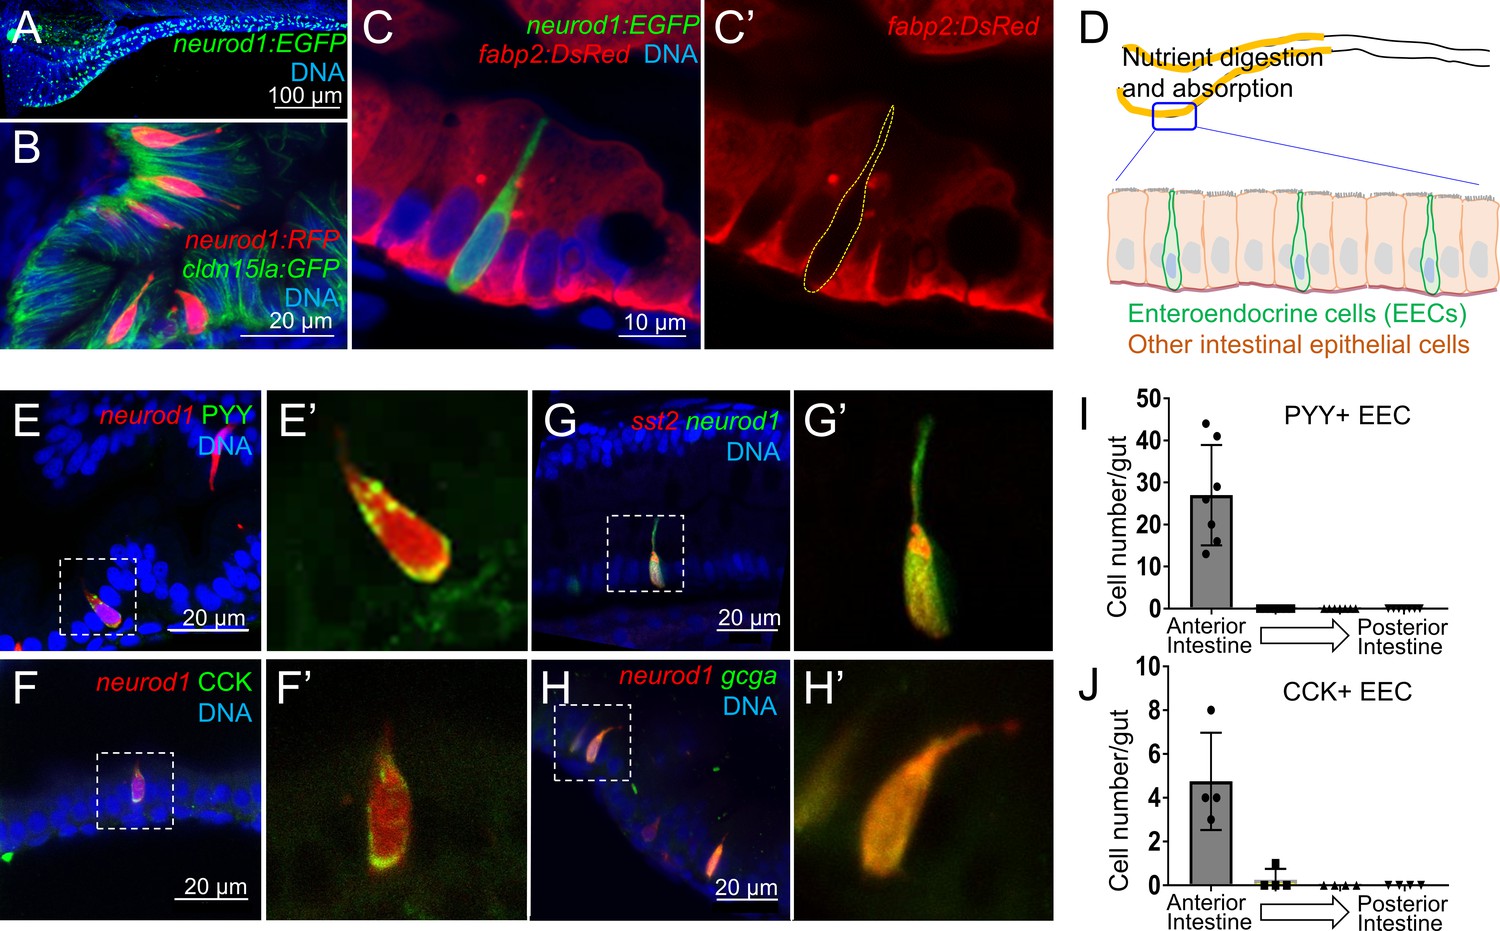
Identification of neurod1+ enteroendocrine cells (EECs) in zebrafish.
(A) Confocal projection of zebrafish EECs marked by the TgBAC(neurod1:EGFP) transgenic line. (B) Confocal projection of zebrafish EECs marked by Tg(neurod1:RFP). TgBAC(cldn15la:GFP) marks intestinal epithelial cells. (C) Confocal image of zebrafish EECs marked by TgBAC(neurod1:EGFP) transgenic line. (C’) Subpanel image of zebrafish enterocyte marked by Tg(fabp2:DsRed). Note that neurod1+ EECs do not express the enterocyte marker fabp2. (D) Schematic diagram of 6 dpf larval zebrafish intestine. The anterior region of the intestine that is largely responsible for nutrient absorption is highlighted in yellow. (E–F) Confocal image of neurod1+ EECs stained for PYY (E,) and CCK (F). (E’–F’) Zoom view of PYY and CCK positive EECs. (G–H) Confocal image of neurod1+ EECs expressing somatostatin [marked by Tg(sst2:DsRed) in G] and proglucagon hormones [marked by Tg(gcga:EGFP) in H]. (G’–H’) Zoom view of sst2 and gcga positive EECs. (I–J) Quantification of PYY+ (n = 7) and CCK+ (n = 4) EECs in 6 dpf zebrafish intestines.
Figure 1—figure supplement 1
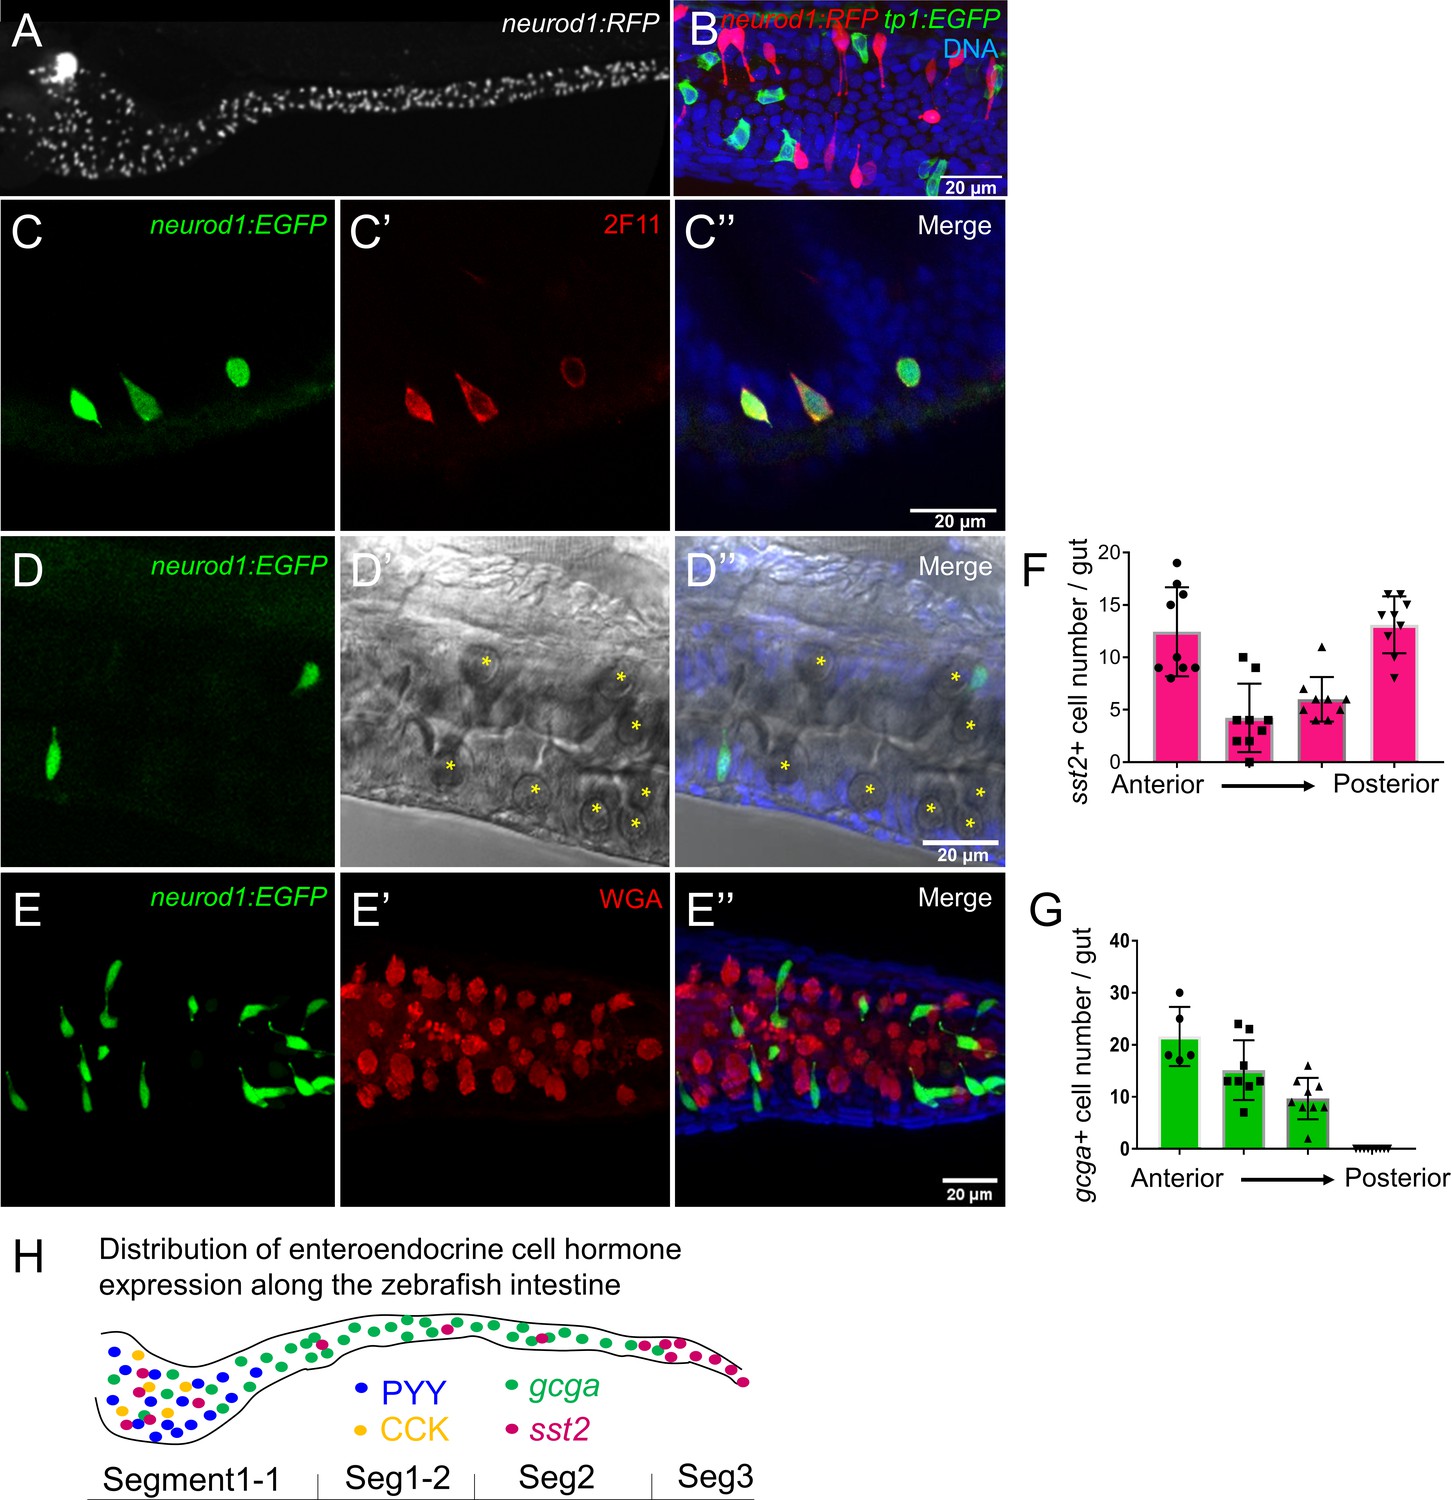
Characterization of zebrafish enteroendocrine cells.
(A) Fluorescence images of Tg(neurod1:RFP) 6 dpf zebrafish intestine. Neurod1 is expressed in islet cells of the pancreas and enteroendocrine cells in the intestine. (B) Confocal projection of zebrafish EECs marked by Tg(neurod1:RFP). Note that red neurod1+ EECs are not overlapping with green tp1+ cells. (C) Immunofluorescence staining of 6 dpf TgBAC(neurod1:EGFP) with the intestinal secretory cell marker 2F11 (red). (D) Confocal plane of zebrafish intestine from TgBAC(neurod1:EGFP). Goblet cells are identified by their specific cell shape in the white field (B’’) and EGFP labeled EECs do not overlap with goblet cells. (E) Confocal projection of zebrafish EECs marked by TgBAC(neurod1:EGFP). Mucus in goblet cells is labeled with WGA lectin (red). neurod1+ EECs do not stain with WGA. (F) Quantification of somatostatin+ cells that are labeled by Tg(sst2:RFP) in the 6 dpf zebrafish intestine. (G) Quantification of glucagon+ cells that are labeled by Tg(gcga:EGFP) in the 6 dpf zebrafish intestine. (H) Schematic depiction of EEC hormone distribution along the intestinal segments of 6 dpf zebrafish larvae.
Figure 1—figure supplement 2
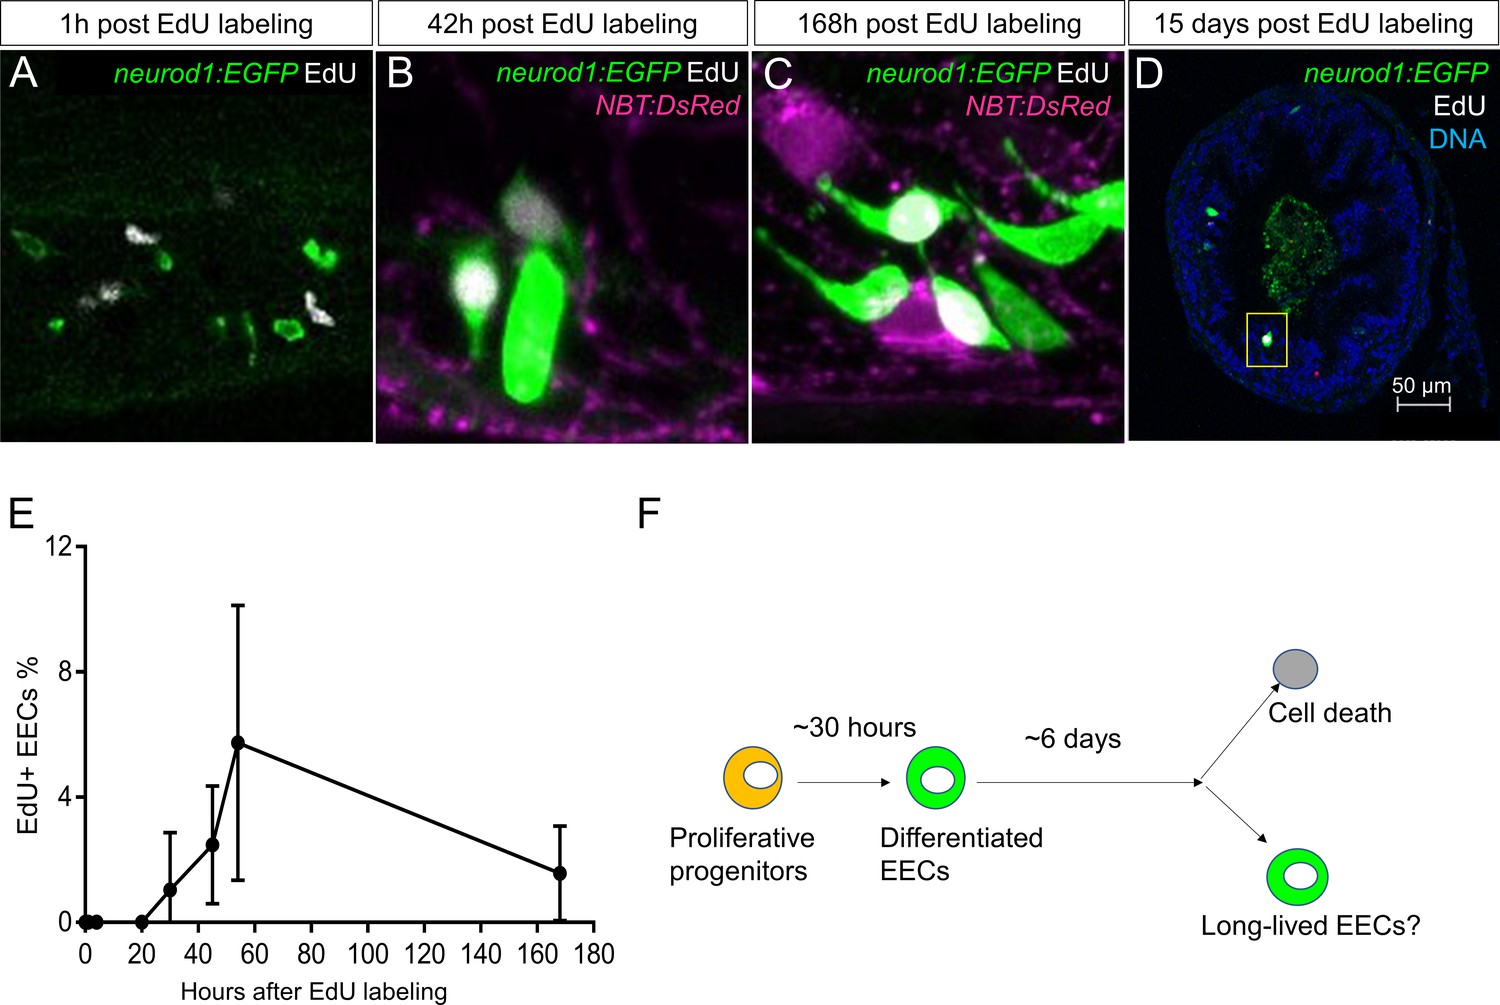
Analysis of EEC lifespan in zebrafish larvae using single dose EdU labeling.
EdU was injected into the pericardiac sac region of 5 dpf TgBAC(neurod1:EGFP) zebrafish using previously described methods (Ye et al., 2015). Zebrafish were fixed at 1 hr, 4 hr, 20 hr, 30 hr, 45 hr, 54 hr, 7 days (168 hr) and 15 days post EdU injection. (A–D) Confocal images of EdU fluorescence staining in the TgBAC(neurod1:EGFP) zebrafish intestine. (E) Quantification of the percentage of EdU+ EECs in zebrafish intestine following EdU tracing. t = 0 (n = 6), t = 1 hr (n = 8), t = 4 hr (n = 5), t = 20 hr (n = 6), t = 30 hr (n = 11), t = 45 hr (n = 9), t = 54 hr (n = 6), t = 168 hr (n=5). No EdU+ EECs could be detected until 30 hr post EdU injection and some EdU+ EECs remained 15 days post EdU injection. (F) Schematic of our working model of EEC lifespan.
Figure 2 with 2 supplements
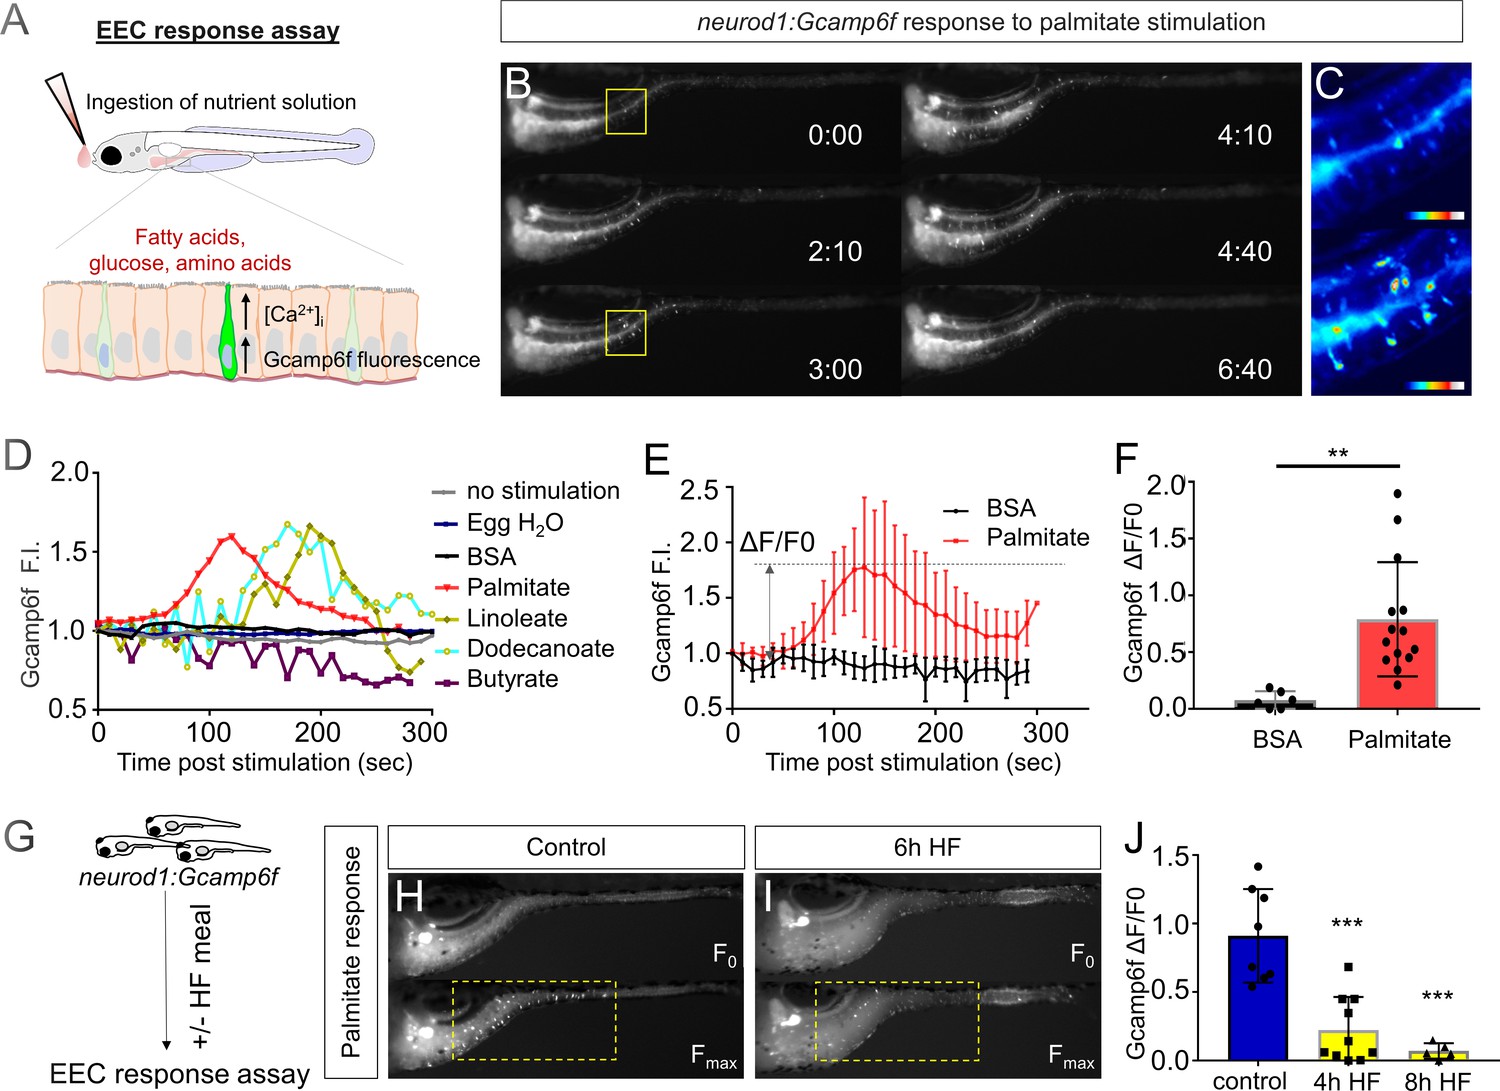
High fat feeding impairs the EEC calcium response toward palmitate stimulation.
(A) Measurement of the EEC response to nutrient stimulation using Tg(neurod1:Gcamp6f). (B) Time lapse image of the EEC response to BSA conjugated palmitate stimulation in Tg(neurod1:Gcamp6f) using the EEC response assay. Note that palmitate responsive EECs are primarily in the proximal intestine. (C) Heat map image indicating the EEC calcium response at 0 and 3 min post palmitate stimulation from the highlighted area in B. (D) Change in Gcamp6f relative fluorescence intensity in 5 min with no stimulation or stimulation with egg water, BSA vehicle, palmitate, linoleate, dodecanoate or butyrate. Note that only palmitate, linoleate and dodecanoate induced EEC calcium responses. (E, F) Change in Gcamp6f relative fluorescence intensity in BSA stimulated (n = 4) and palmitate stimulated animals (n = 5). (G) Measurement of EEC calcium responses to palmitate stimulation following 4–8 hr of high fat (HF) meal feeding in 6 dpf Tg(neurod1:Gcamp6f) larvae. (H, I) Representative images of the EEC response to palmitate stimulation in control larvae (without HF meal feeding, (H) and 6 hr of HF feeding (I). (J) Measurement of EEC calcium responses to palmitate stimulation in Tg(neurod1:Gcamp6f) larvae following 4 and 8 hr HF feeding. Student t-test was used in F and one-way ANOVA with post-hoc Tukey test was used in J. **p<0.01, ***p<0.001.
Figure 2—figure supplement 1
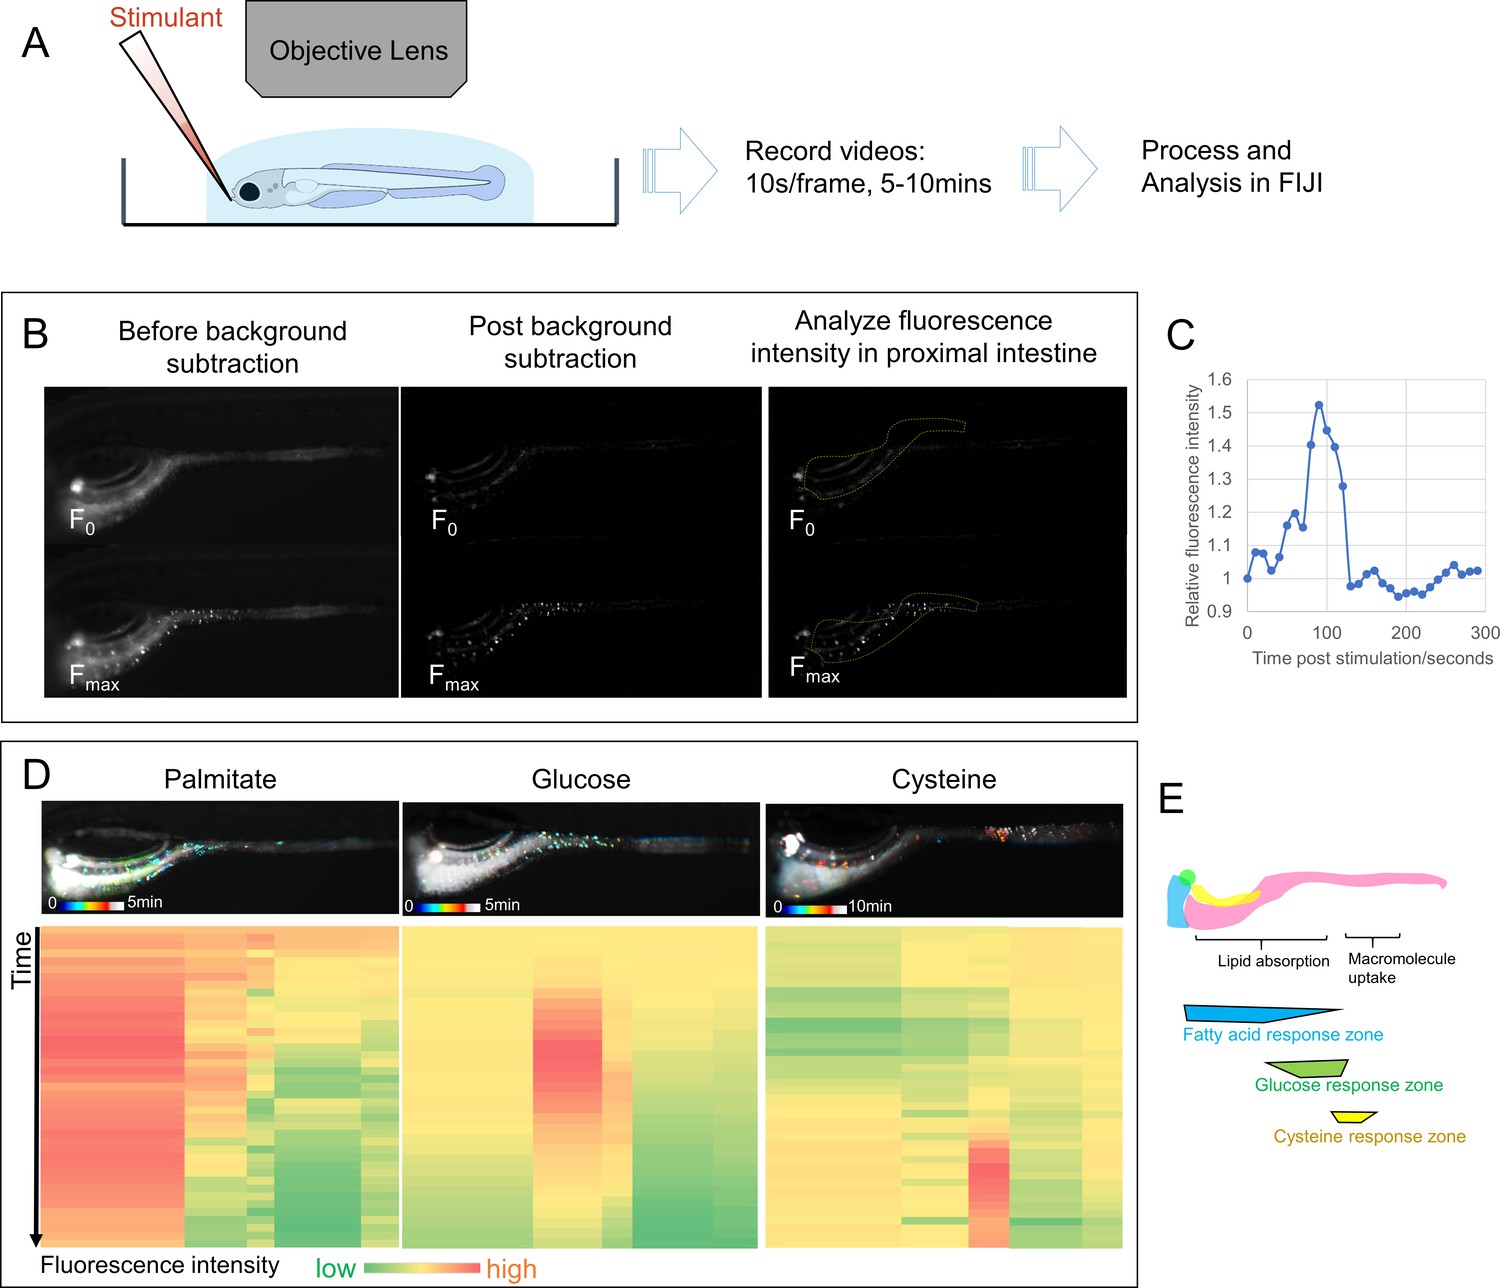
EEC activity assay.
(A) Experimental design of EEC activity assay using Tg(neurod1:Gcamp6f) zebrafish. (B) Representative images of EEC calcium fluorescence analysis using FIJI template matching and background subtraction in Tg(neurod1:Gcamp6f) zebrafish stimulated with palmitate. (C) Relative fluorescence intensity in the proximal intestine in a series of video images from zebrafish in B. (D) Spatial-temporal resolution of the EEC response to palmitate, glucose and cysteine stimulation. (E) Representative images of the EEC nutrient response in a regional specific manner. Palmitate and glucose primarily activated EECs in the proximal intestine where most lipid and nutrient absorption occurs. In contrast, cysteine activated EECs in the mid-intestine (segment 2) where proteins and other macromolecules are digested andabsorbed by specialized intestinal epithelial cells in this region (Nakamura et al., 2004; Wang et al., 2010; Park et al., 2019).
Figure 2—figure supplement 2
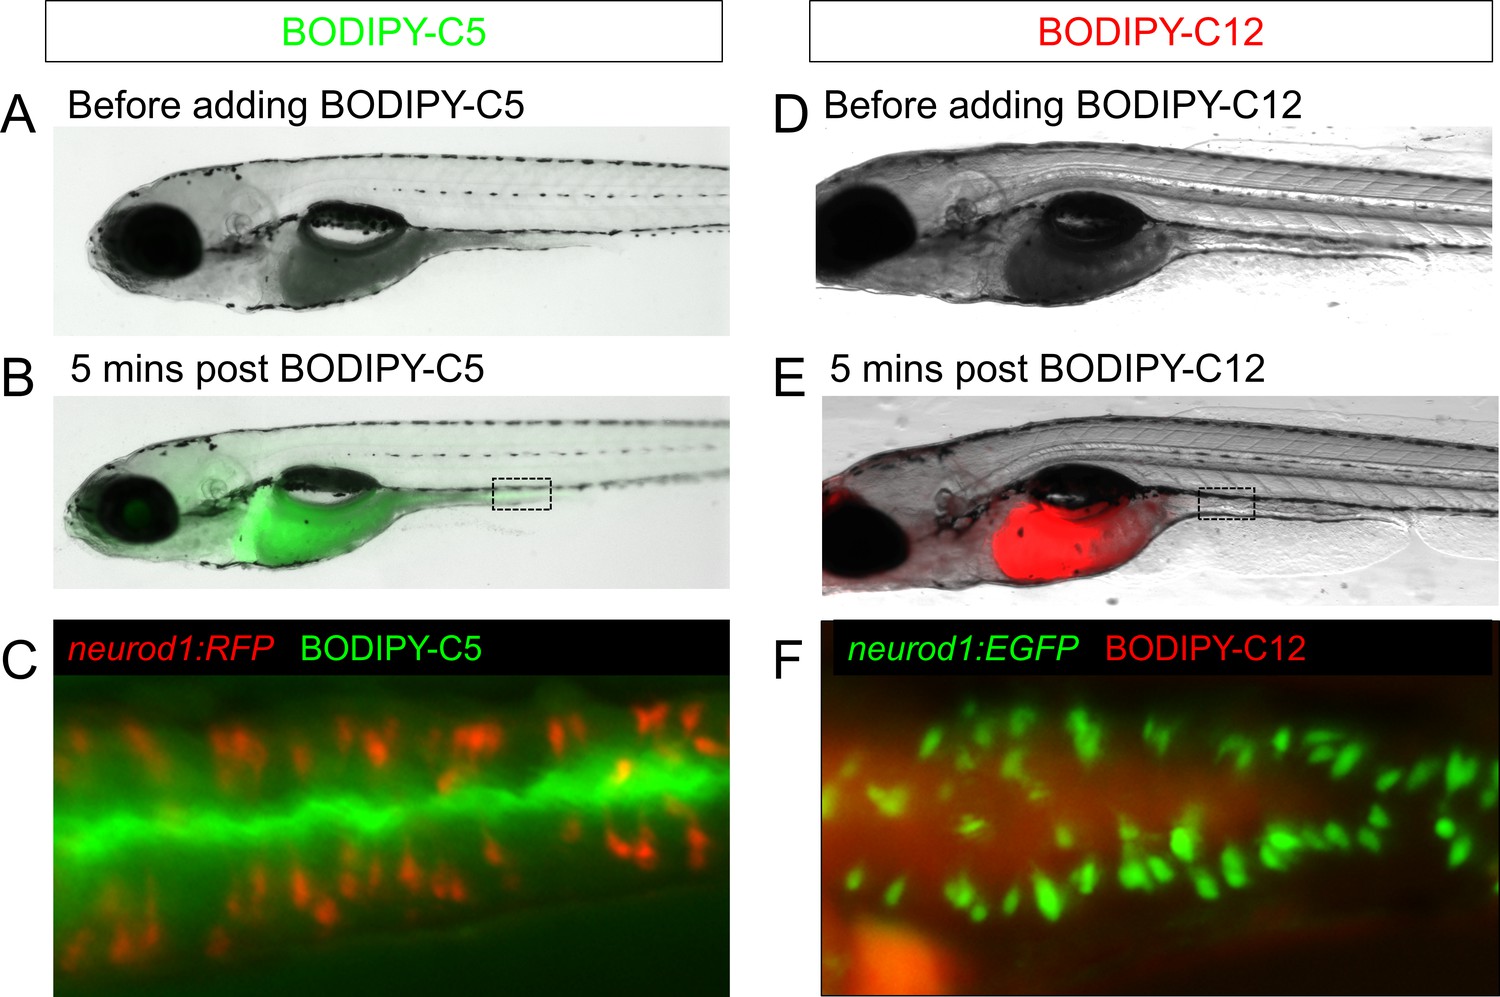
Feeding a high fat meal did not impair subsequent fatty acid intake.
(A–C) Fatty acid was labeled with green fluorescence in BODIPY-C5 (Carten et al., 2011). BODIPY-C5 (in BSA complex) was delivered to zebrafish larvae that had been fed high fat (HF) meal for 6 hr, the same as the EEC activity assay. Within 5 min of delivery, green BODIPY-C5 was distributed throughout the entire zebrafish intestinal lumen. (D–F) Fatty acids were labeled with red fluorescence in BODIPY-C12 (Carten et al., 2011). BODIPY-C12 was delivered to zebrafish larvae that had been fed HF meal for 6 hr, the same as the EEC activity assay. Within 5 min of delivery, red BODIPY-C12 was distributed throughout the zebrafish intestinal lumen.
Figure 3 with 1 supplement
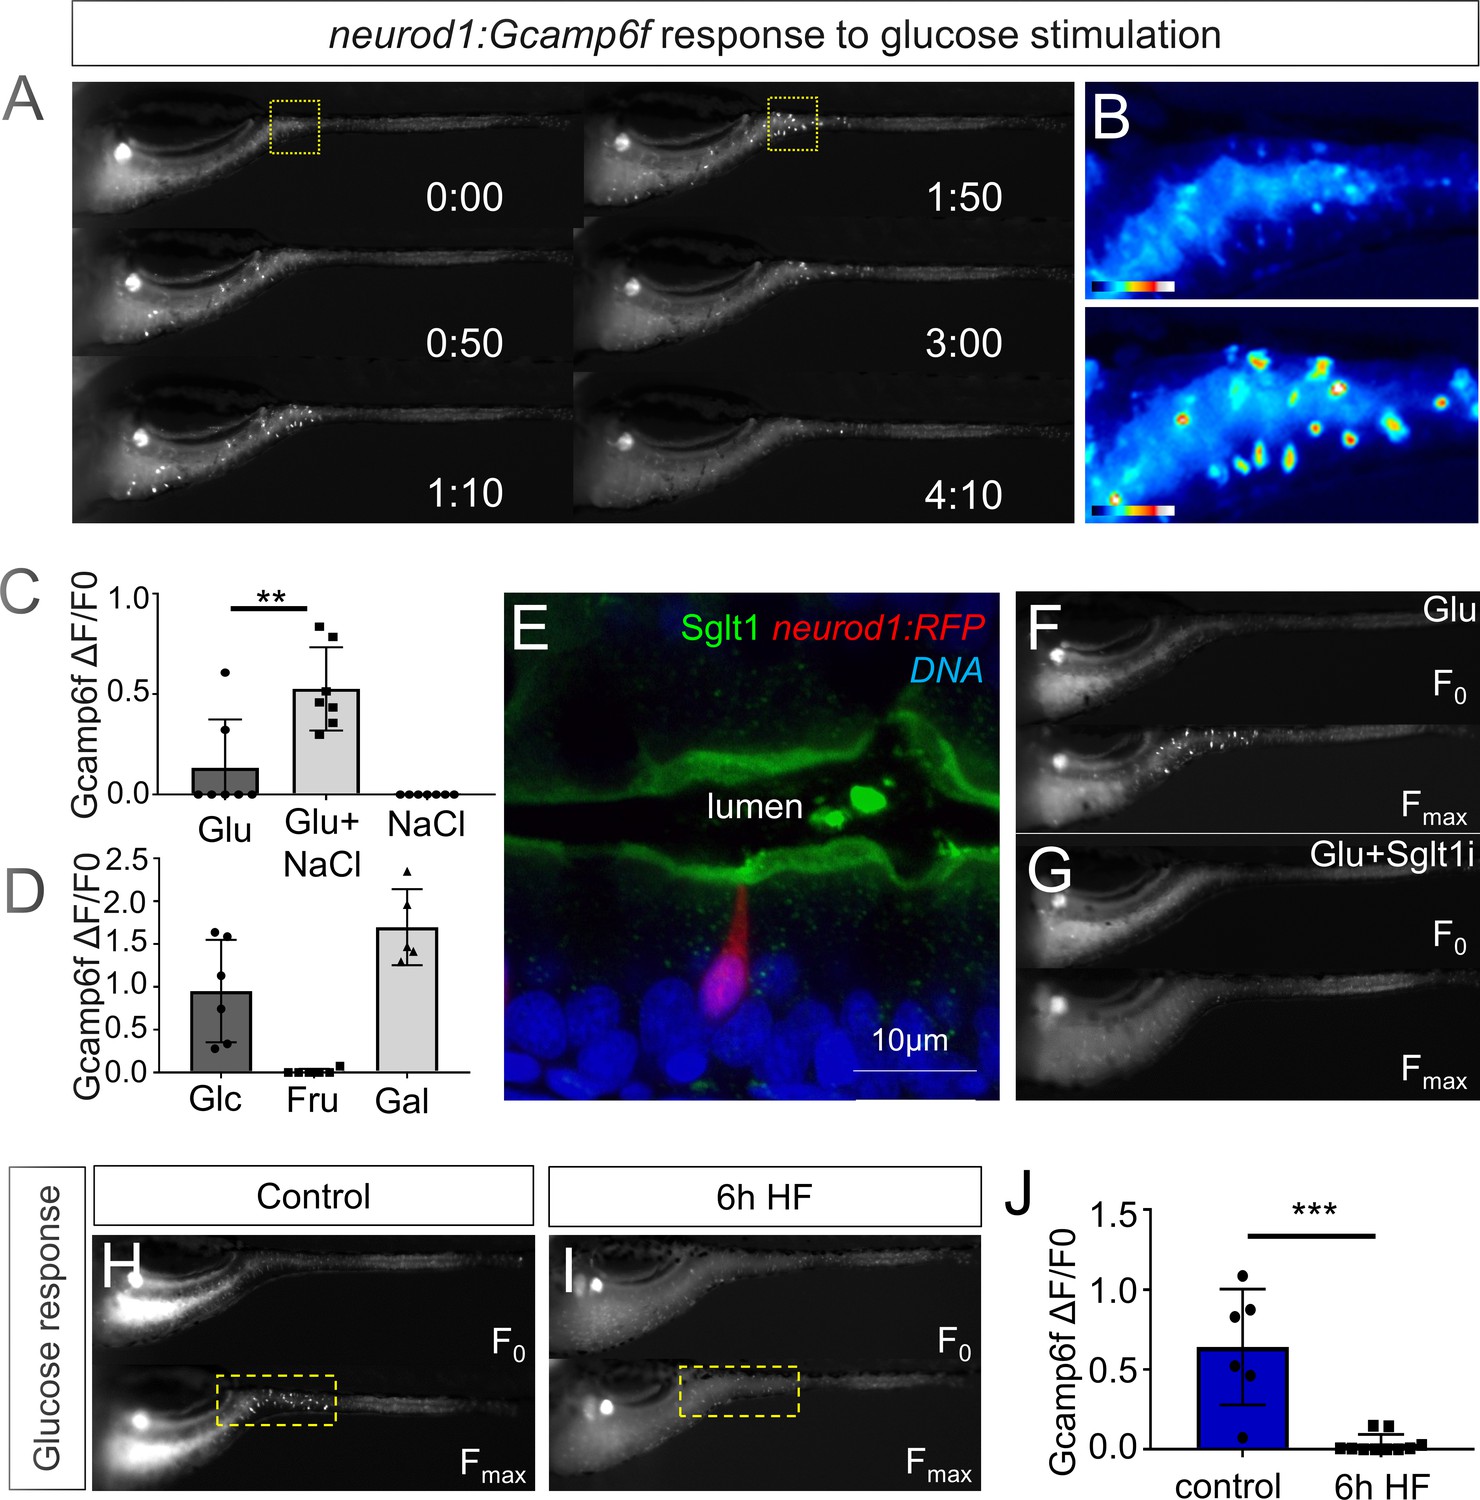
High fat feeding impairs EEC calcium response to glucose stimulation.
(A) Time lapse images of the EEC response to glucose (500 mM, dissolved in 100 mM NaCl solution) in 6 dpf Tg(neurod1:Gcamp6f) larvae using the EEC response assay. (B) Heat map image indicating the EEC calcium response at 0 and 1min 50s post glucose stimulation from the highlighted area in A. (C) Measurement of the EEC calcium response when stimulated with glucose (500 mM) dissolved in water or 100 mM NaCl vehicle. Note that the presence of NaCl significantly increased the glucose induced EEC calcium response. (D) Measurement of the EEC calcium response when stimulated with glucose (500 mM), fructose (500 mM) and galactose (500 mM). All of these stimulants were dissolved in 100 mM NaCl vehicle. Note that only glucose and galactose induced the EEC calcium response. (E) Confocal image of 6 dpf zebrafish intestine stained with Sglt1 antibody. EECs were marked by Tg(neurod1:RFP). Note that Sglt1 is located on the apical side of intestinal cells. (F, G) Representative image of the EEC calcium response in Tg(neurod1:Gcamp6f) when stimulated with 500 mM glucose or 500 mM glucose with a Sglt1 inhibitor (0.15 mM phloridzin). Note in G that when co-stimulated with glucose and Sglt1 inhibitor, the intestine appeared to dilate but no EEC activation was observed. (H,I) Representative image of the EEC calcium response to glucose stimulation in control larvae without high fat (HF) meal feeding (H) and 6 hr HF fed larvae (I). (J) Quantification of the EEC calcium response to glucose stimulation in control and 6 hr HF fed larvae. Student t-test was used in C,J. **p<0.01, ***p<0.001.
Figure 3—figure supplement 1
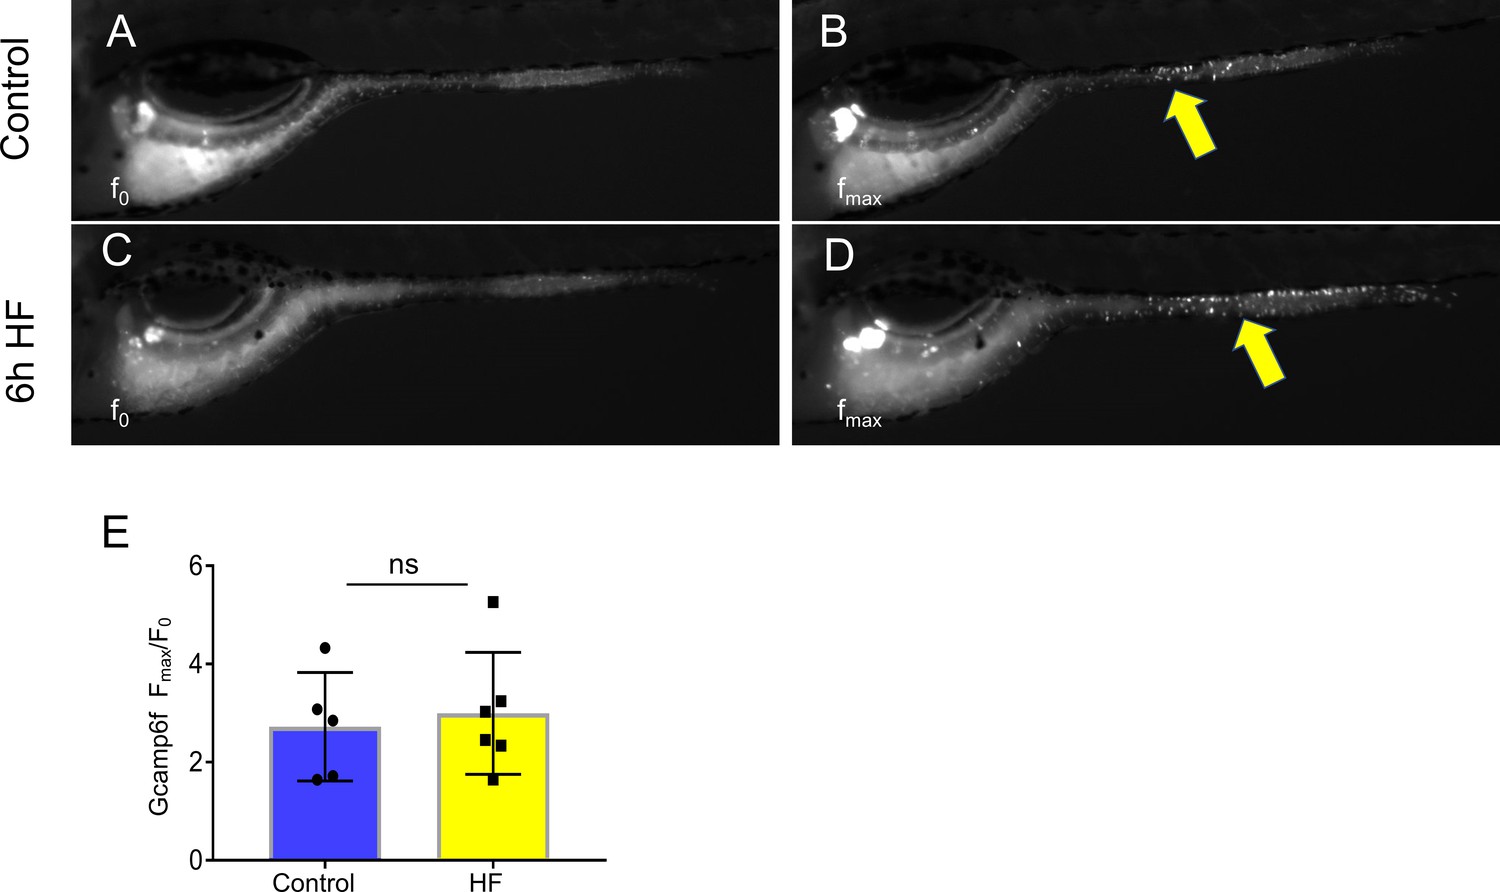
EECs remain responsive to cysteine following high fat feeding.
(A–B) Representative images of the EEC response to cysteine in control Tg(neurod1:Gcamp6f) zebrafish larvae. Note the location of responsive EECs in the mid-intestinal region (segment 2; yellow arrows) (C–D) Representative images of the EEC response to cysteine in 6 hr high fat (HF) meal fed Tg(neurod1:Gcamp6f) zebrafish larvae. (E) Quantification of the EEC response to cysteine in control and HF fed zebrafish. Student t-test was used in E for statistical analysis.
Figure 4 with 5 supplements
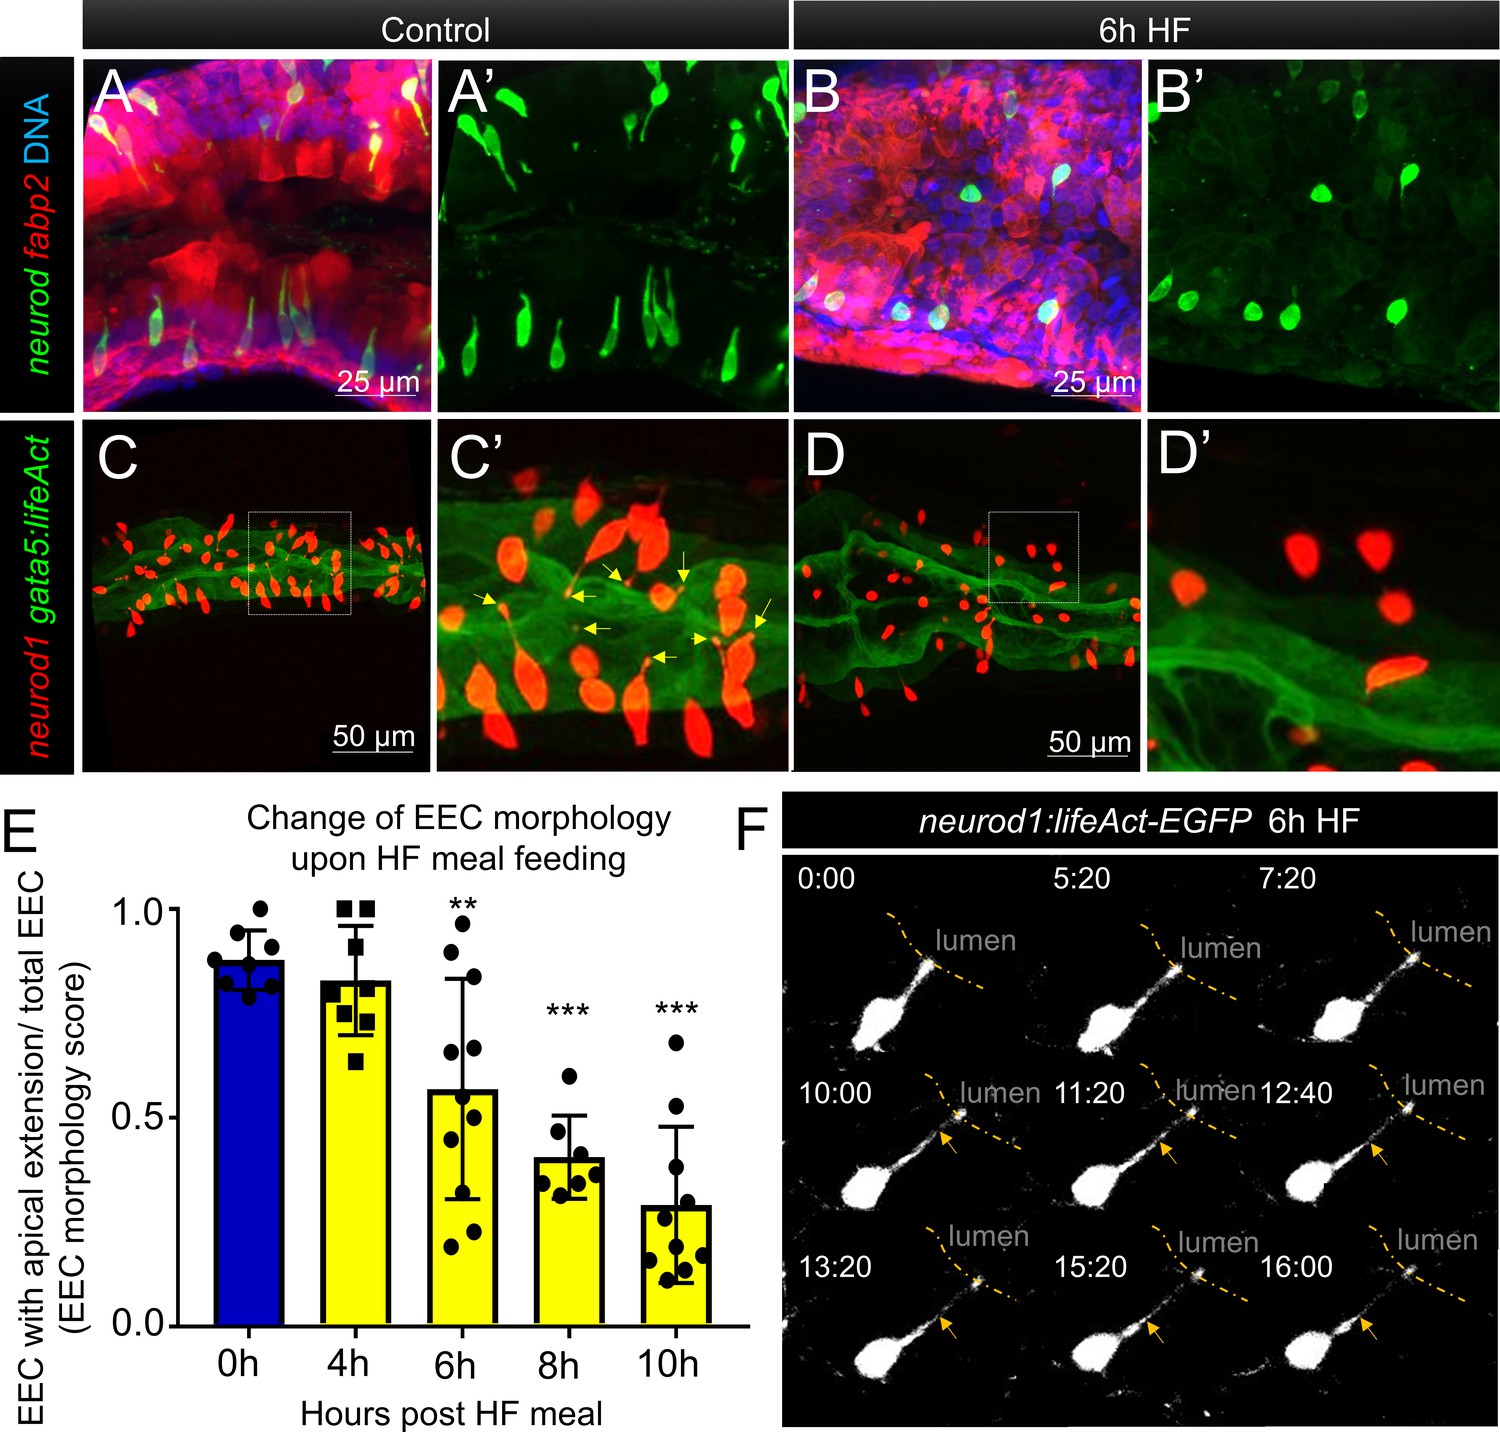
Enteroendocrine cells lose their apical extensions following high fat feeding.
(A–B) Confocal projection of 6 dpf zebrafish intestine in control (A) and 6 hr high fat (HF) fed larvae (B). Enteroendocrine cells (EECs) are marked by TgBAC(neurod1:EGFP) and enterocytes are marked by Tg(fabp2:DsRed). (A’–B’) Subpanel images of neurod1+EECs in control larvae (A’) and 6 hr after high fat feeding (B’). (C–D) Confocal projection of 6 dpf zebrafish intestine in control (C) and 6 hr high fat fed larvae (D).The enteroendocrine cells are marked by Tg(neurod1:RFP) and the apical region of intestine cells are marked by Tg(gata5:lifeAct-EGFP). (C’–D’) Zoom view of EECs in control (C’) and HF fed larvae (D’). Note that in control intestine, the EECs have extensions that touch the apical lumen (yellow arrow in C’). Such apical extensions in EECs are lost following high fat meal feeding (D, D’). (E) Quantification of EEC morphology in control and 4–10 hr HF fed zebrafish larvae in Tg(gata5:lifeAct-EGFP);Tg(neurod1:RFP) double transgenic zebrafish. The EEC morphology score is defined as the ratio of the number of EECs with apical extensions over the number of total EECs. (F) Time lapse images showing loss of the EEC apical extension in 6 hr HF fed larvae using Tg(neurod1:lifeAct-EGFP). One-way ANOVA with post-hoc Tukey test was used in E for statistical analysis. **p<0.01, ***p<0.001.
Figure 4—figure supplement 1
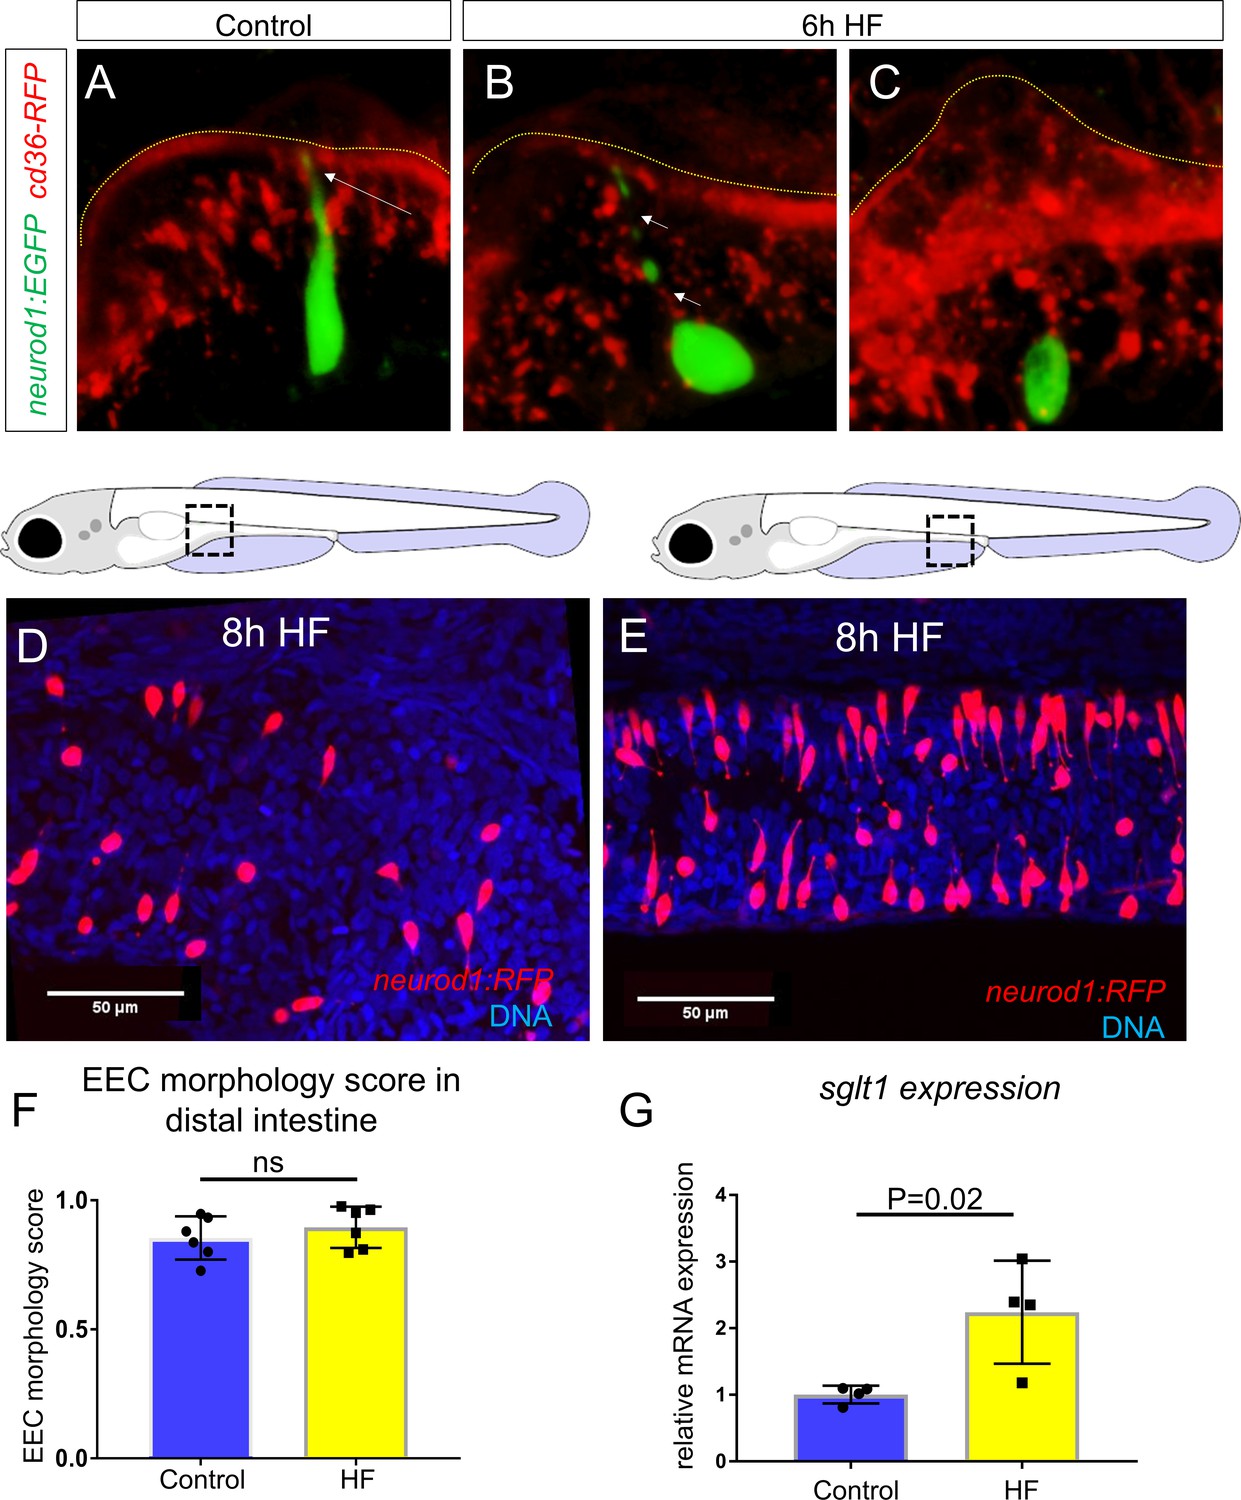
HF feeding does not alter EEC morphology in the distal intestine and HF feeding dose not impair sglt1 expression.
(A) Confocal projection of a typical EEC in the proximal intestine of control TgBAC(neurod1:EGFP); TgBAC(cd36-RFP) zebrafish. The white arrow indicates the apical projection that extends to the intestinal lumen. (B) Confocal image of an EEC in the proximal intestine 6 hr post high fat (HF) meal feeding in TgBAC(neurod1:EGFP); TgBAC(cd36-RFP) zebrafish. The white arrows indicate the discontinuous fragmentation of an apical projection that can only be observed in HF fed EECs. (C) Confocal image of ‘closed’ EECs in the proximal intestine after 6 hr post HF meal feeding in TgBAC(neurod1:EGFP); TgBAC(cd36-RFP) zebrafish. (F) Representative confocal projections of EECs in the proximal intestine following 8 hr of high fat feeding. (G) Representative confocal projections of EECs in the distal intestine (segments 2 and 3) following 8 hr HF feeding. (H) Quantification of EEC morphology in the distal-intestine in control and 8 hr HF fed zebrafish. (I) Quantification of sglt1 expression from the digestive tracts of control and 6 hr HF fed zebrafish. Student t-test was used in H and I for statistical analysis.
Figure 4—figure supplement 2
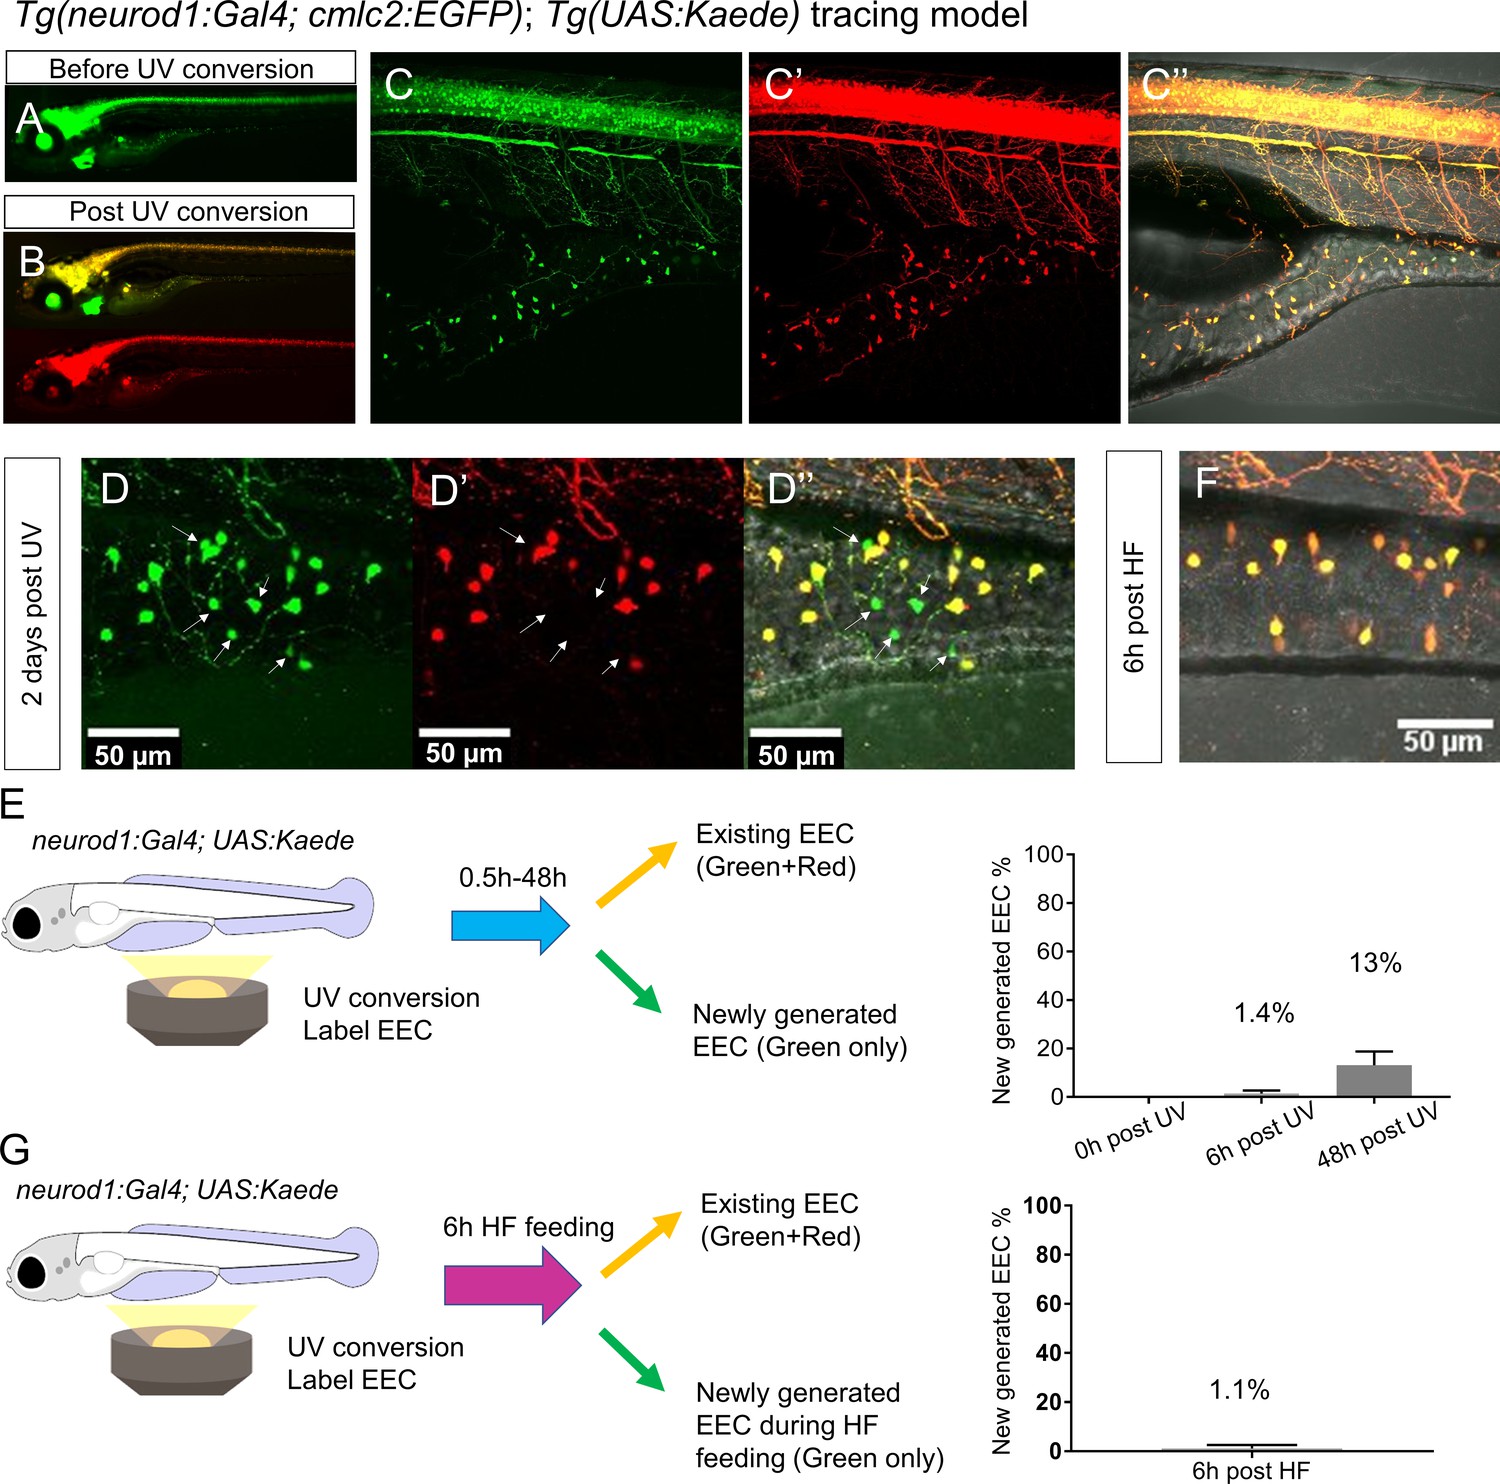
High fat feeding did not induce EEC neogenesis.
(A–B) Epifluorescence image of in vivo EEC lineage tracing using Tg(neurod1:Gal4;cmlc2:EGFP); Tg(UAS:Kaede) (referred to as neurod1-Kaede). Before UV conversion, neurod1+ cells were labeled with green Kaede protein. Following UV exposure, green Kaede protein was converted into red Kaede protein and neurod1+ cells are labeled yellow. (C) Confocal image of live neurod1-Kaede zebrafish intestine 0.5 hr post UV conversion. All the EECs are labeled. (D) Confocal image of live neurod1-Kaede zebrafish intestine 2 days post UV conversion. Arrows indicate the EECs that were generated after UV conversion and exhibit green fluorescence only. (E) Confocal image of live neurod1-Kaede zebrafish intestine 6 hr post high fat (HF) meal. No green EECs were detected. (F) EEC neogenesis tracing at 0.5 hr, 6 hr and 2 days post UV conversion using the neurod1-Kaede system. (G) EEC neogenesis tracing at 6 hr post HF feeding.
Figure 4—figure supplement 3
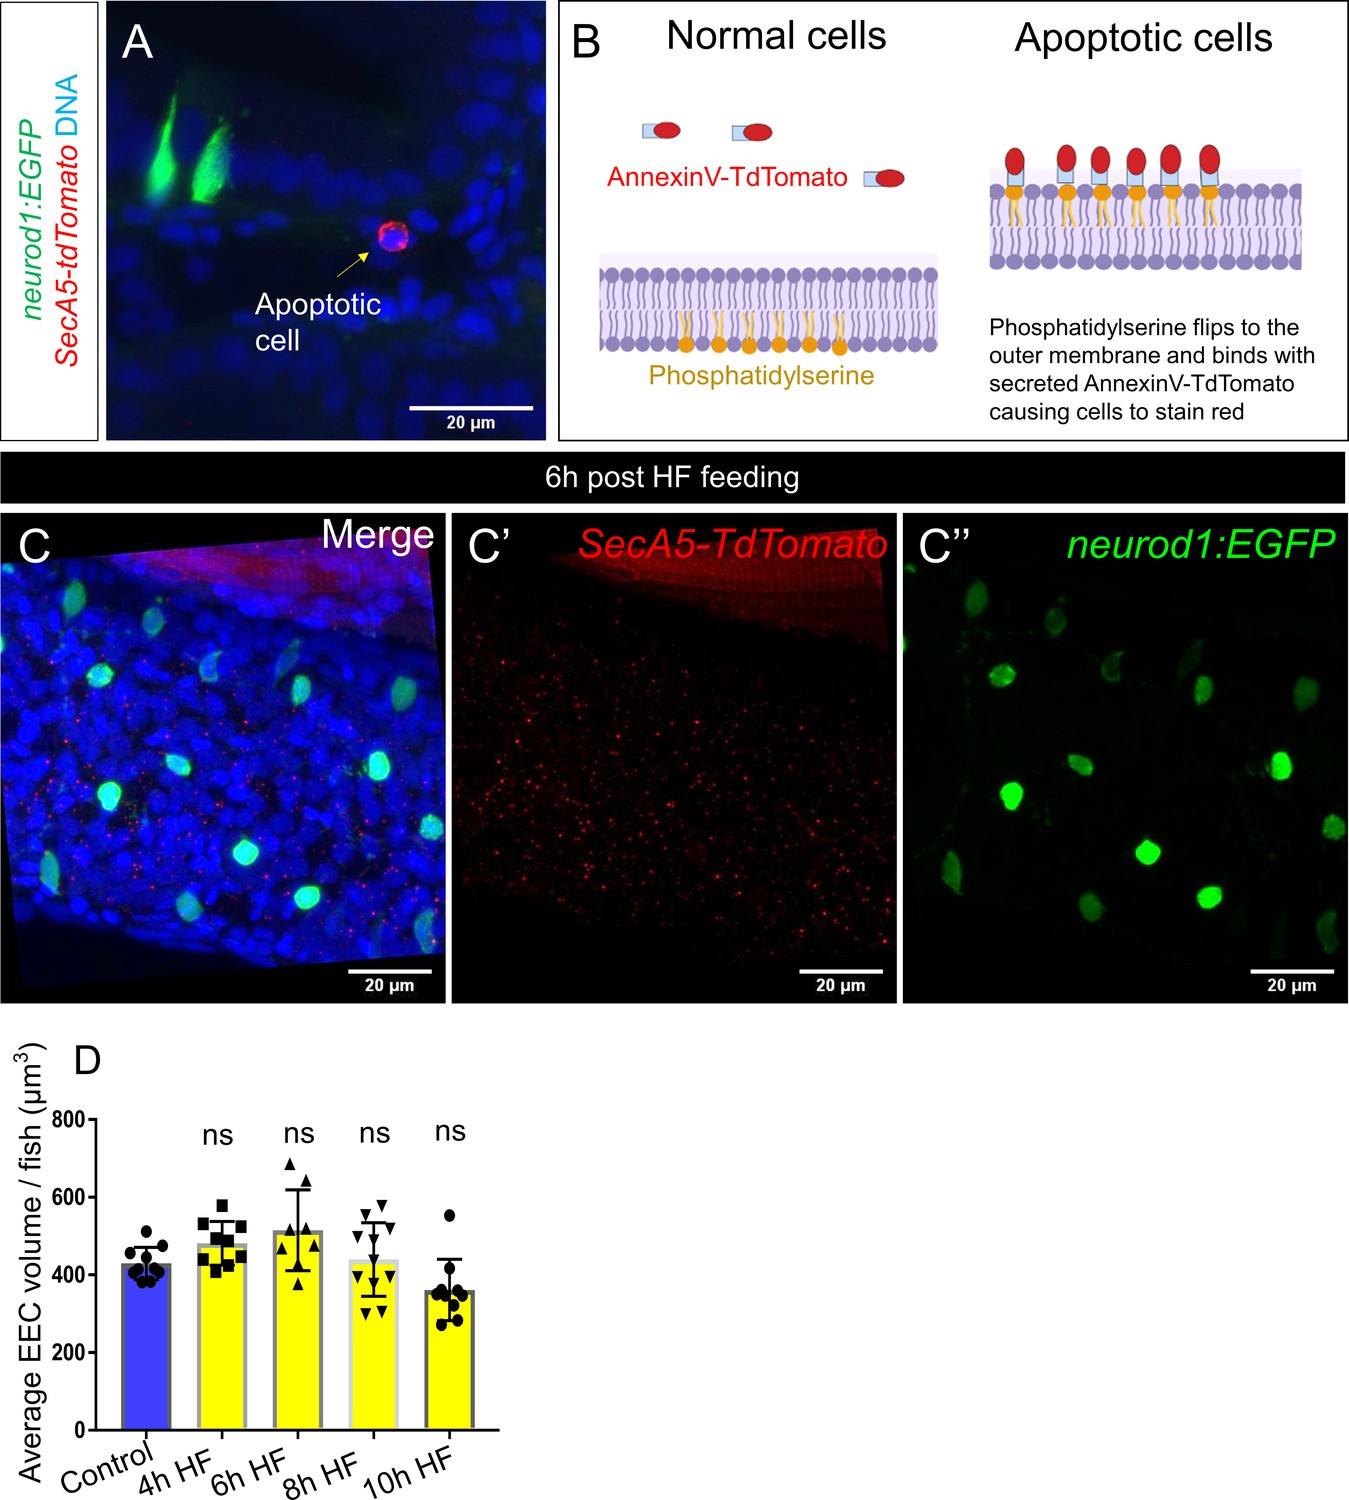
High fat feeding did not induce EEC apoptosis.
(A) Confocal projection of 6 dpf TgBAC(neurod1:EGFP); Tg(ubb:secA5-TdTomato) intestine. Apoptotic cells were labeled by secA5-TdTomato as red (yellow arrow). (B) Schematic view of labeling apoptotic cells using secA5-TdTomato (secreted Annexin5-TdTomato). During apoptosis, phosphatidylserine flips to the outer cellular membrane. The secA5-TdTomato is then able to bind to phosphatidylserine and label the apoptotic cells red. (C) Confocal image of TgBAC(neurod1:EGFP); Tg(ubb:secA5-TdTomato) zebrafish intestine following 6 hr of the high fat (HF) meal. In all the samples that were examined (n = 10), no apoptotic EECs were observed. (D) Quantification of average EEC cell volume in zebrafish from control, and 4 hours-10 hours post HF fed zebrafish. Each dot represents an individual animal with 30–60 EECs assessed per animal. One-way ANOVA with post-hoc Tukey test was used in F for statistical analysis.
Figure 4—figure supplement 4
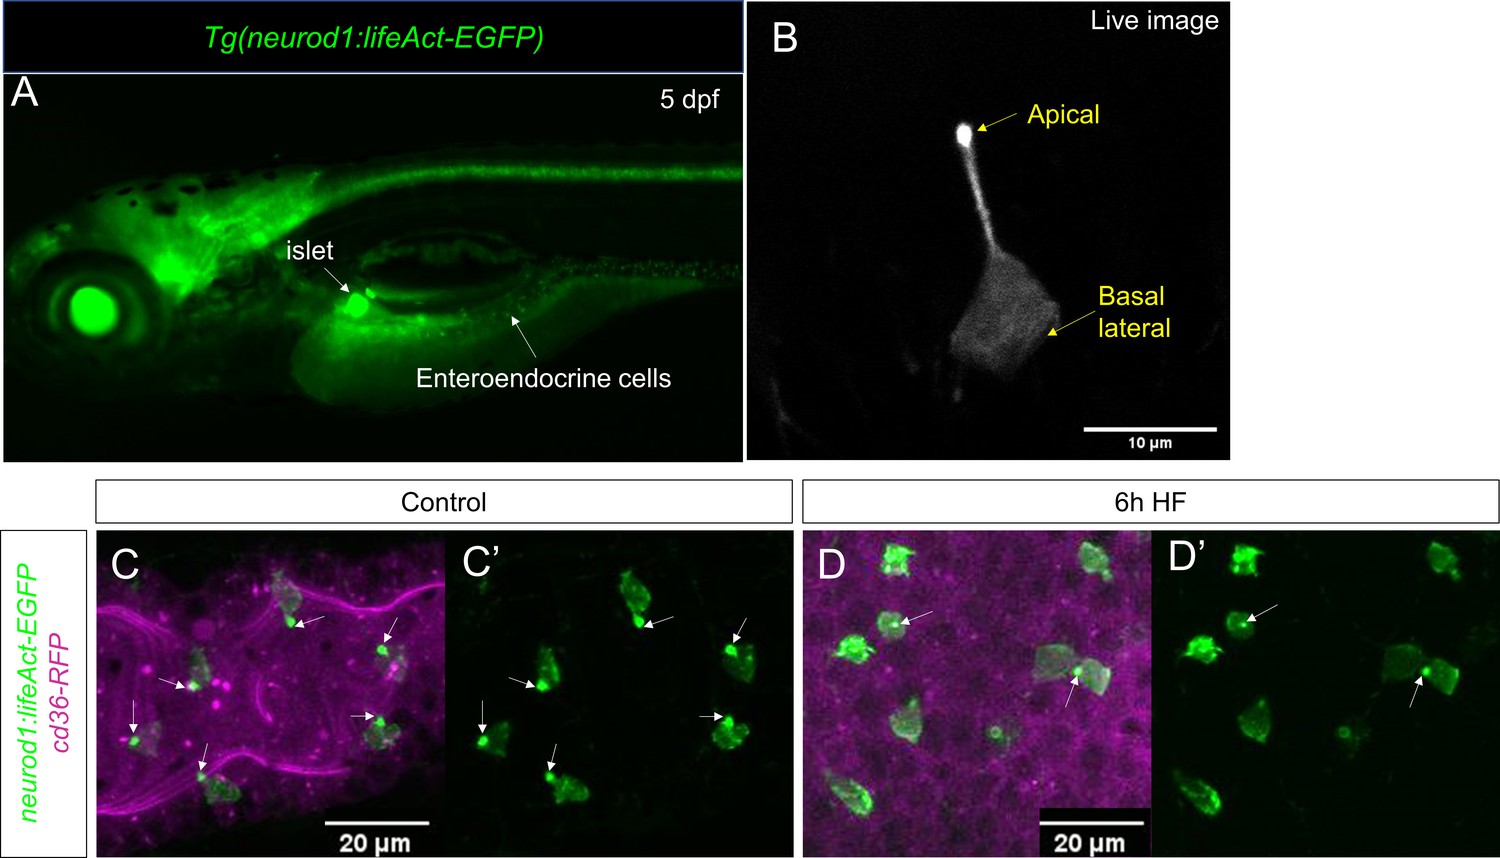
Characterization of Tg(neurod1:lifeAct-EGFP).
(A) Epifluoresence image of 5 dpf Tg(neurod1:lifeAct-EGFP). The pancreatic islet and enteroendocrine cells that were labeled by lifeAct-EGFP are designated by white arrows. (B) Confocal image of EEC labeled byTg(neurod1:lifeAct-EGFP) in live zebrafish mounted in 2% low melting agarose. The stronger lifeAct-EGFP signal was detected in the apical of EEC protrusion. (C, C’) Confocal image of Tg(neurod1:lifeAct-EGFP); TgBAC(cd36-RFP) zebrafish intestine. The EEC’s apical protrusion that labeled by a strong lifeAct-EGFP signal is labeled with white arrows. (D, D’) Confocal images of Tg(neurod1:lifeAct-EGFP); TgBAC(cd36-RFP) zebrafish intestine after 6 hr high fat (HF) meal feeding. The EECs’ apical protrusion labeled by strong lifeAct-EGFP signal was reduced.
Figure 4—figure supplement 5
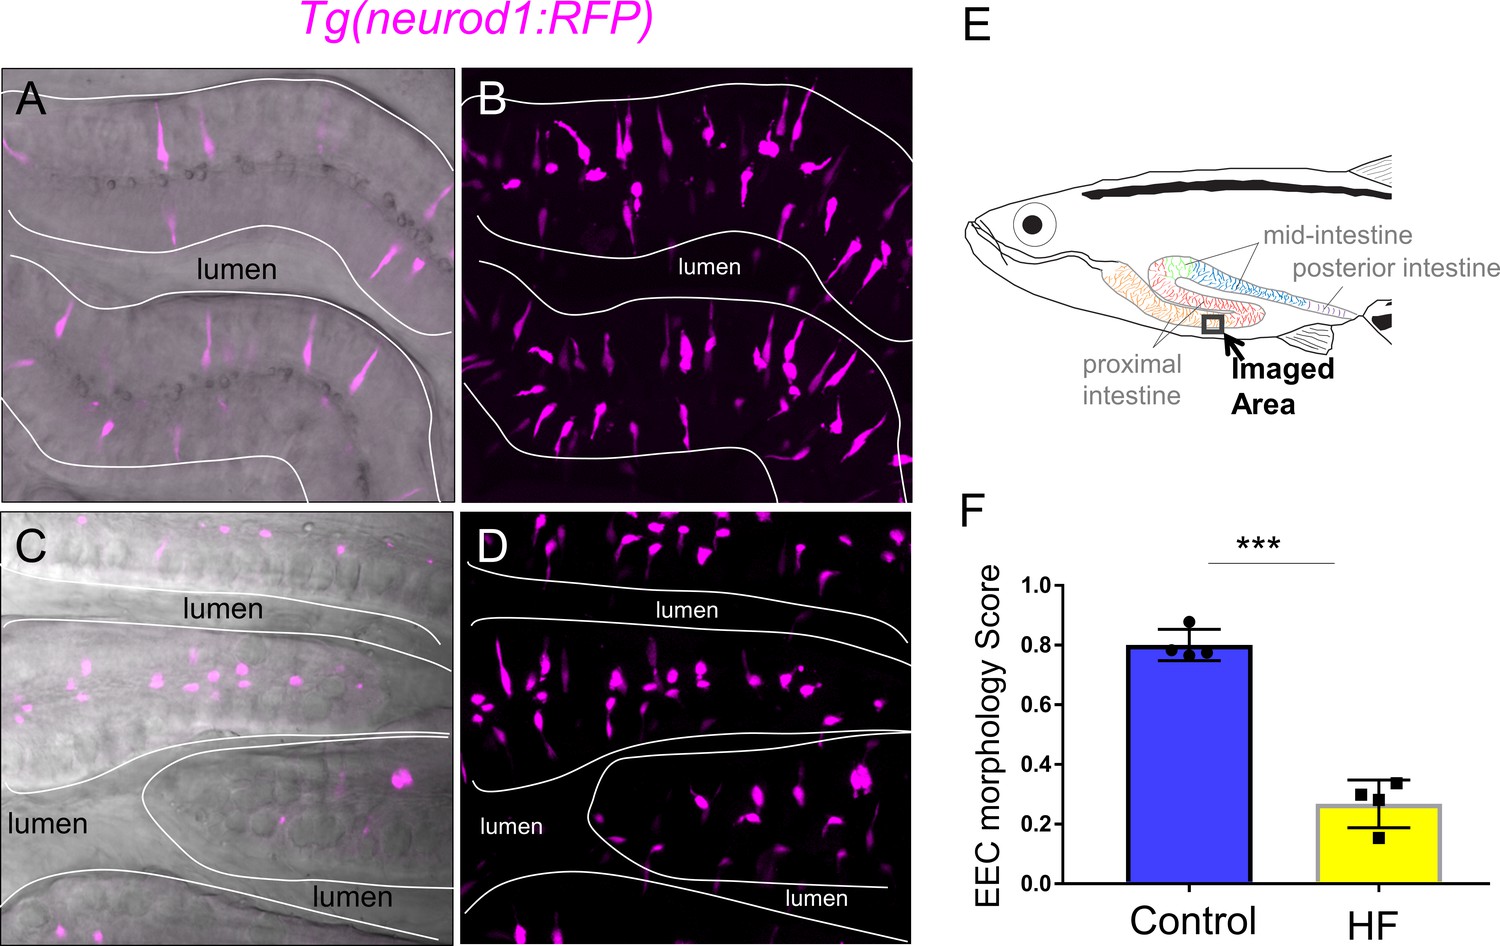
High fat feeding changed EEC morphology in adult zebrafish.
(A–B) Confocal image and confocal projection of EECs (magenta) in Tg(neurod1:RFP) adult zebrafish proximal intestine. (C–D) Confocal image and confocal projection of EECs (magenta) in Tg(neurod1:RFP) adult zebrafish proximal intestine after 10 hr high fat (HF) feeding. (E) Schematic of adult zebrafish intestine. (F) Quantification of EEC morphology score in control and 10 hr HF fed adult zebrafish. Each dot indicate average EEC morphology score from individual zebrafish. For each zebrafish, three representative areas were imaged and average EEC morphology score was quantified. Student T-test was used in F for statistical analysis. ***p<0.001.
Figure 5
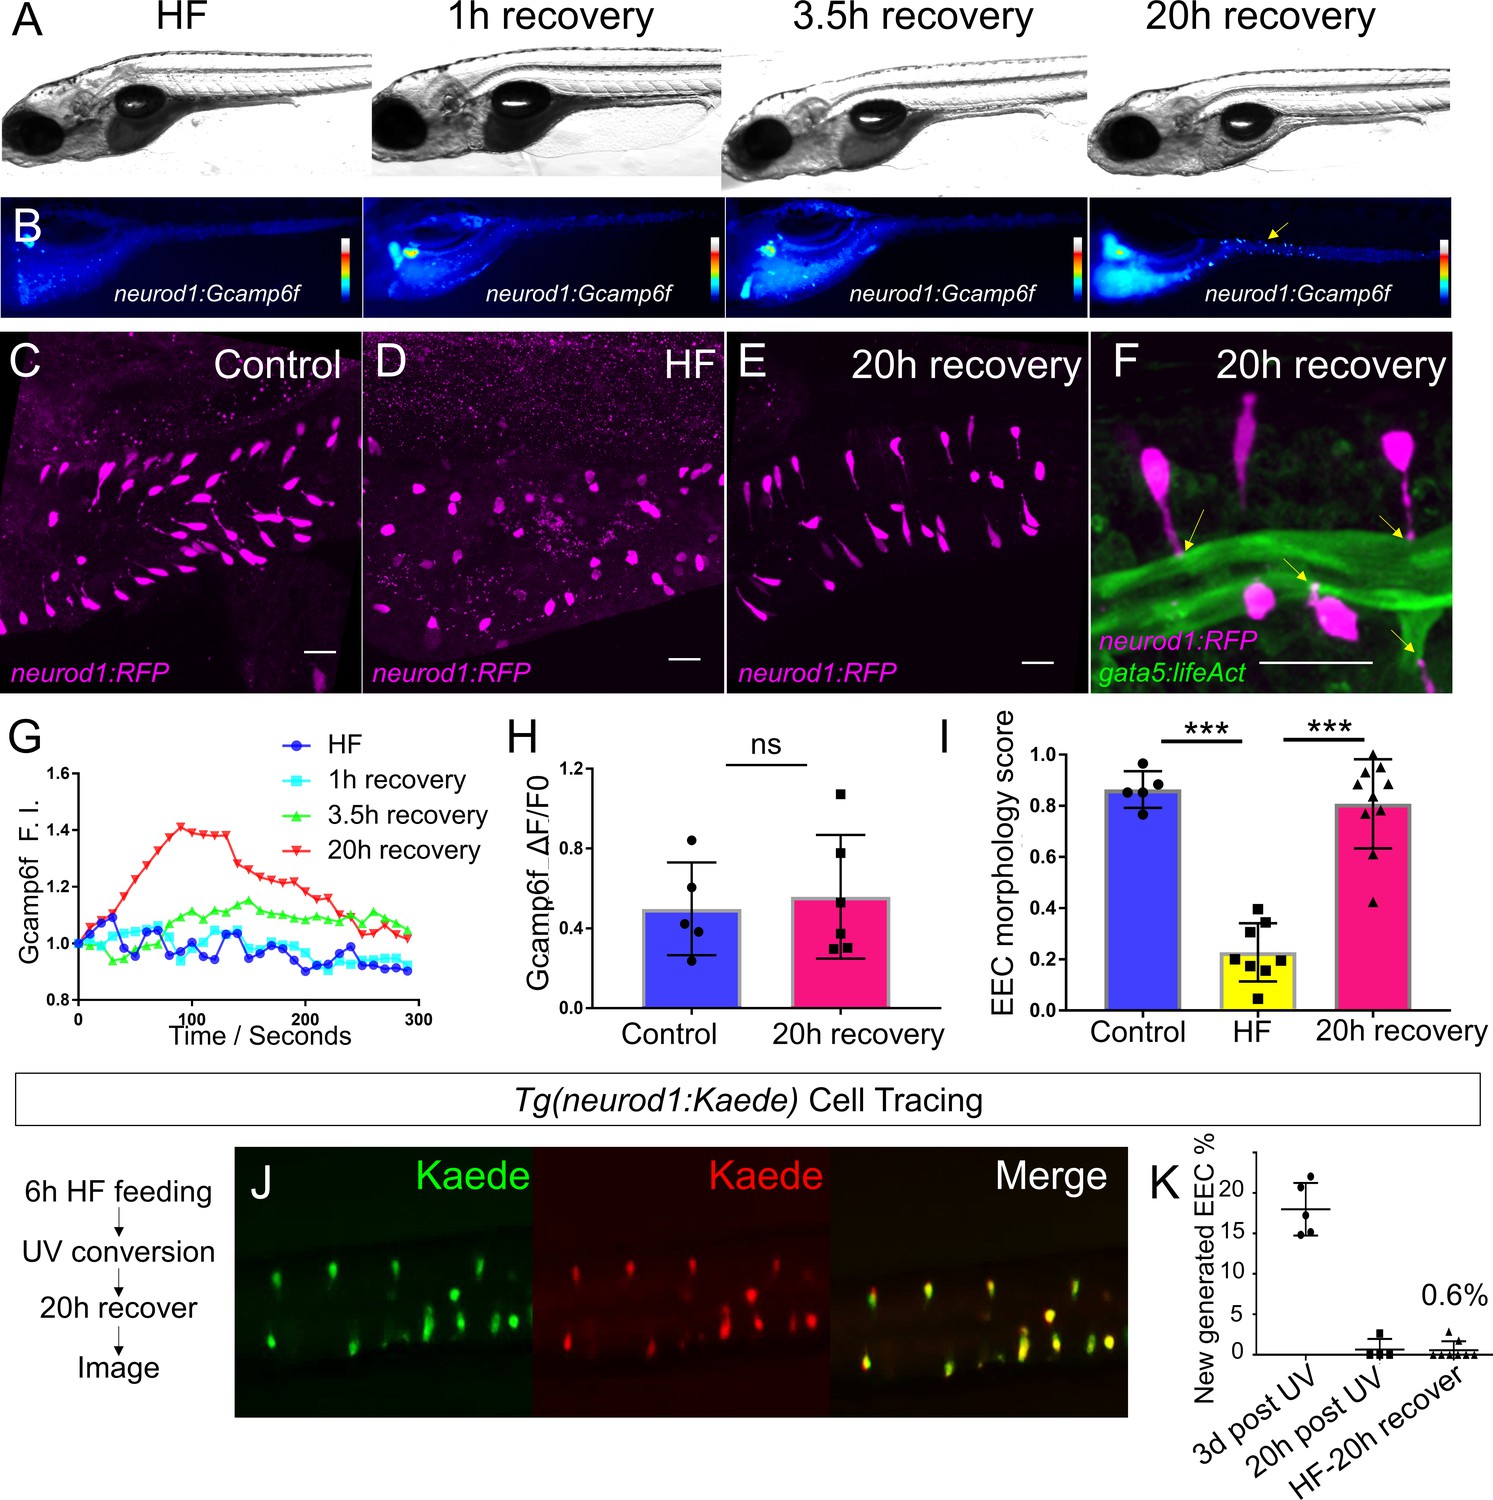
High fat feeding induced EEC silencing is reversible.
(A) Representative image of zebrafish after 6 hr of high-fat (HF) feeding, or HF feeding followed by 1, 3.5, and 20 hr of recovery in fresh egg water. (B) EEC palmitate-induced calcium response using Tg(neurod1:Gcamp6f) transgenic zebrafish after 6 hr of HF feeding, or HF feeding followed by 1, 3.5, and 20 hr of recovery. (C–E) Confocal projection of representative EECs (magenta) in Tg(neurod1:RFP) zebrafish under control conditions or 8 hr of HF feeding and HF fed zebrafish following 20 hr of recovery. (F) Confocal projection of representative EECs of Tg(neurod1:RFP); Tg(gata5:lifeAct-EGFP) in HF fed zebrafish following 20 hr of recovery. Yellow arrows indicate EECs’ apical extensions. (G) Change of Gcamp6f relative fluoresence intensity in response to palmitate stimulation in HF fed, and HF fed zebrafish following 1, 3.5, and 20 hr of recovery. (H) Quantification of EEC palmitate response in control and HF fed zebrafish following 20 hr of recovery. (I) Quantification of EEC morphology in control, HF fed and HF fed zebrafish following 20 hr of recovery. (J) Representative image of HF fed Tg(neurod1:Kaede) zebrafish following 20 hr recovery. Kaede+ EECs are photoconverted at 6 hr post HF feeding before and after recovery. (K) Quantification of the percentage of newly generated EECs (green Kaede only) in 3d post UV photoconversion, 20 hr post UV photoconversion and in HF fed zebrafish photoconverted before 20 hr recovery. Student t-test was used in H and one-way ANOVA with post-hoc Tukey test was used in I for statisitical analysis. ***p<0.001, ns p>0.05, not signficantly different.
Figure 6 with 2 supplements

Activation of ER stress following high fat feeding leads to EEC silencing.
(A–B) Quantitative real-time PCR measurement of relative mRNA levels from dissected digestive tracts in control and 6 hr high fat (HF) meal larvae at 6dpf (n = 4 biological replicate pools of 20 fish per condition). The plot indicates the fold increase of relative mRNA levels of indicated genes. (C) Quantification of total EEC number in control (n = 8) and 6 hr HF fed larvae (n = 6). (D–G) Representative images of the EEC calcium response to glucose or palmitate stimulation in control (D, F) and 2 hr thapsigargin (ER stress inducer, 1 µM) treated larvae (E, G). (H, I) Quantification of the EEC calcium response toward glucose (H) and palmitate (I) in control and 2 hr thapsigargin (1 µM) treated larvae. (J–K) Quantification of EEC morphology score in control and 10 hr thapsigargin (0.75 µM) or brefeldin A (BFA, 9 µM) treated larvae Tg(gata5:lifeAct-EGFP);Tg(neurod1:RFP) double transgenic line. (L–M) Confocal projections of control (J) and 6 hr HF fed (K) zebrafish intestines. The EECs are marked by Tg(neurod1:RFP), the activation of ER stress is marked by Tg(ef1α:xbp1δ-GFP) and DNA is stained with Hoechst 33342 (blue). (L’–M’) Subpanel images showing the activation of ER stress in control (L’) and 6 hr HF fed (M’) zebrafish intestines. (M’’) Zoom in view of s-xbp1+ EECs that displayed typical closed morphology in HF fed zebrafish intestine. Yellow arrows in M, M’ and M’’ indicate EECs with xbp1 activation. (N) Quantification of s-xbp1+ EECs (%) in control and 6 hr HF fed zebrafish larvae. (O–P) Confocal projection of zebrafish intestine in 10 hours HF fed (O) and 10 hr HF fed treated animals receiving 0.5 mM TUDCA (P). EECs are marked with Tg(neurod1:RFP) and the apical region of the intestine is marked with Tg(gata5:lifeAct-EGFP). (O’–P’) Zoom view of EECs in indicated conditions. Yellow arrows in P’ indicate EECs’ apical extensions. (Q) Quantification of the EEC morphology score in zebrafish larvae following 10 hr of HF feeding and 10 hr of HF feeding with 0.5 mM TUDCA. Student t-test was performed for statistical analysis. *p<0.05, **p<0.01, ***p<0.001.
Figure 6—figure supplement 1
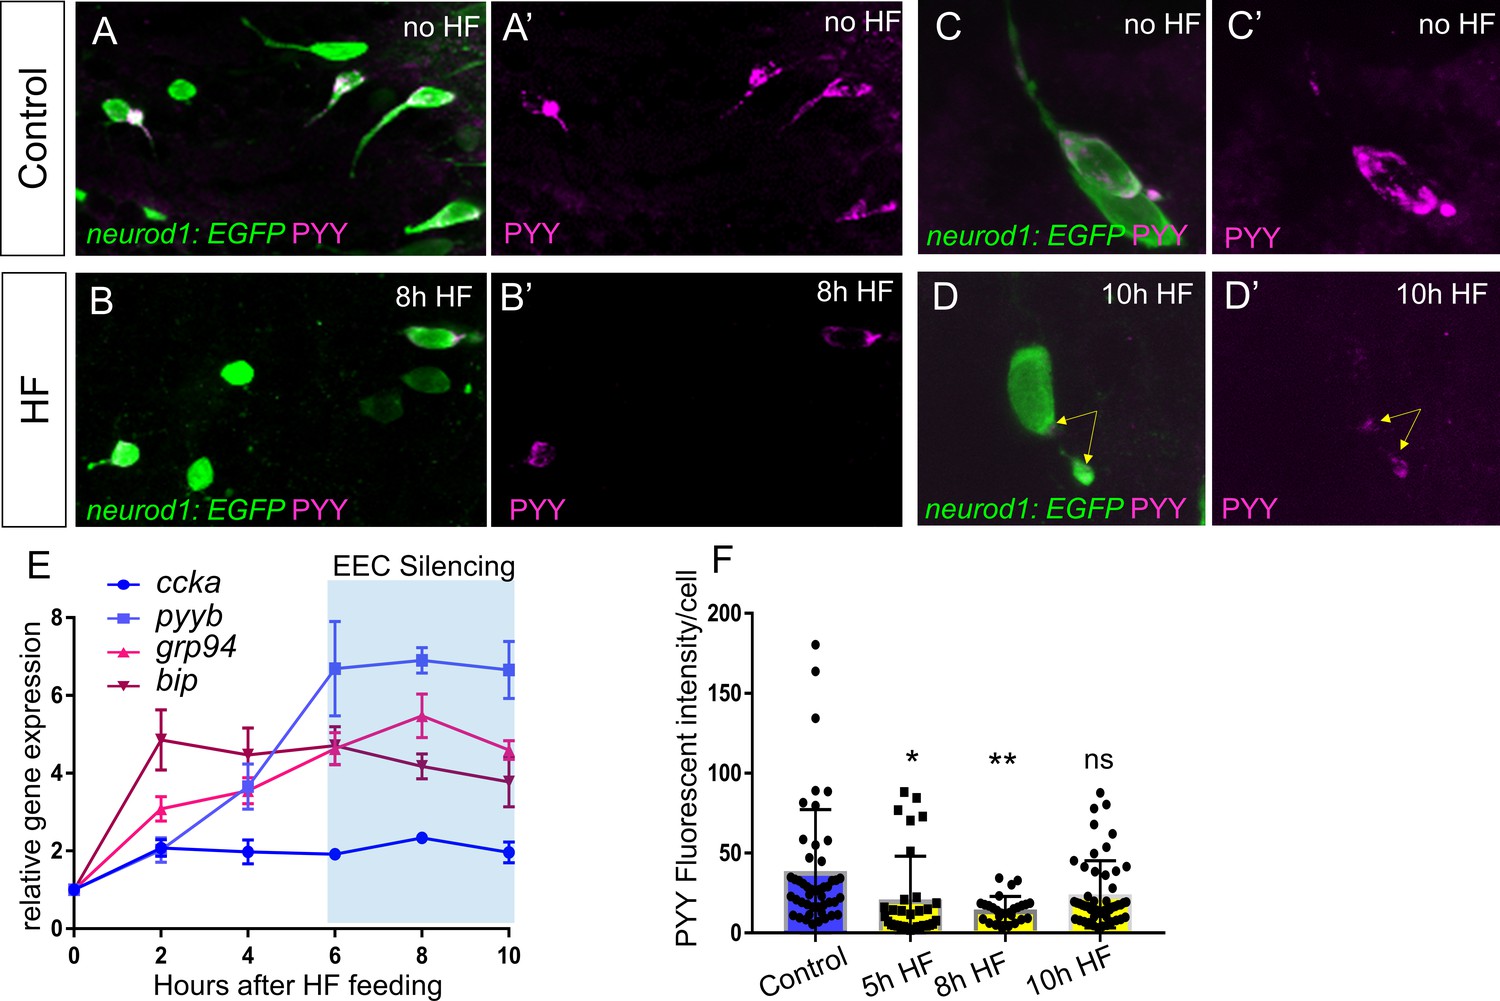
EEC temporal response to HF feeding.
(A–B) Confocoal projections of EECs in control and 8 hr HF fed TgBAC(neurod1:EGFP) zebrafish intestine stained with PYY antibody. (A’–B’) Confocal projections of PYY+ EECs in control and 8 hr HF fed zebrafish intestine. (C–D) Zoom view of PYY+ EECs in control and 10 hr HF fed TgBAC(neurod1:EGFP) zebrafish intestines. (C’–D’) Zoom view of PYY staining in control and 10 hr HF fed zebrafish intestines. Yellow arrows in D’ indicate that in contrast to the control EEC in C’ where PYY staining is distributed in the entire cell, PYY staining in this 10 hr HF fed EEC is only visible at basalateral membrane area. The images in A-D and A’-D’ are taken with the same confocal setting. (E) Quantitative real-time PCR of ccka, pyyb, grp94 and bip expression from control (n = 4), 2 hr (n = 3), 4 hr (n = 4), 6 hr (n = 4), 8 hr (n = 4) and 10 hr (n = 4) post HF fed zebrafish digestive tracts. (F) Quantification of PYY+ cell fluorescence intensity from control (47 cells from six fish), 5 hr (33 cells from seven fish), 8 hr (27 cells from six fish) and 10 hr (51 cells from eight fish) post HF fed zebrafish intestine. One-way ANOVA with post-hoc Tukey test was used in F for statistical analysis. *p<0.05, **p<0.01.
Figure 6—figure supplement 2
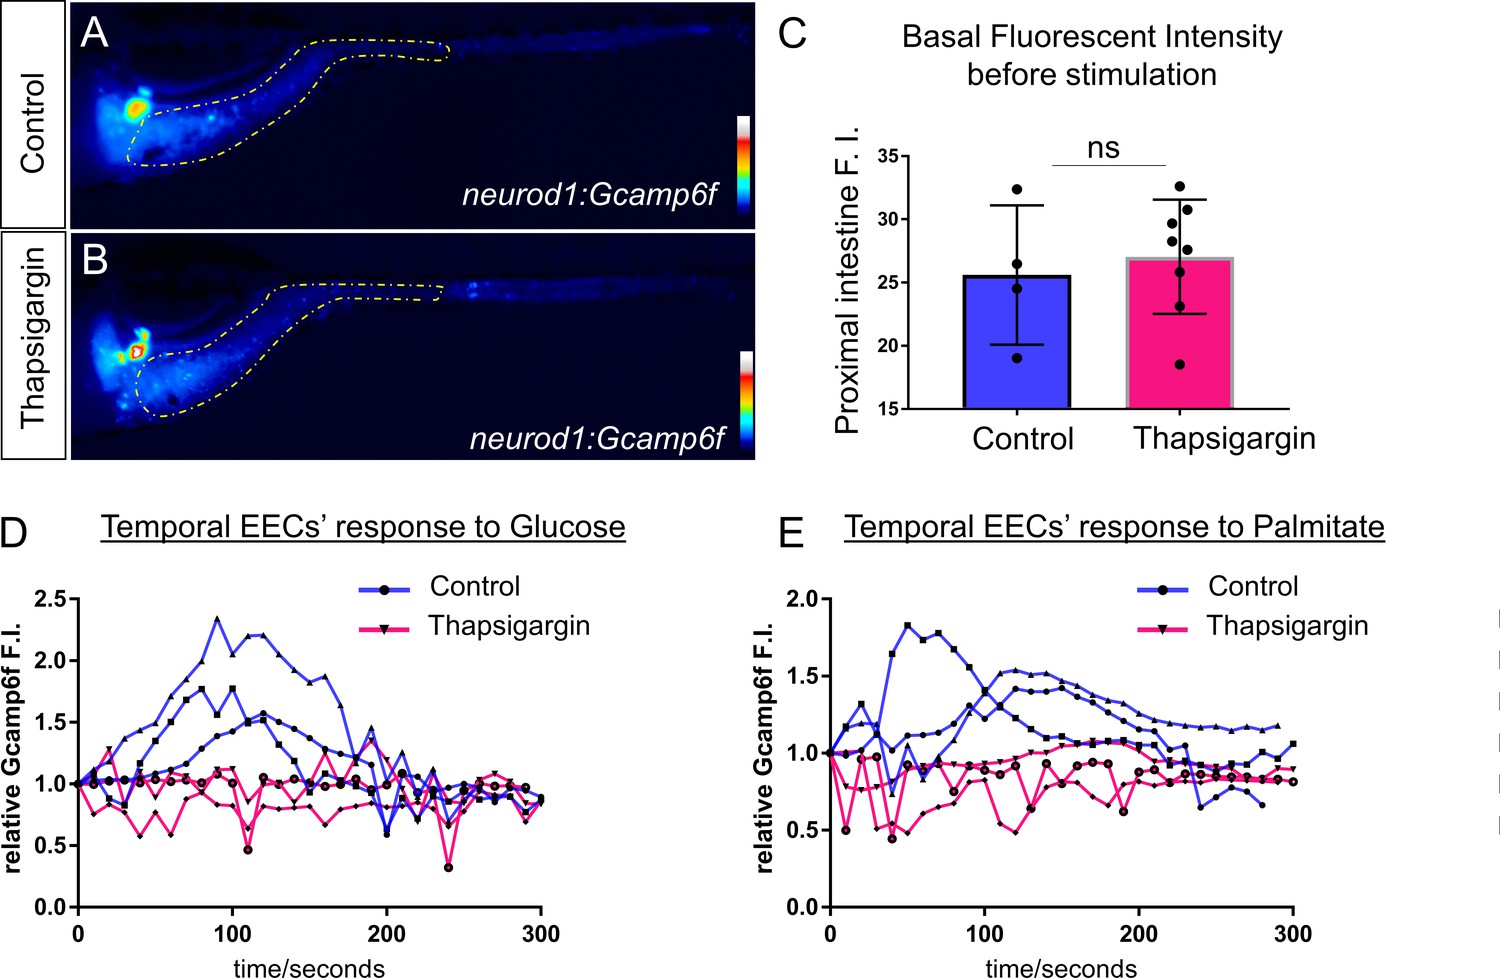
Treatment of Thapsigargin inhibited EEC response to nutrient stimulation.
(A–B) Representative heatmap image of Tg(neurod1:Gcamp6f) zebrafish in control (A) or 2 hr post Thapsigargin treated conditions. Yellow lines in A and B indicate the proximal intestine area that used to quantify the fluoresence intensity in C. (C) Quantification of basal fluoresence in the proximal intestine in control and Thapsigargin treatment zebrafish. (D) Representative EECs’ temporal response to glucose stimulation in control and 2 hr post Thapsigargin treated zebrafish. (E) Representative EECs’ temporal response to palmitate stimulation in control and 2 hr post Thapsigargin treated zebrafish.
Figure 7 with 1 supplement
Orlistat treatment inhibited high fat feeding induced EEC silencing.
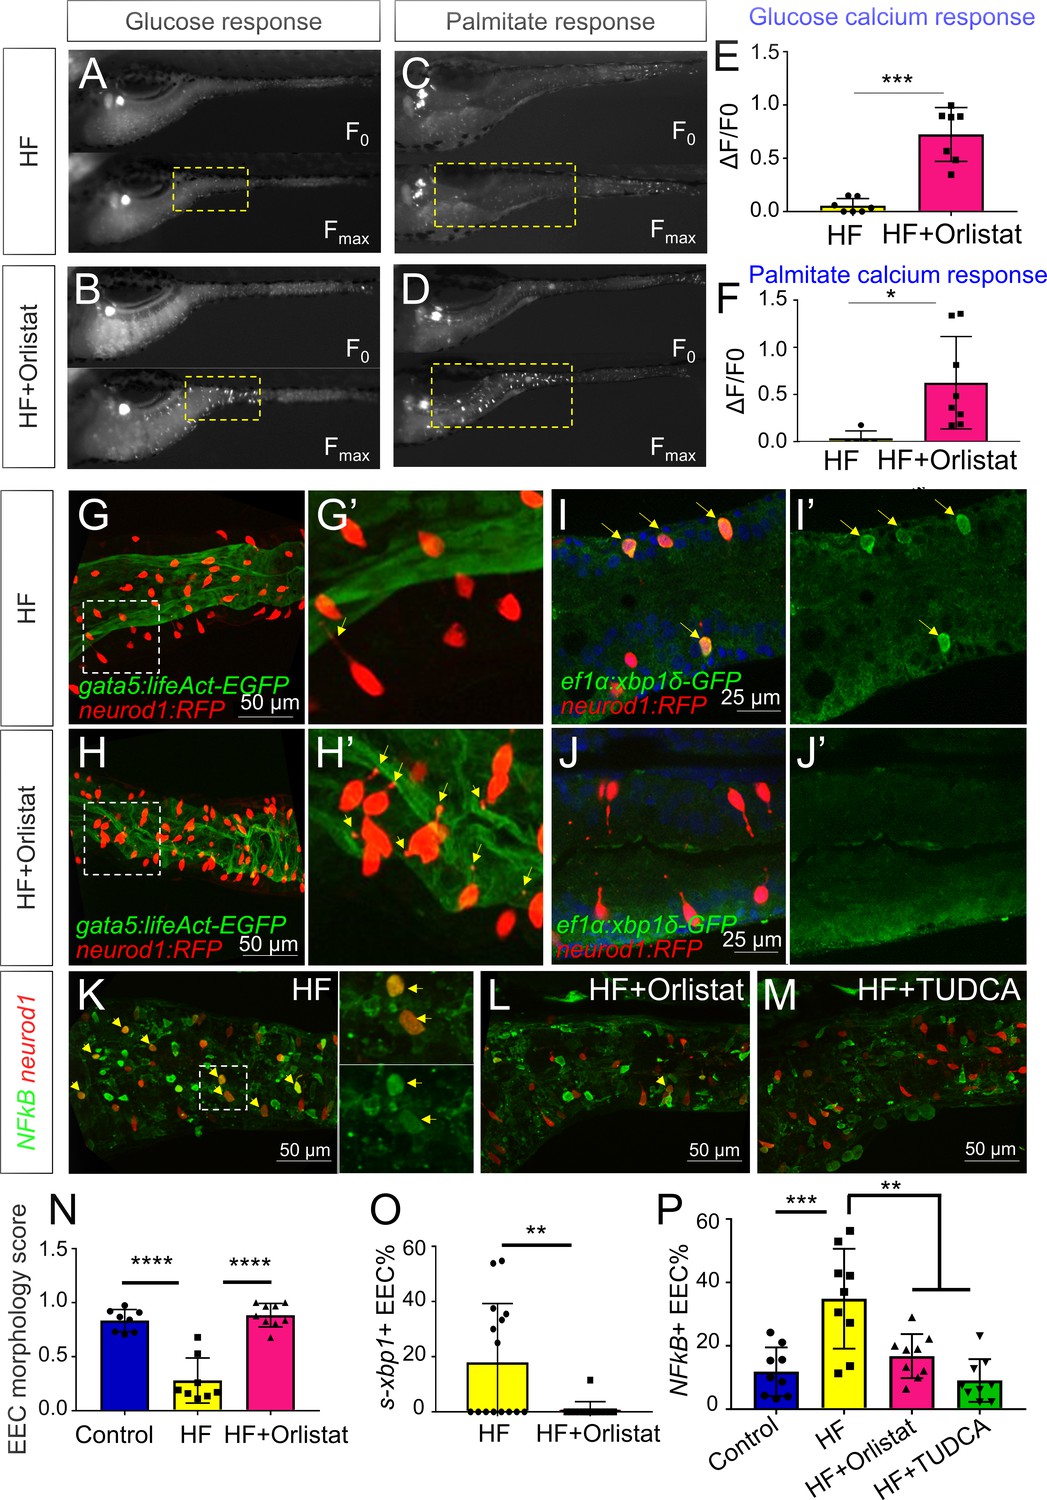
(A–D) Representative image of the EEC calcium response to glucose (A, B) and palmitate (C, D) stimulation in 6 hr high fat (HF) fed and 6 hr HF fed with 0.5 mM orlistat treated Tg(neurod1:Gcamp6f) zebrafish larvae. (E, F) Quantification of the EEC calcium response to glucose and palmitate stimulation in 6 hr HF fed and 6 hr HF fed with 0.5 mM orlistat treated zebrafish larvae. (G–H) Confocal projection of Tg(neurod1:RFP); Tg(gata5:lifeAct-EGFP) zebrafish intestine in 10 hr HF fed larvae (G) and 10 hr HF fed with 0.1 mM orlistat treated larvae (H). (G’–H’) Zoom view of EECs in indicated conditions. The yellow arrows in G’ and H’ indicate the EECs’ apical extensions. (I–J) Confocal images of Tg(neurod1:RFP); Tg(ef1α:xbp1δ-GFP) zebrafish intestine in 6 hr HF fed larvae (I) and 6 hr HF fed with 0.5 mM orlistat treated larvae (J). (I’–J’) Zoom view of EECs in indicated conditions. Yellow arrows in I’ indicate the EECs with activated xbp1 in HF fed condition. (K–M) Confocal images of Tg(neurod1:RFP); Tg(NFΚB:EGFP) zebrafish intestine in 10 hr HF fed larvae (K), 10 hr HF fed larvae treated with 0.1 mM orlistat (L) and 10 hr HF fed larvae treated with 0.5 mM TUDCA (M). Yellow arrows indicate neurod1:RFP+ EECs co-labeled with the NFΚB reporter. (N) Quantification of the EEC morphology score in control, 10 hr HF fed and 10 hr HF fed with 0.1 mM orlistat treated larvae represented in G and H. (O) Quantification of s-xbp1+ EEC (%) in 6 hr HF fed larvae and 6 hr HF fed larvae treated with 0.5 mM orlistat represented in J and K. (P) Quantification of NF-κB+ EECs in control, 10 hr HF fed, 10 hr HF fed with 0.1 mM Orlistat and 10 hr HF fed with 0.5 mM TUDCA treated zebrafish larvae represented in K-M. Student t-test was performed in E, F, O and one-way ANOVA with post-hoc Tukey test was used in N, P for statistical analysis. *p<0.05, **p<0.01, ***p<0.001, ****p<0.0001.
Figure 7—figure supplement 1
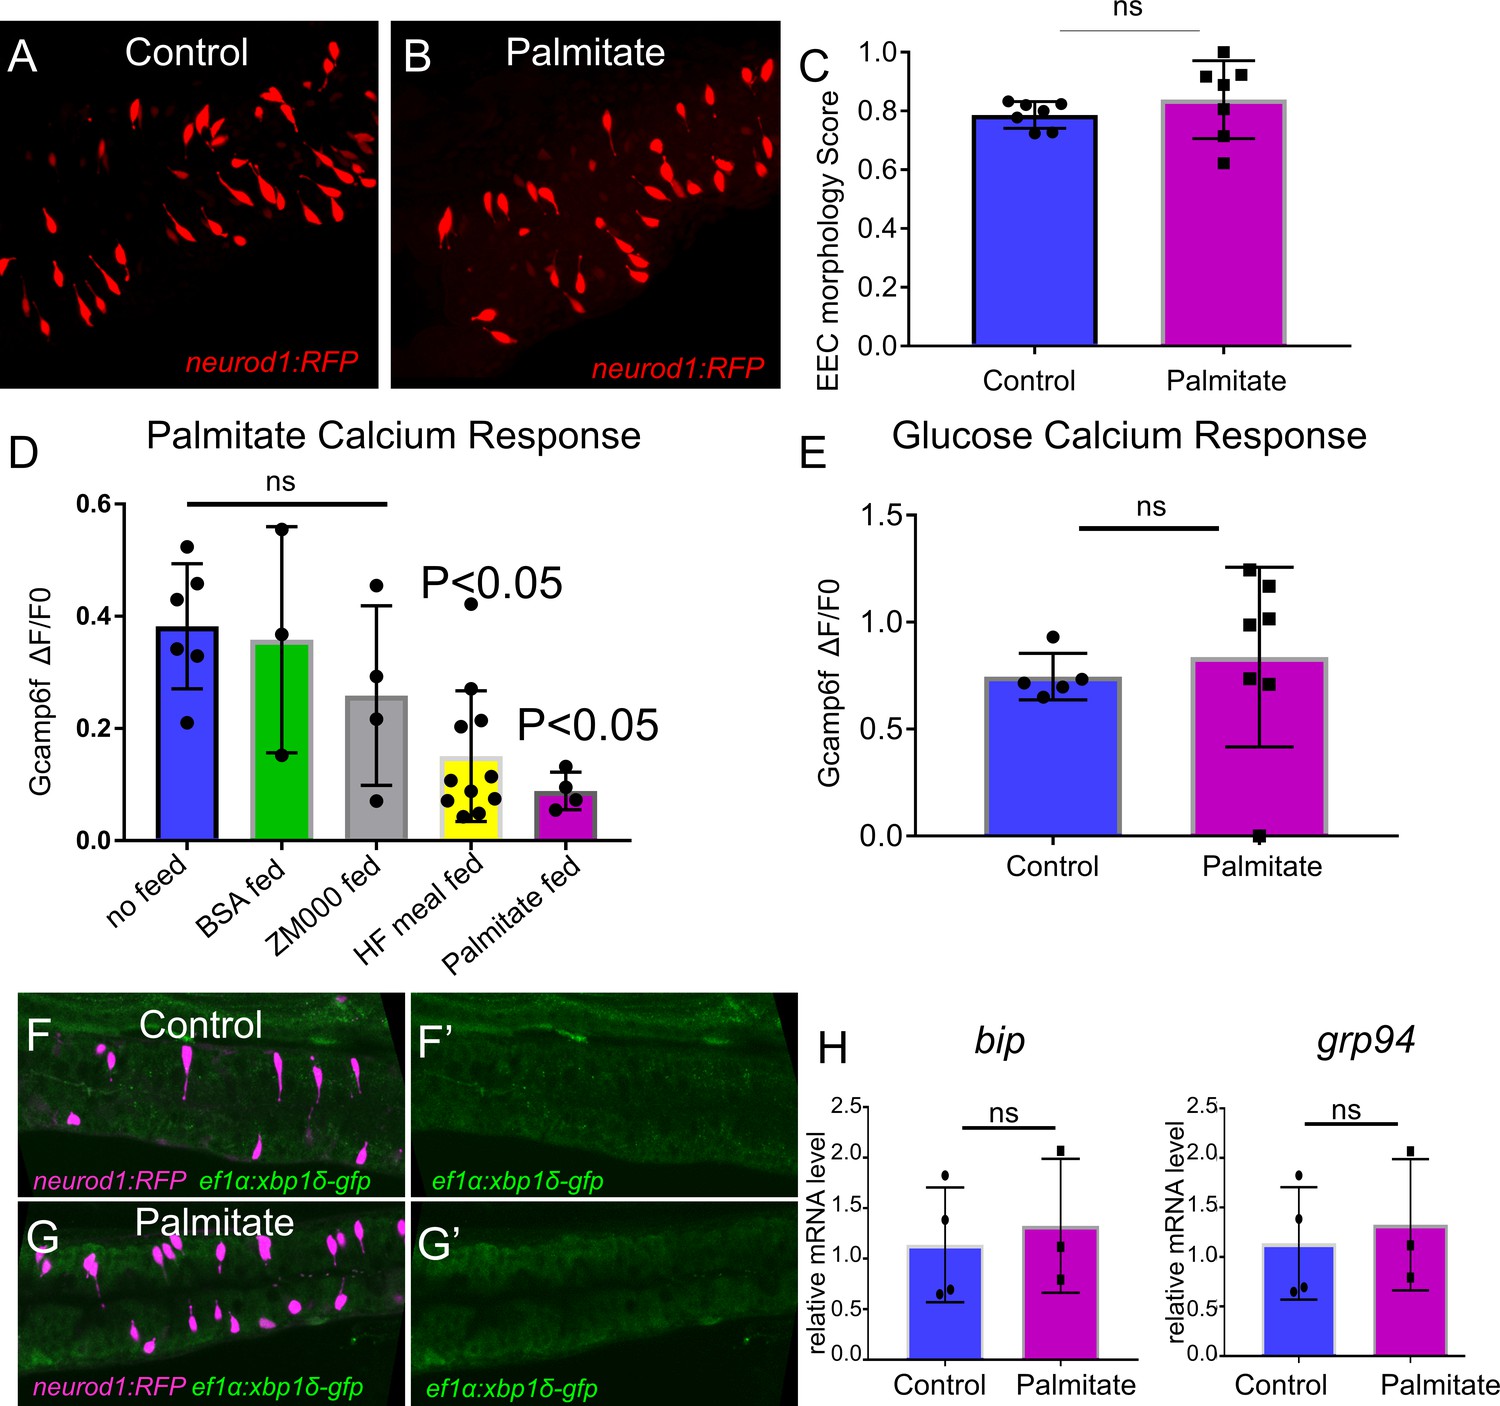
The effect of palmitate feeding on EEC morphology and function.
(A) Confocal image of Tg(neurod1:RFP) zebrafish intestine in control and 6 hr post palmitate feeding zebrafish larvae at 6dpf. (B) EEC morphology score in control and palmitate fed zebrafish larvae. (D) EEC response to palmitate following different dietary manipulations. 6 dpf Tg(neurod1:Gcamp6f) zebrafish were untreated (n = 6) or fed for 6 hr with BSA (n = 3), ZM000 (larvae zebrafish food) (n = 4), HF meal (6.25% chicken egg yolk) (n = 11), or palmitate (n = 4). Only egg yolk and palmitate feeding reduced the EECsresponse to palmitate stimulation. (E) EEC response to glucose stimulation following 6 hr of palmitate feeding. (F–G) Representative confocal image of control (n = 5) and 6 hr palmitate treated (n = 7) intestine in Tg(neurod1:TagRPF); Tg(ef1α:xbp1δ-GFP) zebrafish. (H) Quantitative real-time PCR measurement of relative bip and grp94 mRNA levels from dissected tracts in control (n = 4 biological replicate pools of 20 fish, three technical replicates) and 6 hr palmitate treated (n = 3 biological replicate pools of 20 fish, three technical replicates). Student t-test was used in C, E and H, one-way ANOVA with post-hoc Tukey test was used in D for statisc analysis. *p<0.05, ns p>0.05, not signficicantly different.
Figure 8 with 1 supplement

High fat feeding induced EEC silencing is microbiota dependent.
(A–B) Confocal images of 6 dpf zebrafish intestines from conventionalized (CV) and germ free (GF) larvae following 10 hr of high fat (HF) feeding. EECs are marked with Tg(neurod1:RFP) and the apical lumen of intestine is marked with Tg(gata5:lifeAct-EGFP). (A’–B’) Zoom view of EECs from CV and GF zebrafish following HF feeding. Yellow arrows in B’ indicate EEC apical extensions in HF fed GF zebrafish. (C–F) Representative images of the EEC calcium response toward palmitate stimulation in CV and GF Tg(neurod1:Gcamp6f) larvae with or without 6 hr of HF feeding. (G–H) Quantification of the EEC calcium response to palmitate stimulation represented in C-F. (I) Quantification of the EEC morphology score in CV and GF zebrafish larvae with or without 10 hr of HF feeding represented in A and B. (J) Quantification of xpb1+ EECs (%) in CV and GF Tg(neurod1:RFP); Tg(ef1α:xbp1δ-GFP) zebrafish larvae with or without 6 hr HF feeding. (K) Quantification of NF-κB+ EECs (%) in CV and GF Tg(neurod1:RFP); Tg(NFkB:EGFP) zebrafish larvae with or without 10 hr HF feeding. Student t-test was used in G,H and one-way ANOVA with post-hoc Tukey test was used in I-K for statistical analysis. *p<0.05, **p<0.01, ****p<0.0001.
Figure 8—figure supplement 1
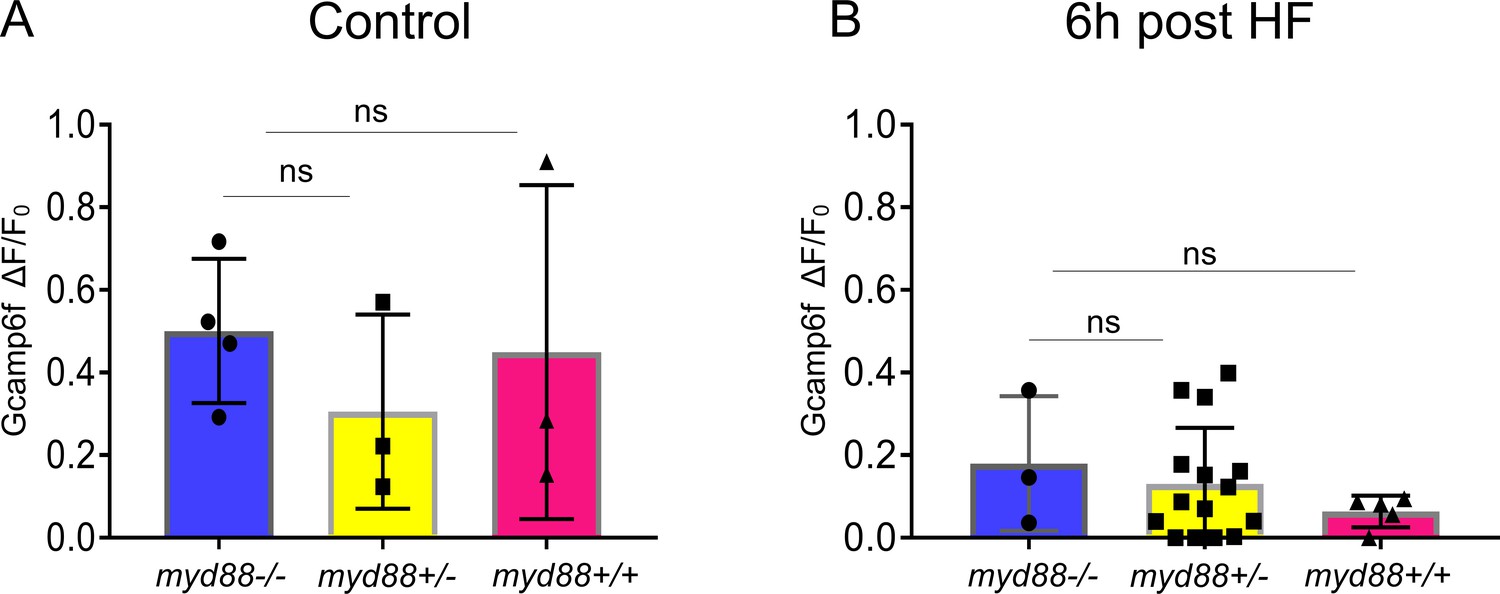
EEC sensitivity to palmitate stimulation is not altered in myd88 mutant zebrafish.
Tg(neurod1:Gcamp6f); myd88+/- fish were crossed with Tg(neurod1:Gcamp6f) fish and sorted at 3 dpf. Response to palmitate stimulation was assessed afterwhich the genotypes of zebrafish were determined. (A) Quantification of the EEC response to palmitate stimulation in 6 dpf Tg(neurod1:Gcamp6f) zebrafish under control conditions. No differences were observed among different genotypes. (B) Quantification of EECs’ response to palmitate stimulation in six dpf Tg(neurod1:Gcamp6f) zebrafish 6 hr after high fat (HF) feeding. One-way ANOVA with post-hoc Tukey test was used in A, B for statistical analysis and no statistical differences were observed among different genotypes.
Figure 9 with 3 supplements
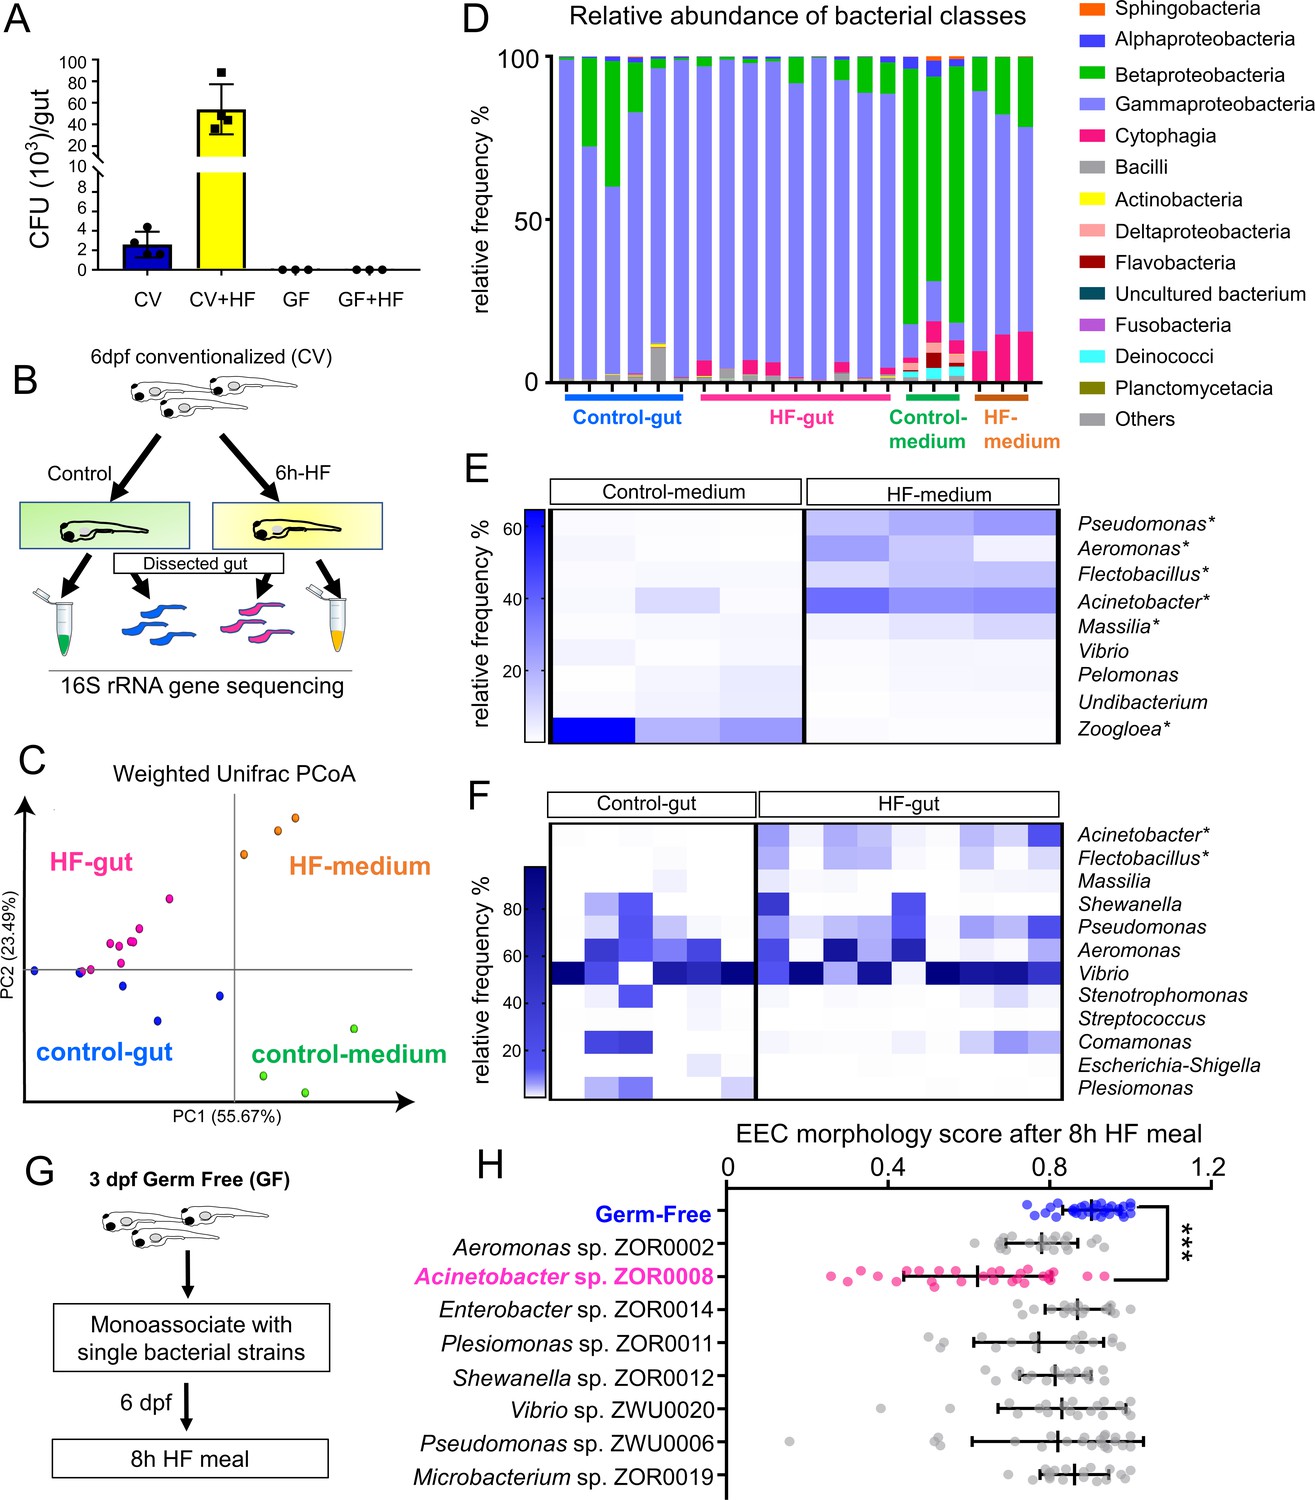
High fat feeding modifies microbiota composition.
(A) Colony forming unit (CFU) quantification in GF and CV dissected intestines with or without 6 hr of high fat (HF) feeding. (B) Experimental design of 16S rRNA gene sequencing in control larvae dissected gut and medium and 6 hr HF fed larvae dissected gut and medium. (C) Weighted UniFrac principal coordinates analysis (PCoA) of 16S rRNA gene sequences from control and HF fed gut and media samples The % variation explained by principal components (PC) 1 and 2 are shown on their respective axes. (D) Relative abundance of bacterial classes in control and HF fed gut and media. (E–F) Change in representative bacterial genera following HF feeding in gut and media. Asterisks indicate taxa with p<0.05 by LEfSe analysis. (G) Schematic of monoassociation screening to investigate the effects of specific bacterial strains on EEC morphology. Three dpf zebrafish larvae were colonized with one of the isolated bacterial strains and EEC morphology was scored after 8 hr high fat meal feeding in 6 dpf GF and monoassociated animals. (H) EEC morphology score of GF and monoassociated zebrafish larvae following 8 hr high fat feeding. Data were pooled from three independent experiments, with each dot representing an individual animal. The EEC morphology score in Acinetobacter sp. ZOR0008 monoassociated animals was significantly lower than GF EECs (p<0.001). No consistent significant differences were observed in other monoassociated groups. One way ANOVA followed by Tukey’s post-test was used in H for statistical analysis.
Figure 9—figure supplement 1
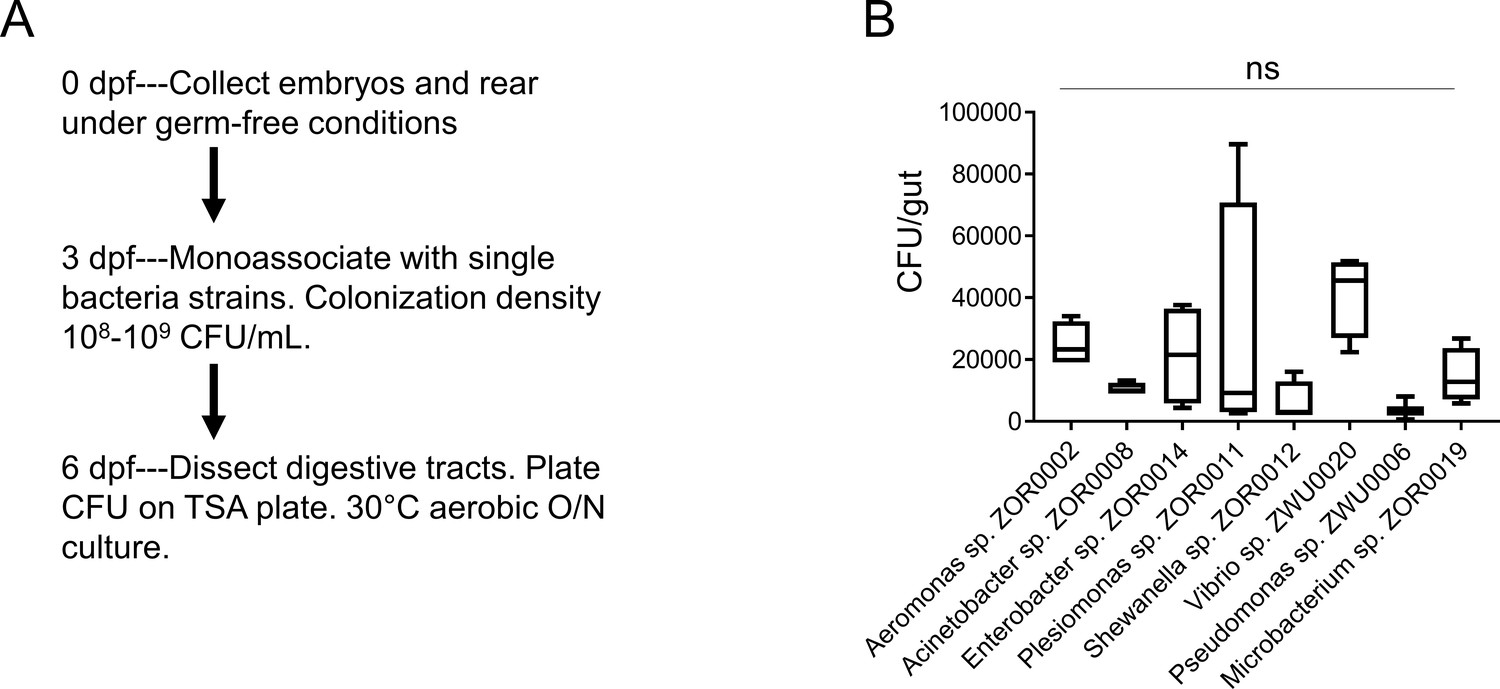
Colonization of bacterial strains during monoassociation.
(A) Schematics of the experimental design. The digestive tracts from five zebrafish larvae were dissected and pooled, and CFU analysis was performed to assess the colonization efficiency for bacterial strains that were used for monoassociation. (B) CFU quantification of zebrafish larvae samples that were monoassociated with different bacterial strains. One-way ANOVA with post-hoc Tukey test was used in B for statistical analysis and no statistical differences among groups were observed (n = 4 for each group except for pseudomonas sp. ZWU0006 n = 3).
Figure 9—figure supplement 2
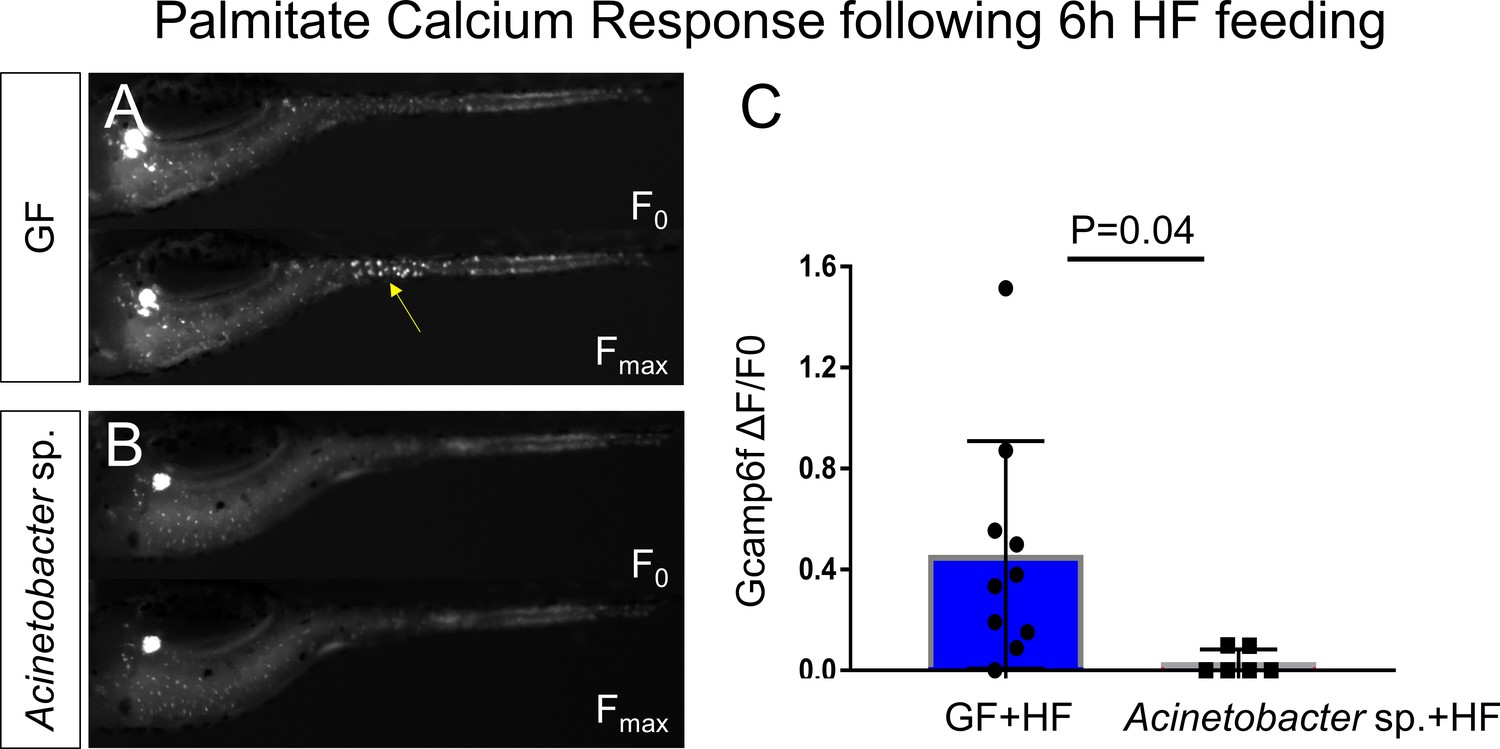
Acinetobacter sp. ZOR0008 monoassociated zebrafish EECs do not respond to palmitate stimulation after HF feeding.
(A–B) Representative images of the EEC calcium response to palmitate stimulation in HF fed GF zebrafish (A) and HF fed Acinetobacter sp. monoassoicated zebrafish (B). (C) Quantification of EEC calcium response toward palmitate stimulation. Student t-test was used in C for statistical analysis.
Figure 9—figure supplement 3
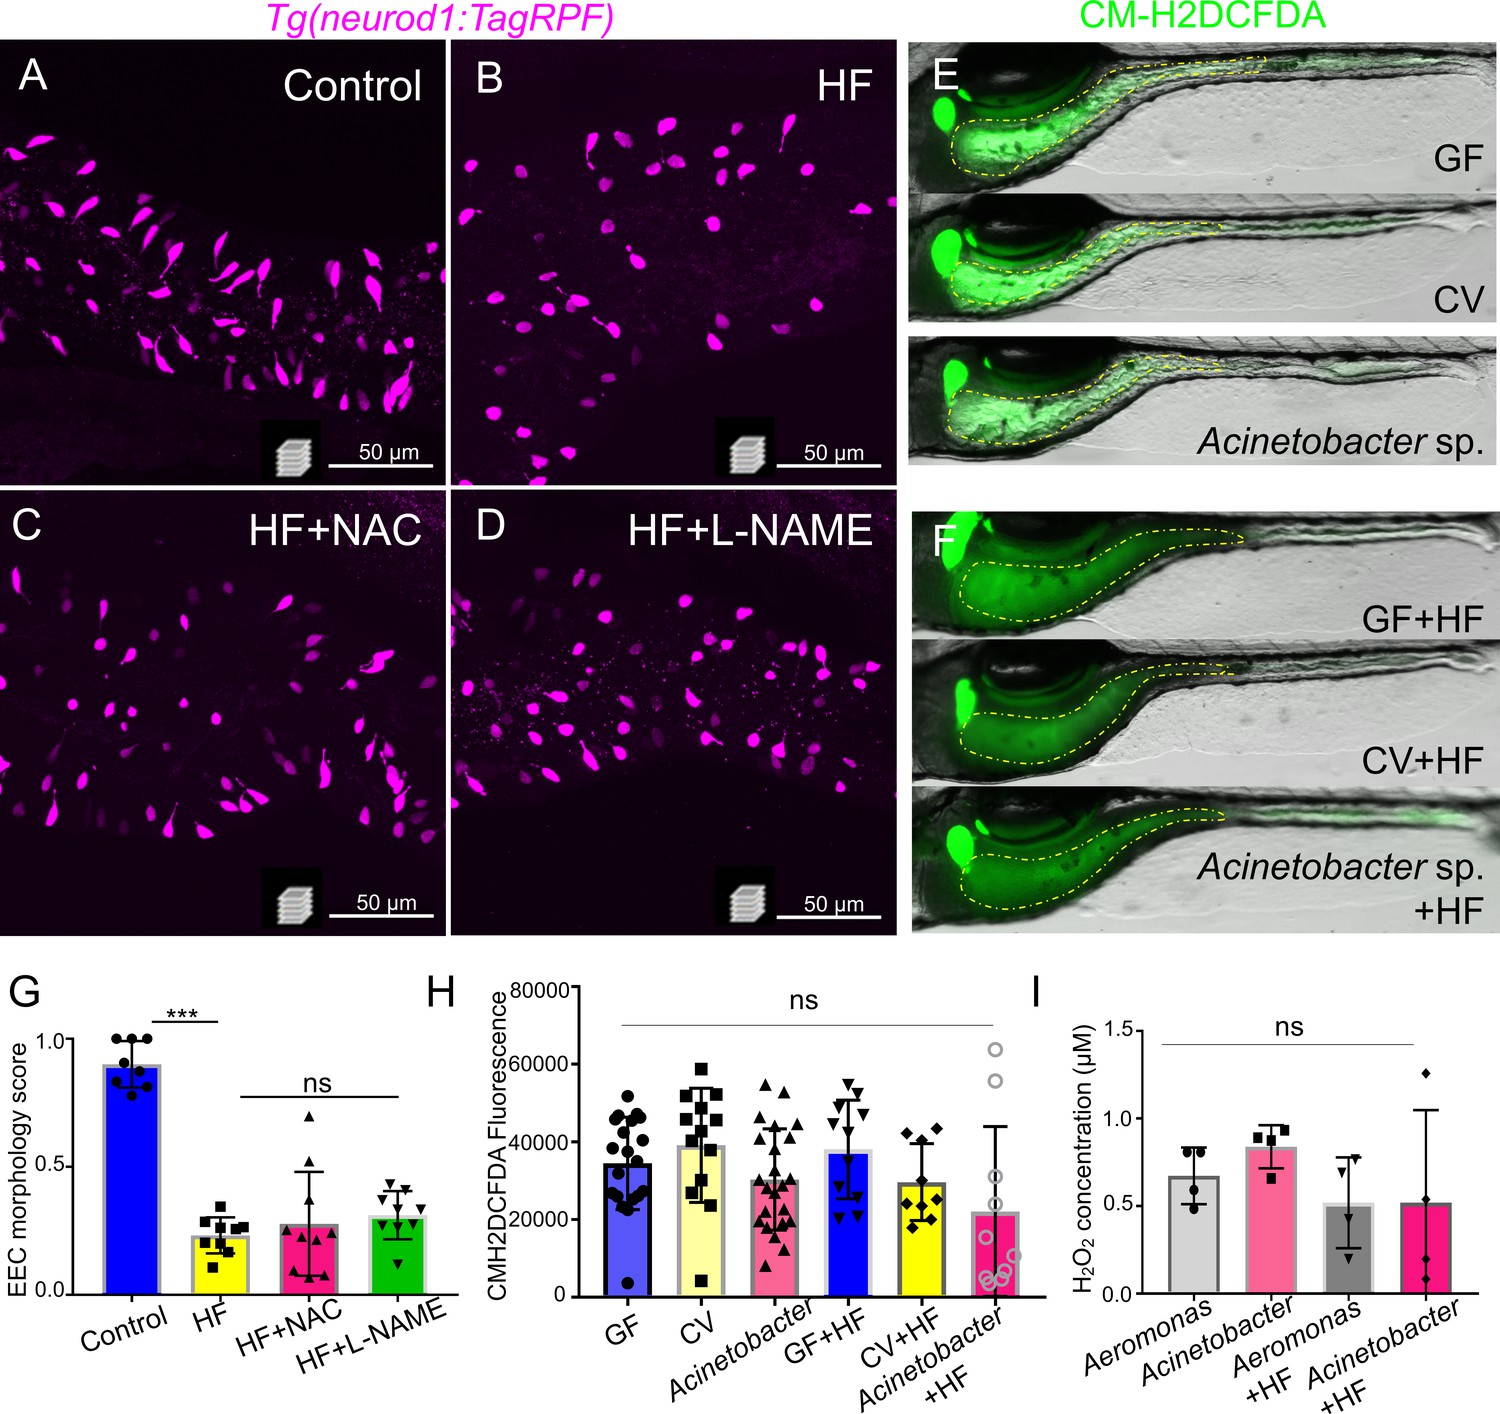
Inhibition of ROS signaling does not prevent HF feeding induced EEC silencing.
(A–D) Representative confocal projection images of EECs (magenta) in Tg(neurod1:RFP) zebrafish under control conditions, HF feeding, HF feeding with the ROS inhibitor N-acetylcysteine (NAC), and HF feeding with the NOS inhibitor N(gamma)-nitro-L-arginine methyl ester (L-NAME). (E–F) Representative images of intestines in GF, CV and Acinetobacter sp. ZOR0008 monoassociated control or 6 hr HF fed zebrafish. The intestinal luminal ROS was labeled with CM-H2DCFDA. (G) Quantification of EEC morphology in control, HF fed, HF fed with NAC or L-NAME treated zebrafish. (H) Quantification of proximal intestinal lumenal CM-H2DCFDA fluoresence intensity in GF, CV and Acinetobacter sp. monoassociated control or 6 hr HF fed zebrafish. (I) In vitro measurement of the H2O2 concentration in 1010 CFU Aeromonas sp. ZOR0002 and Acinetobacter sp. ZOR0008 that were cultured in Trypticase Soy Broth or 5% egg yolk in water (HF).
Figure 10
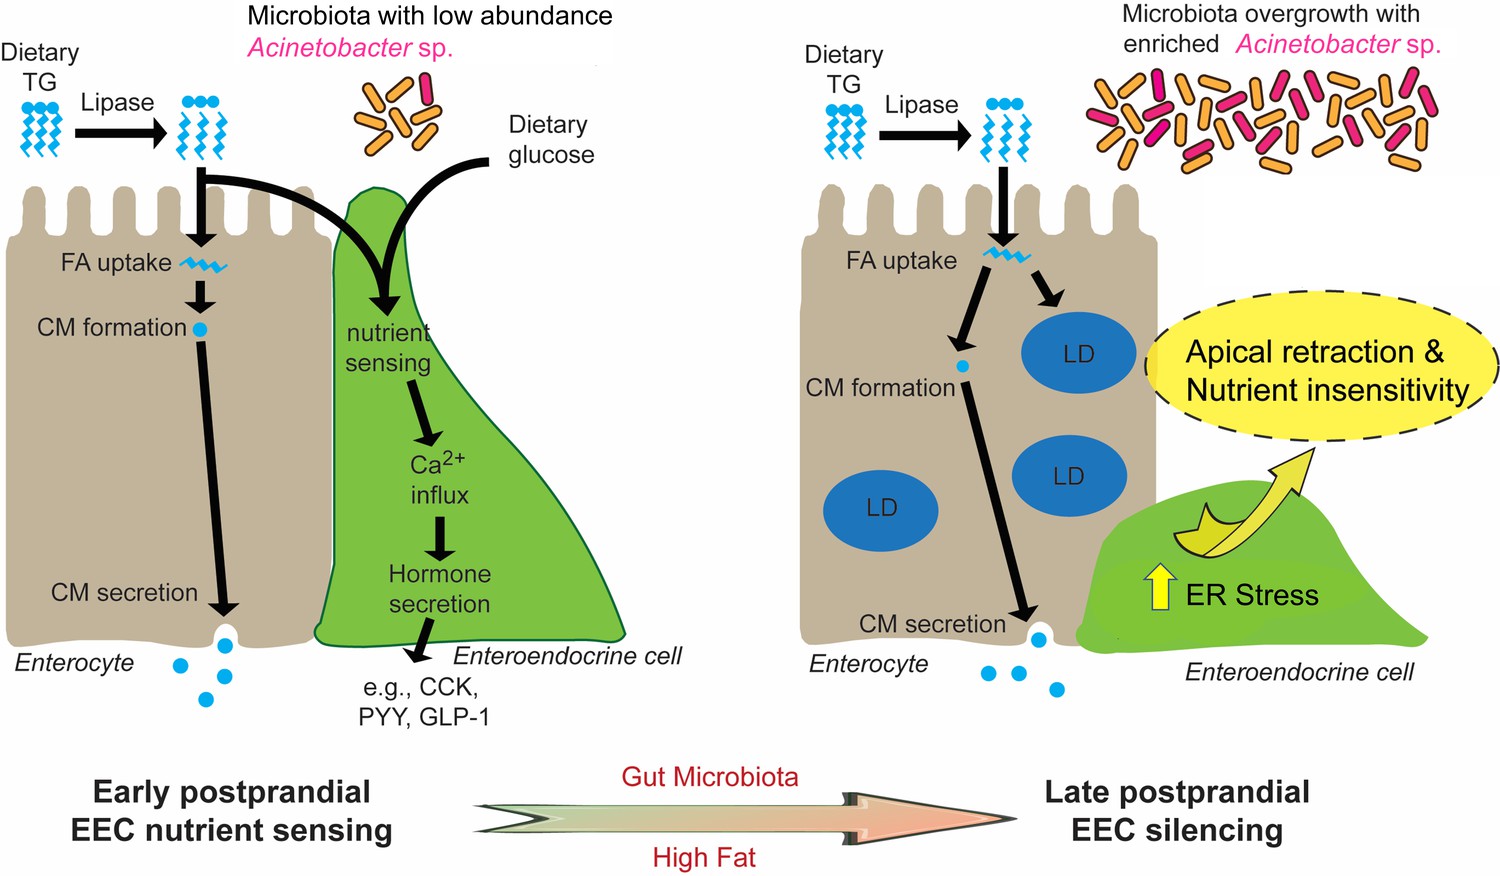
Proposed model for microbiota-dependent HF feeding-induced EEC silencing.
At early postprandial stages after consumption of a high fat (HF) meal, dietary triglyceride (TG) is hydrolyzed to monoglycerides and free fatty acids (FA) by lipases in the gut lumen. FA are taken up by enterocytes and re-esterified into TG which is packaged into chylomicrons (CM) for basolateral secretion. FA and dietary glucose stimulate EECs, increasing [Ca2+]i and inducing secretion of hormones like CCK, PYY and GLP-1. During and after HF feeding, FA taken up by enterocytes are stored in cytosolic lipid droplets (LD) in addition to secreted CM. Moving into later postprandial stages, HF feeding and presence of gut microbiota lead to ER stress in EECs. HF feeding also promotes overgrowth of the gut bacterial community including enrichment of Acinetobacter sp. Activation of ER stress pathways by these nutritional and microbial stimuli cause EECs to retract their apical processes and reduce their nutrient sensitivity at the late postprandial stage, a process we call ‘EEC silencing’.
Author response image 1
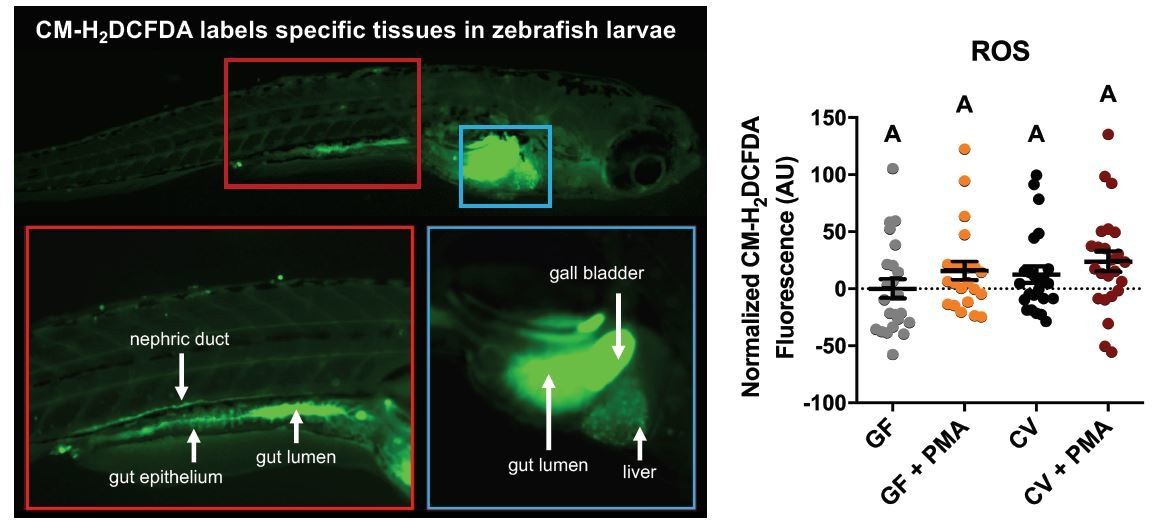
CM-H2DCFA (a molecular probe indicating ROS levels) shows highest activity in the gut lumen, gall bladder, gut epithelium, and nephric duct in 6dpf conventionally-raised zebrafish larvae (left panel).
Platereader measurements of CM-H2DCFA levels in GF and CV zebrafish larvae with or without PMA induction, show no significant differences (right panel).
Videos
Video 1
EEC calcium response to water, BSA, palmitate, glucose and cysteine administration in Tg(neurod1:Gcamp6f) zebrafish larvae at 6dpf [10 s/frame for 5 or 10 min (cysteine)].
Video 2
EEC calcium response to palmitate stimulation in control and 6 hr high fat fed Tg(neurod1:Gcamp6f) zebrafish larvae at 6dpf (10 s/frame for 5 min).
Video 3
EEC calcium response to glucose stimulation in control and 6 hr high fat fed Tg(neurod1:Gcamp6f) zebrafish larvae at 6dpf (10 s/frame for 5 min).
Video 4
Confocal Z stack images in Tg(neurod1:RFP); TgBAC(gata5:lifeAct-EGFP) control zebrafish larvae at 6 dpf.
The apical surface of the intestinal epithelium was labeled by gata5:lifeAct-EGFP. Note that the apical protrusion of EECs extend to the intestinal lumen.
Video 5
Confocal Z stack image in Tg(neurod1:RFP); TgBAC(gata5:lifeAct-EGFP) 10 hr high fat fed zebrafish larvae at 6 dpf.
Note that the majority of EECs have lost their apical protrusions.
Video 6
Time lapse video of intestine in control Tg(neurod1:lifeAct-EGFP) zebrafish larvae at 6dpf.
(10 s/frame for 16 min).
Video 7
Confocal Z stack image of Tg(ef1α:xbp1δ-GFP) control zebrafish intestine at 6 dpf.
Video 8
Confocal Z stack image of Tg(ef1α:xbp1δ-GFP) 6 hr high fat fed zebrafish intestine at 6 dpf.
Note the induction of s-xbp1+ cells in the intestinal epithelium.
Tables
Key resources table
| Reagent type (species) or resource | Designation | Source or reference | Identifiers | Additional information |
|---|---|---|---|---|
| Genetic reagent (D. rerio) | TgBAC(neurod1:EGFP)nl1 | PMID: 19424431 | ||
| Genetic reagent (D. rerio) | Tg(−5kbneurod1:TagRFP)w69 | PMID: 22738203 | Referred as Tg(neurod:RFP) in the paper | |
| Genetic reagent (D. rerio) | Tg(sst2:RFP)gz19 | PMID: 19281772 | ||
| genetic reagent (D. rerio) | Tg(gcga:EGFP)ia1 | PMID: 25852199 | ||
| Genetic reagent (D. rerio) | Tg(−5kbneurod1:Gcamp6f)icm05 | PMID: 27231612 | Referred as Tg(neurod1:Gcamp6f) in the paper | |
| Genetic reagent (D. rerio) | Tg(−4.5kbfabp2:DsRed)pd1000 | PMID: 21439961 | Referred as Tg(fabp2:DsRed) in the paper | |
| Genetic reagent (D. rerio) | TgBAC(gata5:lifeAct-EGFP)pd1007 | this study | Generated in this study, Used in Figures 4, 5, 6, 7, 8 and 9 | |
| Genetic reagent (D. rerio) | Tg(ef1α:xbp1δ-gfp)mb10 | PMID: 25892297 | ||
| Genetic reagent (D. rerio) | Tg(NFΚB:EGFP)nc1 | PMID: 21439961 | ||
| Genetic reagent (D. rerio) | Tg(−5kbneurod1:lifeAct-EGFP)rdu70 | this study | Referred as Tg(neurod1:lifAct-EGFP) in the paper, Generated in this study, Used in Figure 4 | |
| Genetic reagent (D. rerio) | Tg(−5kbneurod1:Gal4; cmlc2:EGFP)rdu71 | this study | Referred as Tg(neurod1:Gal4) in the paper, Generated in this study, Used in Figure 5 | |
| Genetic reagent (D. rerio) | Tg(UAS:Kaede)rk8 | PMID: 17406330 | ||
| Genetic reagent (D. rerio) | Tg(ubb:seca5-tdTomato)xt24 | PMID: 31391308 | ||
| Genetic reagent (D. rerio) | TgBAC(cd36-RFP)pd1203 | this study | Generated in this study, Used in Figure 4—figure supplement 4 | |
| Genetic reagent (D. rerio) | Tg(tp1bglob:EGFP)um14 | PMID: 26153247 | Referred as Tg(tp1:EGFP) in the paper | |
| Genetic reagent (D. rerio) | TgBAC(cldn15la:EGFP)pd1034 | PMID: 24504339 | ||
| Genetic reagent (D. rerio) | myd88b1354 | PMID: 30398151 | ||
| Antibody | anti-PYY (Rabbit Polycolonal) | PMID: 28614796 | Custom antibody generated in Liddlelaboratory, aa4-21 (mouse), IHC (1:100) | |
| Antibody | anti-CCK (Goat Polycolonal) | Santa Cruz | Cat# sc-21617, RRID:AB_2072464 | IHC (1:100) |
| Antibody | anti-Sglt1 (Rabbit Polycolonal) | Abcam | Cat# ab14686, RRID:AB_301411 | IHC (1:100) |
| Antibody | GFP (Chicken Polycolonal) | Aves Lab | Cat# GFP-1010, RRID:AB_2307313 | IHC (1:500) |
| Antibody | DsRed (Rabbit Polycolonal) | TAKARA | Cat# 632496, RRID:AB_10013483 | IHC (1:250) |
| Commercial assay or kit | CM-H2DCFDA | Thermofisher | C6827 | |
| Commercial assay or kit | ROS colorimetric assay kit | Sigma | MAK311 | |
| Chemical compond, drug | Phloridzin | Sigma | P3449 | |
| Chemical compond, drug | Thapsigargin | Sigma | T9033 | |
| Chemical compond, drug | Brefeldin A | Sigma | B6542 | |
| Chemical compond, drug | Sodium tauroursodeoxycholic acid | Sigma | T0266 | |
| Chemical compond, drug | Orlistat | Sigma | O4139 | |
| Chemical compond, drug | N-acetylcysteine | Invitrogen | C10491 | |
| Chemical compond, drug | N(ω)-nitro-L-arginine methyl ester | Sigma | N5751 |
Author response table 1
| Experiment | Time required | Timeline | |
|---|---|---|---|
| a | EEC silencing-ROS inhibitor | 3 weeks | |
| b c | in vitro bacteria ROS measurement in vivo ROS measurement | 2 weeks 2 weeks 2 weeks | Month 1 |
| d | in vitro lipid peroxide | ||
| e | Adult fish EEC silencing | ||
| f | GF, CV basal EEC morphology | ||
| g | SCFA | ||
| h | TGR5 | 2 weeks | |
| i | EEC silencing reversal | ||
| j | Gcamp-ER stress | ||
| k | EEC volume measurement | 3 weeks 2 weeks | Month 2 |
| l m | Orai-Stim inhibitor TRPM inhibitor | ||
| n | Temporal ER stress measurement | ||
| o | FACS-EEC qPCR | ||
| p | BFA EEC calcium response | 2 weeks | |
| q | Palmitate ER stress | ||
| r | Acinetobacter EEC calcium | 3 weeks |
Additional files
-
Supplementary file 1
Sequence of the primers that were used for real-time quantitative PCR.
- https://cdn.elifesciences.org/articles/48479/elife-48479-supp1-v2.xlsx
-
Supplementary file 2
Amplicon sequence variant table of 16S rRNA gene sequencing analysis.
- https://cdn.elifesciences.org/articles/48479/elife-48479-supp2-v2.xlsx
-
Supplementary file 3
LEfSe analysis of relative taxa abundance in sequenced media samples.
- https://cdn.elifesciences.org/articles/48479/elife-48479-supp3-v2.xlsx
-
Supplementary file 4
LEfSe analysis of relative taxa abundance in sequenced gut samples.
- https://cdn.elifesciences.org/articles/48479/elife-48479-supp4-v2.xlsx
-
Transparent reporting form
- https://cdn.elifesciences.org/articles/48479/elife-48479-transrepform-v2.docx
Download links
A two-part list of links to download the article, or parts of the article, in various formats.
Downloads (link to download the article as PDF)
Open citations (links to open the citations from this article in various online reference manager services)
Cite this article (links to download the citations from this article in formats compatible with various reference manager tools)
High fat diet induces microbiota-dependent silencing of enteroendocrine cells
eLife 8:e48479.
https://doi.org/10.7554/eLife.48479


