Fgf-signaling is compartmentalized within the mesenchyme and controls proliferation during salamander limb development
- University of Kentucky, United States
- Cold Spring Harbor Laboratory, United States
Figures
Figure 1 with 2 supplements
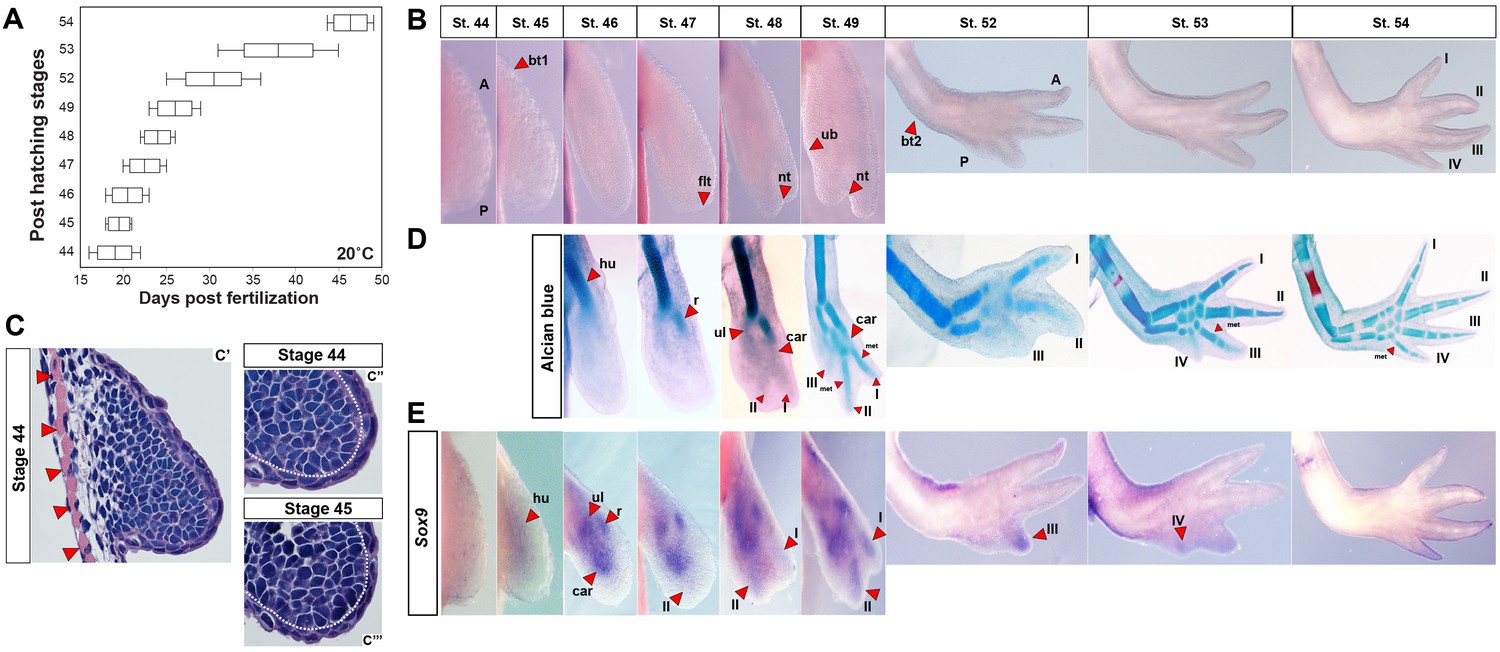
Skeletal chondrification proceeds anterior to posterior within the zeugopod and autopod during axolotl forelimb development.
(A) Box plot depicting post-hatching limb stages at 20°C (n = 35 total). Central line within the box = median number of larvae for that stage; edges of the box = 25th and 75th quartiles and the whiskers = the interquartile range. (B) Normal, identifiable stages viewed dorsally with anterior (A) at the top and posterior (P) at the bottom (not to scale). For scaled limb stages see Figure 1—figure supplement 1. Key stage indicators used: st. 45: bending of limb bud at anterior body wall junction (bt1), st. 46: length doubling along proximodistal axis, st. 47: dorsoventral flattening of distal bud (flt), st. 48: notch (nt) appears separating digit 1 and 2, st. 49: ulnar bulge (ub) appears, st. 52: elbow bend appears (bt2) along with prominent separation of three digits and st. 54: digit four present. (C) H and E stained forelimb buds at stages 44 (C’–C”) and 45 (C’”) show no evidence of an AER and skeletal muscle (red arrows) underlies the emerging limb bud. White dotted lines (C”–C”’) delineate mesenchyme from ectoderm. Ectoderm covering the limb is consistent with flank ectoderm (1–2 cells thick). (D) Alcian blue-Alizarin red staining reveal preaxial pattern of chondrogenesis (n = 3–4/stage). Cartilage condensations abbreviated: humerus (hu), radius (r), ulna (ul), carpal (car), metacarpal (met) and digits 1–4 (I–IV). (E) Expression domains of the pre-condensation marker Sox9 during forelimb development. Sox9 is diffusely expressed at stage 45, whereas three discreet domains of Sox9 expression begin at stage 46 marking the ulna (ul), radius (r) and carpals (car). Sox9 expression in presumptive digit II is first observable at stage 47 and precedes digit I expression which occurs during late stage 48. Sox9 expression in the remaining digits occurs anterior to posterior.
Figure 1—figure supplement 1
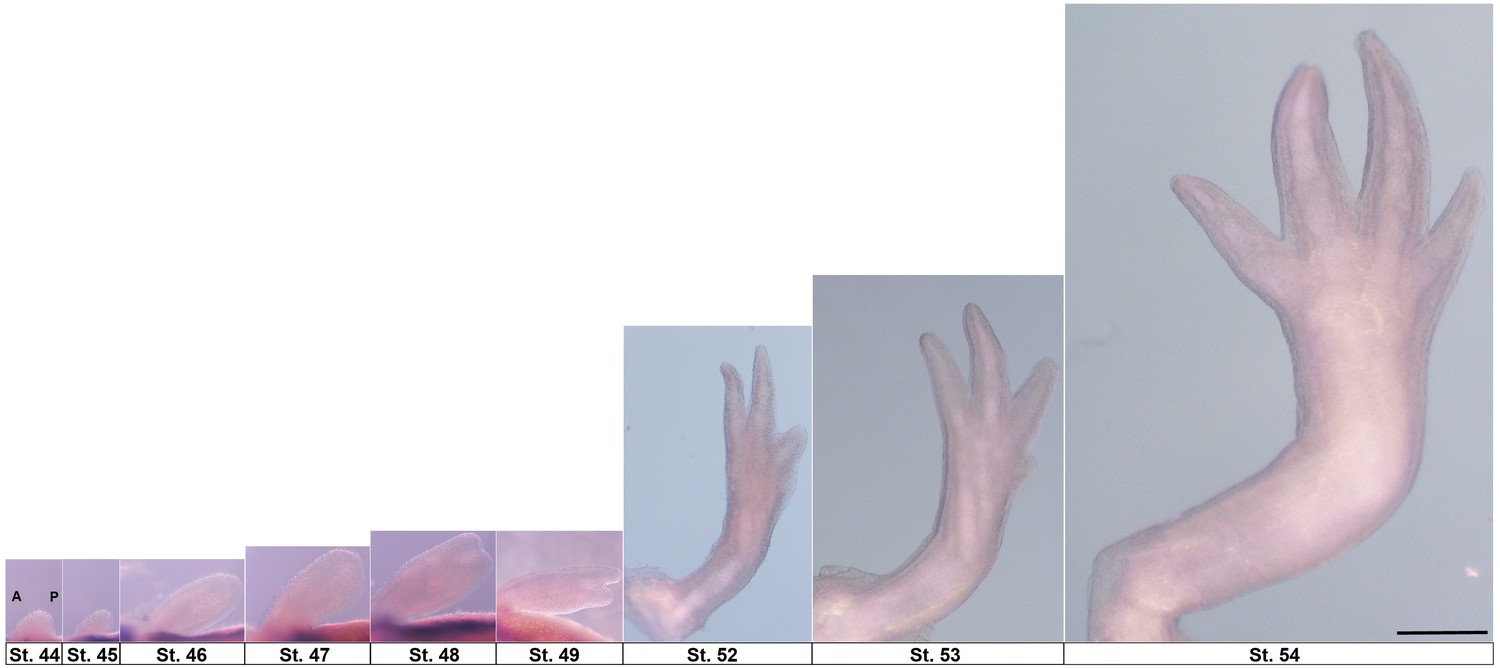
Forelimb development stages scaled with respect to final larval limb.
Stages 44–54 with anterior at left of image (A) and posterior at right (P). Limbs are right forelimbs. Scale bar = 1 mm.
Figure 1—figure supplement 2
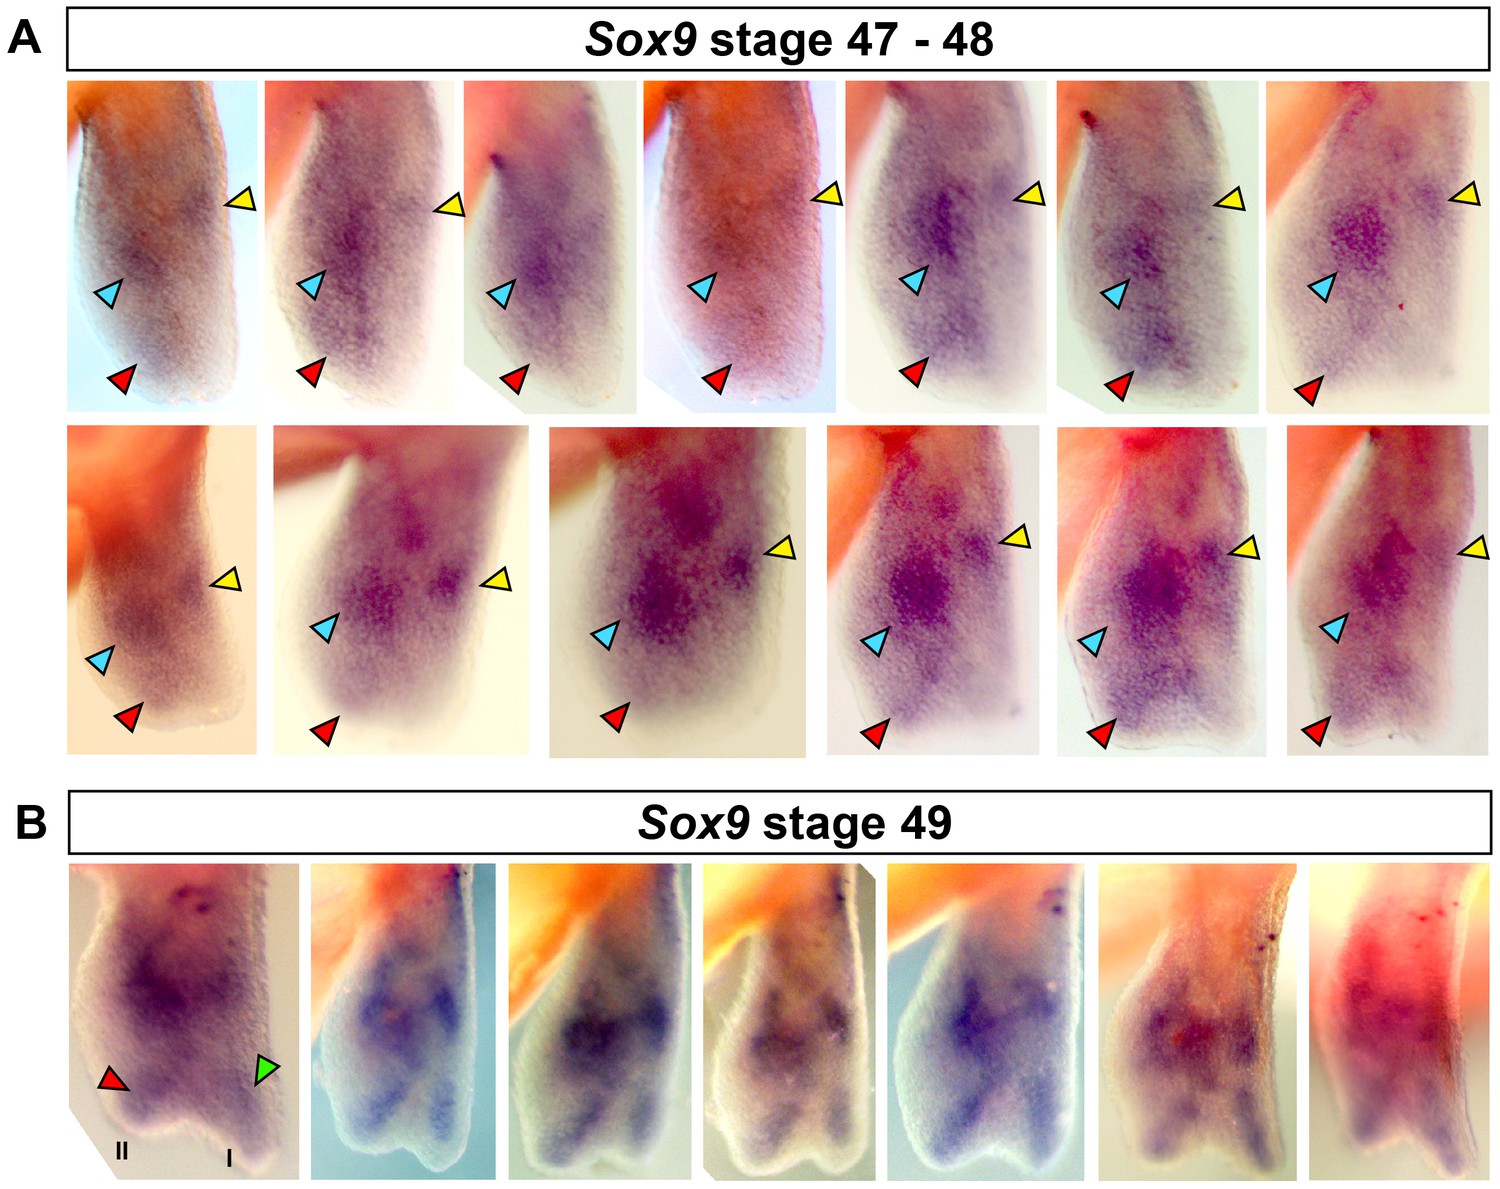
Specification of digit II occurs before digit I.
(A–B) Replicates for Sox9 staining at stages 47–49. (A) Red arrows show staining for digit II between stages 47 and 48. 13/15 (86.66%) limbs showed clear staining for digit II in the absence of digit I. (B) Digit II and I are stained at stage 49 (n = 7/7, 100%). Blue arrow = carpal, yellow arrow = radius, red arrow = digit II and green arrow = digit I.
Figure 2 with 3 supplements
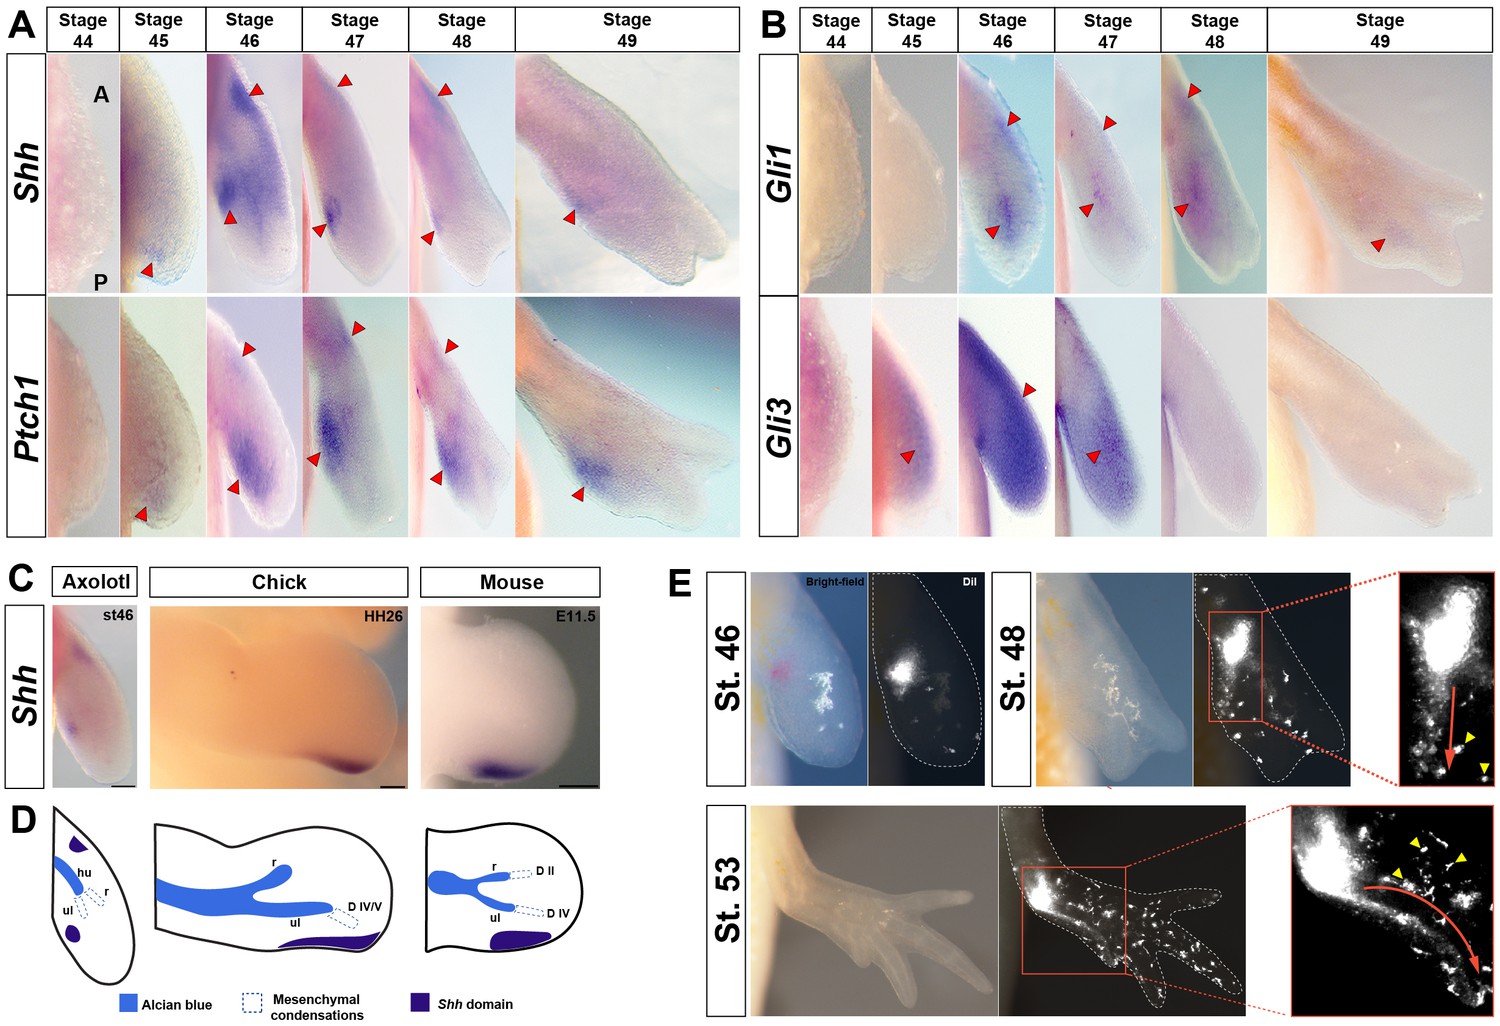
Shh-expressing cells in the presumptive ZPA are proximally restricted from the autopod and contribute progenitors exclusively to digit IV.
(A–E) Dorsal views of stage 44–49 axolotl forelimbs with anterior (A) on top and posterior (P) on the bottom of each panel. Red arrows indicate expression. (A) Shh expression is first detected in a small posterior domain at stage 45 and persists through stage 49. Posterior expression is never detected in the autopod. An anterior domain of Shh expression is visible at stages 46–48. Ptch1 expression overlaps with and surrounds Shh expression posteriorly and anteriorly. (B) Gli1 expression is detected at stage 46 adjacent to, and slightly overlapping with, Shh and Ptch1 expression. Gli1 also exhibited a small anterior domain at stages 46–48. Gli3 is expressed distally across the anterior-posterior axis between stages 45 and 48 with very weak expression overlapping the ZPA. (C) Shh domain in a stage 46 axolotl forelimb, HH26 chicken wing and E11.5 mouse forelimb. Scale bar = 100 µm (axolotl), 200 µm (chicken and mouse). (D) Schematic representation of Shh domain (indigo) compared to mesenchymal condensations (dotted) and Alcian blue stained cartilage condensations (blue) in a stage 46 axolotl forelimb, HH26 chicken wing (Montero et al., 2017) and E11.5 mouse forelimb (Taher et al., 2011). Cartilage condensations abbreviated: humerus (hu), radius (r) and ulna (ul). (E) DiI injections within the approximate Shh domain at stage 46 using light and fluorescence microscopy. Fluorescently labeled cells were followed through stage 53. Inset images at stages 48 and 53 show the migratory route of the DiI labeled mesenchymal cells (red arrow) to digit IV (n = 34). Yellow arrows represent pigment cells (autoflorescence) and ectodermal cells that have picked up the DiI.
Figure 2—figure supplement 1
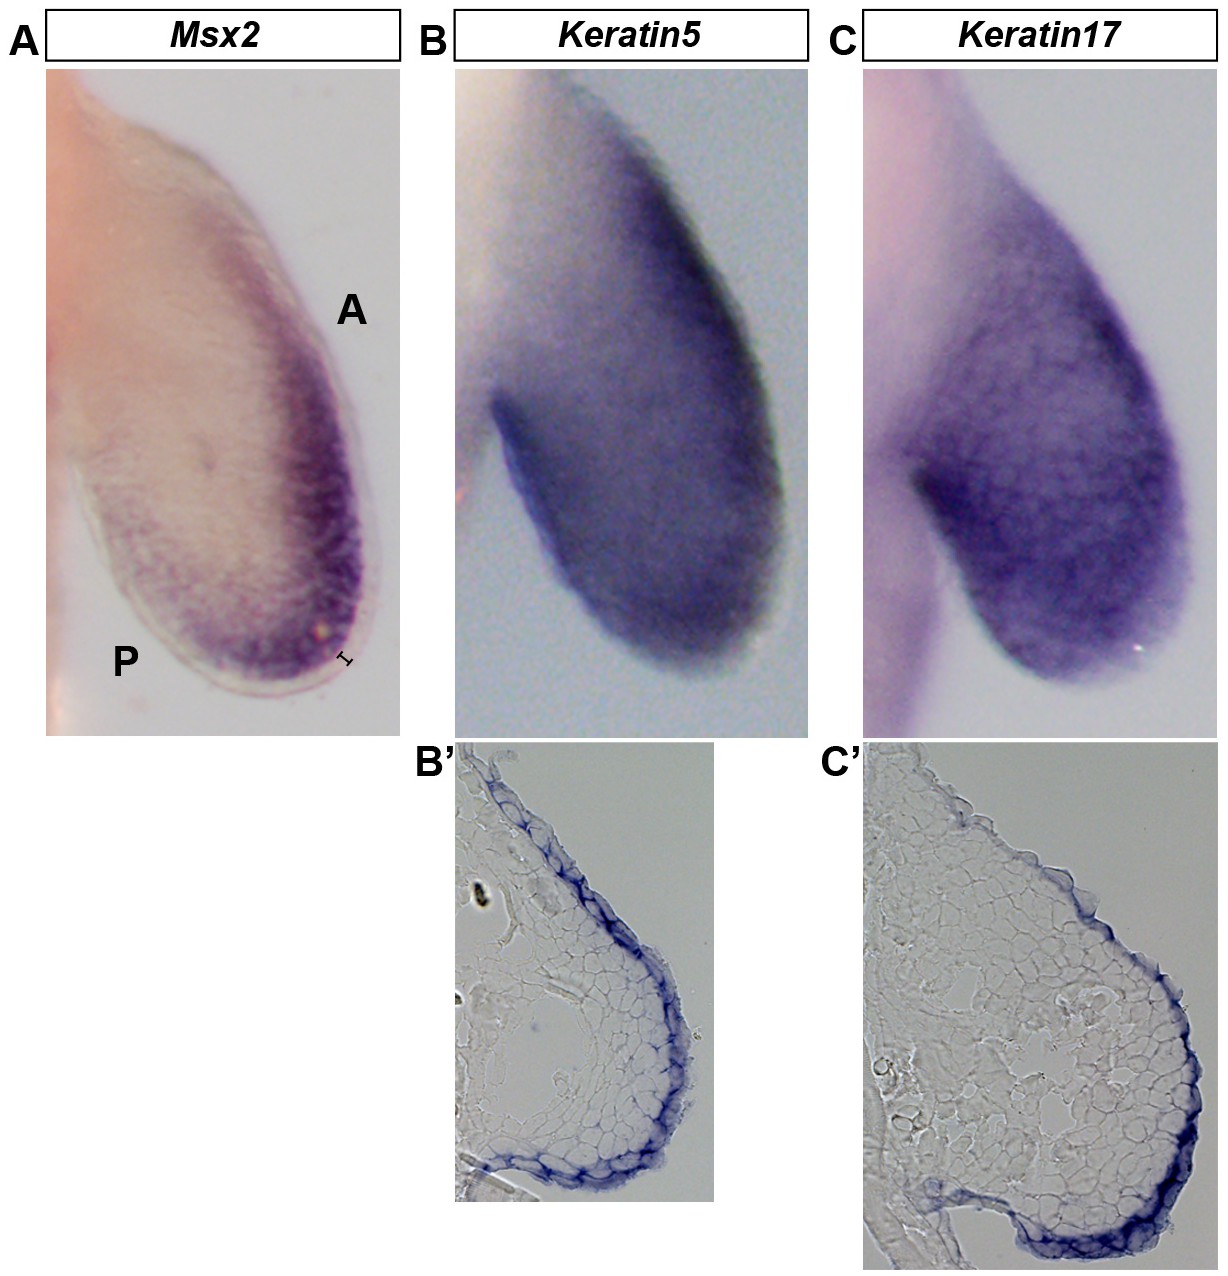
Wholemount in situ hybridization (WISH) is optimized to detect gene expression in mesenchymal and ectodermal cells.
Dorsal view of stage 46 axolotl forelimbs with anterior (A) on top and posterior (P) on the bottom of each panel. (A–C) WISH staining for Msx2, which is restricted to the mesenchyme (A) and Keratin5 (B) and Keratin17 (C) which are restricted to the ectoderm. (B’–C’) Cryo-sections of embryos shown in (B) and (C) demonstrating expression in the limb ectoderm. Black bracket in (A) shows the ectoderm.
Figure 2—figure supplement 2
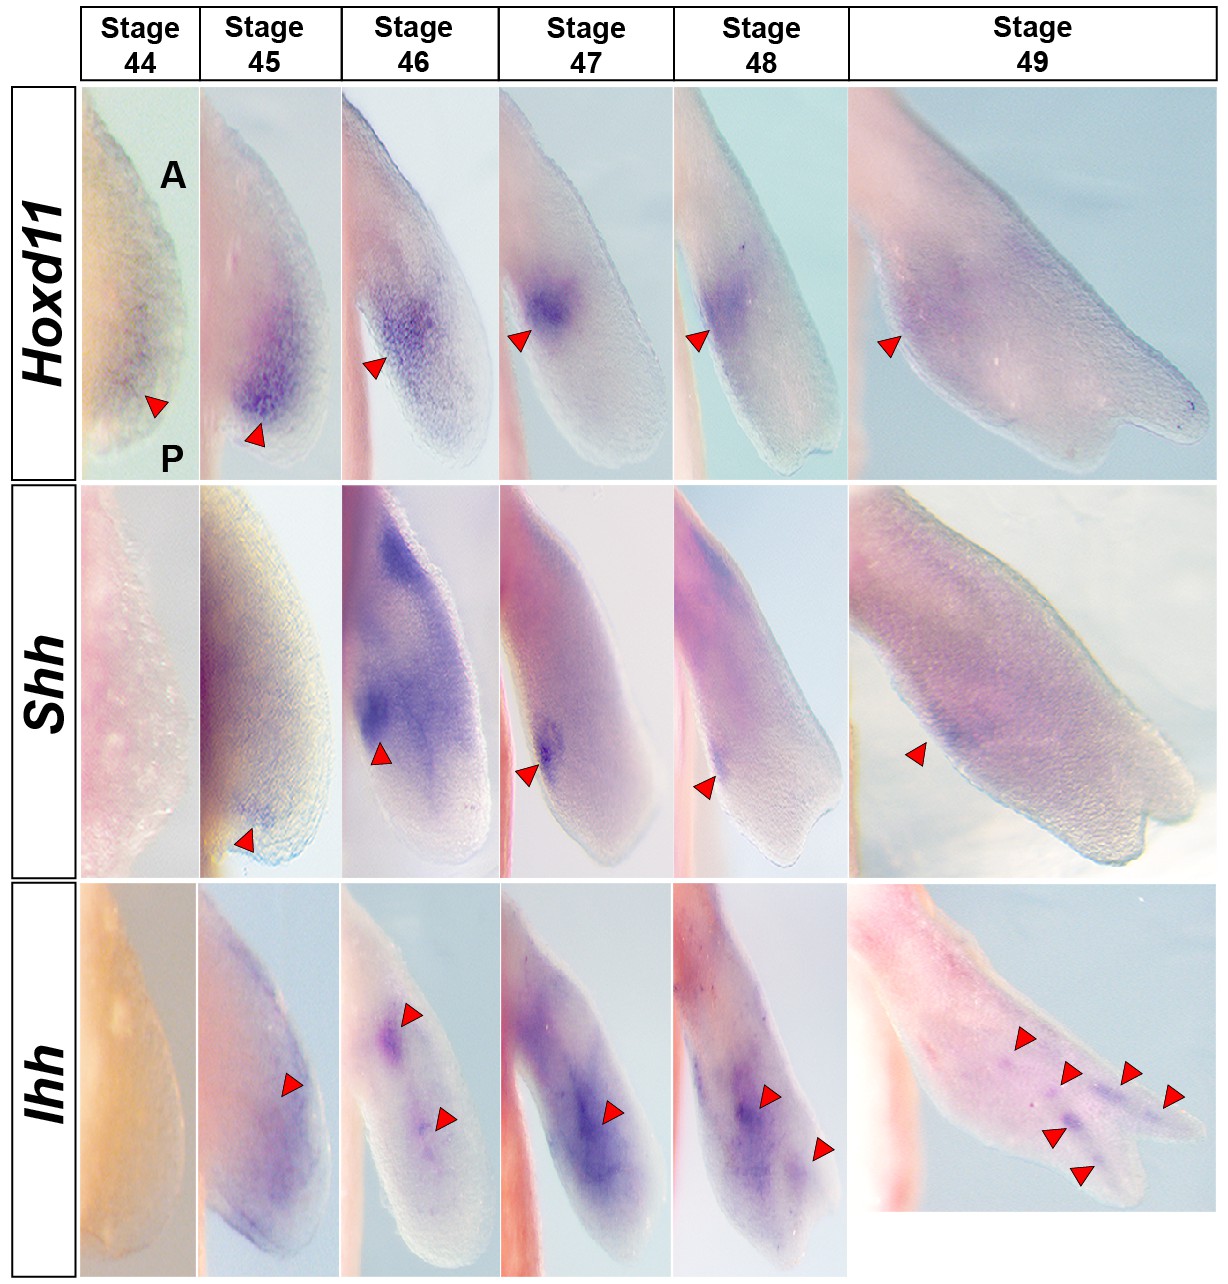
Hoxd11 is expressed prior to Shh expression at stage 44.
Dorsal view of stage 44–49 axolotl forelimbs with anterior (A) on top and posterior (P) on the bottom of each panel. Red arrows indicate expression domains. Hoxd11 expression is first detected in a diffuse pattern in the posterior half of the limb bud at stage 44. This posterior expression pattern becomes stronger at stage 45 and is subsequently restricted to a domain overlapping Shh expression in the presumptive ZPA. Hoxd11 expression at stage 44 begins prior to Shh expression that is first seen posteriorly at stage 45.
Figure 2—figure supplement 3
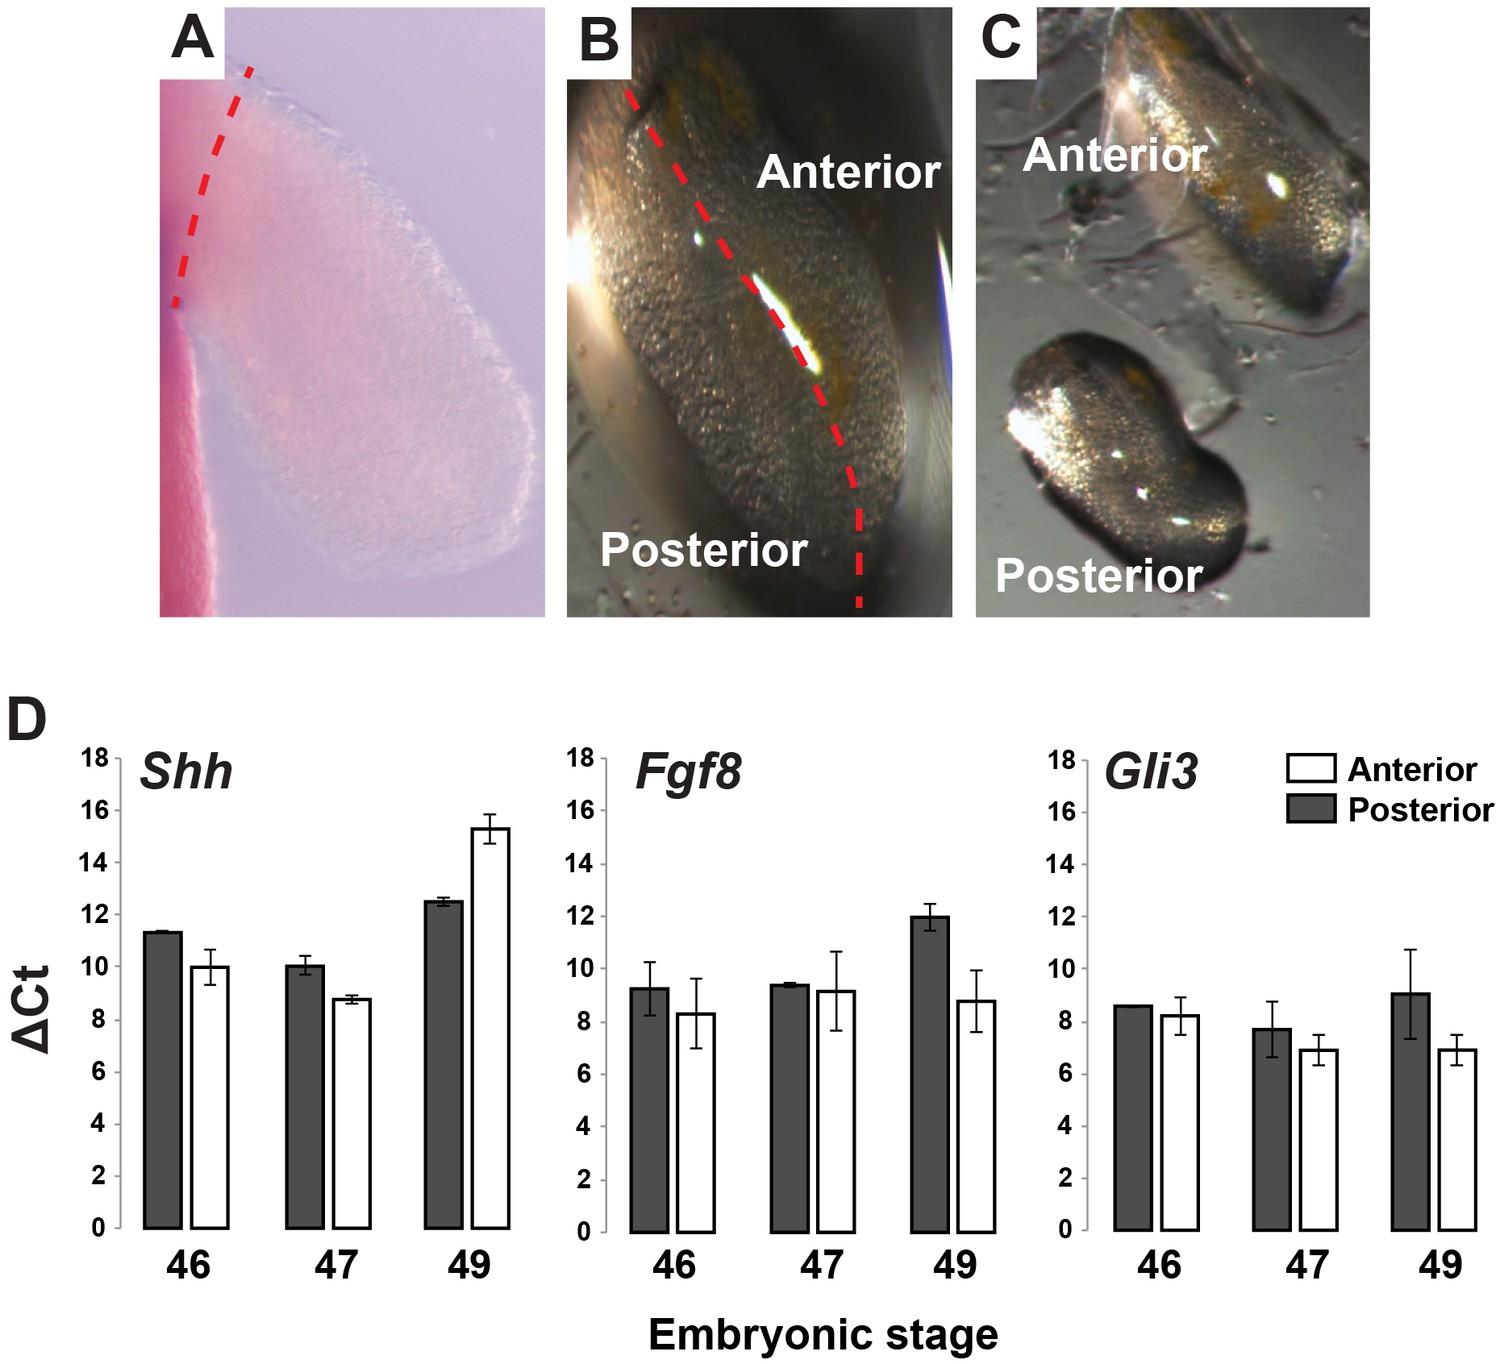
Gene expression analysis of Shh, Fgf8 and Gli3 in anterior and posterior limb compartments.
(A–C) Stage 46, 47 and 49 limbs were dissected from body wall and cut into anterior and posterior halves/compartments (representative image for stage 46 limb). Red dotted line depicts plane of amputation. For qRT-PCR analysis, anterior and posterior halves from left and right limbs were pooled from 10 animals and then 2–3 pools were run as biological replicates. (D) RNA was extracted from the pooled samples and qRT-PCR was run for Shh, Fgf8 and Gli3. Tubulin-alpha was used as the internal control/housekeeping gene and delta Ct values for these genes were calculated for each limb compartment at each stage. Error bars represent standard error of mean.
Figure 3 with 1 supplement
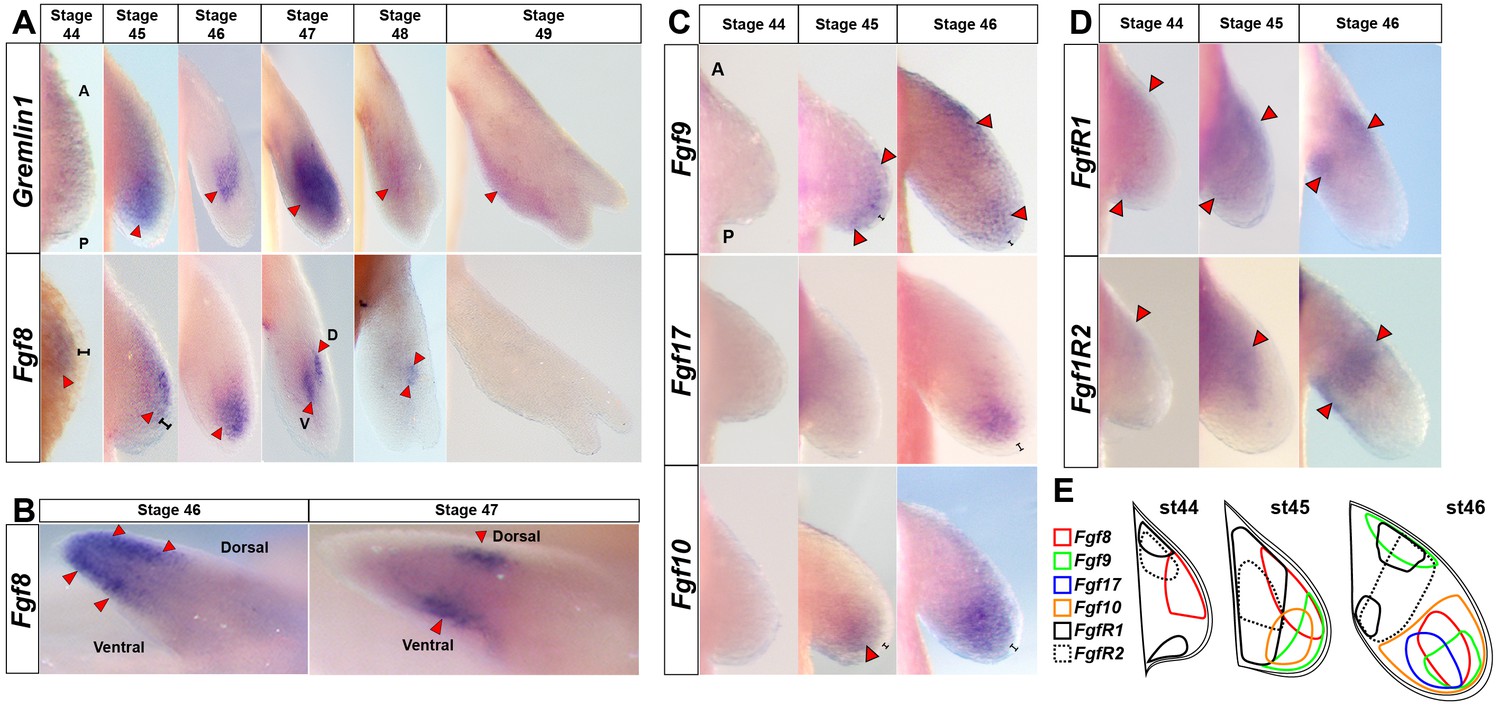
Amniote and anuran AER-specific Fgf ligands (8, 9, 17) are expressed exclusively in axolotl limb mesenchyme.
(A, C–E) Dorsal views of stage 44–49 axolotl forelimbs with anterior (A) on top and posterior (P) on the bottom of each panel. Red arrows indicate expression domains. (A) Gremlin1 and Fgf8 expression at forelimb stages 44–49. Gremlin1 is first expressed distally across the anteroposterior axis at stage 45. As the limb bud lengthens Gremlin1 expression becomes centralized at the developing zeugopod and remains strongly expressed through stage 47. Between stages 48 and 49 Gremlin1 expression becomes posteriorly restricted. Fgf8 is expressed exclusively in the mesenchyme (stages 44–48). Fgf8 expression is first detected at stage 44 with a slight anterior bias that expands distally until stage 46 and then shifts proximally. Fgf8 expression was not detected at stage 49. (B) Fgf8 expression at stage 46 begins to segregate dorsoventrally and ultimately separates into separate dorsal and ventral domains at stages 47–48. Anterior view of right limbs with dorsal side on top and ventral side on bottom. (C) Fgf9 shows distal expression at stages 45–46 with an additional proximal domain at stage 46. Fgf17 is expressed distally with a posterior bias at stage 46. Fgf10 maintains distal mesenchymal expression at stages 45–46. (D) FgfR1 and FgfR2 are expressed proximally at stages 44–46. (E) Schematic representation of expression patterns for Fgf8, Fgf9, Fgf17, Fgf10, FgfR1 and FgfR2 at stages 44–46. Black brackets show the ectodermal layer.
Figure 3—figure supplement 1
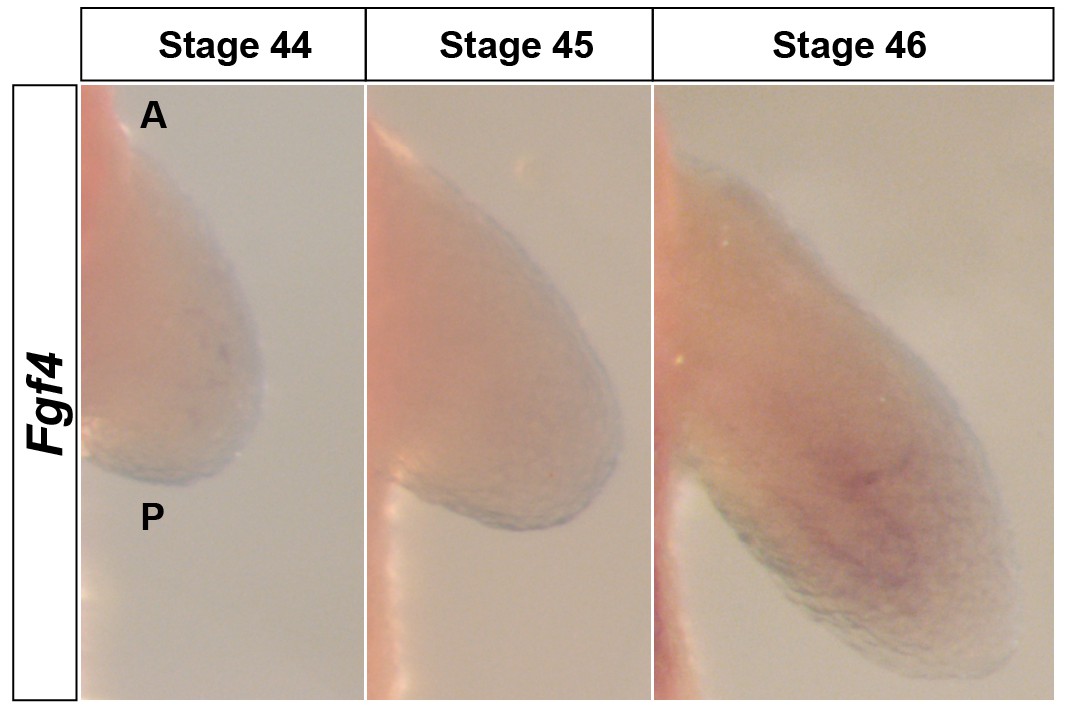
Fgf4 is expressed at extremely low levels in the limb mesenchyme.
Dorsal views of stage 44–46 axolotl forelimbs with anterior (A) on top and posterior (P) on the bottom of each panel. Fgf4 expression was not apparent in limb buds using in situ hybridization (stage 44–45) or was extremely weak at stage 46 in the mesenchyme.
Figure 4 with 2 supplements
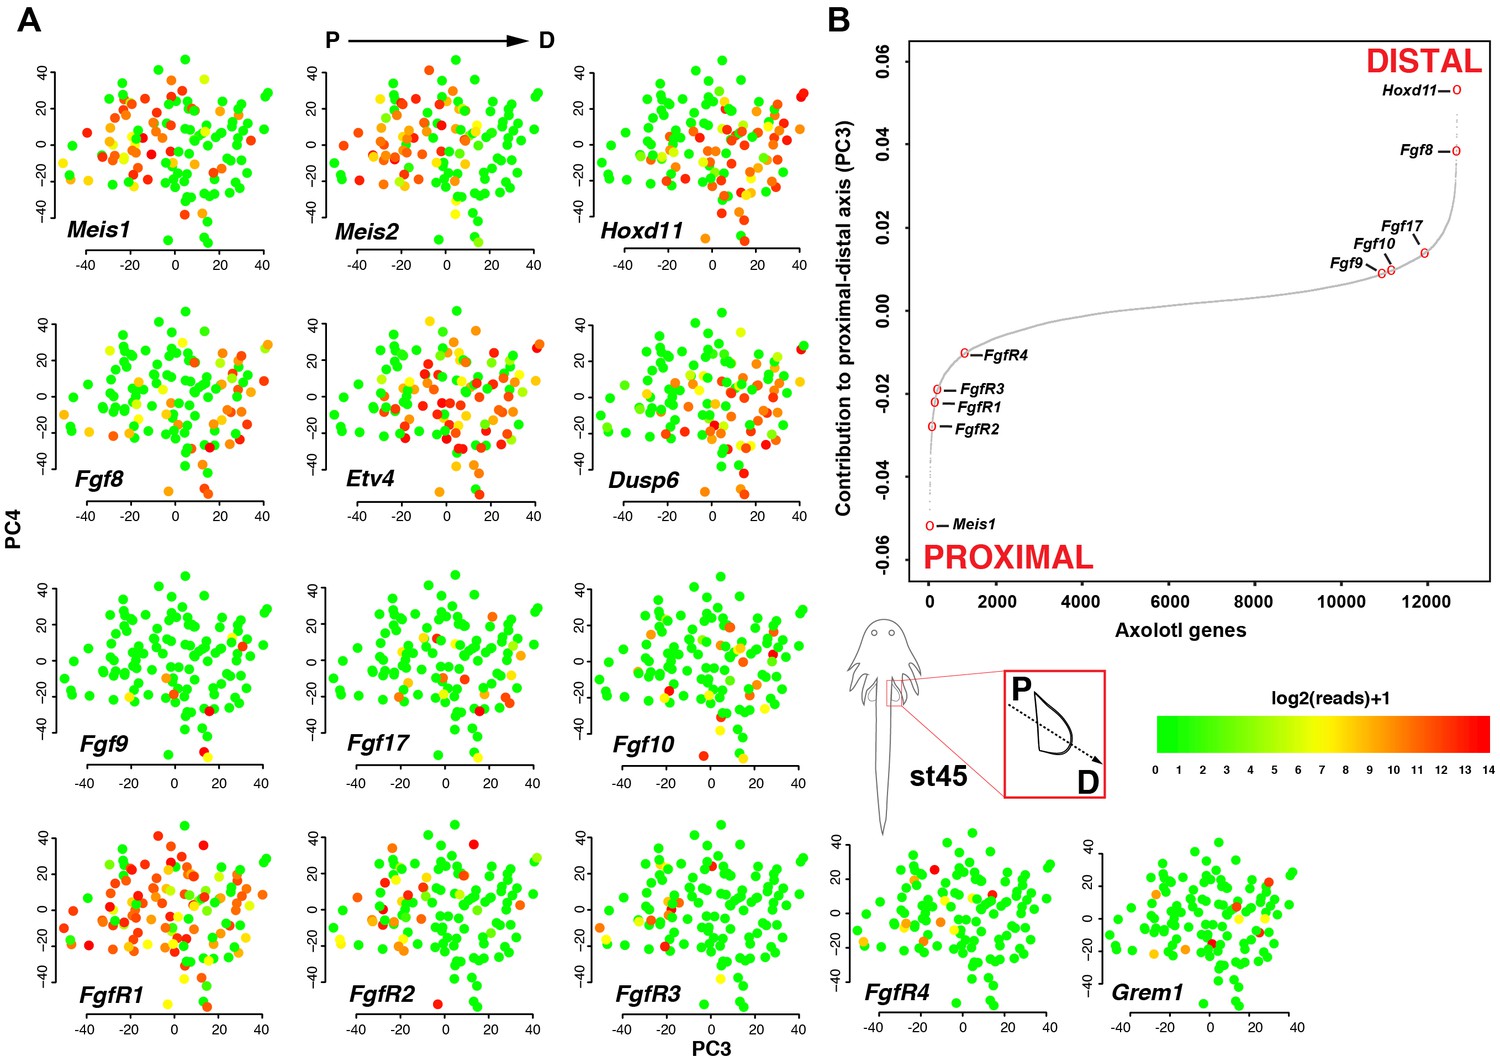
Fgf ligands and receptors are segregated along a modeled proximodistal axis.
(A) Gene expression levels on PCA plot (PC3 vs PC4) for stage 45 limb bud mesenchyme. PC3 models the proximodistal axis of limb bud development exemplified by the expression of Meis1 (proximal) and Hoxd11 (distal). (B) Contributions of axolotl genes to PC3 highlighting the opposite directions of proximal (Meis1) and distal (Hoxd11) markers and that Fgf ligands and receptors are separated along the proximal-distal axis. The sigmoidal curve follows a normal distribution (Shapiro-Wilks normality test, W = 0.95551, p<2.2e-16).
Figure 4—figure supplement 1
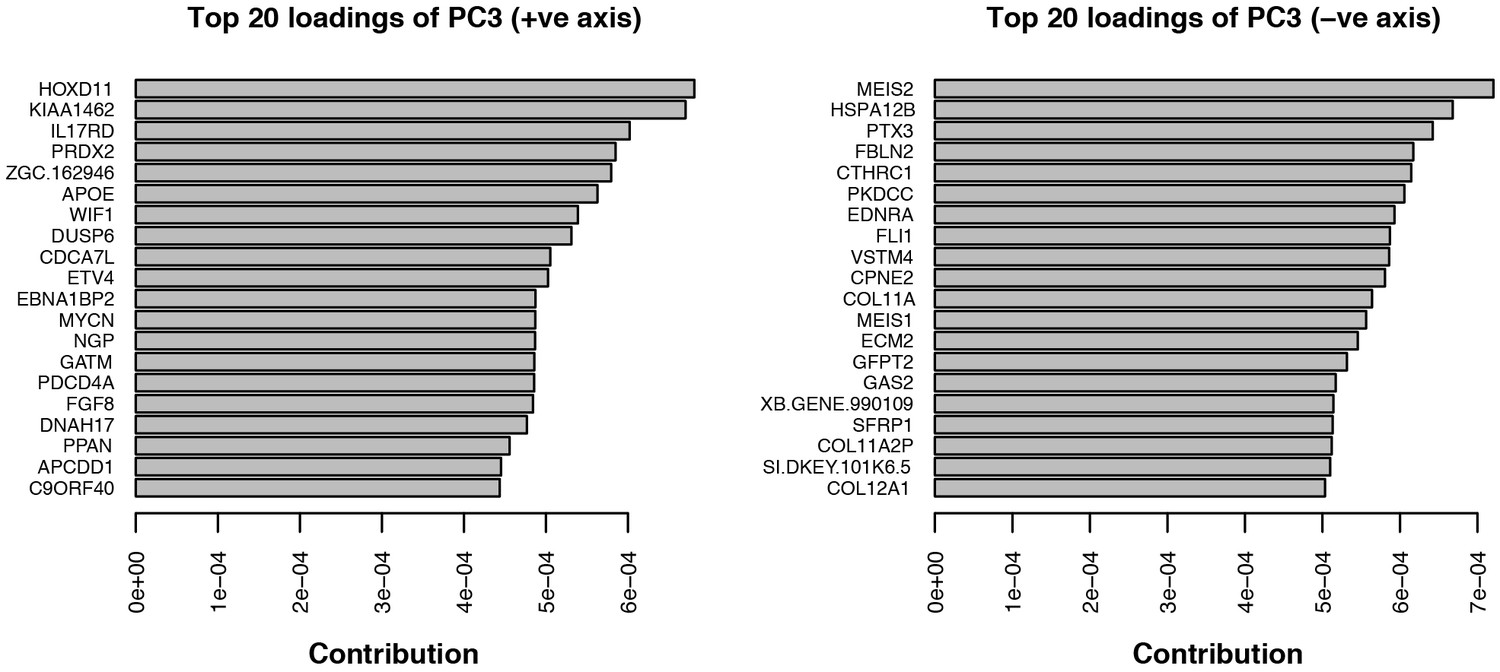
Top twenty loadings of positive and negative axes of PC3 from PCA of stage 45 forelimbs.
Hoxd11 and Meis2 are the top contributors to PC3 on opposite sides of the vector.
Figure 4—figure supplement 2
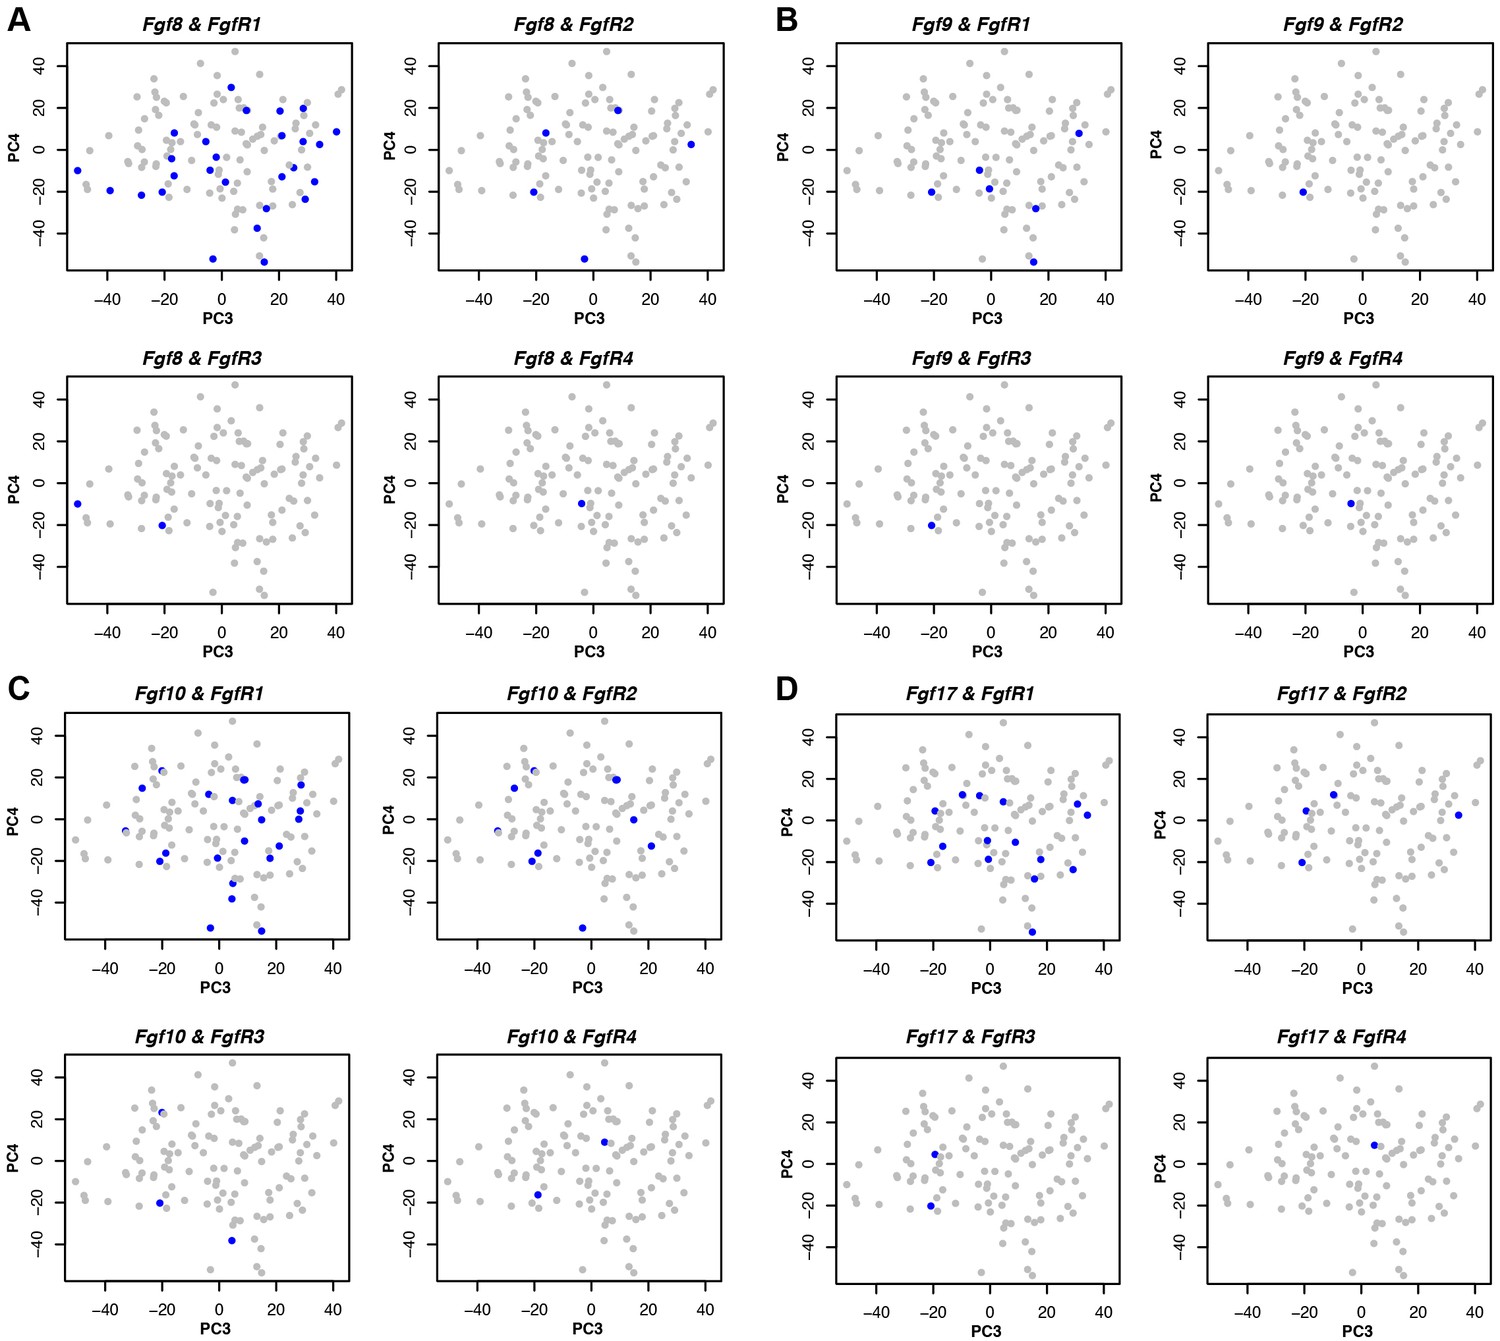
Cells expressing FgfR1 also express Fgf 8, 9, 10 and 17.
(A–D) Co-expression (blue) of Fgf ligands and receptors on PCA plot (PC3 vs PC4) from stage 45 limb buds. Expression was defined as one or more RNA-seq reads mapped to the gene in question.
Figure 5 with 2 supplements

Early inhibition of Fgf-signaling reduces cell proliferation and leads to loss of posterior digits.
(A) Design for SU5402 and DMSO treatments. Capital letters refer to harvest stage and figure panel. Red ovals depict dorsal muscle blocks. (B) Limb bud size (area) at stage 46 shows a significant decrease in SU5402-treated larvae (one-tailed student’s t-test, T = −8.7759, asterisk represents p<0.0001, n = 5 for DMSO and n = 6 for SU5402). Error bars represent standard error of mean. Scale bar = 100 µm. (C–D) SU5402 treatment efficiently down-regulates Fgf-signaling targets Etv1 and Etv4 at stages 45 and 46. (E) qRT-PCR analysis of stage 46 limb buds from DMSO (control) and SU5402 treatments indicates down-regulation of Etv1, Etv4, Gremlin1 and Shh. In contrast, Ptch1 expression appeared unaffected in the treated limbs (two tailed t-test; Etv1: T = −19.13, p<0.0001; Etv4: T = −9.79, p=0.0006; Gremlin1: T = −4.14, p=0.014; Shh: T = −6.95, p=0.0022 and Ptch1: T = 2.44, p=0.070; n = 3 for DMSO and n = 3 for SU5402; asterisk depicts significant p-values; n.s = not significant). Relative gene expression depicted as 2-ΔΔCt values with GAPDH as the housekeeping gene. Error bars represent standard error of mean. (F–G) SU5402 treatments cause a down-regulation of Gremlin1 while Ptch1 expression remained unaffected at both stages. (H–I) SU5402-treated stage 46 limbs show a significant decrease in the EdU-positive cells. Lightsheet images are depicted as volume rendered red cell aggregates within a hand drawn limb mask (dorsal view with anterior A on top and posterior P on the bottom), mid-longitudinal sections (blue box = plane of section) of the volume rendered limbs and mid-transverse sections (green box = plane of section) of the volume rendered limbs (H). Abbreviations: dorsal (D) and ventral (V) in the mid-transverse sections. The in-set images on top of the mid-transverse sections depict the orientation of the limb and the plane of section. Cell proliferation is down-regulated throughout the limb, and very few proliferating cells were present in the proximal and distal parts of treated limbs (yellow arrows). Scale bar = 100 µm. (I) Statistical comparisons within control (DMSO) and treatment (SU5402) groups were determined by one-way ANOVA (Kruskal-Wallis tests). n = 3 for DMSO and SU5402. Horizontal bars represent median values; p<0.05. Asterisk depicts significant p-value. (J) Alcian blue stained DMSO (control) and SU5402-treated stage 54 limbs. (K) Drug-treated animals had smaller limbs with 73.5% lacking posterior digit IV (red star in J indicates position of missing digit). Scale bar = 1 mm.
Figure 5—figure supplement 1
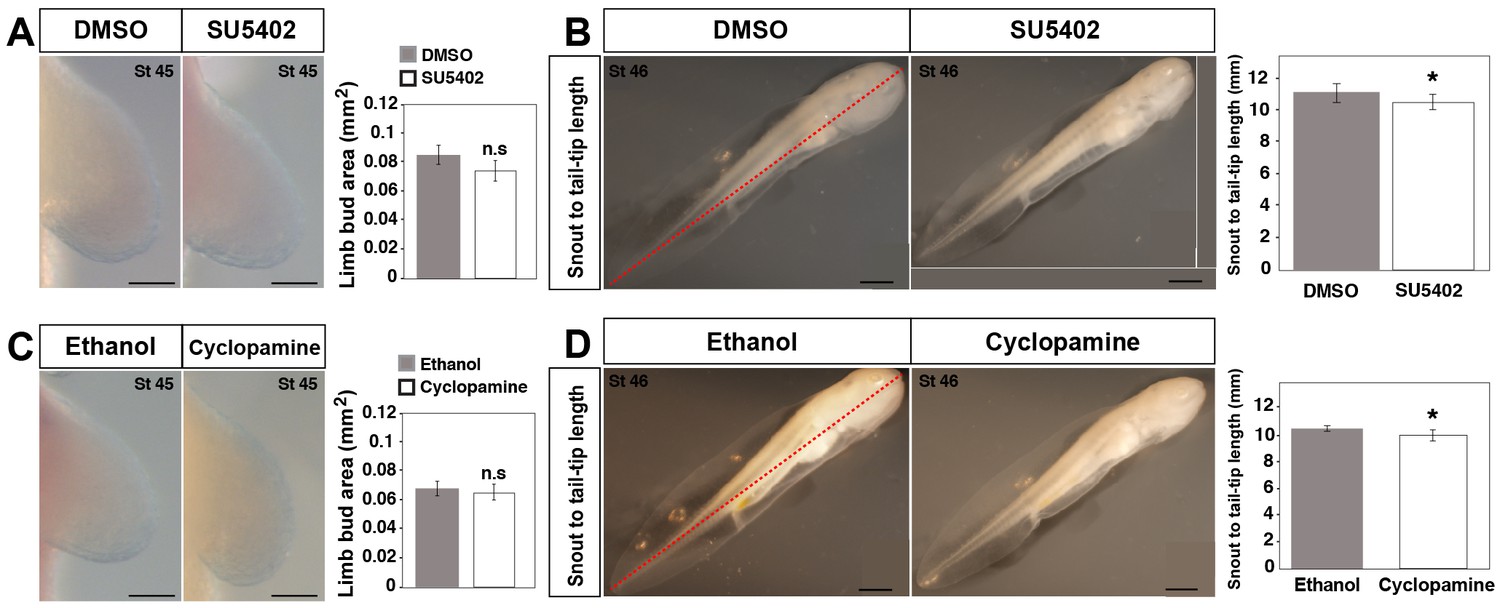
Effect of DMSO, SU5402, ethanol and cyclopamine treatments on limb size at stage 45 and snout to tail-tip length at stage 46.
(A) Limb buds harvested at stage 45 did not show a significant difference in limb size between DMSO (control) and SU5402 treated animals (one-tailed student’s t-test, T = −1.68637, p=0.0514, n = 15 for DMSO and SU5402). Scale bar = 100 µm. (B) SU5402-treated animals (at stage 46) show a small, but significant decrease in snout to tail-tip length compared to DMSO (control) treated animals (one-tailed student’s t-test, T = −4.52, p=0.0007, n = 5 for DMSO and n = 6 for SU5402). Scale bar = 1 mm. (C) Limb buds harvested at stage 45 did not show a significant difference in limb size between ethanol (control) and cyclopamine-treated animals (one-tailed student’s t-test, T = 1.43, p=0.909, n = 6 for ethanol and cyclopamine). Scale bar = 100 µm. (D) Cyclopamine-treated animals (at stage 46) show a small, but significant decrease in snout to tail-tip length compared to ethanol (control) treated animals (one-tailed student’s t-test, T = 3.87, p<0.0016, n = 6 for ethanol and cyclopamine). Scale bar = 1 mm. Red dotted lines in B and D represent snout to tail-tip measurements. Mean values are plotted as bar diagrams and error bars represent standard error of mean. Asterisk depicts significant p-values. n.s = not significant.
Figure 5—figure supplement 2
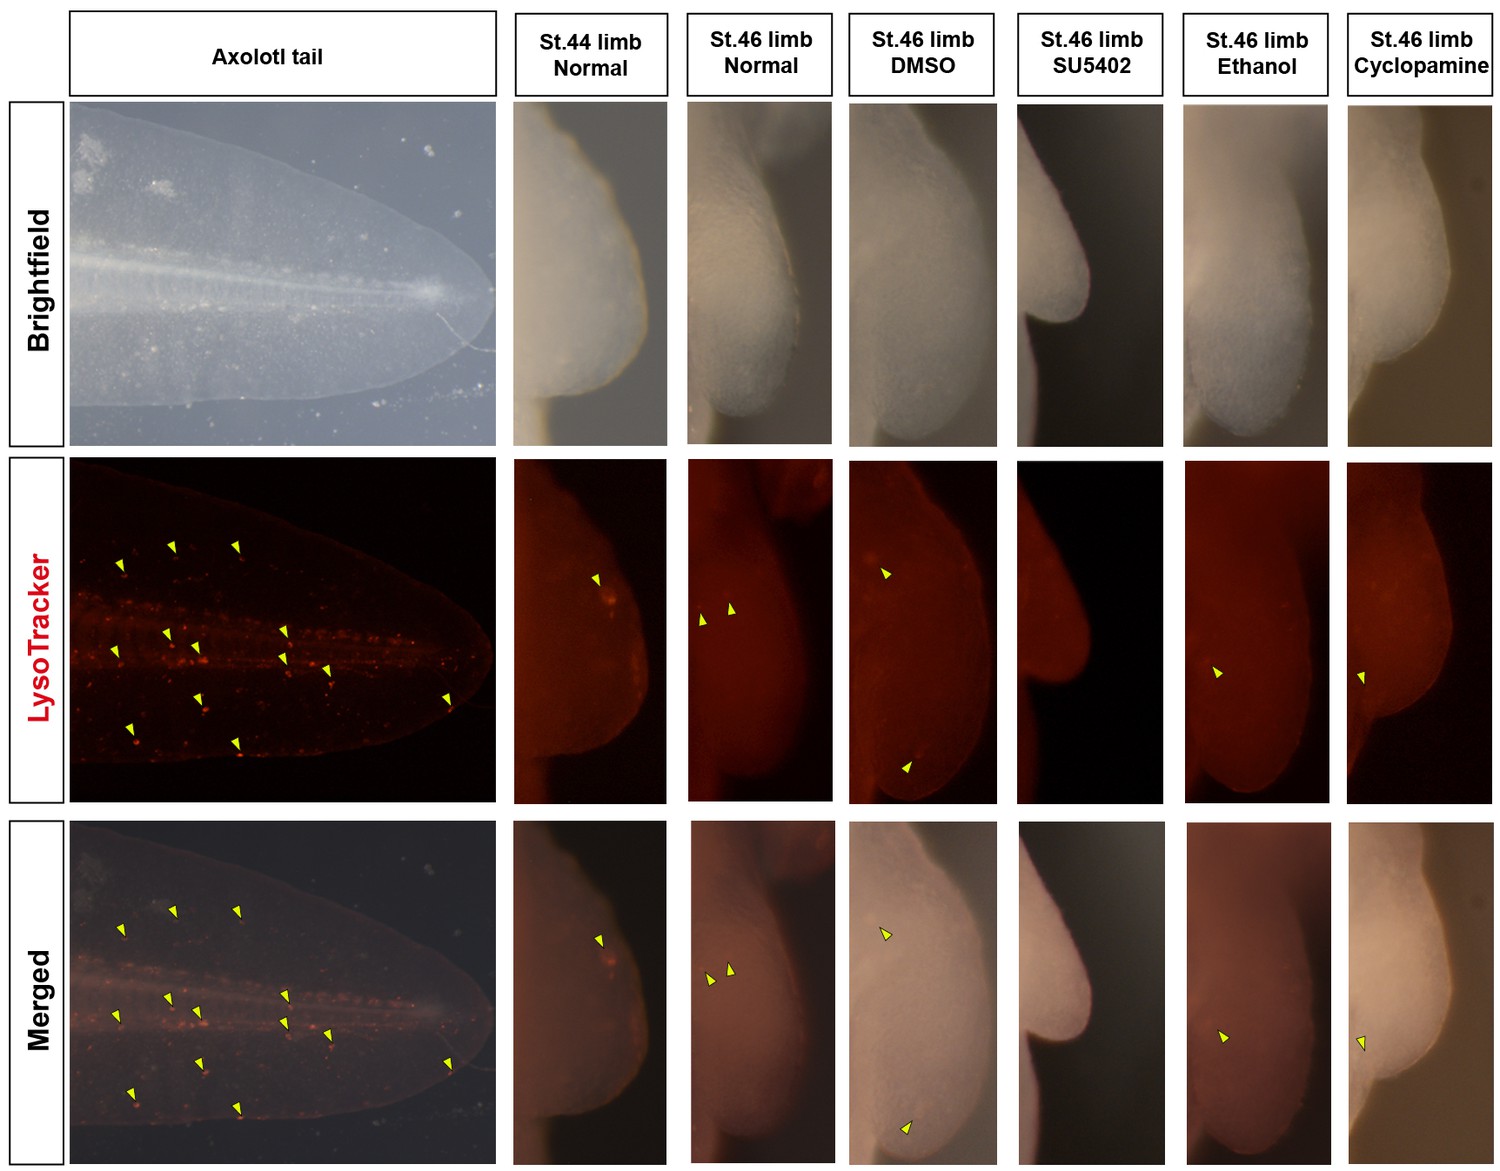
Cell death is not evident during normal axolotl forelimb development or in response to inhibition of Fgf- or Shh-signaling.
Lysotracker marks dying cells in the axolotl. Positive cells (yellow arrows) are present in the axolotl tail during stage 46 of limb development. Very few Lysotracker+ cells are detected during normal development in stages 44 and 46 axolotl limb buds. Similarly, inhibiting Fgf-signaling (SU5402 treatment) or Shh-signaling (cyclopamine treatment) does not increase cell death in drug-treated limb buds. The control limbs (DMSO or ethanol treated) also do not show any cell death. Limbs are depicted at the same scale. SU5402 and cyclopamine-treated limbs are smaller at stage 46 compared to control limbs as quantified in Figure 5.
Figure 6
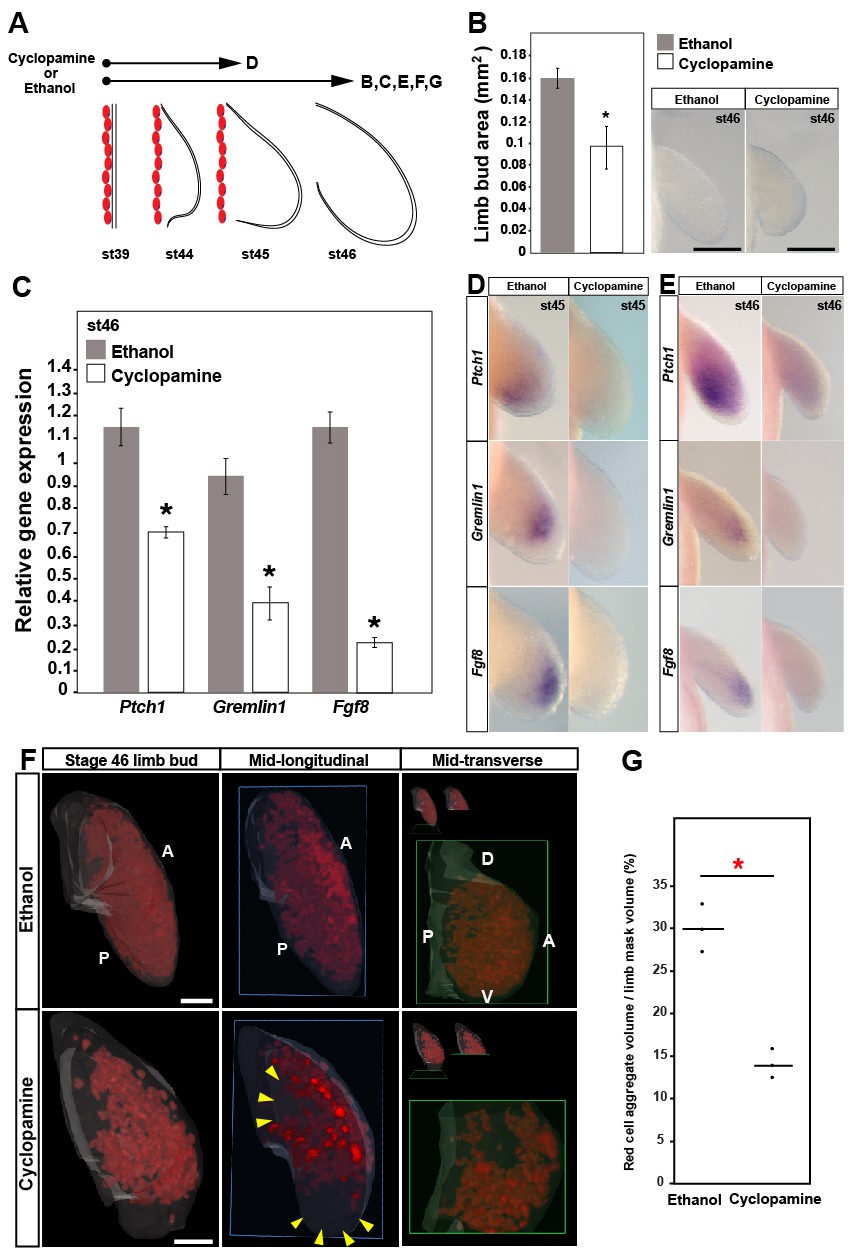
Sonic hedgehog signaling regulates Fgf8 expression and distal cell proliferation during axolotl limb development.
(A) Design for cyclopamine and ethanol treatments. Capital letters refer to harvest stage and figure panel. Red ovals depict dorsal muscle blocks. (B) Limb bud size (area) at stage 46 shows a significant decrease in cyclopamine-treated larvae (one-tailed student’s t-test, T = 8.36, p<0.0001, n = 6 each for ethanol and cyclopamine). Scale bar = 100 µm. (C) Real-time PCR analysis of Ptch1, Gremlin1 and Fgf8 in stage 46 limb buds from ethanol (control) and cyclopamine treatments (one tailed t-test; asterisk depicts significant p-values; Ptch1: T = 4.95, p=0.0039; Gremlin1: T = 5.97, p=0.002 and Fgf8: T = 11.22, p=0.0002; n = 3 for ethanol and cyclopamine). Relative gene expression depicted as 2-ΔΔCt values with RPL32 as the housekeeping gene. Error bars represent standard error of mean. (D–E) Cyclopamine treatment efficiently down-regulates Ptch1 and therefore Shh-signaling. Cyclopamine treatment also down-regulates Gremlin1 and Fgf8. (F–G) Cyclopamine-treated stage 46 limbs show a significant decrease in EdU-positive cells. Lightsheet images depicted as volume rendered red cell aggregates within a hand drawn limb mask (dorsal view with anterior A on top and posterior P on the bottom), mid-longitudinal sections (blue box = plane of section) of the volume rendered limbs and mid-transverse sections (green box = plane of section) of the volume rendered limbs. Abbreviations: dorsal (D) and ventral (V) in the mid-transverse sections. The in-set images on top of the mid-transverse sections depict the orientation of the limb and the plane of section. There is a domain specific loss of cell proliferation in the proximal and distal parts of the treated limbs (yellow arrows). Scale bar = 100 µm. (G) Comparisons within control (ethanol) and treatment (cyclopamine) groups were determined by one-way ANOVA (Kruskal-Wallis tests); n = 3 for ethanol and cyclopamine. Horizontal bars represent median values; p<0.05. Asterisk depicts significant p-value.
Tables
Table 1
Salient features of forelimb development between axolotl, Xenopus, chicken and mouse.
https://doi.org/10.7554/eLife.48507.019| Feature | Axolotl | Xenopus | Chicken | Mouse | References |
|---|---|---|---|---|---|
| Autopod skeletal differentiation | Preaxial dominance1 | Postaxial dominance1 | Postaxial dominance1 | Postaxial dominance1 | 1 Shubin and Alberch, 1986 |
| Location of ZPA domain | Posterior. Excluded from autopod1,* | Posterior. Extends into autopod2 | Posterior. Extends into autopod3 | Posterior. Extends into autopod4 | 1 Torok et al., 1999 2 Endo et al., 1997 3 Riddle et al., 1993 4 Echelard et al., 1993 * This study |
| Contribution of ZPA cells to posterior digit(s) | Yes (DiI labeling)* | ? | Yes (DiI labeling)1 No (GFP grafting)2 | Yes (Genetic labeling)3 | 1 Towers et al., 2008 2 Towers et al., 2011 3 Harfe et al., 2004 * This study |
| Shh-signaling during limb development | Key mediator of anterior-posterior patterning1 | Key mediator of proximal-distal and anterior-posterior patterning2 | Key mediator of anterior-posterior patterning3 | Key mediator of anterior-posterior patterning4, 5 | 1Stopper and Wagner, 2007 2Stopper et al., 2016 3 Ros et al., 2003 4 Chiang et al., 1996 5 Chiang et al., 2001 |
| Morphological AER | No1 | Transient2 | Yes3 | Yes4 | 1 Tank et al., 1977 2 Tarin and Sturdee, 1971 3 Saunders, 1948 4 Wanek et al., 1989 |
| Molecular AER | No* | Yes | Yes | Yes | * This study |
| Location of AER-specific Fgfs (4,8,9,17) | Mesenchyme* | AER1 | AER2, 3, 4 | AER2, 5, 6, 7, 8, 9 | 1 Christen and Slack, 1997 2 Mahmood et al., 1995 3 Duprez et al., 1996 4 Havens et al., 2006 5 Ohuchi et al., 1994 6 Crossley and Martin, 1995 7 Niswander and Martin, 1992 8 Sun et al., 2002 9 Sun et al., 2000 * This study |
| Location of Fgf receptors | FgfR1-4 expressed exclusively in the mesenchyme* | ? | FgfR1IIIc, FgfR2IIIb, FgfR3IIIb expressed in the ectoderm and FgfR1IIIb, FgfR2IIIc, FgfR3IIIb/c and FgfR4 expressed in the mesenchyme1, 2 | FgfR1IIIb and FgfR2IIIb expressed in the ectoderm and FgfR1IIIc, FgfR2IIIc, FgfR3c and FgfR4c expressed in the mesenchyme3, 4, 5 | 1 Havens et al., 2006 2 Sheeba et al., 2010 3 Min et al., 1998 4 MacArthur et al., 1995 5 Ornitz and Itoh, 2015 * This study |
| Fgf-signaling during limb development | Controls cell proliferation and limb size* | ? | Regulates proximodistal patterning, cell survival and cellular differentiation1, 2, 3,4 | Regulates proximodistal patterning, cell survival and cellular differentiation5, 6 | 1 Saunders, 1948 2 Summerbell, 1974 3 Janners and Searls, 1971 4 Dennis Summerbell, 1977 5 Sun et al., 2002 6 Mariani et al., 2008 * This study |
| Positive regulation of Gremlin1 by Fgf-signaling in the limb | Yes* | ? | No1 | No2 | 1 Merino et al., 1999 2 Verheyden and Sun, 2008 * This study |
| Positive regulation of Shh-signaling by Fgf-signaling in the limb | No* | ? | Yes1 | Yes2 | 1 Crossley et al., 1996 2 Lewandoski et al., 2000 * This study |
| Positive regulation of Fgf-signaling by Shh-signaling in the limb | Yes* | ? | Yes1 | Yes2 | 1 Laufer et al., 1994 2 Harfe et al., 2004 * This study |
| Limb regeneration | Regenerates complete limb through adulthood1, 2, 3 | Regenerates complete limb through larval stage 534 | Does not regenerate5 | Does not regenerate. *Regenerates digit tip6 | 1 Young et al., 1983a 2 Young et al., 1983b 3 Monaghan et al., 2014 4 Dent, 1962 5 Muneoka and Sassoon, 1992 6 Borgens, 1982 |
Additional files
-
Supplementary file 1
Details of gene sequences used to make the antisense probes for in situ hybridization experiments.
The excel file contains gene names, source/NCBI accession id, full length/partial coding sequences and ids, human hit, e-value for human hit, forward primer sequence, reverse primer sequence and length of antisense probe used.
- https://doi.org/10.7554/eLife.48507.021
-
Supplementary file 2
Gene expression analysis for qRT-PCR using excel.
The excel file contains gene expression analysis for Figure 2—figure supplement 3D and DMSO/SU5402 and ethanol/cyclopamine drug experiments.
- https://doi.org/10.7554/eLife.48507.022
-
Transparent reporting form
- https://doi.org/10.7554/eLife.48507.023
Download links
A two-part list of links to download the article, or parts of the article, in various formats.
Downloads (link to download the article as PDF)
Open citations (links to open the citations from this article in various online reference manager services)
Cite this article (links to download the citations from this article in formats compatible with various reference manager tools)
Fgf-signaling is compartmentalized within the mesenchyme and controls proliferation during salamander limb development
eLife 8:e48507.
https://doi.org/10.7554/eLife.48507


