Maternal spindle transfer overcomes embryo developmental arrest caused by ooplasmic defects in mice
- Embryotools, Parc Cientific de Barcelona, Spain
- Nuffield Department of Women's and Reproductive Health, University of Oxford, United Kingdom
- Juno Genetics, Winchester House, Oxford Science Park, United Kingdom
- Genomics and Bioinformatics, Centre for Genomic Regulation, Spain
- PCB Animal Facility, Parc Cientific de Barcelona, Spain
Figures
Figure 1 with 2 supplements
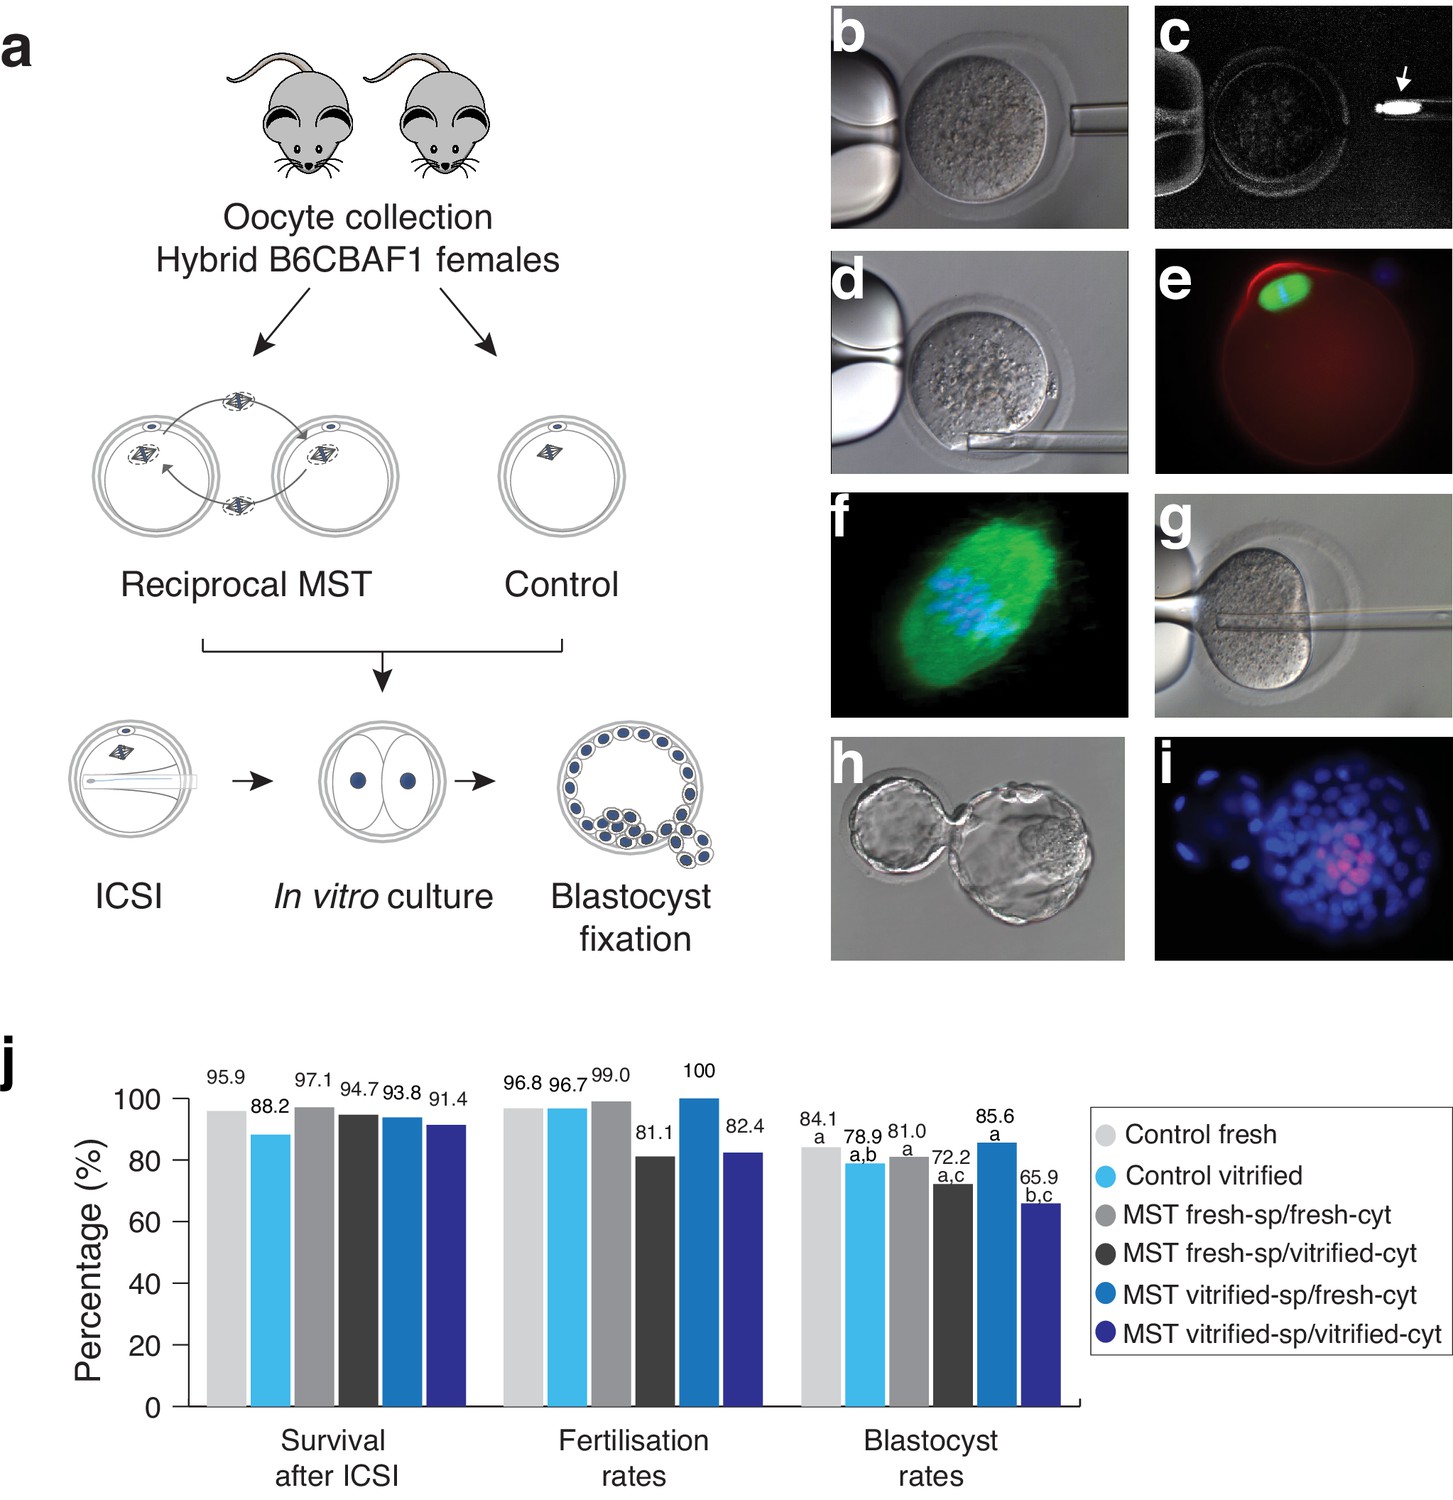
Maternal spindle transfer (MST) between sibling fresh B6CBAF1 mouse oocytes does not impair embryo development.
(a) Schematic representation of the experimental design used to validate the different steps of the technique. (b) Detail of the enucleation procedure with confirmation of the spindle isolation under polarized light. (c) The birefringence of the meiotic spindle is indicated by an arrow. (d) Details of oocyte reconstruction by placing the spindle transfer in the perivitelline space of the enucleated oocyte. (e) Representative oocyte reconstructed by MST and processed by immunofluorescence for detection of microtubules (green), microfilaments (red) and DNA (blue). (f) Confocal microscopy detail of the meiotic spindle structure in an oocyte reconstructed by MST at a high magnification (600x) showing a normal barrel shape spindle (green) and aligned chromosomes in the metaphase plate (blue). (g) Piezo- ICSI performed with a blunt-end pipette in a MST oocyte. (h) Hatching blastocyst generated by MST at 120 hr post-ICSI. (i) Fixed MST blastocyst processed for total cell counts. (j) ICSI survival, fertilisation and blastocyst rates in sibling fresh and vitrified oocytes processed by MST and non-manipulated controls. See also Figure 1—figure supplements 1 and 2.
Figure 1—figure supplement 1
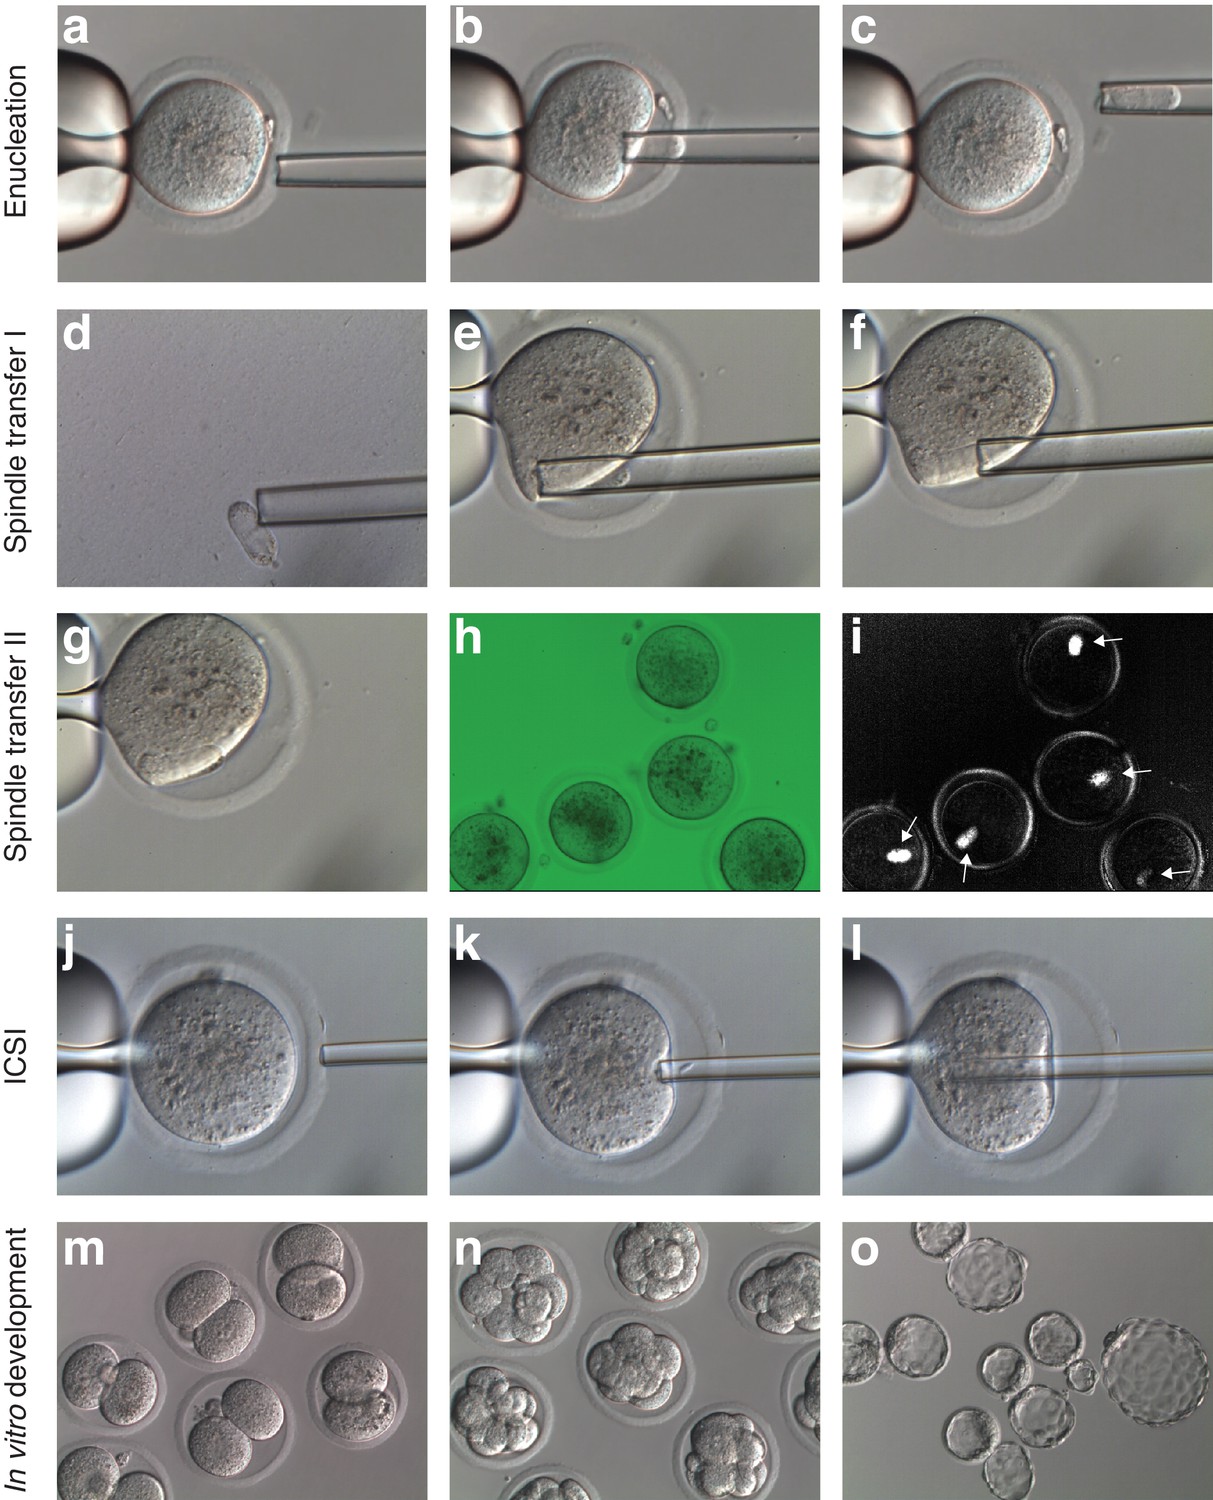
Representative images of the MST protocol.
Mouse oocyte arrested at MII stage before (a), during (b) and after (c) spindle removal. (d) Spindle being exposed to inactivated Sendai virus HVJ-E. (e-g) Reconstruction of enucleated oocytes and confirmation with polarized light (h-i). The birefringence of the spindle is indicated with a white arrow. (j-l) Piezo-ICSI of reconstructed oocytes. (m-o) In vitro development of MST embryos 24 hr (m), 72 hr (n) and 96 hr (o) post-ICSI.
Figure 1—figure supplement 2
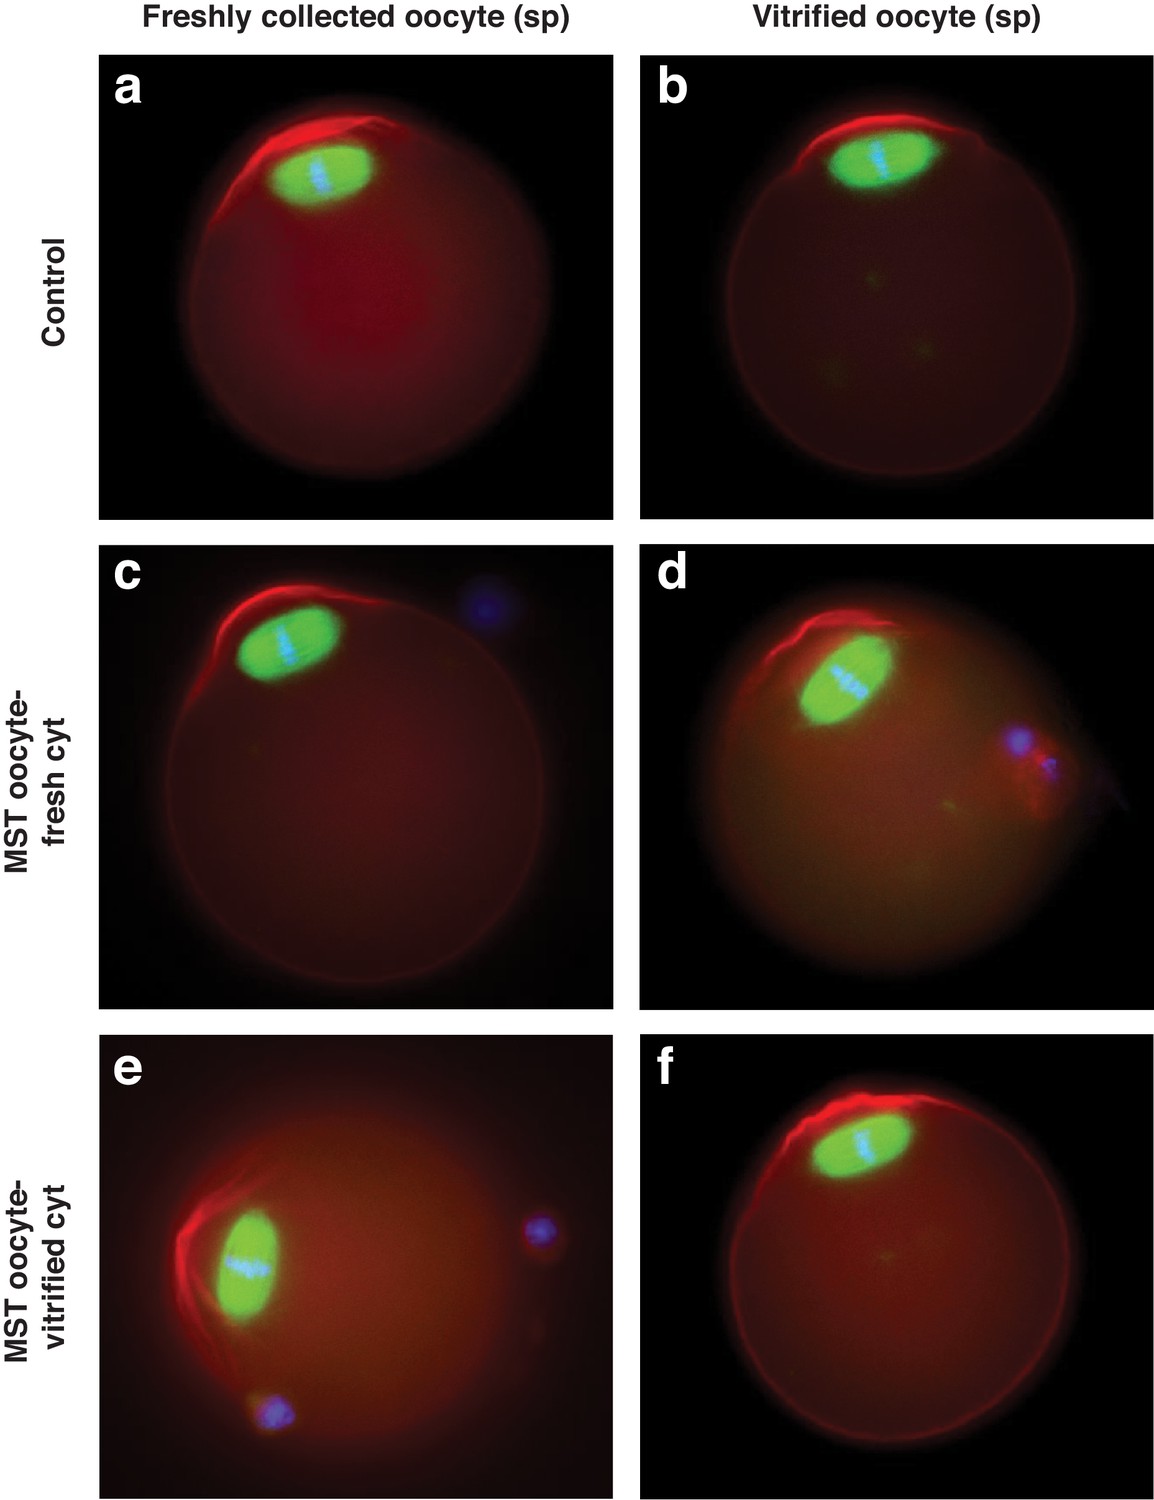
Representative immunofluorescence images of B6CBAF1 strain fresh (left) or vitrified (right) oocytes that have been non-manipulated (control) or used as spindle (sp) donors for MST procedures.
Microfilaments of actin are labeled in red, tubulin in green and DNA in blue.
Figure 2
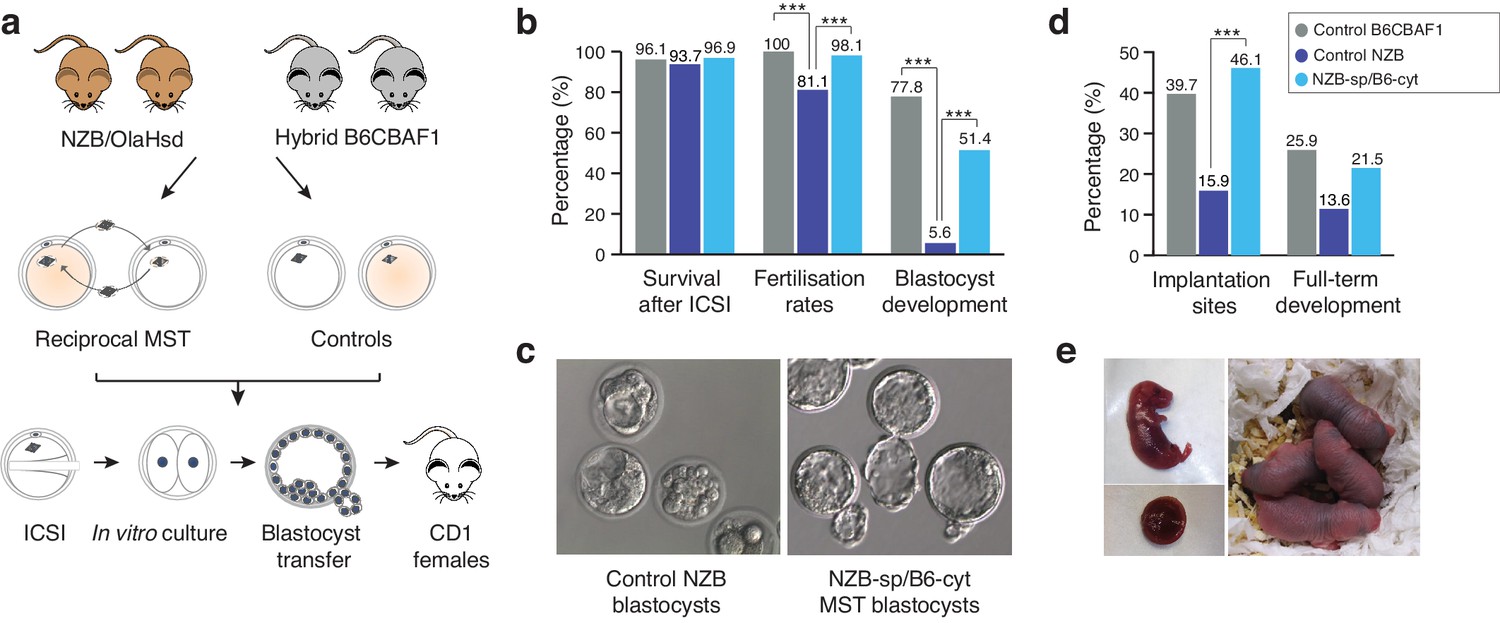
Meiotic spindle transfer between NZB/OlaHsd and B6CBAF1 oocytes.
(a) Schematic representation of the experimental design. (b) Comparison between in vitro developmental rates in MST embryos and controls. (c) Representative blastocyst images from NZB oocytes fertilized by ICSI and cultured for 96 hr (left) or MST embryos where NZB spindle was transferred into B6 strain cytoplasts (right) fertilized by ICSI and cultured for 96 hr. Note the improved blastocyst morphology upon MST. (d) In vivo development rates between MST and controls. (e) Representative neonate generated by MST with its corresponding placenta (left) and 2 day-old MST pups (right). Statistical significance was calculated with Chi-square or Fisher’s exact test. *** indicates p-values<0.05.
Figure 3 with 2 supplements
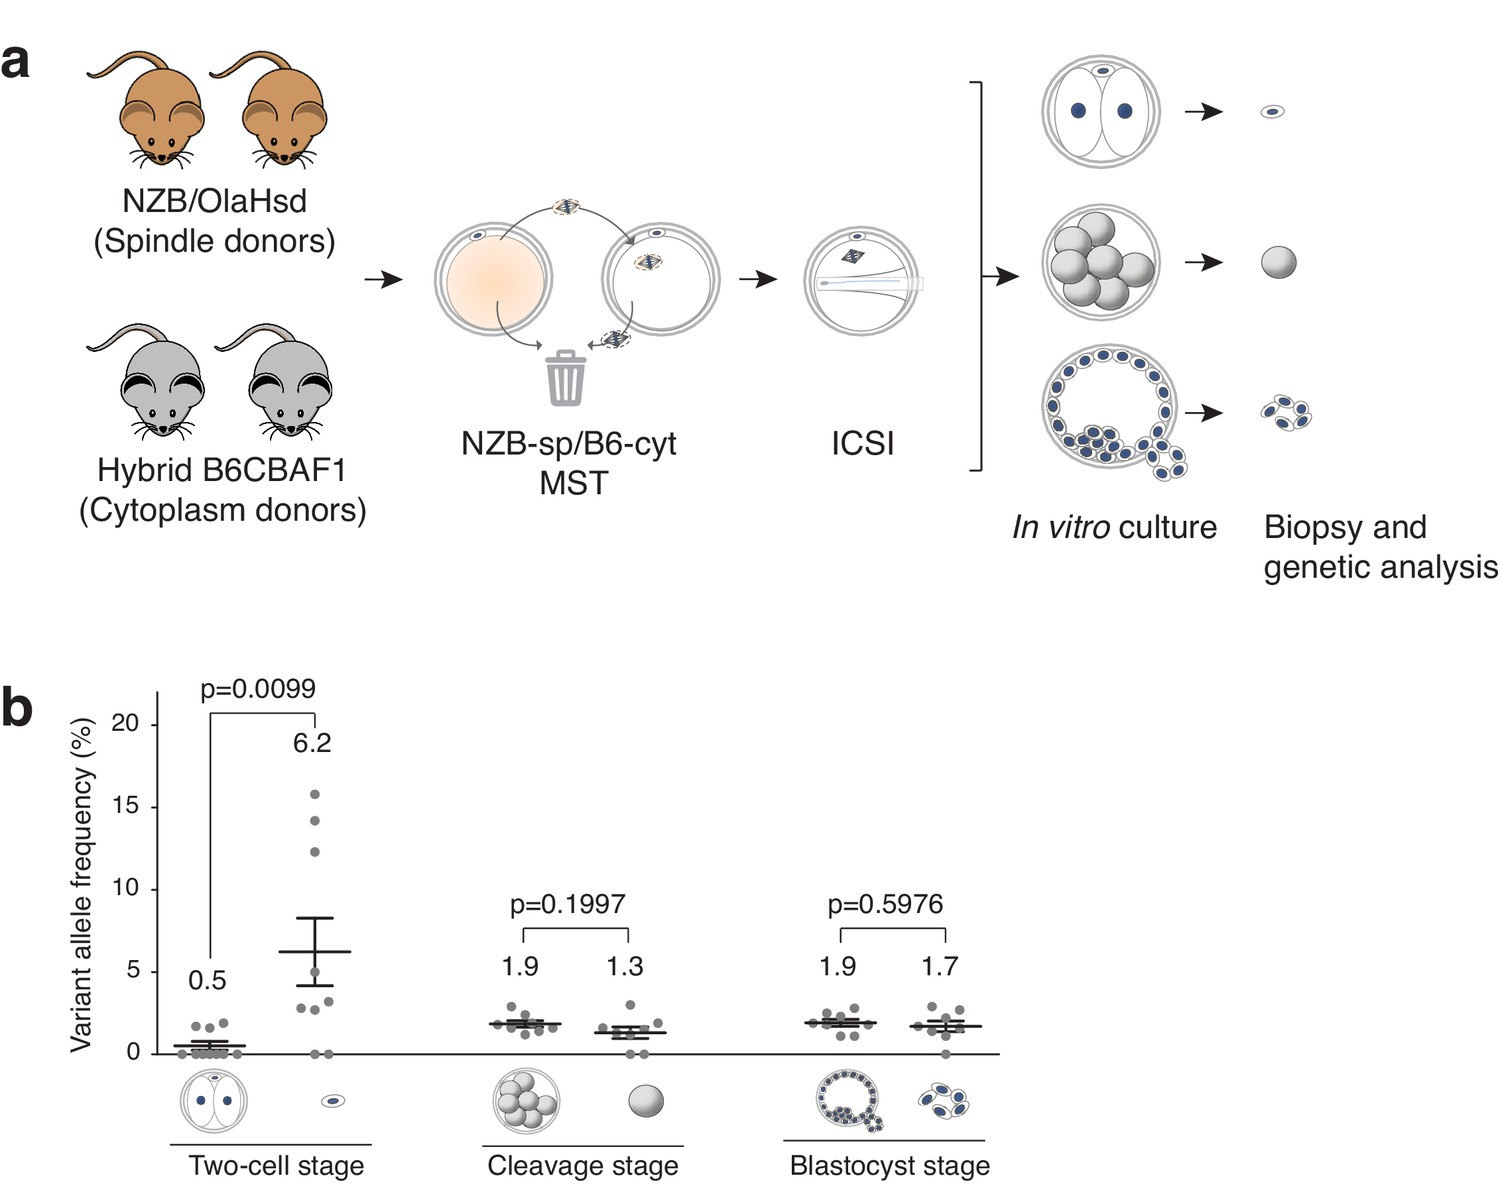
Analysis of mtDNA carryover in biopsied cells and complementary embryos from MST between NZB/OlaHsd and B6CBAF1 strain oocytes.
(a) Schematic representation of the experimental design. (b) Variant allele frequencies detected in embryo specimens. Dots represent allele frequencies of individual samples. Unpaired t-test was used to compare frequencies between biopsies and corresponding entire embryos. ns = not significant. See also Figure 3—figure supplements 1–2.
Figure 3—figure supplement 1
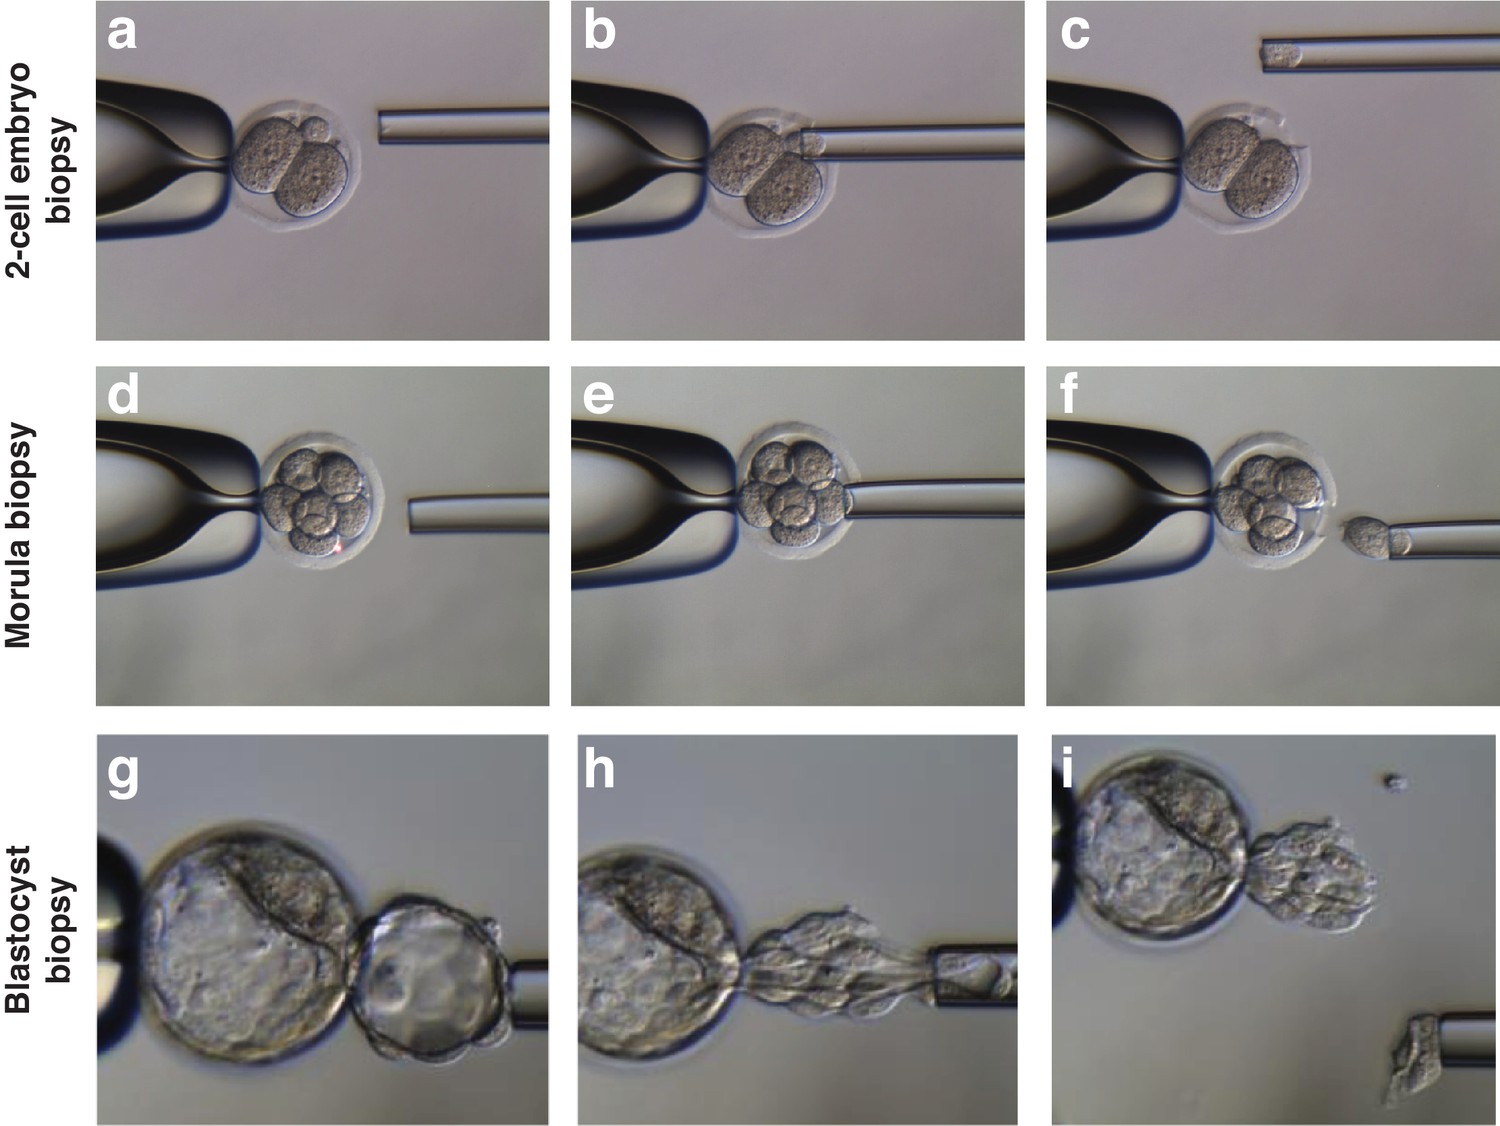
Representative pictures of biopsy procedure in MST embryos for mtDNA heteroplasmy quantification.
(a-c) Second polar body biopsy of a 2 cell stage MST embryo. (d-f) Blastomere biopsy of a 8 cell stage MST embryo. (g-i) Trophoectoderm biopsy of a MST blastocyst embryo.
Figure 3—figure supplement 2
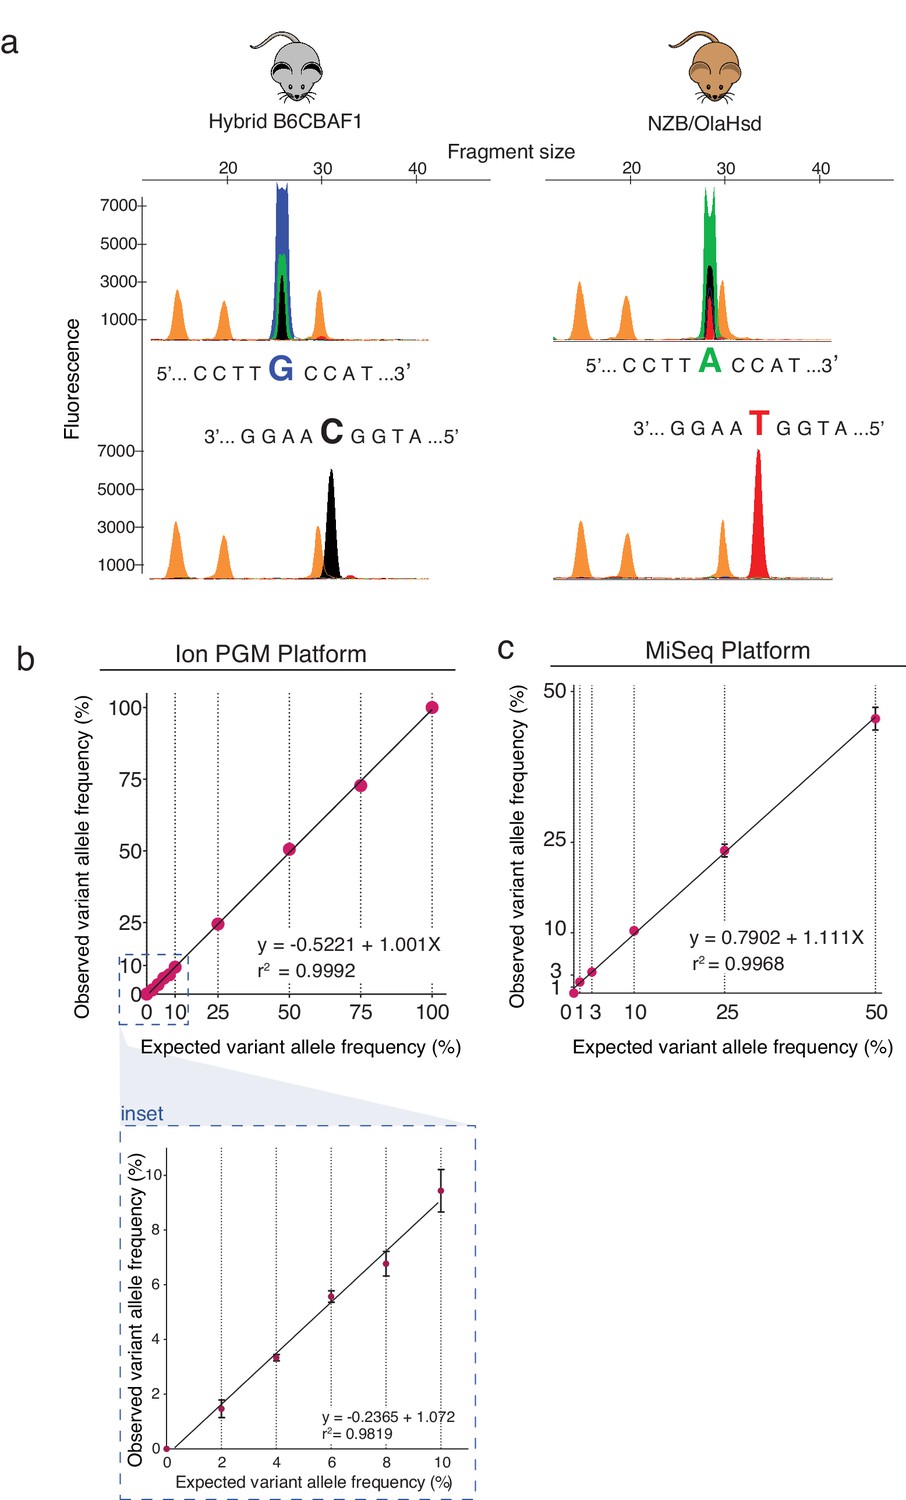
Validation of established high-throughput sequencing protocol for mtDNA carryover analysis.
(a) Results of SNP minisequencing analysis. The presence of guanine (G) or adenine (A); and cytosine (C) or thymine (T) at position m.3932 on the forward and reverse mtDNA strands of B6CBAF1 or NZB strains was confirmed by minisequencing. (b-c) Expected and observed variant allele frequencies at position m.3932 using Ion PGM (ThermoFisher) (b) or Illumina MiSeq plaforms (c). A high accuracy of the established sequencing method was obtained when analyzing allele frequencies at position m.3932 in homoplasmic samples and artificially constructed heteroplasmic samples. Error bars show standard deviation. Bottom panel shows a zoom inset. Linear regression was performed with Prism 6.0 software.
Figure 4 with 3 supplements

Analysis of mitochondrial heteroplasmy levels in adult mice born by MST.
(a) Mitochondrial heteroplasmy levels in several organs from 4 male and two female adult MST mice (F1) are maintained below 6%. (b) Mitochodrial heteroplasmy levels are not significantly different among several organs from F1 mice (one-way ANOVA’s p>0.05). (c) MST-derived mice from F2 showed undetectable levels of mtDNA heteroplasmy, except for low levels in liver and kidney in one female (F2.2). Horizontal lines represent median and standard errors of the mean. See also Figure 4—figure supplement 3.
Figure 4—figure supplement 1

Hematoxylin and eosin (H and E) stained sections of adult mice generated from B6 ICSI control embryos, B6 reciprocal MST and NZB-sp/B6-cyt MST embryos.
Representative images from liver (a-c), hippocampus (d-f), kidney cortex (g-i), heart (j-m), skeletal muscle from the tibia (n-p) and smooth muscle from the bladder (q-s). All analyzed sections showed the typical morphology of a healthy tissue.
Figure 4—figure supplement 2
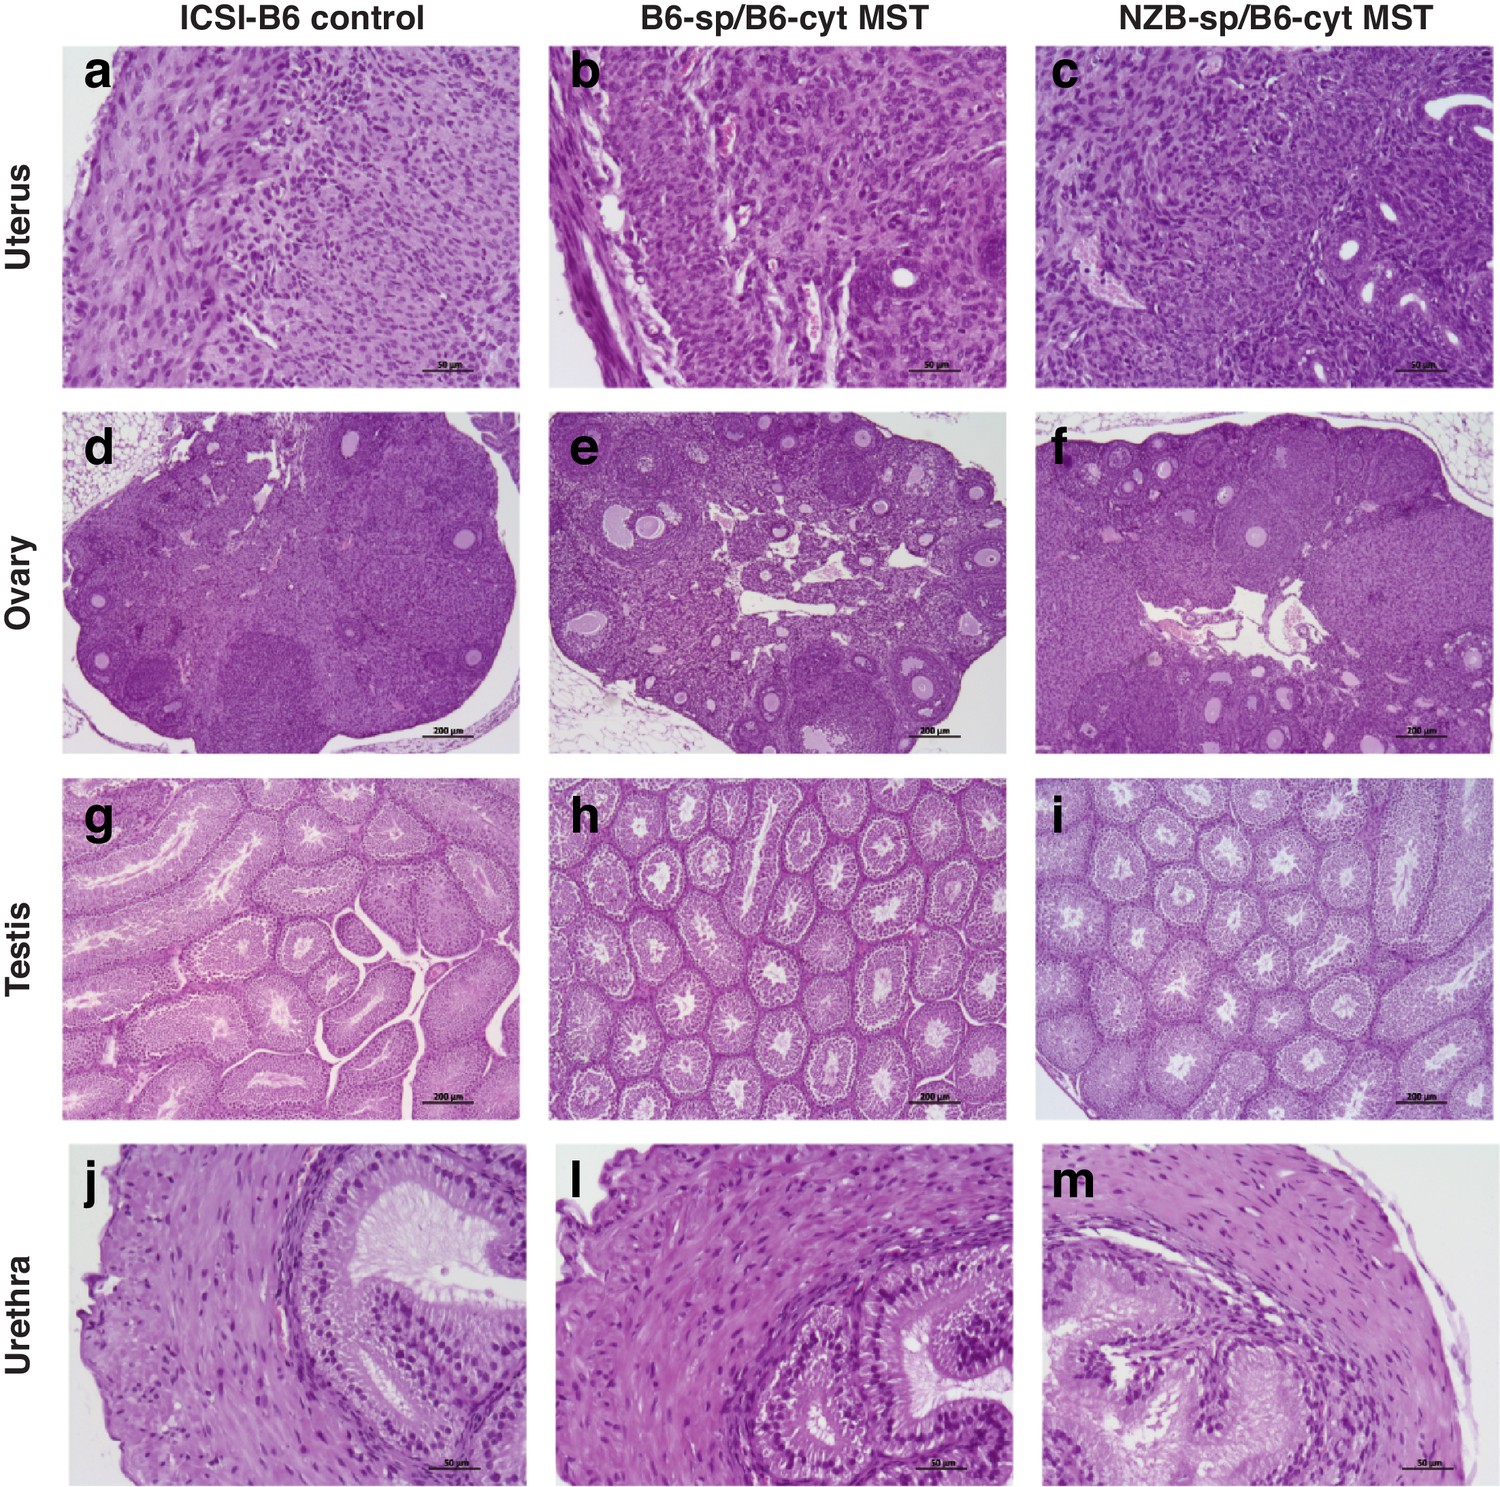
Hematoxylin and eosin (H and E) stained sections of the reproductive organs of adult mice generated from B6 ICSI control embryos, B6 reciprocal MST and NZB-sp/B6-cyt MST embryos.
Representative images from uterus (a-c), ovary (d-f), testis (g-i), and male urethra (j-m). All analyzed sections showed the typical morphology of a healthy tissue.
Figure 4—figure supplement 3
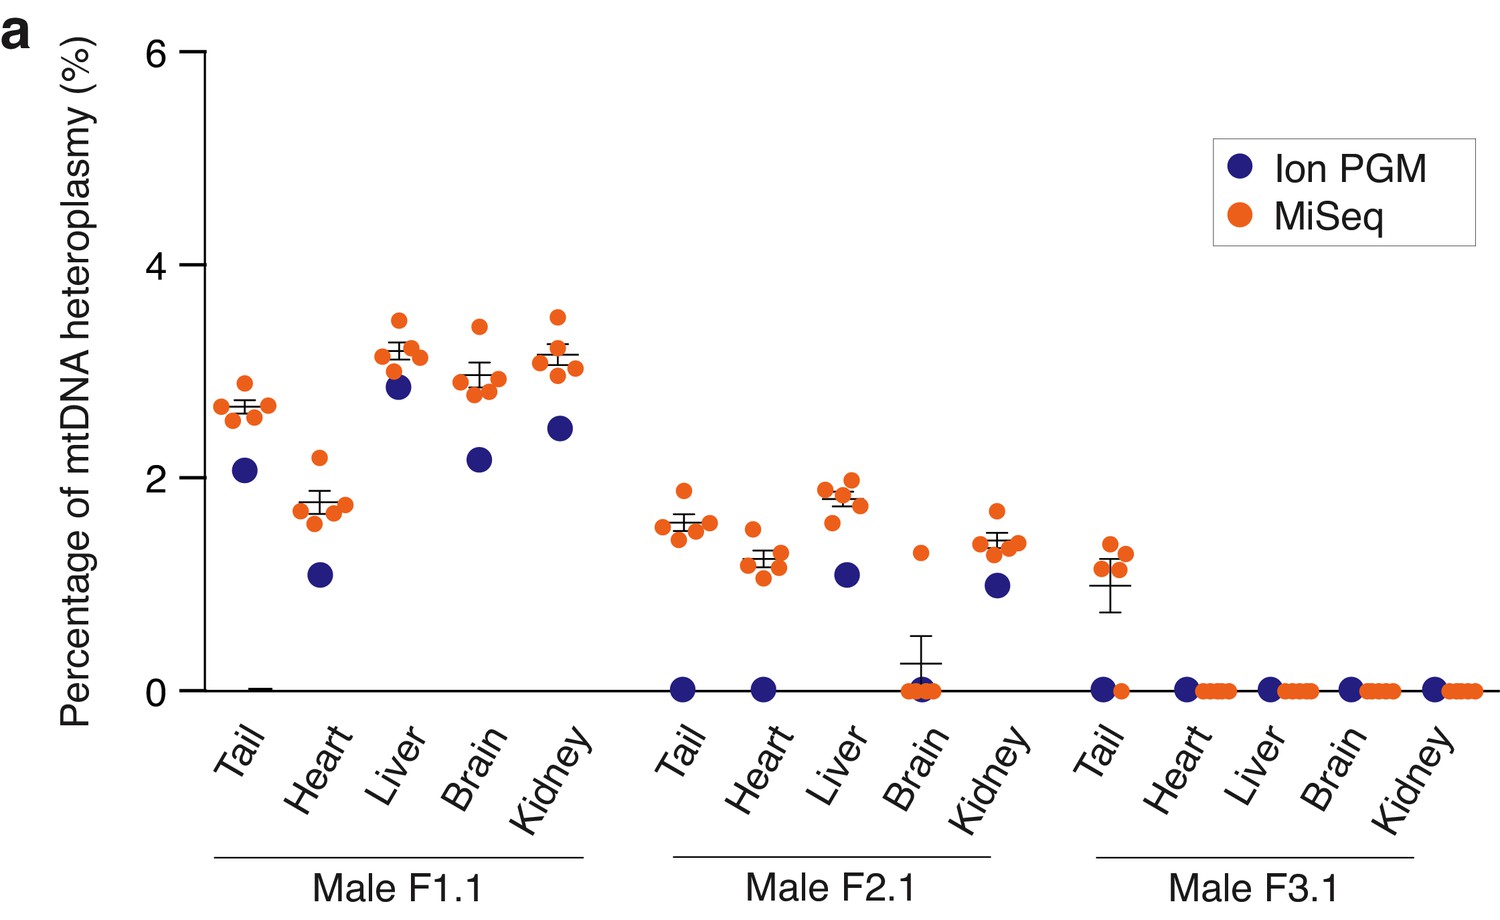
Validation of established sequencing protocol for mtDNA carryover analysis using two sequencing platforms.
Allele frequencies at positions m.2798, m.2814, m.3194, m.3260 and m.3932 in five adult mouse tissues from NZB-sp/B6-cyt MST mice measured with MiSeq (orange) and SNP m.3932 in Ion PGM sequencer (blue). Non detectable values are plotted as 0. No statistical differences were found between quantifications of both methods (Student’s t p>0.05). See also.
Tables
Table 1
Efficiency and in vitro developmental rates of B6CBAF1 mouse oocytes processed by MST using fresh and vitrified oocytes.
| n oocytes processed by MST | In vitro development for up 96 hr post-ICSI | ||||||||
|---|---|---|---|---|---|---|---|---|---|
| Group | n initial | Enucleated (%) | Fused (%) | ICSI survival (%) | n cultured | Two-cells (%) | Blastocysts (%) | Total cell counts (± SD) | Oct4+ |
| Control fresh | 98 | N/A | N/A | 94 (95.9) | 94 | 91 (96.8)* | 79 (84.1)* | 192.1 (29.5) | 25.3 (5.6) |
| Control vitrified | 102 | N/A | N/A | 90 (88.2) | 90 | 87 (96.7)* | 71 (78.9)*,† | N/A | N/A |
| MST FreshSp/FreshCyt | 107 | 107 (100) | 103 (96.2) | 100 (97.1) | 100 | 99 (99)* | 81 (81)* | 177.8 (26.7) | 22.4 (3.5) |
| MST FreshSp/VitriCyt | 96 | 96 (100) | 95 (98.9) | 90 (94.7) | 90 | 73 (81.1)† | 65 (72.2)*,‡ | N/A | N/A |
| MST VitriSp/FreshCyt | 98 | 96 (97.9) | 96 (100) | 90 (93.8) | 90 | 90 (100)* | 77 (85.6)* | N/A | N/A |
| MST VitriSp/VitriCyt | 98 | 95 (96.9) | 93 (97.9) | 85 (91.4) | 85 | 70 (82.4)† | 56 (65.9)†,‡ | N/A | N/A |
-
*, †, ‡ Values with different superscripts differ significantly within the same column (p<0.05; Chi-square test or Fisher's test).
Table 2
Efficiency and in vitro developmental rates of non-manipulated control and MST oocytes.
| n oocytes processed by MST | In vitro development for up 96 hr post-ICSI | |||||||
|---|---|---|---|---|---|---|---|---|
| Group | n initial | Enucleated (%) | Fused (%) | ICSI survival (%) | Cultured | Two-cell (%) | Morula (%) | Blastocysts (%) |
| Control B6CBAF1 | 155 | N/A | N/A | 149 (96.1) | 144 | 144 (100.0)* | 121 (84.1)* | 112 (77.8)* |
| Control NZB | 193 | N/A | N/A | 181 (93.7) | 159 | 129 (81.1)† | 36 (22.6)† | 9 (5.6)† |
| MST B6-St/NZB-Cyt | 156 | 149 (95.5) | 144 (96.6) | 132 (91.7) | 110 | 93 (70.5)† | 11 (8.3)† | 0 (0.0)‡ |
| MST NZB-St/B6-Cyt | 270 | 238 (88.1) | 228 (95.7) | 221 (96.9) | 212 | 208 (98.1)* | 169 (79.7)* | 109 (51.4) § |
-
*,†,‡,§ Values with different superscripts differ significantly within the same column (p<0.05; Chi-square test or Fisher's test).
Table 3
In vivo developmental rates of non-manipulated control and MST oocytes.
| In vivo development | |||
|---|---|---|---|
| Group | n transferred | n implantation sites (%) | n full-term (%) |
| Control B6CBAF1 | 58 | 23 (39.7)* | 15 (25.9) |
| Control NZB | 44 | 7 (15.9)† | 6 (13.6) |
| MST B6-St/NZB-Cyt | N/A | N/A | N/A |
| MST NZB-St/B6-Cyt | 65 | 30 (46.1)* | 14 (21.5) |
-
*, † Values with different superscripts differ significantly within the same column (p<0.05; Chi-square test or Fisher's test).
Table 4
Average weights of placentas and pups generated from control and MST oocytes.
| Average weight | |||
|---|---|---|---|
| Group | n | Placentas (± SD) | Pups (± SD) |
| Control B6CBAF1 | 3 | 134.1 (23.3) | 802.1 (153.2) |
| Control NZB | 3 | 171.1 (27.9) | 747.9 (76.9) |
| MST B6-St/NZB-Cyt | N/A | N/A | N/A |
| MST NZB-St/B6-Cyt | 4 | 168.3 (14.1) | 923.5 (146.5) |
Additional files
-
Source data 1
Variant site coverages referring to Supplementary file 1.
- https://cdn.elifesciences.org/articles/48591/elife-48591-data1-v2.xlsx
-
Source data 2
Variant site coverages referring to Supplementary file 2.
- https://cdn.elifesciences.org/articles/48591/elife-48591-data2-v2.xlsx
-
Source data 3
Variant site coverages referring to Supplementary file 3.
- https://cdn.elifesciences.org/articles/48591/elife-48591-data3-v2.xlsx
-
Source data 4
Variant site coverages referring to Supplementary file 4.
- https://cdn.elifesciences.org/articles/48591/elife-48591-data4-v2.xlsx
-
Source data 5
Variant site coverages referring to Supplementary file 6.
- https://cdn.elifesciences.org/articles/48591/elife-48591-data5-v2.xlsx
-
Supplementary file 1
Validation of established sequencing protocol for mtDNA carryover analysis measured by Ion PGM sequencer.
Allele frequencies at position m.3932 in homoplasmic samples and artificially constructed heteroplasmic sample mixtures. See also Source data 1.
- https://cdn.elifesciences.org/articles/48591/elife-48591-supp1-v2.xlsx
-
Supplementary file 2
Validation of established sequencing protocol for mtDNA carryover analysis using MiSeq sequencer.
Allele frequencies at positions m.2798, m.2814, m.3194, m.3260 and m.3932 in homoplasmic samples and artificially constructed heteroplasmic sample mixtures. See also Source data 2.
- https://cdn.elifesciences.org/articles/48591/elife-48591-supp2-v2.xlsx
-
Supplementary file 3
mtDNA heteroplasmy analysis of biopsies and complementary embryos using Ion PGM platform.
Allele frequencies at position m.3932 are shown. See also Source data 3.
- https://cdn.elifesciences.org/articles/48591/elife-48591-supp3-v2.xlsx
-
Supplementary file 4
Analysis of fertility and developmental potential of MST litters through five generations.
- https://cdn.elifesciences.org/articles/48591/elife-48591-supp4-v2.xlsx
-
Supplementary file 5
Allele frequencies at position m.3932 in adult MST mouse tissues through five generations using Ion PGM platform.
See also Source data 4.
- https://cdn.elifesciences.org/articles/48591/elife-48591-supp5-v2.xlsx
-
Supplementary file 6
Validation of established sequencing protocol for mtDNA carryover analysis using MiSeq platform.
Allele frequencies at positions m.2798, m.2814, m.3194, m.3260 and m.3932 in adult MST mouse tissues. See alsoSource data 5.
- https://cdn.elifesciences.org/articles/48591/elife-48591-supp6-v2.xlsx
-
Transparent reporting form
- https://cdn.elifesciences.org/articles/48591/elife-48591-transrepform-v2.docx
Download links
A two-part list of links to download the article, or parts of the article, in various formats.
Downloads (link to download the article as PDF)
Open citations (links to open the citations from this article in various online reference manager services)
Cite this article (links to download the citations from this article in formats compatible with various reference manager tools)
Maternal spindle transfer overcomes embryo developmental arrest caused by ooplasmic defects in mice
eLife 9:e48591.
https://doi.org/10.7554/eLife.48591


