Matrix metalloproteinase 1 modulates invasive behavior of tracheal branches during entry into Drosophila flight muscles
- University of Münster, Germany
- Cluster of Excellence EXC 1003, Cells in Motion (CiM), Germany
- Aix Marseille University, CNRS, IBDM, France
Figures
Figure 1 with 1 supplement
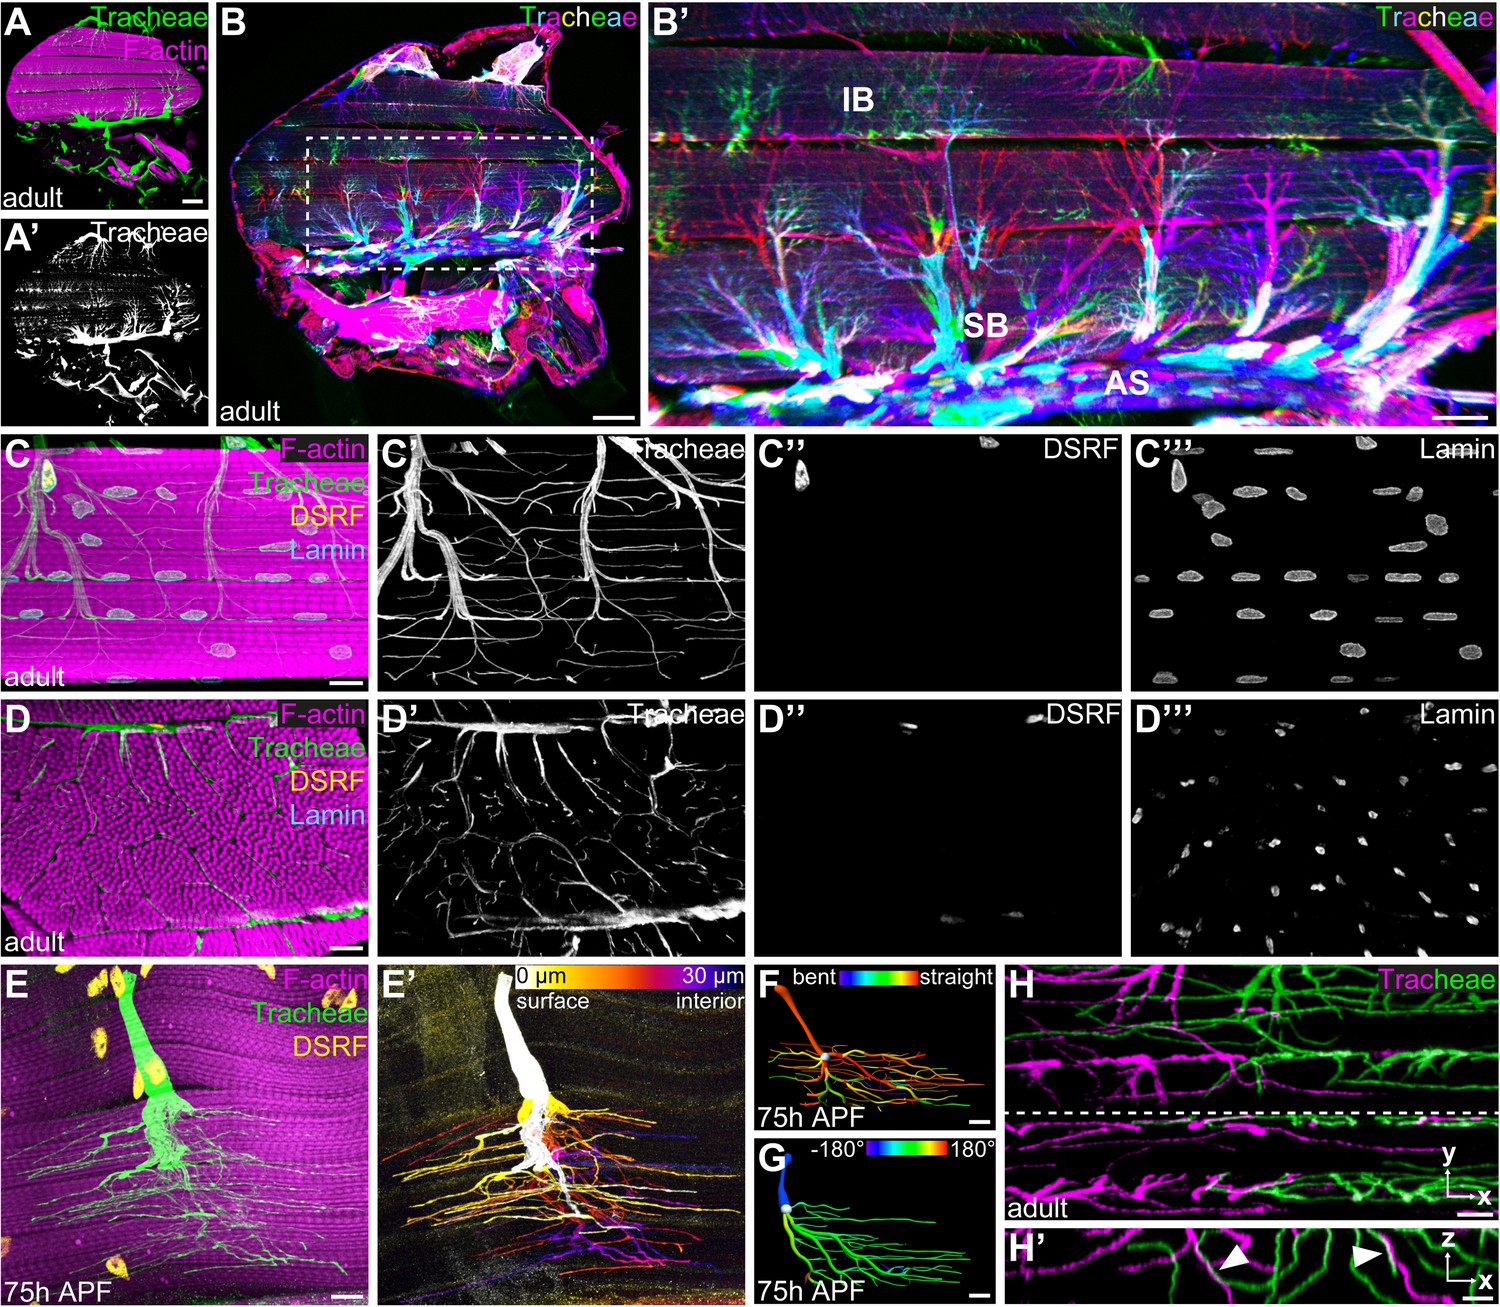
Tracheal terminal cell branches occupy separate territories in IFMs.
(A–A’) Sagittal section of an adult thorax with dorsal longitudinal muscles (DLMs) stained for F-actin (magenta). Tracheal branches, visualized by their autofluorescence (green) arise from the thoracic air sacs adjacent to IFMs. (B) Stochastic multicolor labeling of tracheal cells in a sagittal section of an adult thorax. Multicellular tubes (B’) emanating from air sacs (AS) are superficial branches (SB) with tracheal terminal cells at their ends. Terminal cell branches spread on the muscle surface and invade as internal branches (IB) into the myotube. Note that individually labeled terminal cells occupy largely separate territories in IFMs (B’). (C,D) Tracheal branch supply of a single myotube in sagittal (C–C’’’) and cross- (D–D’’’) section stained for F-actin (magenta), LaminDm0 (cyan; all nuclei) and DSRF (yellow; tracheal terminal cell nuclei). Tracheal autofluorescence is shown in green. Cell bodies of tracheal terminal cells with DSRF-positive nuclei are located on the myotube surface. Terminal branches spread on the myotube surface, but also invade between and within myofibril bundles. (E) Single MARCM-labeled terminal tracheal cell in a developing IFM 75 hr APF. The tracheal cell, labeled with cytoplasmic GFP (green) and nuclear DSRF (yellow), extends fine tracheoles parallel to myofibrils (magenta). Color-coding of depth (E’) indicates that a single tracheal cell ramifies deep into the myotube. The color map to the upper right indicates depth in the z-axis. (F,G) Segmented IFM tracheal terminal cell color-coded for branch straightness (F) and branch orientation angle (G). Note that the majority of branches extend straight projections (F) and that branches extending from a given terminal cell often display a bias towards one orientation along the myotube long axis (G). (H–H’) Close-up of branches from two differentially labeled tracheal terminal cells (green and magenta). Note that while individual terminal cells occupy largely separate territories within the myotube, some branches of adjacent cells appear to be in close proximity or direct contact (arrowheads in H’). H’ shows an orthogonal section in the x-z plane indicated by a dashed line in H. Scale bars: 100 μm (A, A’,B), 50 μm (B’), 10 μm (C–G), 5 μm (H,H’).
Figure 1—figure supplement 1
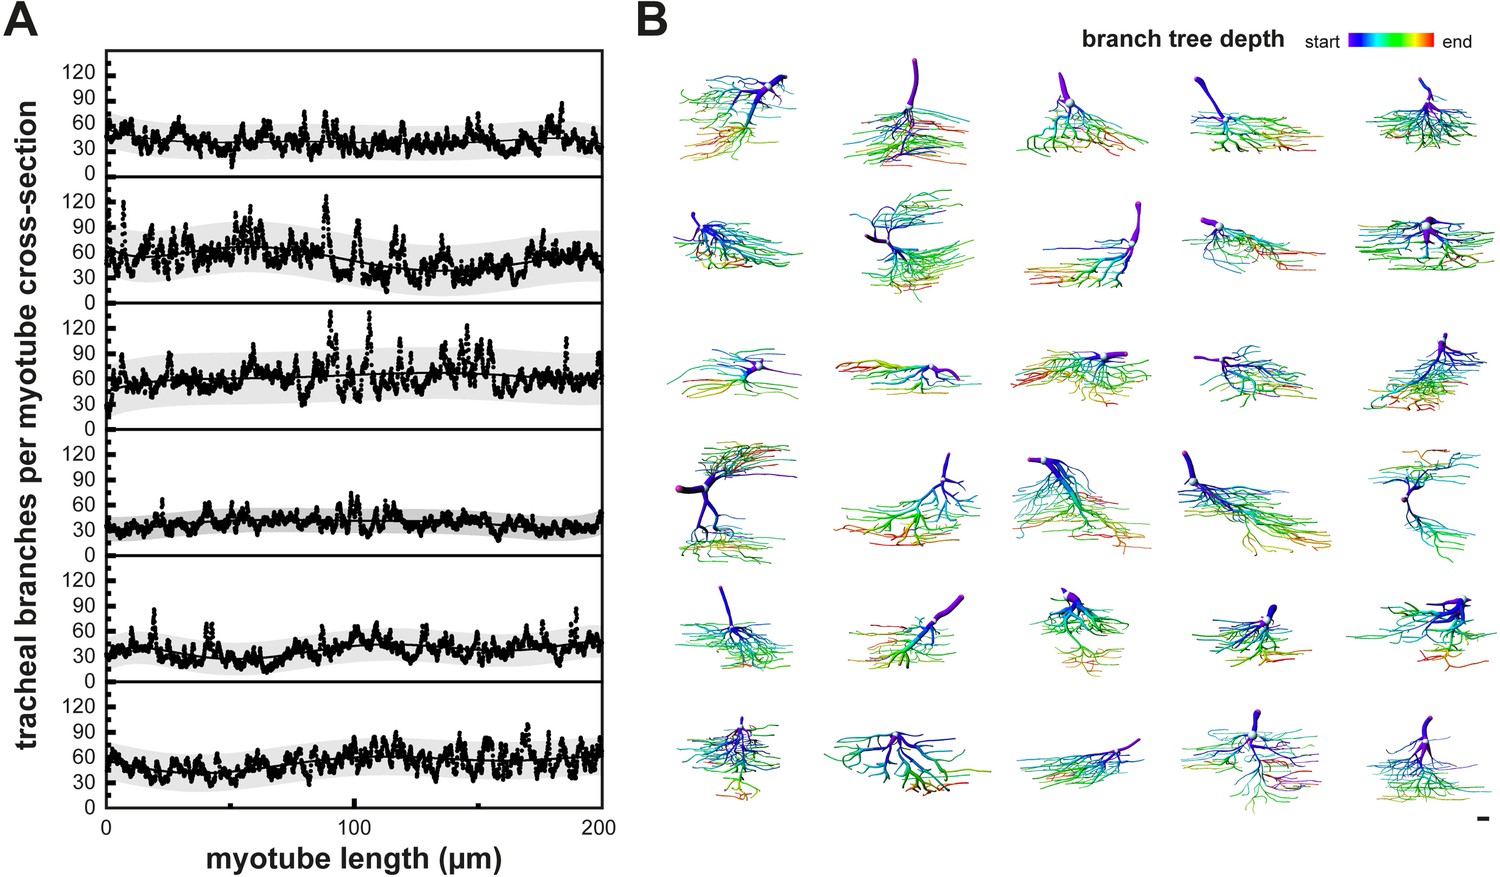
Tracheal terminal cells with non-stereotyped cellular morphologies fill the myotube volume.
(A) The fraction of a myotube cross-section occupied by tracheal branches was plotted over a distance of 200 μm in six different myotubes. The gray band indicates the 95% prediction band. Note that myotubes are uniformly filled with tracheal branches along their length. (B) 30 individual segmented IFM tracheal terminal cells were color-coded for branch tree depth, which represents consecutive branching events. Warmer colors indicate higher-order branches. Note the heterogeneity in the tracheal cell morphologies. Scale bar: 10 μm (B).
Figure 2 with 1 supplement
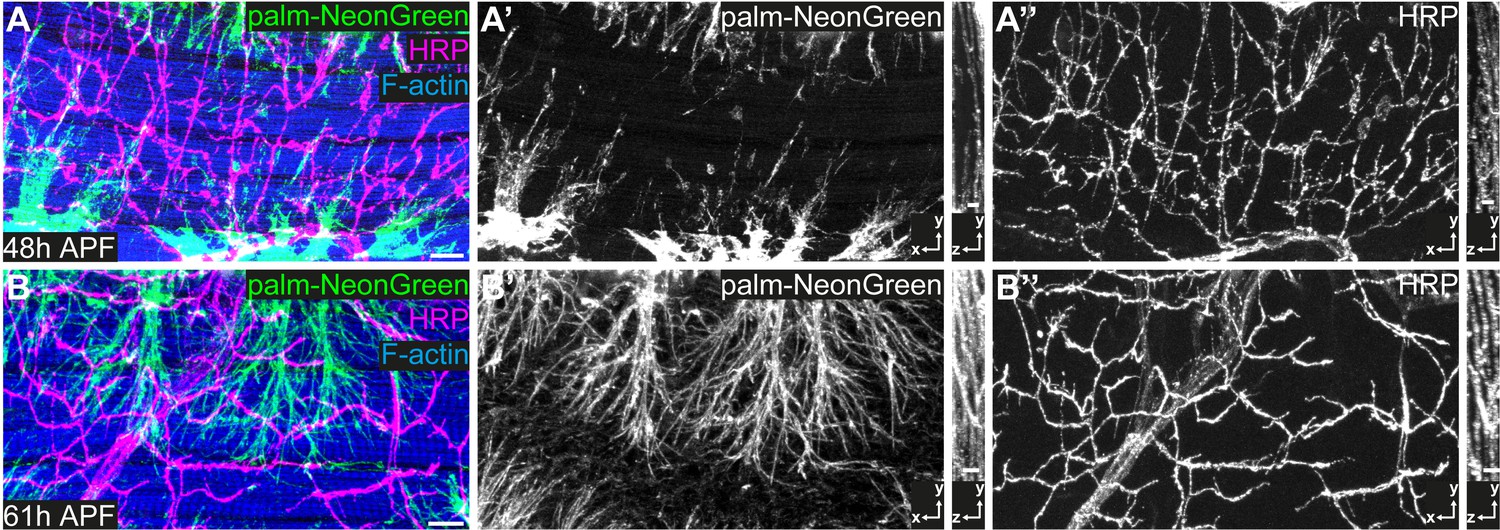
IFM innervation precedes tracheal invasion.
(A,B) DLMs at 48 hr APF (A) and 61 hr APF (B). Tracheal cell membranes are labeled by palmitoylated mNeonGreen (green) driven by btl-Gal4. F-actin is labeled with Phalloidin (blue) and neurons with HRP (magenta). Note that at 48 hr APF (A–A’’), when tracheal invasion has just started, the muscle is already innervated with motor neurons. At 61 hr APF tracheae have invaded the myotube (B–B’’). Cross-sections to the right show that most tracheal branches reside on the surface of the myotube at 48 hr APF, whereas tracheal branches are inside the myotube at 61 hr APF. Scale bars: 10 μm (A,B).
Figure 2—figure supplement 1
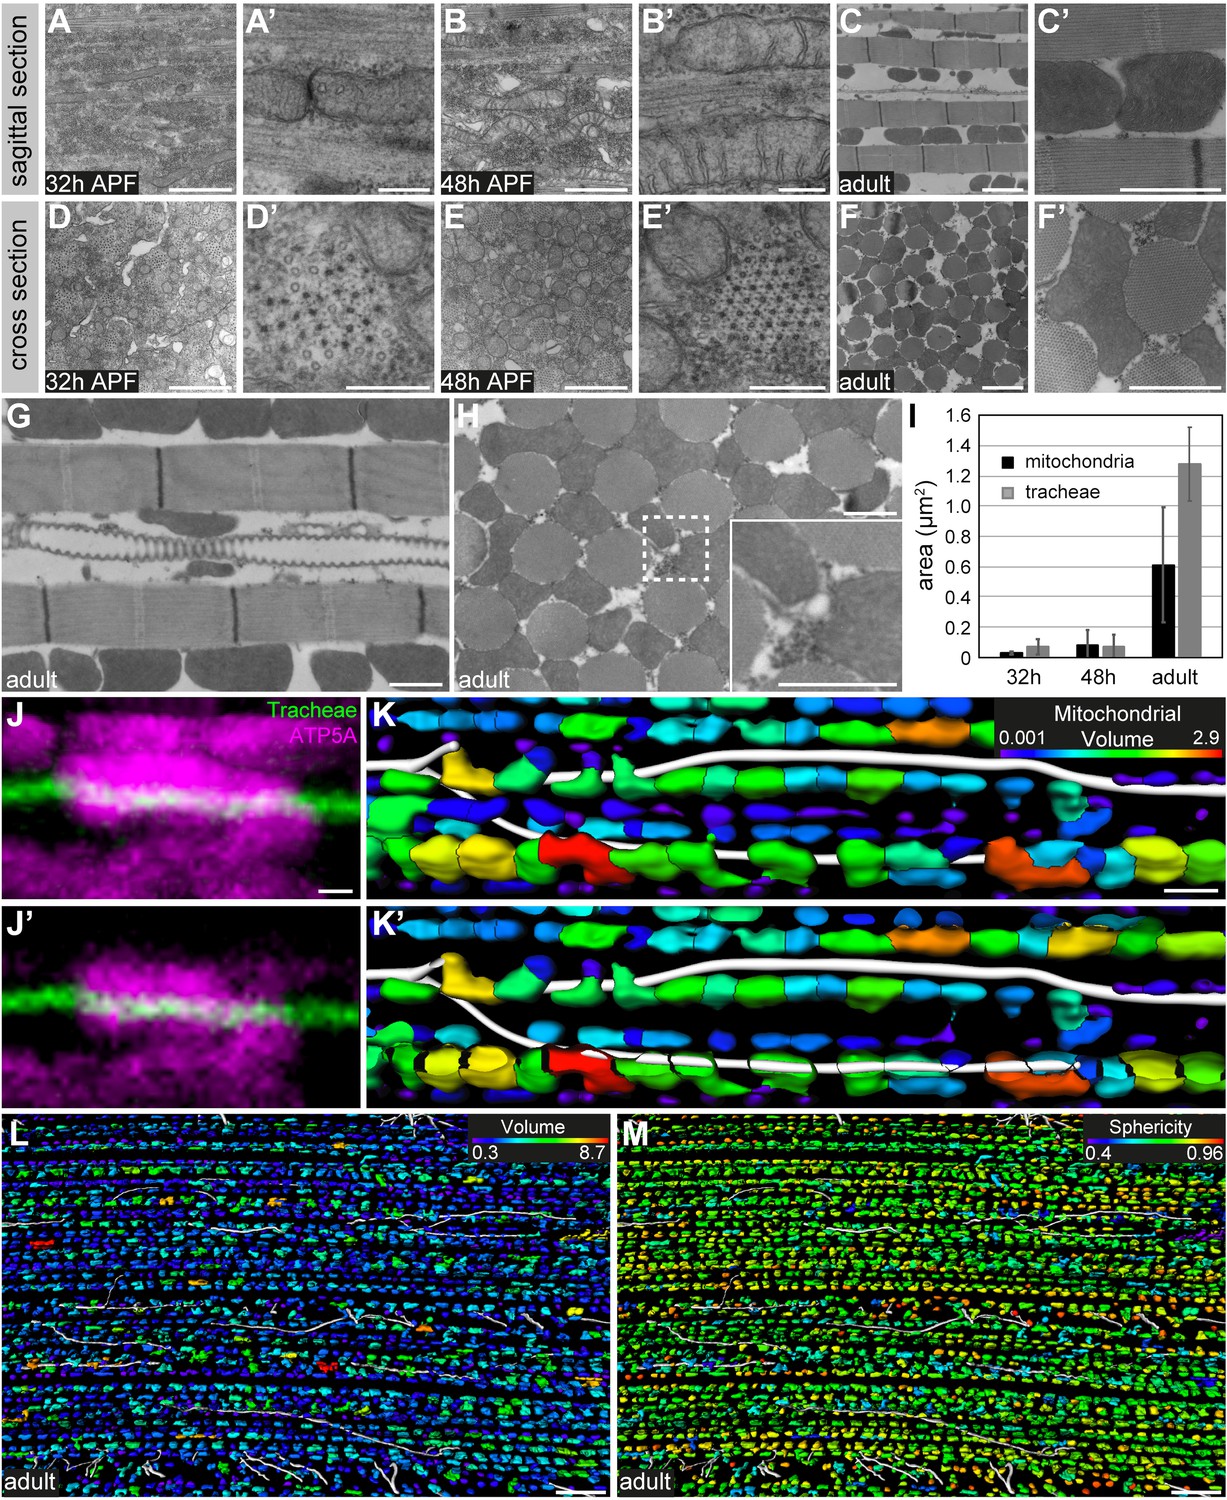
Mitochondria change their morphology during IFM development and partially enwrap tracheoles.
(A–H) Transmission electron micrographs of sagittal (A–C’,G) and cross-sections (D–F’,H) of DLMs at 32 hr APF (A–D’), 48 hr APF (B–E’) and in adult flies (C–F’). Note that mitochondrial morphology changes from elongated-tubular (48 hr APF) to globular shape in the adult. Cristae become increasingly elaborated as IFM development proceeds (compare A’,B’ to C’). (G,H) Tracheoles are closely associated with mitochondria. The region marked by a dashed line in H) is shown as a close-up (inset). (I) Analysis of the cross-sectional area (in µm2) of mitochondria (black bars) and tracheal lumen (gray bars), respectively, at 32 hr APF, 48 hr APF, and in adult flies. (J,J’) show two consecutive confocal sections demonstrating partial enclosure of a tracheole (autofluorescence in green) by a mitochondrium labeled with anti-ATP5A antibody (magenta). Images were acquired using the Airyscan detector (LSM880) followed by Airyscan processing. (K,K’) Segmentation of tracheal branches (white) and mitochondria (color-coded for volume) in a myotube. (J) shows a projection of the entire z-stack, (J’) shows a projection starting from the plane with the tracheole. Note that mitochondria partially enwrap tracheoles. (L,M) Color-coding of mitochondria for volume (L) or sphericity (M) shows that mitochondria in proximity to tracheal branches do not differ in volume or morphology from mitochondria more distant to tracheal branches. Scale bars: 1 μm (A,B,C’,D,E,F’,G,H), 200 nm (A’,B’D’,E’), 2 μm (C,F), 0.4 μm (J,J’), 2 µm (K,K’), 10 µm (L,M).
-
Figure 2—figure supplement 1—source data 1
Source data for Figure 2—figure supplement 1I.
- https://doi.org/10.7554/eLife.48857.007
Figure 3 with 1 supplement
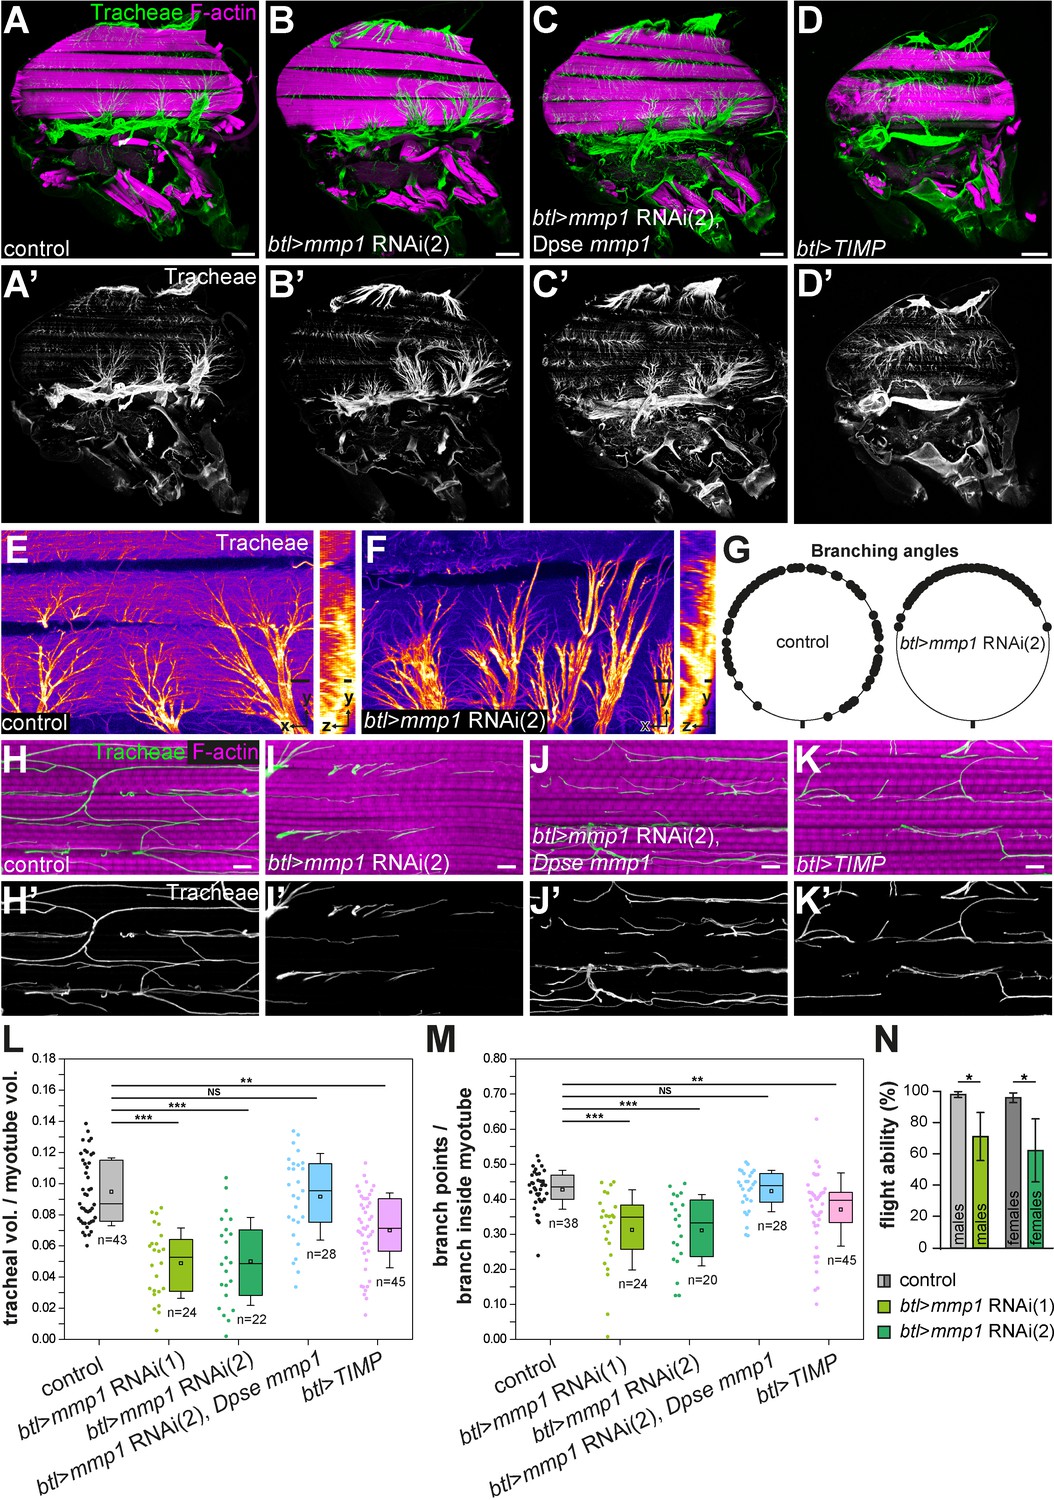
Tracheal branch invasion requires MMP1 function in tracheal cells.
(A–D’) Sagittal sections of adult thoraxes stained for F-actin (magenta). Autofluorescence of tracheae is shown in green. (E,F) show close-ups of tracheal branches on the IFM surface. Orthogonal sections (yz) are shown to the right. Note altered spreading of tracheal branches on the myotube surface upon tracheal-specific Mmp1 knock-down. The effect of Mmp1 knock-down was rescued by the Drosophila pseudoobscura Mmp1 homologue GA18484 (Dpse Mmp1; C). Tracheal expression of TIMP (D) phenocopies the effect of RNAi-mediated Mmp1 depletion. (G) The angles between branches emerging from tracheal cell bodies on the myotube surface are reduced in tracheal Mmp1 knock-down animals compared to controls. (H–K) Sagittal sections of single myotubes. Note reduced number of tracheoles inside myotubes upon tracheal Mmp1 knock-down (I) compared to control (H). The effect of Mmp1 knock-down was rescued by the Drosophila pseudoobscura Mmp1 homologue GA18484 (Dpse Mmp1; J). Tracheal expression of TIMP (K) led to reduced tracheal invasion. (L,M) In a defined muscle volume the fraction occupied by tracheal branches (L) and the number of branch points per tracheal branch inside the myotube (M) were determined. At least 20 myotubes were scored. (N) Flight ability was measured as the percentage of flies that landed at the bottom immediately after throwing them into a Plexiglas cylinder (n = 4 experiments). Note that tracheal Mmp1 knock-down leads to reduced flight ability due to impaired muscle function. Mmp1 was depleted using Mmp1 RNAi (1) or Mmp1 RNAi (2) (Uhlirova and Bohmann, 2006). *p<0.05; **p<0.01; ***p<0.001; NS not significant. Scale bars: 100 μm (A–D’), 20 μm (E,F) and 5 μm (H–K’).
-
Figure 3—source data 1
Source data for Figure 3L,M,N.
- https://doi.org/10.7554/eLife.48857.012
Figure 3—figure supplement 1
Identification of genes required for branch invasion.
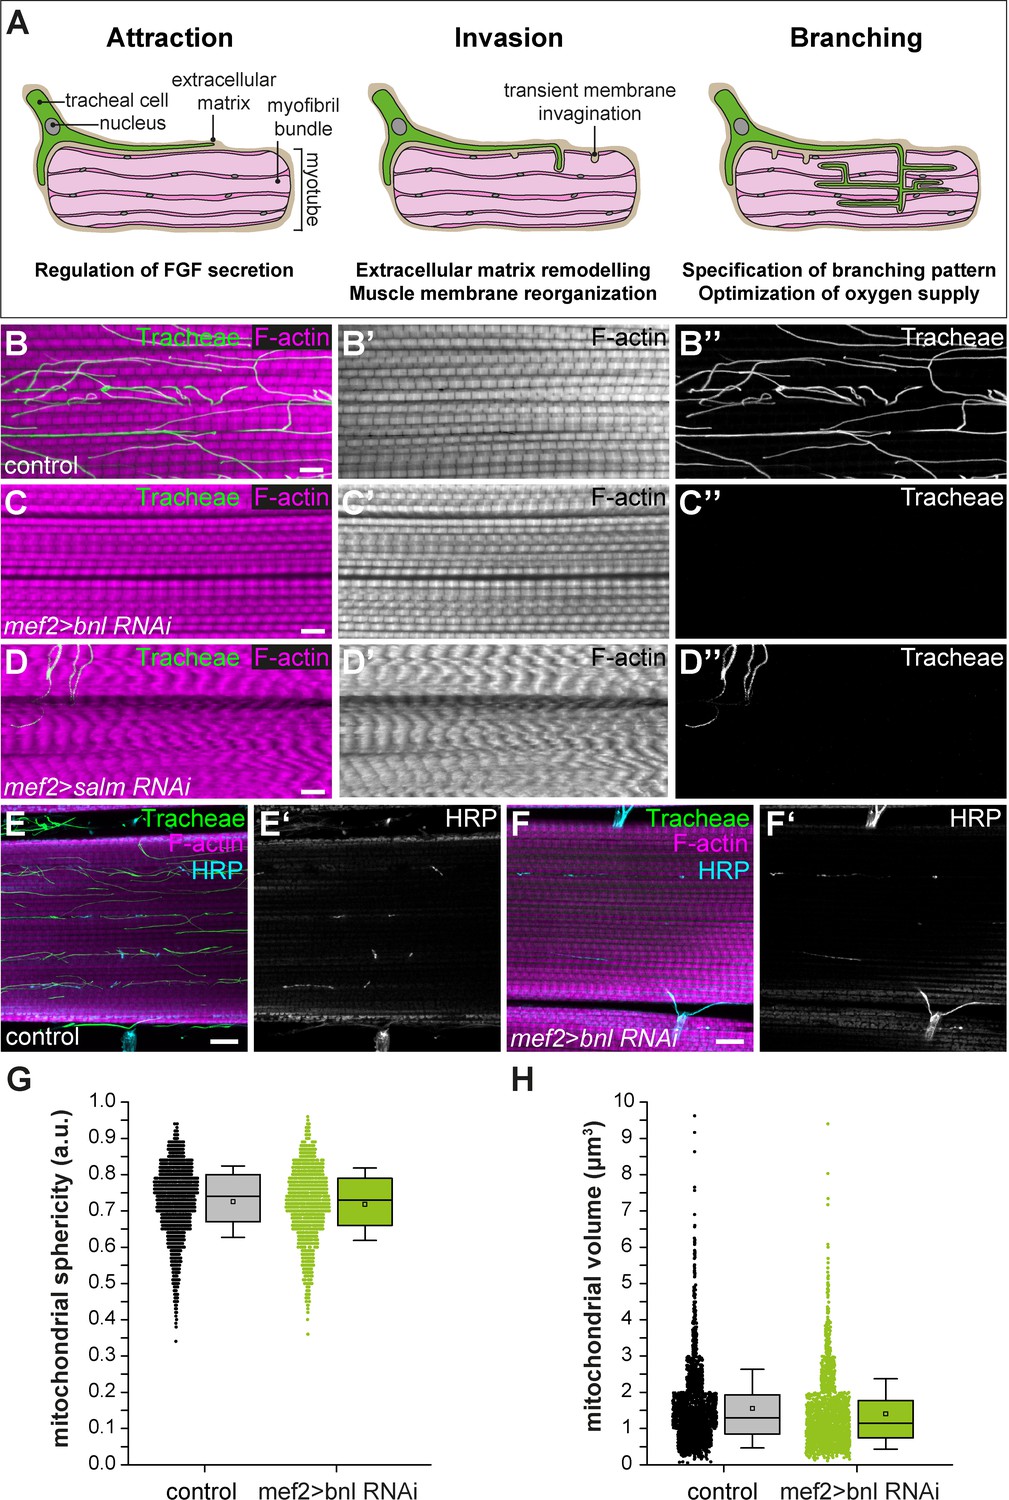
(A) Schematic illustration of the steps of IFM tracheation. Tracheal invasion into IFMs involves attraction by muscle-secreted Bnl FGF and entry of tracheal branches through membrane invaginations, which presumably provide access to the T-tubule system (Peterson and Krasnow, 2015). Ramification of tracheal branches within the myotube ensures efficient oxygen supply of mitochondria. (B–D) Close-ups of adult IFM myotubes of control flies (B), muscle-specific bnl RNAi (VDRC 109317; C) and muscle-specific salm RNAi (VDRC 3029; D). Myotubes were stained for F-actin (magenta), tracheae were visualized by their autofluorescence (green). Note that muscle-specific knock-down of bnl completely abolishes tracheal invasion but that myofibrils and sarcomeres of bnl-depleted trachealess IFMs do not show apparent morphological changes compared to wild-type controls (compare B’ and C’). Further note that transformation of IFMs to tubular muscle fate upon depletion of salm (D) completely abrogates tracheal invasion. (E–F) Muscle-specific depletion of bnl does not affect innervation of IFMs by motor neurons as visualized by anti-HRP staining (blue in E,F). (G,H) Mitochondrial sphericity (G) and mitochondrial volume (H) are not altered in the tracheaIess IFMs of bnl tracheal knock-down-animals compared to wild-type controls. Scale bars: 5 μm (B–D), 10 µm (E–F).
-
Figure 3—figure supplement 1—source data 1
Source Data for Figure 3—figure supplement 1G,H.
- https://doi.org/10.7554/eLife.48857.011
Figure 4 with 1 supplement
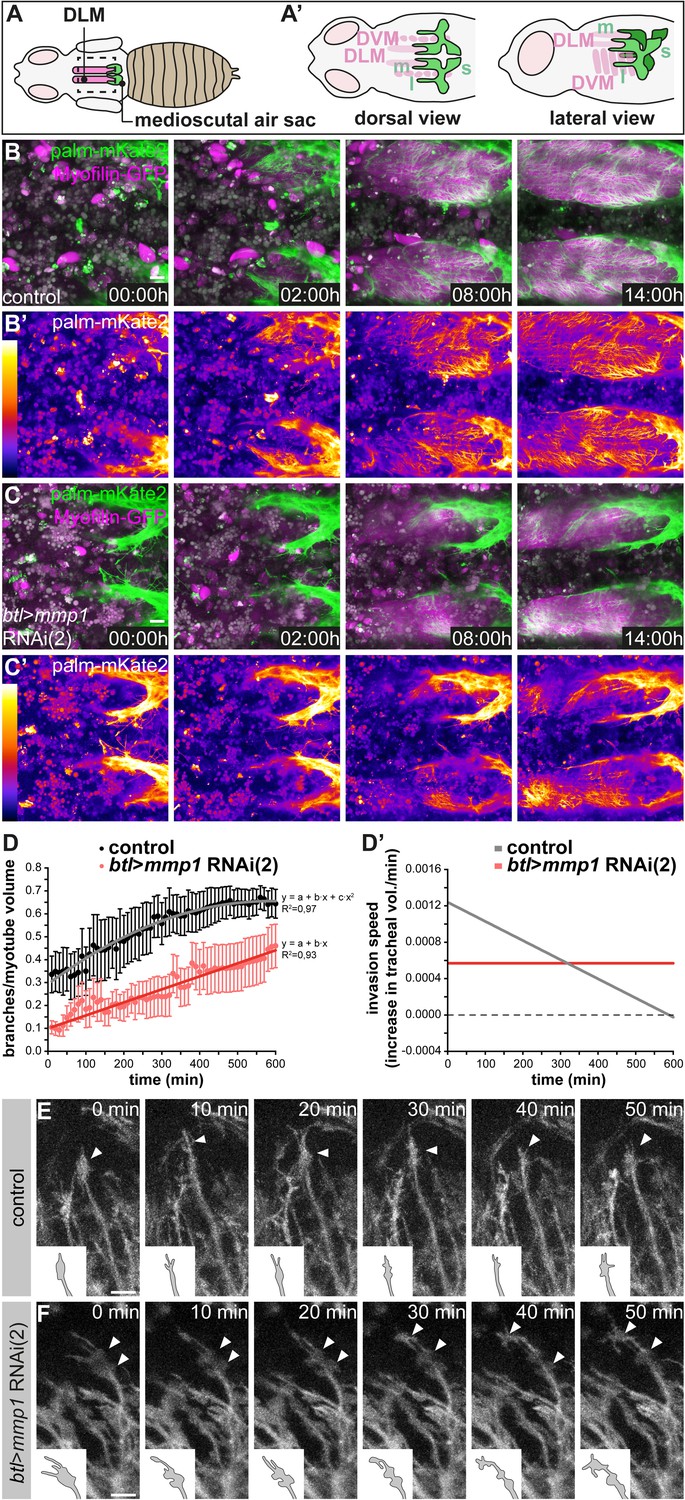
Normal dynamics of tracheal IFM invasion depends on tracheal Mmp1 function.
(A–A’) Schematics of pupal flight muscles and air sacs 48 hr APF. The pupal case around the head and thorax was removed for live imaging of tracheal invasion into IFMs. Tracheal invasion into dorsal longitudinal muscles (DLMs) from the medioscutal (m) air sacs was imaged from a dorsal view (A’). Tracheal invasion into dorso-ventral muscles (DVMs) from the lateroscutal (l) air sacs was imaged from a lateral view (A’). (B,C) Stills of tracheal invasion into DLMs by branches arising from the medioscutal air sac in a control pupa (B,B’) and a tracheal Mmp1 knock-down pupa (C,C’). Palmitoylated mKate2 (palm-mKate2, green in B,C) labels tracheal cells, Myofilin-GFP (magenta in B,C) labels myotubes. B’ and C’ show palm-mKate2 intensities displayed as a heat map. The first time point (00:00 hr) corresponds to 48 hr APF. (D) Quantification of tracheal branches over time in a defined myotube volume close to the medioscutal air sac. The speed of invasion (increase in tracheal branch fraction per minute; D’) was calculated for control and Mmp1 knock-down pupae (n = 3). (E,F) Stills of tracheal branch tips invading DVMs in control (E) and in tracheal Mmp1 knock-down pupa (F). Note that growth-cone like structures (arrowheads) are confined to branch tips in the wild type, but are found also along branch stalks upon Mmp1 knock-down (n = 3). Scale bars: 20 μm (B,C) and 10 μm (E,F).
-
Figure 4—source data 1
Source data for Figure 4D.
- https://doi.org/10.7554/eLife.48857.015
Figure 4—figure supplement 1
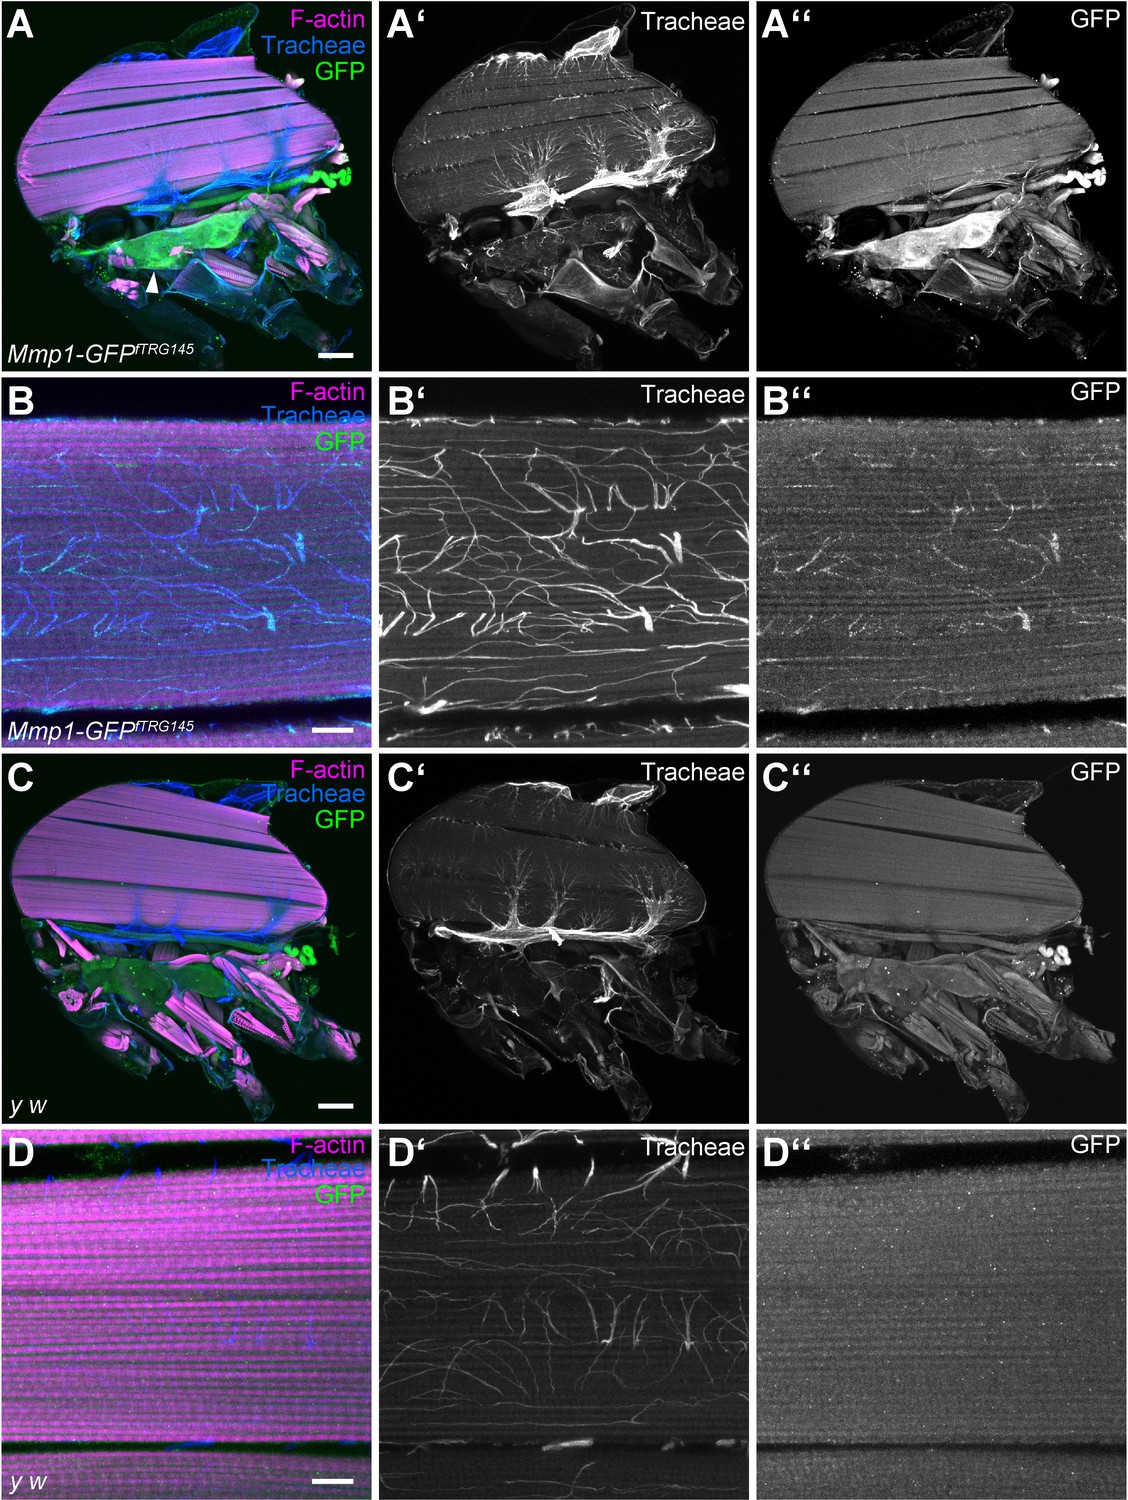
MMP1-GFP is distributed along tracheal branches in IFM myotubes.
(A–D) Sagittal sections of adult thoraxes of MMP1-GFPfTRG145 flies (A,B) and of control y w flies (C,D) stained for F-actin (magenta) and GFP (green). Autofluorescence of tracheae is shown in blue. (B,D) show close-ups of single myotubes with tracheal branches inside the myotube. Note that MMP1-GFP staining is visible on the IFM-associated tracheal air sac epithelium (arrowhead in (A)) and along tracheal branches inside IFM myotubes. y w flies (C,D) were used to control for specificity of the anti-GFP immunostaining. Scale bars: 100 μm (A–A’’, C–C’’) and 10 μm (B–B’’, D–D’’).
Figure 5 with 1 supplement
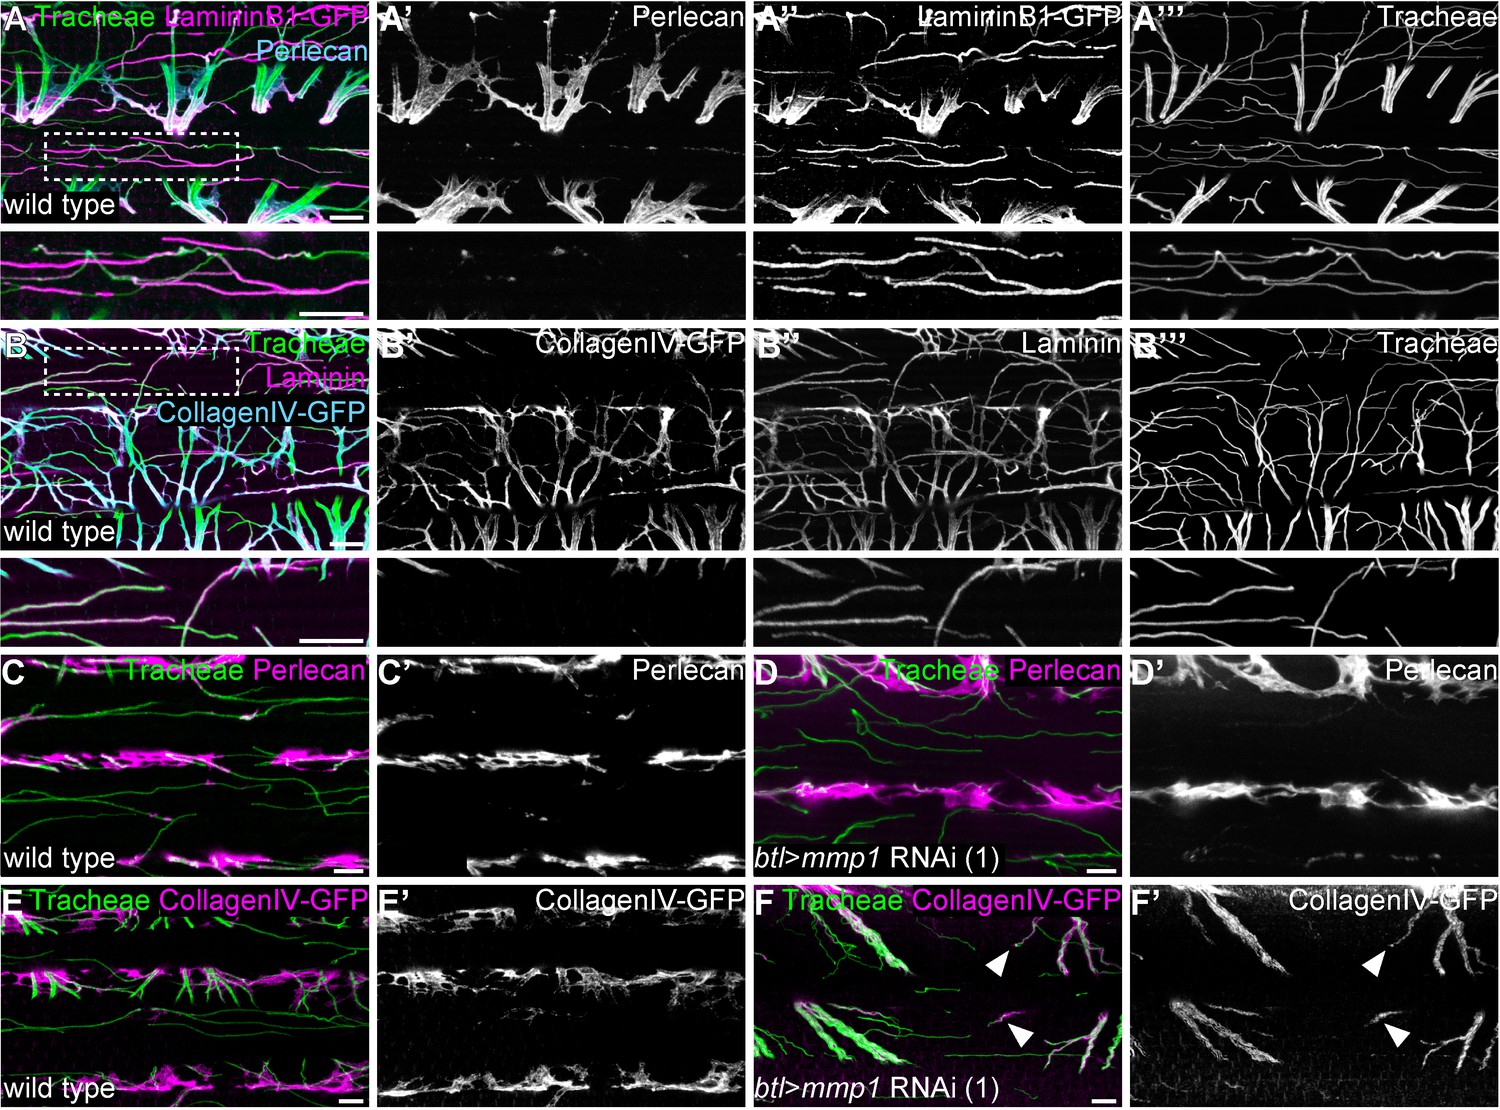
Tracheal stalk and tip regions show distinct basement membrane compositions.
(A,B) Distribution of the ECM components Perlecan (A,A’), CollagenIV-GFP (B,B’) and Laminin or LamininB1-GFP (A,A’’,B,B’’) around tracheal branches inside an adult IFM myotube. Note that Laminin extends along the entire length of tracheal branches, whereas Perlecan and Collagen IV are excluded from branch tips inside myofibril bundles. Bottom panels show close-up view of the regions marked by dashed boxes. (C–F) Distribution of Perlecan (C–D’) and CollagenIV-GFP (E–F’) around tracheal branches in wild-type control (C,C’,E,E’) and Mmp1 tracheal knock-down (D,D’,F,F’) adult myotubes. Note that Perlecan distribution is not affected by Mmp1 knock-down, whereas CollagenIV-GFP extends into the tip region of some branches in Mmp1 knock-down, but not in control animals (F,F’ arrowheads). Mmp1 was depleted using Mmp1 RNAi (1). Scale bars: 7 μm (A–B’’’), 5 μm (C–F’).
Figure 5—figure supplement 1
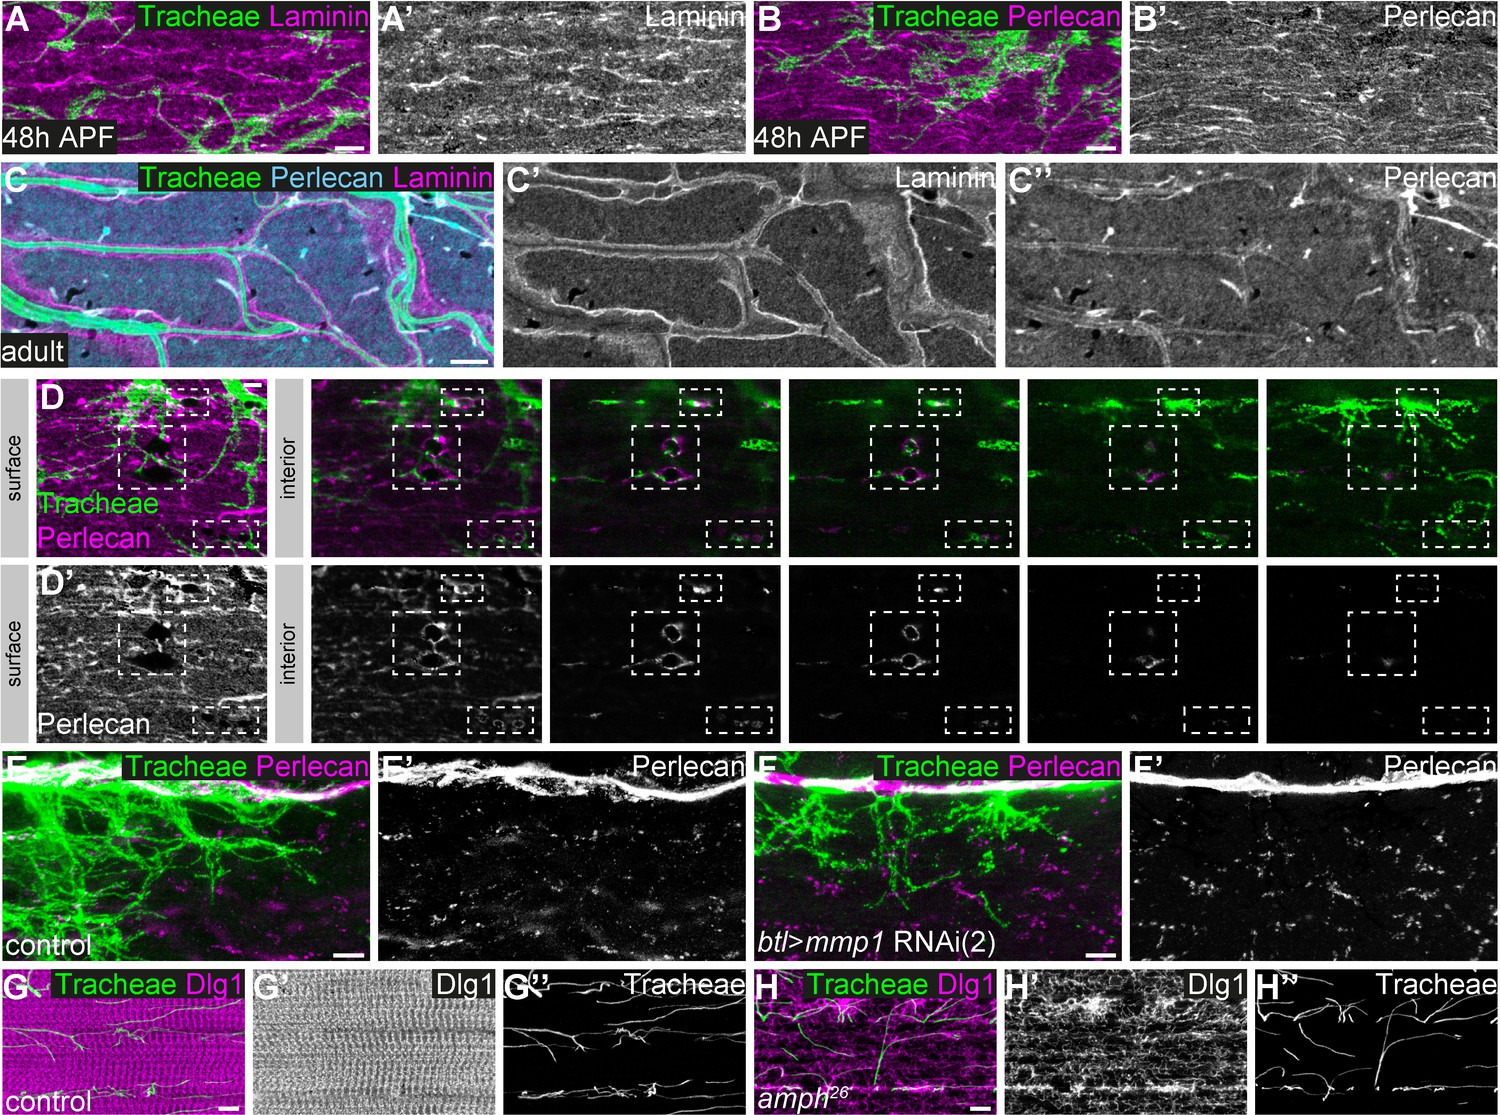
Basement membrane around tracheal branches increases during IFM development.
(A,B) Localization of Laminin (magenta in A) and Perlecan (magenta in B) on the surface of developing IFMs 48 hr APF. Tracheal cells express palmitoylated mKate2 (green) under the control of btl-Gal4. Note that at 48 hr APF Laminin and Perlecan are mainly found on the myotube surface and not around invading tracheal branches. (C) In adult IFMs Laminin (magenta) and Perlecan (cyan) are found on the muscle surface and in basement membrane surrounding the tracheal branches (tracheal lumen visualized by autofluorescence; green). (D) Sequence of consecutive z-planes of a single myotube (48 hr APF) from surface to interior. Perlecan (magenta) lines muscle membrane invaginations, which are being entered by tracheal branches marked by palmitoylated mKate2 (green). (E,F) Distribution of Perlecan around tracheal branches starting to invade IFMs 48 hr APF in control (E) and tracheal Mmp1 knock-down pupa (F). Note that the distribution of Perlecan around invading branches is not notably changed upon tracheal Mmp1 knock-down. (G,H) Tracheal branching inside an adult myotube in control (G) and amph26 mutant (H). The T-tubule system is labeled by Dlg1 staining (magenta). Tracheal branches are visualized by their autofluorescence. Note that despite the severely disorganized T-tubule system in the amph26 mutant (H’; Razzaq et al., 2001), tracheae have entered the myotube and show a normal branching pattern similar to controls (compare H’’ to G’’). Scale bars: 5 μm (A–C’’, E–H’’) and 3 μm (D,D’).
Author response image 1

Immunoblot of cellular protein extracts of S2 cells transfected as indicated on top.
https://doi.org/10.7554/eLife.48857.027Videos
Video 1
Organization of tracheal branch invasion into a single IFM syncytium.
3D animation of z-stack of a single DLM stained for F-actin (magenta). Immunostaining against LaminDm0 (cyan) labels all nuclei, DSRF (yellow) labels tracheal terminal cell nuclei. Tracheal branches (green) were visualized by their autofluorescence.
Video 2
Mitochondria can enwrap IFM tracheoles.
3D animation of an IFM tracheal branch surrounded by multiple mitochondria. Mitochondria were labeled by immunostaining against ATP5A (magenta). The tracheal branch (green) was visualized by its autofluorescence.
Video 3
Dorsal view of tracheal invasion into DLMs in control and tracheal-specific Mmp1 knock-down animals.
Time-lapse movies of tracheal invasion into DLMs in pupae 48 h APF. Tracheal cells are labeled by palmitoylated mKate2, IFMs are labeled by Myofilin-GFP. Dorsal views of a wild-type control pupa (top) and a tracheal Mmp1 knock-down pupa (bottom) are shown. The movies were acquired with a 40x objective and a frame rate of 10 min in resonant scanning mode (Leica SP8) over 14 h. Z-stacks of ~100 μm (0.35 μm step size) were acquired.
Video 4
Lateral view of tracheal invasion into DVMs in control and tracheal-specific Mmp1 knock-down animals.
Time-lapse movies of tracheal invasion into DVMs in pupae 48 h APF. Tracheal cells are labeled by palmitoylated mKate2, IFMs are labeled by Myofilin-GFP. Lateral views of a wild-type control pupa (top) and a tracheal Mmp1 knock-down pupa (bottom) are shown. The movies were acquired with a 40x objective and a frame rate of 10 min in resonant scanning mode (Leica SP8) over 14 h. Z-stacks of ~100 μm (0.35 μm step size) were acquired.
Video 5
Close-up of invading tracheal branch tips in control and tracheal-specific Mmp1 knock-down animals.
Close-up movies of tracheal invasion into DVMs in pupae 53 h APF. Tracheal cells are labeled by palmitoylated mKate2. A wild-type control (left) and a tracheal Mmp1 knock-down pupa (right) are shown. Arrowheads point at growth cone-like structures. The movies were acquired with a 40x objective and a frame rate of 10 min in resonant scanning mode (Leica SP8). Z-stacks of ~100 μm (0.35 μm step size) were acquired.
Video 6
Distribution of ECM around single adult DLM with tracheae.
3D animation of ECM around a single adult DLM with tracheae. ECM components Laminin (magenta) and Perlecan (cyan) were visualized by immunostaining. Tracheal branches (green) were visualized by their autofluorescence. Note that tracheae enter the myotube through ECM-lined invaginations of the muscle surface.
Tables
Key resources table
| Reagent type (species) or resource | Designation | Source or reference | Identifiers | Additional information |
|---|---|---|---|---|
| Genetic reagent (Drosophila melanogaster) | mef2-Gal4 | Ranganayakulu et al., 1995 Dev Biol, 171(1), 169–181 | ||
| Genetic reagent (Drosophila melanogaster) | btl-Gal4 | Shiga et al., 1996 Development, Growth and Differentation, 38(1), 99–106 | ||
| Genetic reagent (Drosophila melanogaster) | UAS-palmKate2-K7 | Caviglia et al., 2016 Nat Cell Biol 18: 727–739 | ||
| Genetic reagent (Drosophila melanogaster) | UAS-palm-mNeonGreen | Sauerwald et al., 2017Development 144: 657–663 | ||
| Genetic reagent (Drosophila melanogaster) | UAS-FRTFRT>STOP>FRT-myr::smGFP-HA_V5_FLAG | Nern et al., 2015 PNAS 112: E2967–76 | ||
| Genetic reagent (Drosophila melanogaster) | y1 v1;; UAS-Mmp1_RNAi_(1) | Bloomington Stock Center | BDSC: 31489 | |
| Genetic reagent (Drosophila melanogaster) | UAS-Mmp1_RNAi_(2) | Uhlirova and Bohmann, 2006 EMBO J 25(22): 5294–5304 | ||
| Genetic reagent (Drosophila melanogaster) | ;; FlyFos066598_ DpseMmp1_GA18484 (attP-9A/VK13) | this study | Mmp1 ortholog GA18484 fromDrosophila pseudoobscura in genomic FlyFos vector inserted into VK13 attPlanding site (76A2).See “Drosophila strains and genetics “in theMaterials andmethods section. | |
| Genetic reagent (Drosophila melanogaster) | FRTG13 mmp1Q273/CyO, Dfd-GMR-YFP | this study | See “Genetic labeling of tracheal cell clones“in the Materials and methods section | |
| Genetic reagent (Drosophila melanogaster) | FRTG13 mmp1Q112/CyO, Dfd-GMR-YFP | this study | See “Genetic labelingof tracheal cell clones “in the Materialsand methods section | |
| Genetic reagent (Drosophila melanogaster) | FRTG13 mmp12/CyO, Dfd-GMR-YFP | this study | See “Genetic labeling of tracheal cell clones “in the Materialsand methods section | |
| Genetic reagent (Drosophila melanogaster) | LanB1-GFP | Vienna Drosophila Resource Center; Sarov et al., 2016 | VDRC: fTRG681 | |
| Genetic reagent (Drosophila melanogaster) | Mmp1-GFP | Vienna Drosophila Resource Center; Sarov et al., 2016 | VDRC: fTRG145 | |
| Genetic reagent (Drosophila melanogaster) | Myofilin-GFP | Vienna Drosophila Resource Center; Sarov et al., 2016 | VDRC: fTRG501 | |
| Genetic reagent (Drosophila melanogaster) | Vkg-GFP | Buszczak et al., 2007 Genetics 175: 1505–1531 | ||
| Genetic reagent (Drosophila melanogaster) | UAS-TIMP | Bloomington Stock Center | BDSC: 58708 | |
| Genetic reagent (Drosophila melanogaster) | amph26 | Bloomington Stock Center | BDSC: 6498 | |
| Antibody | Rabbit polyclonal anti-Bnl | Jarecki et al., 1999 Cell, 99(2): 211–220 | 1:250 | |
| Antibody | Mouse monoclonal anti-Mmp1 | Developmental Studies Hybridoma Bank | Mix of mouse monoclonal antibodies 3B8D12, 3A6B4, 5H7B11 | 1:10/1:100/1:100 |
| Antibody | Mouse monoclonal anti-Dlg1 | Developmental Studies Hybridoma Bank | 4F3 | 1:200 |
| Antibody | Mouse monoclonal anti-DSRF | Samakovlis et al., 1996 Development 122(5): 1395–1407 | mAb 2–161 | 1:100 |
| Antibody | Mouse monoclonal anti-ATP5A | Abcam | ab14748 | 1:100 |
| Antibody | Chicken polyclonal anti-GFP | Abcam | ab13970 | 1:500 |
| Antibody | Chicken polyclonal anti-HA | Abcam | ab9111 | 1:200 |
| Antibody | Mouse monoclonal anti-FLAG (M2) | Sigma | M2; Sigma-F1804 | 1:1000 |
| Antibody | Guinea pig polyclonal anti-LaminDm0 | gift from Georg Krohne, University of Würzburg | 1:1000 | |
| Antibody | Rabbit polyclonal anti-Laminin | Schneider et al., 2006 Development 133(19):3805–3815 | 1:1500 | |
| Chemical compound, drug | Phalloidin-TRITC | Sigma | 1:1000 | |
| Recombinant DNA reagent | fosmid clone FlyFos066598 | Ejsmont et al., 2009 Nat Methods 6 (6): 435–437 | FlyFos066598 | fosmid clone FlyFos066598 containing the Drosophila pseudoobscura Mmp1 homologue GA18484 |
Additional files
-
Supplementary file 1
Quantitative analysis of IFM tracheal terminal cell morphology.
Volume, sum of branch length, and total number of branch points and terminal points were extracted from 31 individually marked (MARCM clones) segmented terminal tracheal cells in wild-type pupae (75 hr APF).
- https://doi.org/10.7554/eLife.48857.022
-
Supplementary file 2
RNAi screen to identify genes required for IFM tracheal invasion.
Columns include gene identifiers and gene names of selected candidate genes, details about the RNAi lines used to knock down candidate genes, and the results of the screen for genes required for flight ability and tracheal invasion into myotubes.
- https://doi.org/10.7554/eLife.48857.023
-
Supplementary file 3
Statistics Reporting Table.
- https://doi.org/10.7554/eLife.48857.024
-
Transparent reporting form
- https://doi.org/10.7554/eLife.48857.025
Download links
A two-part list of links to download the article, or parts of the article, in various formats.
Downloads (link to download the article as PDF)
Open citations (links to open the citations from this article in various online reference manager services)
Cite this article (links to download the citations from this article in formats compatible with various reference manager tools)
Matrix metalloproteinase 1 modulates invasive behavior of tracheal branches during entry into Drosophila flight muscles
eLife 8:e48857.
https://doi.org/10.7554/eLife.48857


