Two new polymorphic structures of human full-length alpha-synuclein fibrils solved by cryo-electron microscopy
- University of Basel, Switzerland
- University of Copenhagen, Denmark
- Institut de Biologie Intégrative de la Cellule (I2BC), CEA, CNRS, Université Paris Sud, Université Paris-Saclay, France
- Institut Fancois Jacob (MIRCen), CEA and Laboratory of Neurodegenerative Diseases, CNRS, France
- ETH Zurich, Switzerland
- Roche Innovation Center Basel, Switzerland
- Institut Galien Paris-Sud, CNRS, Université Paris-Sud, Université Paris-Saclay, France
- Labex Ecofect, UMR 5086 CNRS, Université de Lyon, France
Figures
Figure 1 with 3 supplements
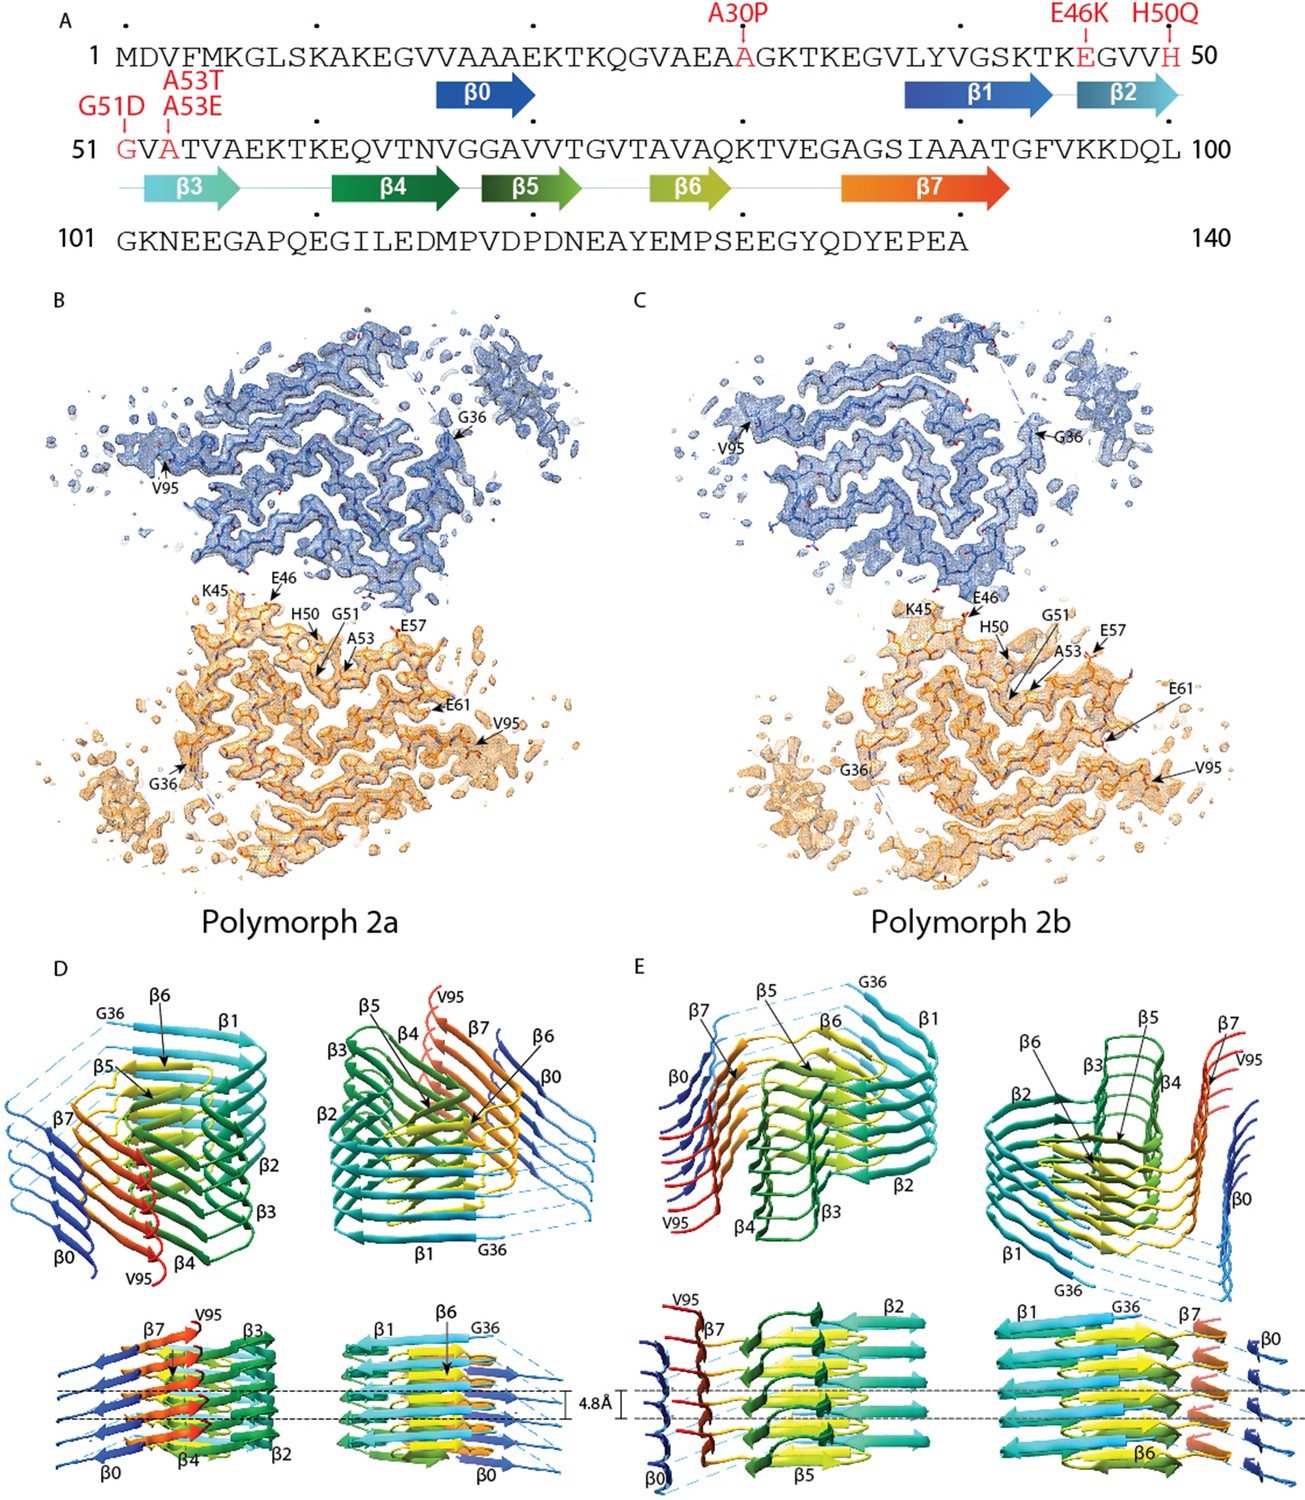
Cross-sections of the α-Syn polymorph 2a and 2b cryo-EM structures.
(A) Sequence of human α-Syn with familial PD mutation sites indicated in red. ß strands are indicated by arrows colored from blue to orange. Cryo-EM densities and atomic models of polymorph 2a (B) and polymorph 2b (C) of α-Syn. Each cryo-EM map shows two protofilaments (blue and orange) forming a fibril. PD-associated mutations sites, and first and last residues of the NAC regions are indicated. (D and E) Rainbow rendering views of the secondary structure elements in five successive rungs of both polymorphs. A view perpendicular to the helical axis is shown to illustrate the height differences in a single α-Syn fibril. Colors correspond to the arrows in the sequence displayed in panel (A).
Figure 1—figure supplement 1
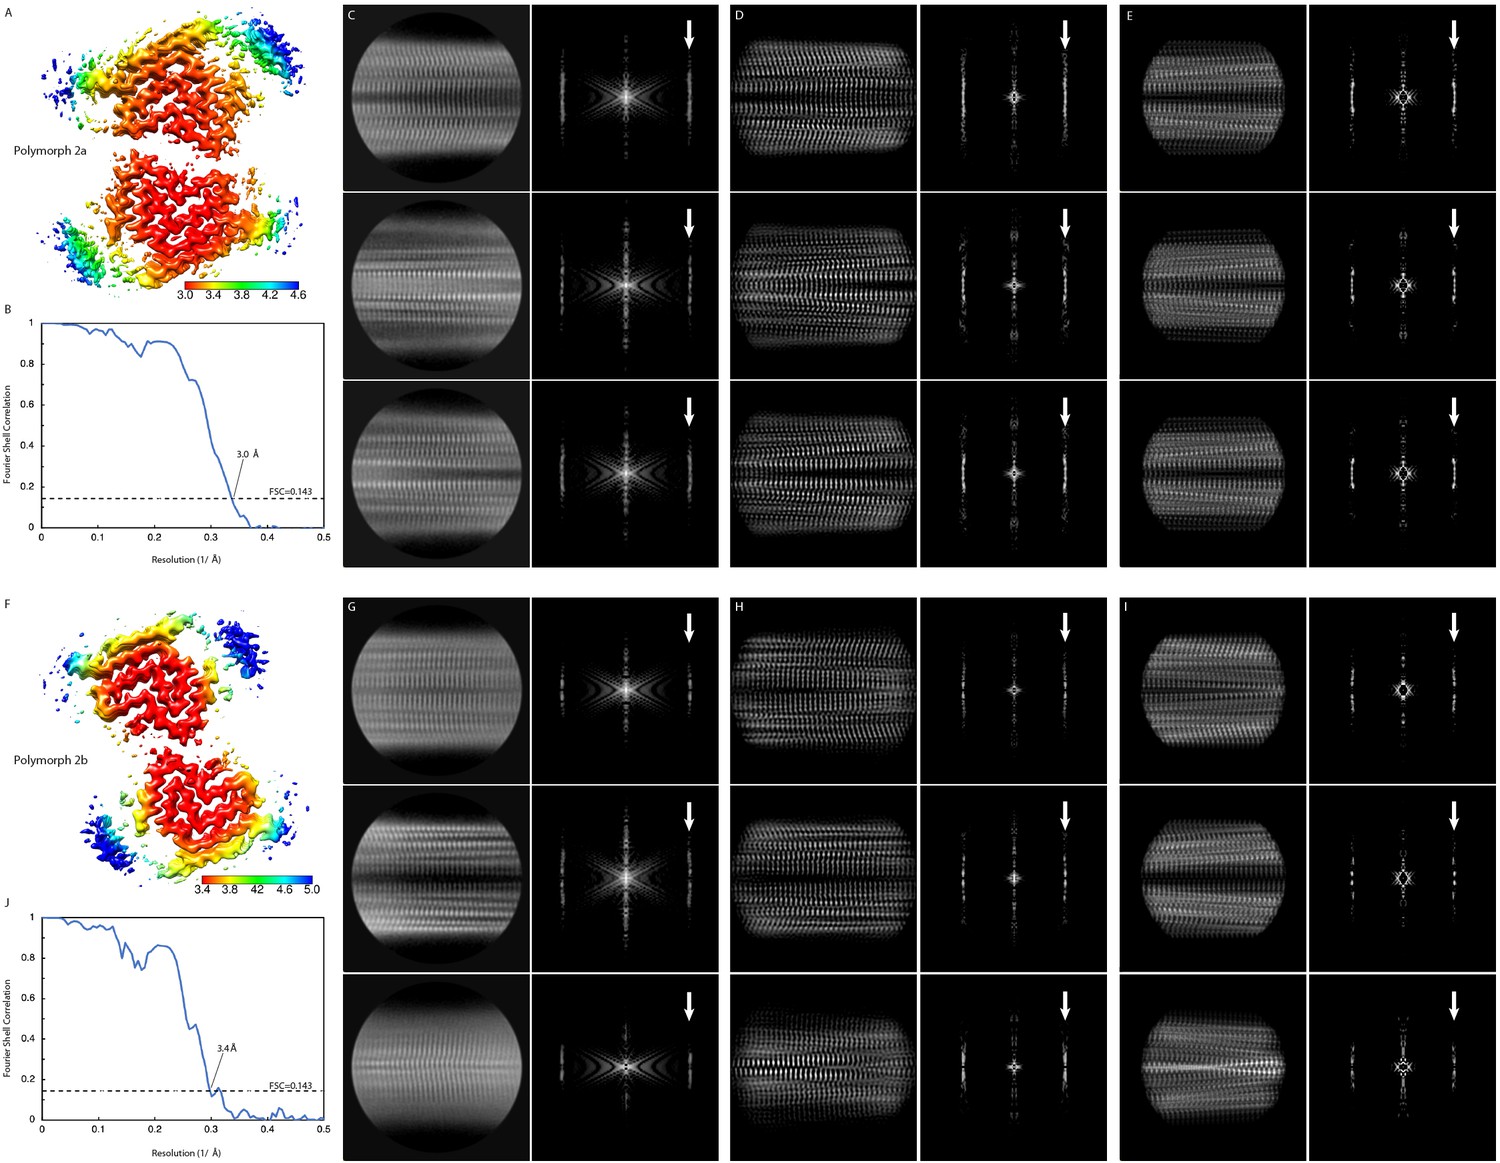
Local resolution estimation and FSC curves.
Cryo EM maps with local resolution estimations for α-Syn polymorph 2a (A) and α-Syn polymorph 2b (F). The color scales indicate the resolution values within each map. (B) and (J) Fourier shell correlation curves between two independently refined half-maps. Overall resolutions are indicated. (C and G) Reference-free 2D class averages with their power spectra. (D) and (H) 2D projections of the cryo-EM maps with their power spectra. (E and I) 2D projection of the atomic models with their power spectra. White arrows in spectrum panels indicate the layer line at 1/4.8 Å with either a meridional n = 0 Bessel function peak (α-Syn polymorph 2a, panels (C) (D) and (E)), or off-meridional n = 1 Bessel function peak intensities (α-Syn polymorph 2b, panels (G) (H) and (I)).
Figure 1—figure supplement 2
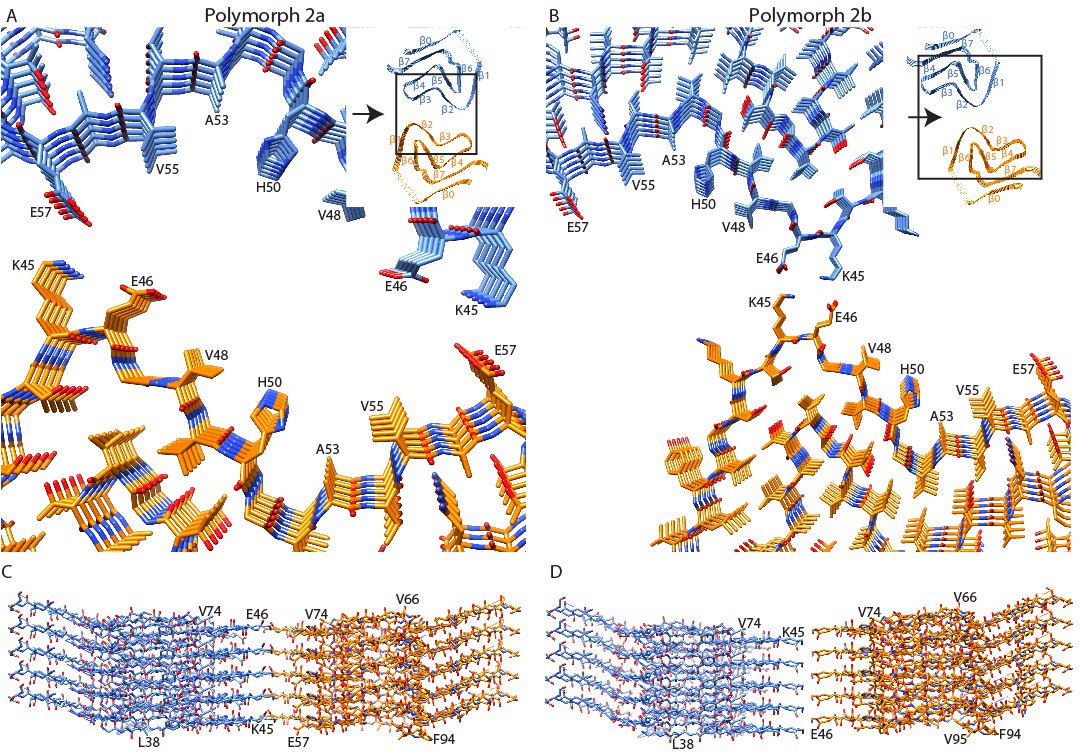
Interface regions between two protofilaments of the α-Syn polymorph 2a and 2b.
(A and B) Views along the axis of the α-Syn polymorph 2a and 2b fibrils, respectively. The area shown is highlighted with squares in the ribbon diagrams (inserts). (C and D) Side views of the fibrils showing the side-by-side alignment of α-Syn molecules in polymorph 2a (C), compared to the staggered packing of α-Syn molecules in polymorph 2b (D). Viewing directions in (C) and (D) are indicated by arrows in the ribbon diagrams.
Figure 1—figure supplement 3
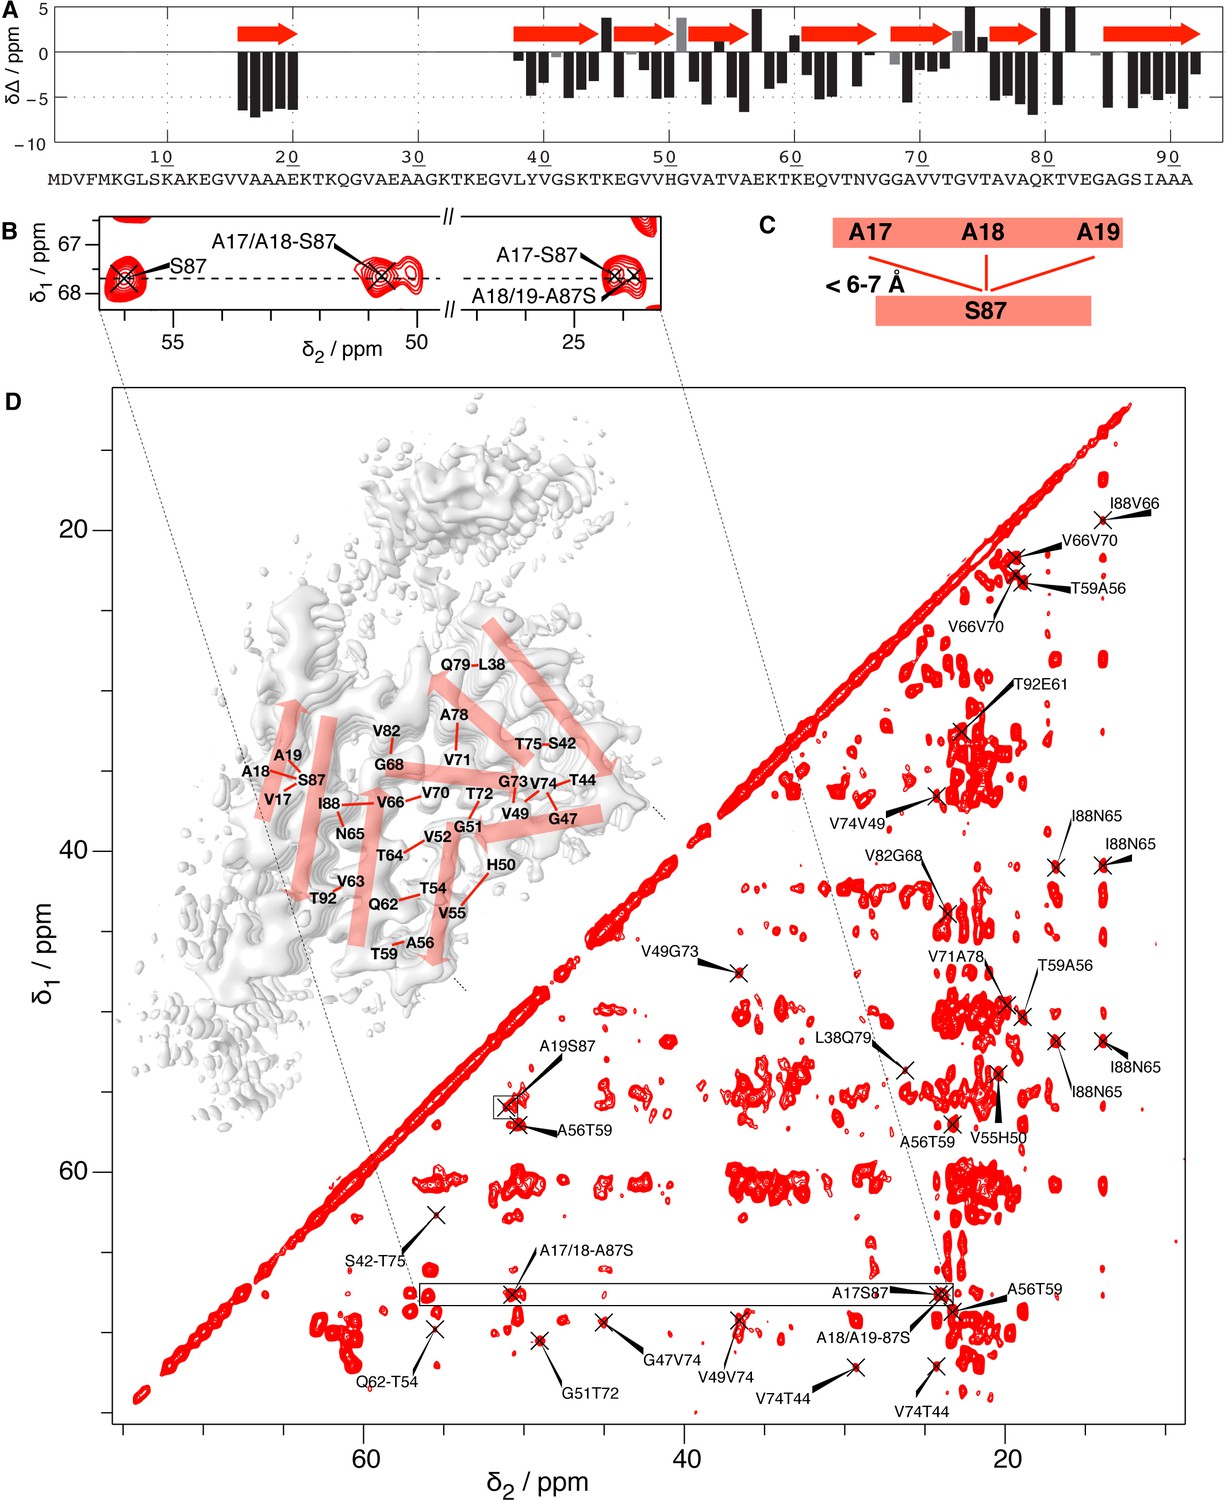
NMR identification of the residues forming the N-terminal beta strand.
(A) NMR secondary chemical shift plot according to reference (Gath et al., 2014b). β-strands are revealed when three or more residues in a row show a negative difference of the secondary shifts Δδ (the difference between the chemical-shift deviations of the observed Cα and Cβ shifts from the random coil shift). This information is plotted on the cryo-EM structure in red. (B) Extract of a 2D 13C-13C PAR spectrum (full aliphatic region shown in (D) of the cross peaks assigned to S87-A17, A18, A19 interactions, for which all assignment possibilities within 0.15 ppm are indicated. (C) Structural restraints resulting from the cross signals in (B), and from the A19S87 peak highlighted by a box in (D), where the full 2D 13C-13C PAR NMR spectrum is shown with assigned peaks corresponding to at least i, i ± 3 contacts (non-trivial structural restraints). Most of these peaks are ambiguous, that is, they have several assignment possibilities within 0.15 ppm, which were lifted here by comparison with the cryo-EM structures. This illustrates that the PAR spectrum indeed contains numerous structurally meaningful inter-β-strand restraints that confirm the interpretation of the electron densities, even if the assignment ambiguities did not allow for an NMR 3D structure determination.
Figure 2
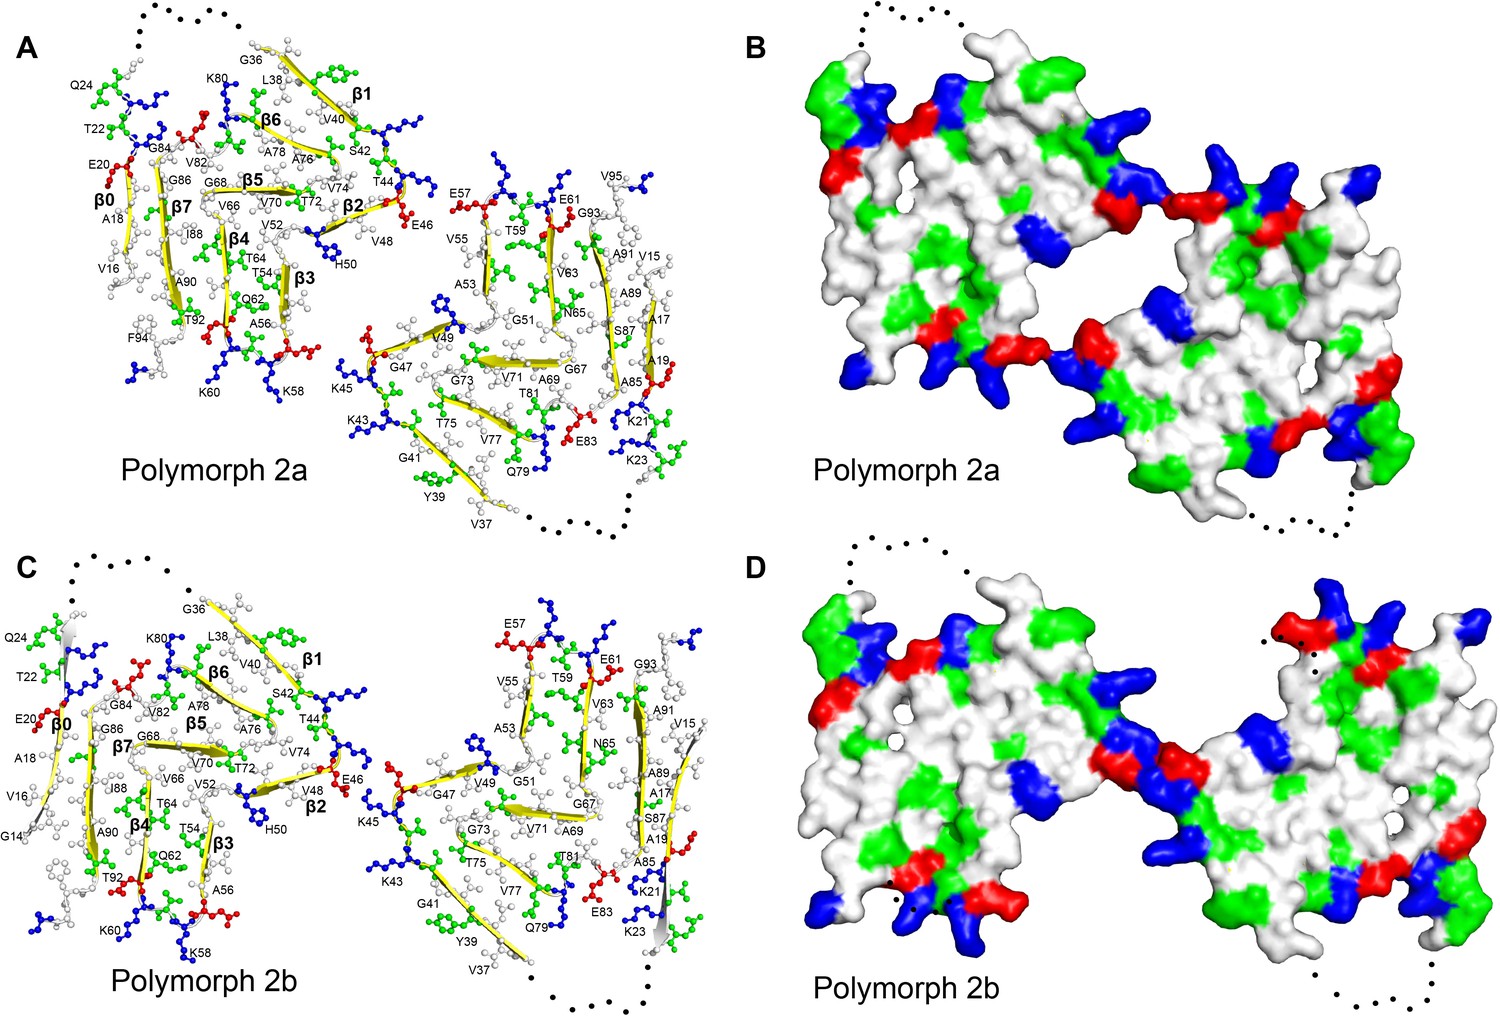
Structure and distribution of amino acids in the new α-Syn fibril polymorphs.
Amino acids are colored in blue for positively charged, in red for negatively charged, in green for polar (including glycine), and in white for hydrophobic residues. Even and odd numberings are given on one monomer each. (A and C) Backbone structure. (B) and (D) Surface view.
Figure 3

Cryo-EM cross-sections of fibrils, formed by E46K, p-S129 phosphorylated, and N-terminally acetylated α-Syn protein.
Fibrils formed by E46K mutant α-Syn protein (A), Ser129 phosphorylated α-Syn protein (B), and N-terminally acetylated α-Syn protein (C) were analyzed by cryo-EM. Image processing did not allow reaching sufficient resolution for model building, but the cross-sections of the obtained 3D reconstructions are compatible with polymorph 2a for all three forms.
Figure 4 with 1 supplement
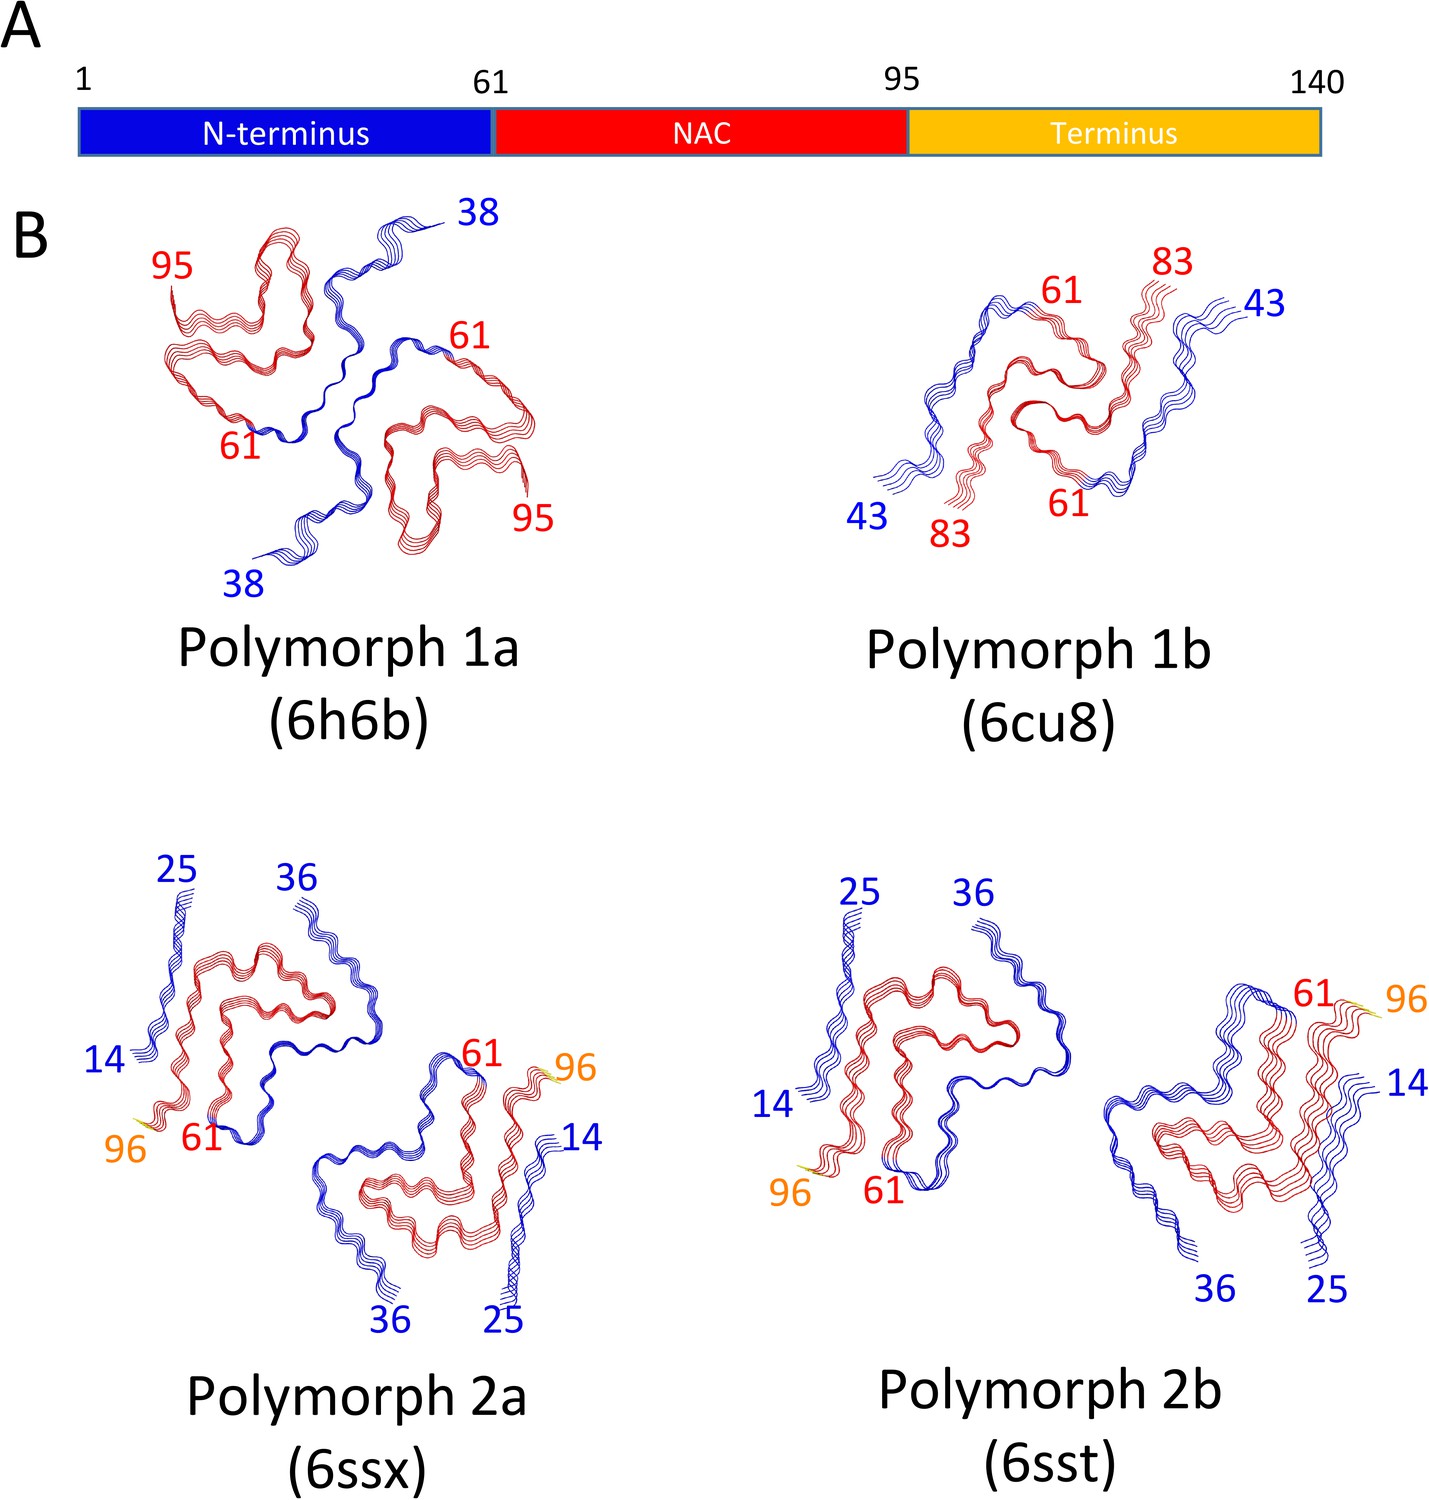
Schematic representation of α-Syn polymorphs.
(A) Diagram representing α-Syn regions with the N-terminus in blue, the NAC region in red and the C-terminus in yellow. (B) Representation of α-Syn fibril polymorphs 1a (PDB ID 6h6b; Guerrero-Ferreira et al., 2018), 1b (PDB ID 6cu8; Li et al., 2018a), 2a (PDB ID 6rt0, this work), and 2b (PDB ID 6rtb, this work), highlighting the striking differences in protofilament folding in α-Syn polymorphs 1a and 1b, compared to α-Syn polymorphs 2a and 2b. The atomic models obtained by cryo-EM of α-Syn polymorph 1a, polymorph 1b (Li et al., 2018a; Li et al., 2018b) and α-Syn polymorphs 2a and 2b (this work). Protein Data Bank (PDB) accession numbers are indicated.
Figure 4—figure supplement 1
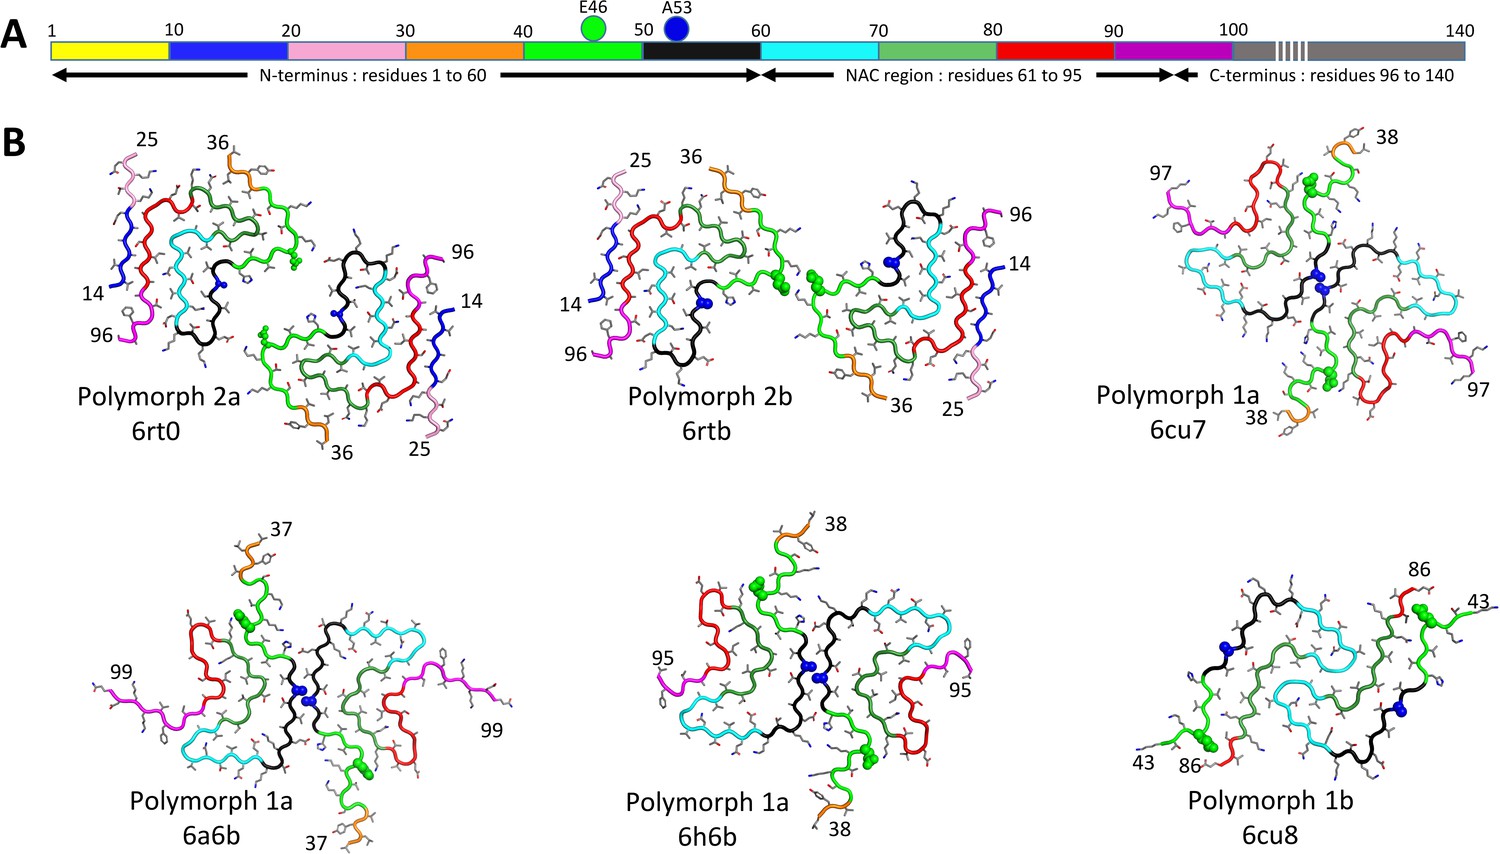
Comparison between polymorphs 1 and 2.
Structures of polymorphs 1a, b and 2a, b with backbone shown in alternating colors in order to distinguish the location of the segments in the different structures. (A) Diagram representing α-Syn color coding from N-terminus to C-terminus: 1–10, yellow; 11–20, blue; 21–30, pink; 31–40, orange; 41–50 green; 51–60, black; 61–70, cyan; 71–80, light green; 81–90, red; 91–100 magenta; 101–140, gray. (B) Worm representation of α-Syn fibril polymorphs 1a, 1b, 2a and 2b. N-terminal and C-terminal residues number are indicated. Residues E53 and A53 are shown by van-der-Waals representation of the residues in green and blue respectively. Other residues are given in stick representation. Polymorph type, and PDB accession codes are indicated.
Videos
Video 1
Comparison of cryo-EM maps of α-Syn fibril polymorphs.
Cryo-EM reconstructions of α-Syn fibrils at 3.0 Å (polymorph 2a) and 3.4 Å (polymorph 2b) resolution detailing the interaction between two protofilaments (blue and orange) in each fibril, the 4.8 Å spacing between ß-strands and the topology of α-Syn monomers within a single protofilament.
Video 2
Structural differences between α-Syn polymorphs.
Atomic models of α-Syn fibrils represented as rounded ribbons with the N-terminus in blue and the NAC region in red.
Tables
Table 1
Growth conditions for α-Syn fibrils.
| Study | Buffer composition | pH | Temp–erature | Time | Concen–tration | Method | α-Syn type | Poly–morph | PDB |
|---|---|---|---|---|---|---|---|---|---|
| This study | 50 mM Tris-HCl 150 mM KCl | 7.5 | 37°C | 1 week (600 r.p.m.) | 700 µM | Cryo-EM + NMR | Full-length (‘named fibrils’) | 2a, 2b | 6ssx 6sst |
| (Guerrero-Ferreira et al., 2018) | DPBS (Gibco) 2.66 mM KCl, 1.47 mM KH2PO4, 137.93 mM NaCl, 8.06 mM Na2HPO4 | 7 to 7.3 | 37°C | 5 days (1000 r.p.m.) | 360 µM (5 mg/mL) | Cryo-EM | Truncated (1-121) | 1a | 6h6b |
| (Li et al., 2018a) | 50 mM Tris, 150 mM KCl, 0.05% NaN3 | 7.5 | 37°C | 3 days (900 r.p.m.) | 500 µM | Cryo-EM | Full-length, N-terminal acetylated | 1a | 6a6b |
| (Li et al., 2018b) | 15 mM tetrabutyl–phosphonium bromide | Not speci–fied | Room tempe–rature | 14–30 days (quiescent) | 300 µM | Cryo-EM | Full-length | 1a,b | 6cu7 6cu8 |
| (Tuttle et al., 2016) | 50 mM sodium phosphate 0.12 mM EDTA 0.02% sodium azide (w/v) | 7.4 | 37°C | 3 weeks (200 r.p.m.) | 1000 µM (15 mg/mL) | NMR | Full-length | 1a | 2n0a |
| (Rodriguez et al., 2015) | 5 mM lithium hydroxide 20 mM sodium phosphate 0.1 M NaCl | 7.5 | 37°C | 72 hr | 500 µM | Micro-ED | Peptides: SubNACore, NACore, PreNAC | 4rik 4ril 4znn | |
| (Rodriguez et al., 2015) | 50 mM Tris 150 mM KCl | 7.5 | 37°C | 72 hr | 500 µM | No structure | Full-length | ||
| (Gath et al., 2014a) | 50 mM Tris-HCl 150 mM KCl | 7.5 | 37°C | 4 days (600 r.p.m.) | 300 µM | NMR secondary structure | Full-length | 2 | |
| (Gath et al., 2012) | 5 mM Tris-HCl | 7.5 | 37°C | 7 days (600 r.p.m.) | 300 µM | NMR secondary structure | Full-length | Different from 1, 2 | |
| (Verasdonck et al., 2016) | 5 mM NaPO4 | 9 | 37°C | 4 days (600 r.p.m.) | 300 µM | NMR secondary structure | Full-length | 1 | |
| This study | DPBS (Gibco): 2.66 mM KCl, 1.47 mM KH2PO4, 137.93 mM NaCl, 8.06 mM Na2HPO4 | 7 to 7.3 | 37°C | 5 days (1000 r.p.m.) | 360 µM (5 mg/mL) | Cryo-EM | Full-length, E46K | 2a | |
| This study | DPBS (Gibco): 2.66 mM KCl, 1.47 mM KH2PO4, 137.93 mM NaCl, 8.06 mM Na2HPO4 | 7 to 7.3 | 37°C | 5 days (1000 r.p.m.) | 360 µM (5 mg/mL) | Cryo-EM | Full-length, N-terminal acetylated | 2a | |
| This study | DPBS (Gibco): 2.66 mM KCl, 1.47 mM KH2PO4, 137.93 mM NaCl, 8.06 mM Na2HPO4 | 7 to 7.3 | 37°C | 5 days (1000 r.p.m.) | 360 µM (5 mg/mL) | Cryo-EM | Full-length, Phosphorylation at position S129 | 2a |
Table 2
Cryo-EM structure determination statistics.
| E46K mutant | Phosphorylated | N-terminal acetylated | α-Syn polymorph 2a | α-Syn polymorph 2b | |
|---|---|---|---|---|---|
| Data Collection | |||||
| Pixel size [Å] | 0.831 | 0.831 | 0.831 | 0.629 | 0.629 |
| Defocus Range [µm] | −0.8 to −2.5 | −0.8 to −2.5 | −0.8 to −2.5 | −0.8 to −2.5 | −0.8 to −2.5 |
| Voltage [kV] | 300 | 300 | 300 | 300 | 300 |
| Exposure time [s per frame] | 0.2 | 0.2 | 0.2 | 0.2 | 0.2 |
| Number of frames | 50 | 50 | 50 | 50 | 50 |
| Total dose [e-/Å2] | 69 | 69 | 69 | 69 | 69 |
| Reconstruction | |||||
| Box width [pixels] | 280 | 280 | 280 | 280 | 280 |
| Inter-box distance [pixels] | 28 | 28 | 28 | 28 | 28 |
| Micrographs | 843 | 1’887 | 948 | 1’143 | 1’143 |
| Manually picked fibrils | 2’702 | 5’095 | 3’751 | 5’233 | 5’233 |
| Initially extracted segments | 65’893 | 107’144 | 43’276 | 100’323 | 100’323 |
| Segments after 2D classification | 50’514 | 107’126 | 35342 | 100’193 | 100’193 |
| Segments after 3D classification | 50’514 | 21’685 | 35342 | 19’937 | 3’989 |
| Resolution after 3D refinement [Å] | 4.65 | 4.65 | 4.75 | 3.34 | 3.75 |
| Final resolution [Å] | 4.56 | 4.31 | 4.39 | 2.99 | 3.39 |
| Estimated map sharpening B-factor [Å2] | −208.6 | −104.3 | −178.1 | −67.1 | −76.4 |
| Helical rise [Å] | 4.85 | 4.84 | 4.78 | 4.80 | 2.40 |
| Helical twist [°] | −0.79 | −0.77 | −0.71 | −0.80 | 179.55 |
Table 3
Model building statistics.
| α-Syn polymorph 2a | α-Syn polymorph 2b | |
|---|---|---|
| Initial model used [PDB code] | 6ssx | 6sst |
| Model resolution [Å] (FSC = 0.143) | 2.98 | 3.4 |
| Model resolution range [Å] | 2.98 | 3.1 |
| Map sharpening B-factor [Å2] | −67.1 | −76.4 |
| Model composition Non-hydrogen atoms Protein residues Ligands | 4900 730 0 | 4900 730 0 |
| B-factors [Å2] (non-hydrogen atoms) Protein Ligand | 48.18 - | 70.32 - |
| R.m.s. deviations Bond lengths [Å] Bond angles [°] | 0.008 0.938 | 0.009 0.941 |
| Validation MolProbity score Clashscore Poor rotamers [%] | 2.43 6.14 4.26 | 2.11 5.73 2.13 |
| Ramachandran plot Favored [%] Allowed [%] Disallowed [%] | 87.39 12.61 0.00 | 89.86 10.14 0.00 |
Key resources table
| Reagent type (species) or resource | Designation | Source or reference | Identifiers | Additional information |
|---|---|---|---|---|
| Strain, strain background (E. coli) | BL21(DE3) | Stratagene | Agilent Technology #200131 | Expression performed in LB medium |
| Transfected construct (pET-3a) | pET3a | Novagen | https://www.addgene.org/vector-database/2637/ | Encoding full length human alpha synuclein asyn (UniProtKB - P37840) with a silent mutagenesis of codon 136 (TAC to TAT) |
| Transfected construct (pRT21) | pRT21 | (Masuda et al., 2006) | Full length human alpha synuclein asyn (UniProtKB - P37840) with a silent mutagenesis of codon 136 (TAC to TAT) | |
| Transfected construct (pNatB) | pNatB | (Johnson et al., 2010) | http://www.addgene.org/53613/ | Expression of the fission yeast NatB complex - chloramphenicol marker |
| Chemical compound, drug | DEAE sepharose fast flow | GE Healthcare, #17-0709-01 | ||
| Other | Copper/carbon grids | https://www.quantifoil.com/ | R 2/2 grids | |
| Software, algorithm | UCSF Chimera | (Pettersen et al., 2004) | https://www.cgl.ucsf.edu/chimera | RRID:SCR_004097 |
| Software, algorithm | SerialEM | (Mastronarde, 2005) | https://bio3d.colorado.edu/SerialEM/ | RRID:SCR_017293 |
| Software, algorithm | FOCUS | (Biyani et al., 2017) | http://focus-em.org | |
| Software, algorithm | MotionCor2 | (Zheng et al., 2017) | https://emcore.ucsf.edu/ucsf-motioncor2 | RRID:SCR_016499 |
| Software, algorithm | RELION 2, 3 | (Scheres, 2012; Zivanov et al., 2018) | http://www2.mrc-lmb.cam.ac.uk/relion | RRID:SCR_016274 |
| Software, algorithm | COOT | (Emsley and Cowtan, 2004) | https://www2.mrc-lmb.cam.ac.uk/personal/pemsley/coot/ | RRID:SCR_014222 |
| Software, algorithm | Molprobity | (Williams et al., 2018) | http://molprobity.biochem.duke.edu | RRID:SCR_014226 |
Additional files
Download links
A two-part list of links to download the article, or parts of the article, in various formats.
Downloads (link to download the article as PDF)
Open citations (links to open the citations from this article in various online reference manager services)
Cite this article (links to download the citations from this article in formats compatible with various reference manager tools)
Two new polymorphic structures of human full-length alpha-synuclein fibrils solved by cryo-electron microscopy
eLife 8:e48907.
https://doi.org/10.7554/eLife.48907


