A crystal structure of a collaborative RNA regulatory complex reveals mechanisms to refine target specificity
- National Institute of Environmental Health Sciences, National Institutes of Health, United States
- University of Texas at Dallas, United States
Figures
Figure 1 with 2 supplements
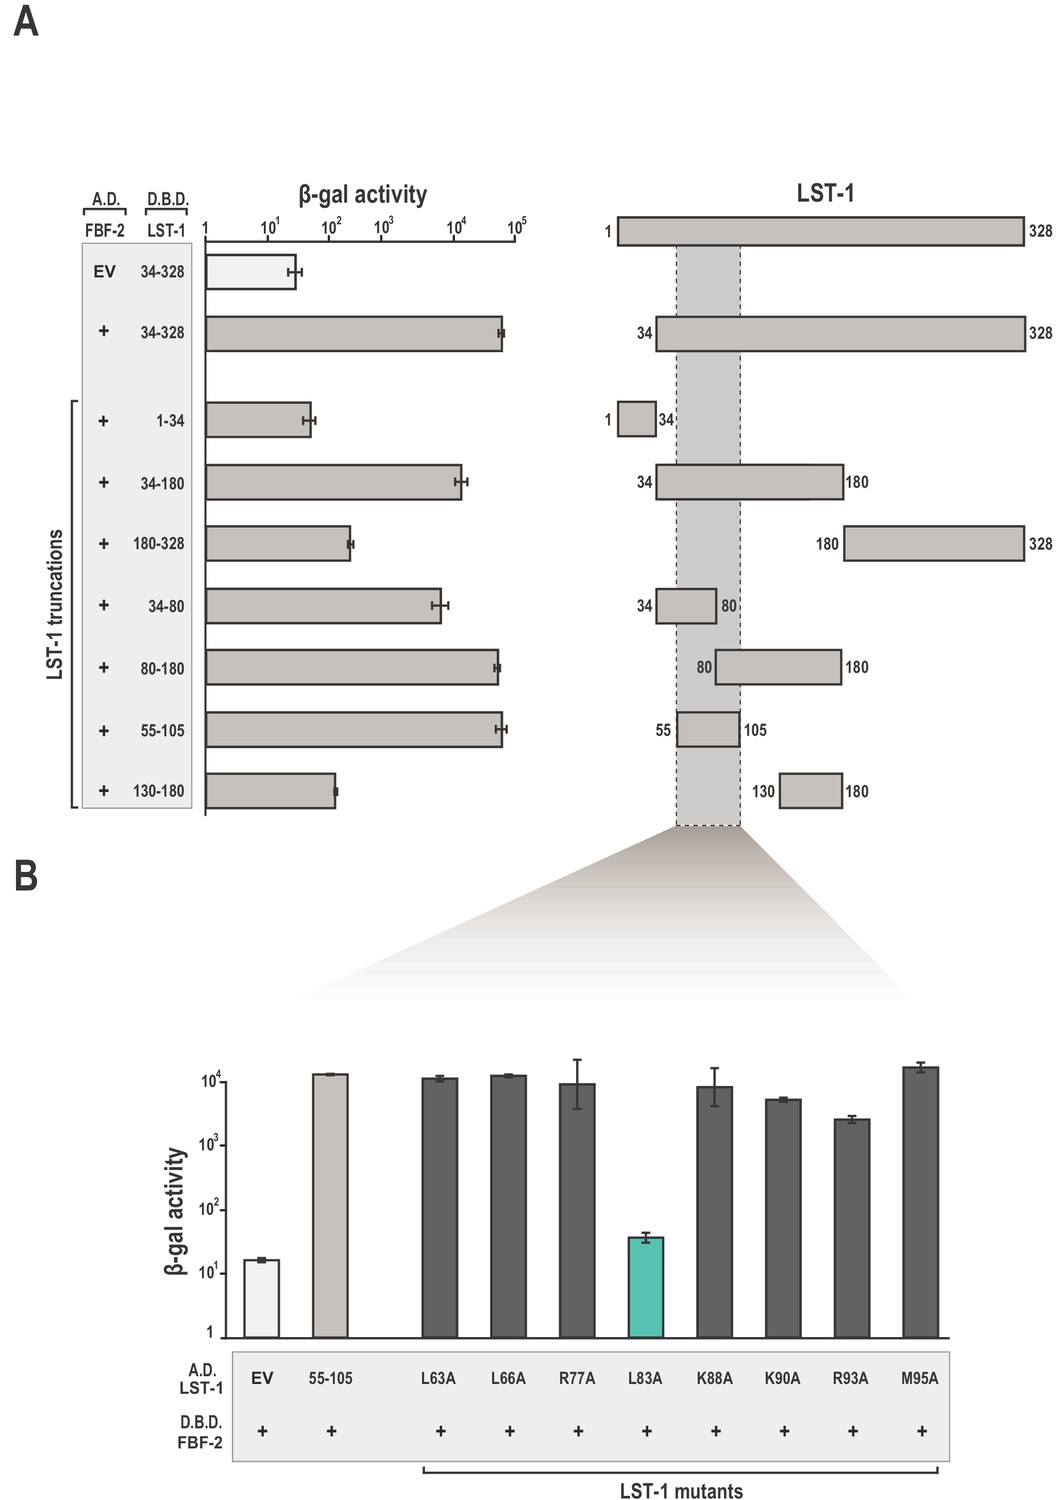
Identification of a minimal fragment of LST-1 that interacts with FBF-2.
(A) Yeast 2-hybrid analyses of interaction between the FBF-2 PUM domain fused to a GAL4 activation domain (A.D.) and LST-1 fragments fused to the LexA DNA-binding domain (D.B.D.). A negative control empty vector (EV) with no FBF-2 fused to the activation domain and a positive control with the FBF-2 PUM domain fused to the activation domain were assessed with LST-1 34–328 fused to the DNA-binding domain and are shown at the top of the graph. (B) LST-1 L83 is critical for interaction with FBF-2. Yeast 2-hybrid analyses were conducted with LST-1 residues 55–105 fused to a GAL4 activation domain and the PUM domain of FBF-2 fused to the LexA DNA-binding domain. Mutants in LST-1 that interfered with FBF-2 interaction are colored green and those that were competent for interaction are colored gray. Binding activity is shown as units of β-galactosidase (β-gal) activity normalized to cell count. Error bars indicate the standard deviation of three biological replicate measurements. A schematic representation of the yeast 2-hybrid assay is illustrated in Figure 1—figure supplement 1 and results of yeast 2-hybrid analyses of LST-1 and FBF homologs are shown in Figure 1—figure supplement 2.
-
Figure 1—source data 1
Source data for Figure 1A-Yeast two-hybrid of WT FBF-2 (A.D.) and LST-1 truncations (D.B.D.).
- https://doi.org/10.7554/eLife.48968.005
-
Figure 1—source data 2
Source data for Figure 1B-Yeast two-hybrid of LST-1 point mutants (A.D.) and WT FBF-2 (D.B.D.).
- https://doi.org/10.7554/eLife.48968.006
Figure 1—figure supplement 1

A schematic of the yeast two-hybrid assay.
To quantify binding activity, fusion proteins are introduced into yeast with a ‘bait’ protein (purple) fused to the LexA DNA-binding domain. The LexA protein provides a tether to the promoter region of the β-gal reporter gene by virtue of its association with the LexA operator site. ‘Prey’ proteins (peach) are introduced as fusions to the GAL4 transcriptional activation domain. Transcription of the reporter gene is dependent on interaction between the bait and prey proteins, which recruits RNA polymerase to the reporter gene.
Figure 1—figure supplement 2
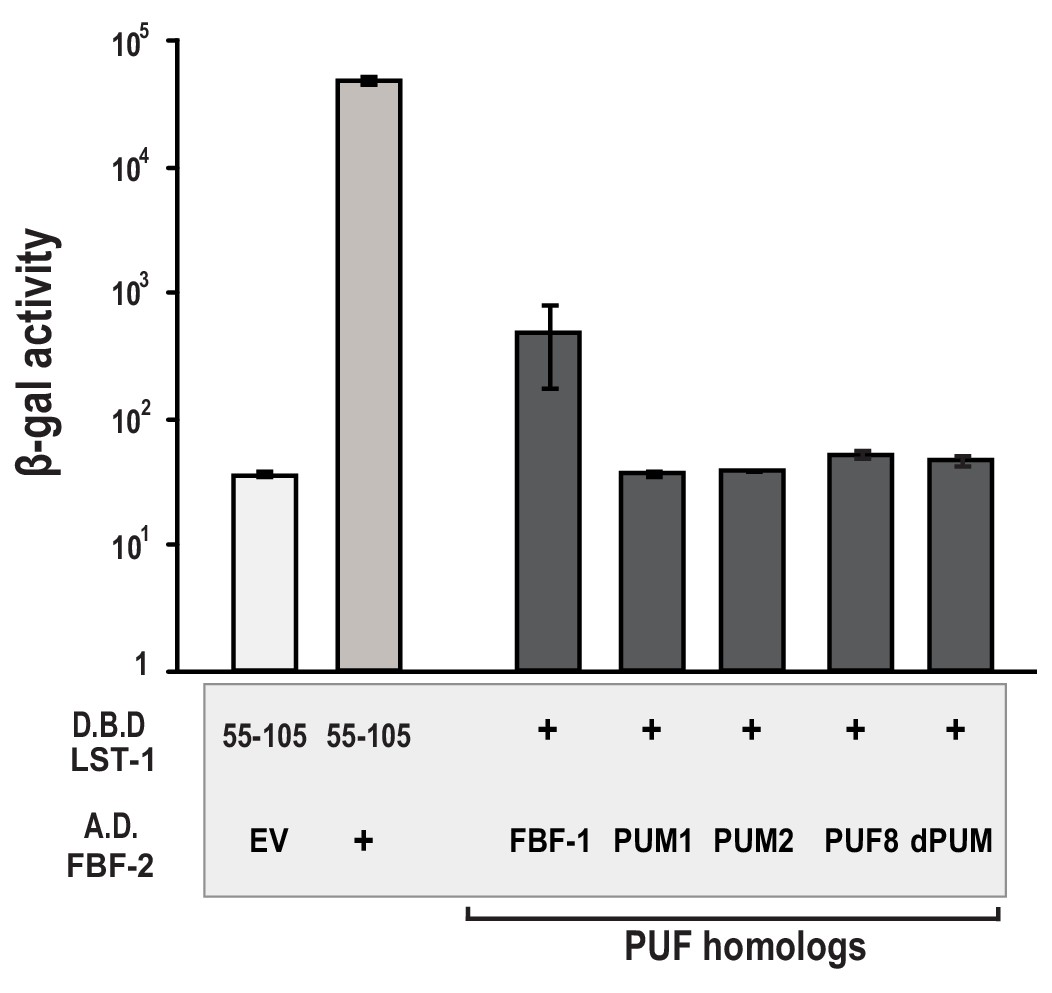
LST-1 interacts with FBF but not homologous PUF proteins.
Yeast-two hybrid assays were conducted with LST-1 residues 55–105 fused to the Lex-A DNA-binding domain (D.B.D.) and the GAL4 activation domain (A.D.) was fused to the PUM domain of the indicated PUF protein homologs: FBF-1 (residues 121–614), human PUM1 (residues 456–1064), human PUM2 (residues 456–1064), C. elegans PUF-8 (full length), and D. melanogaster dPUM (residues 1091–1426). Binding activity is shown as units of β-gal activity normalized to cell count. Error bars indicate the standard deviation of three biological replicate measurements.
-
Figure 1—figure supplement 2—source data 1
Source data for Figure 1—figure supplement 2-Yeast two-hybrid of PUF protein homologs (A.D.) and WT LST-1 (D.B.D.).
- https://doi.org/10.7554/eLife.48968.007
Figure 2 with 1 supplement
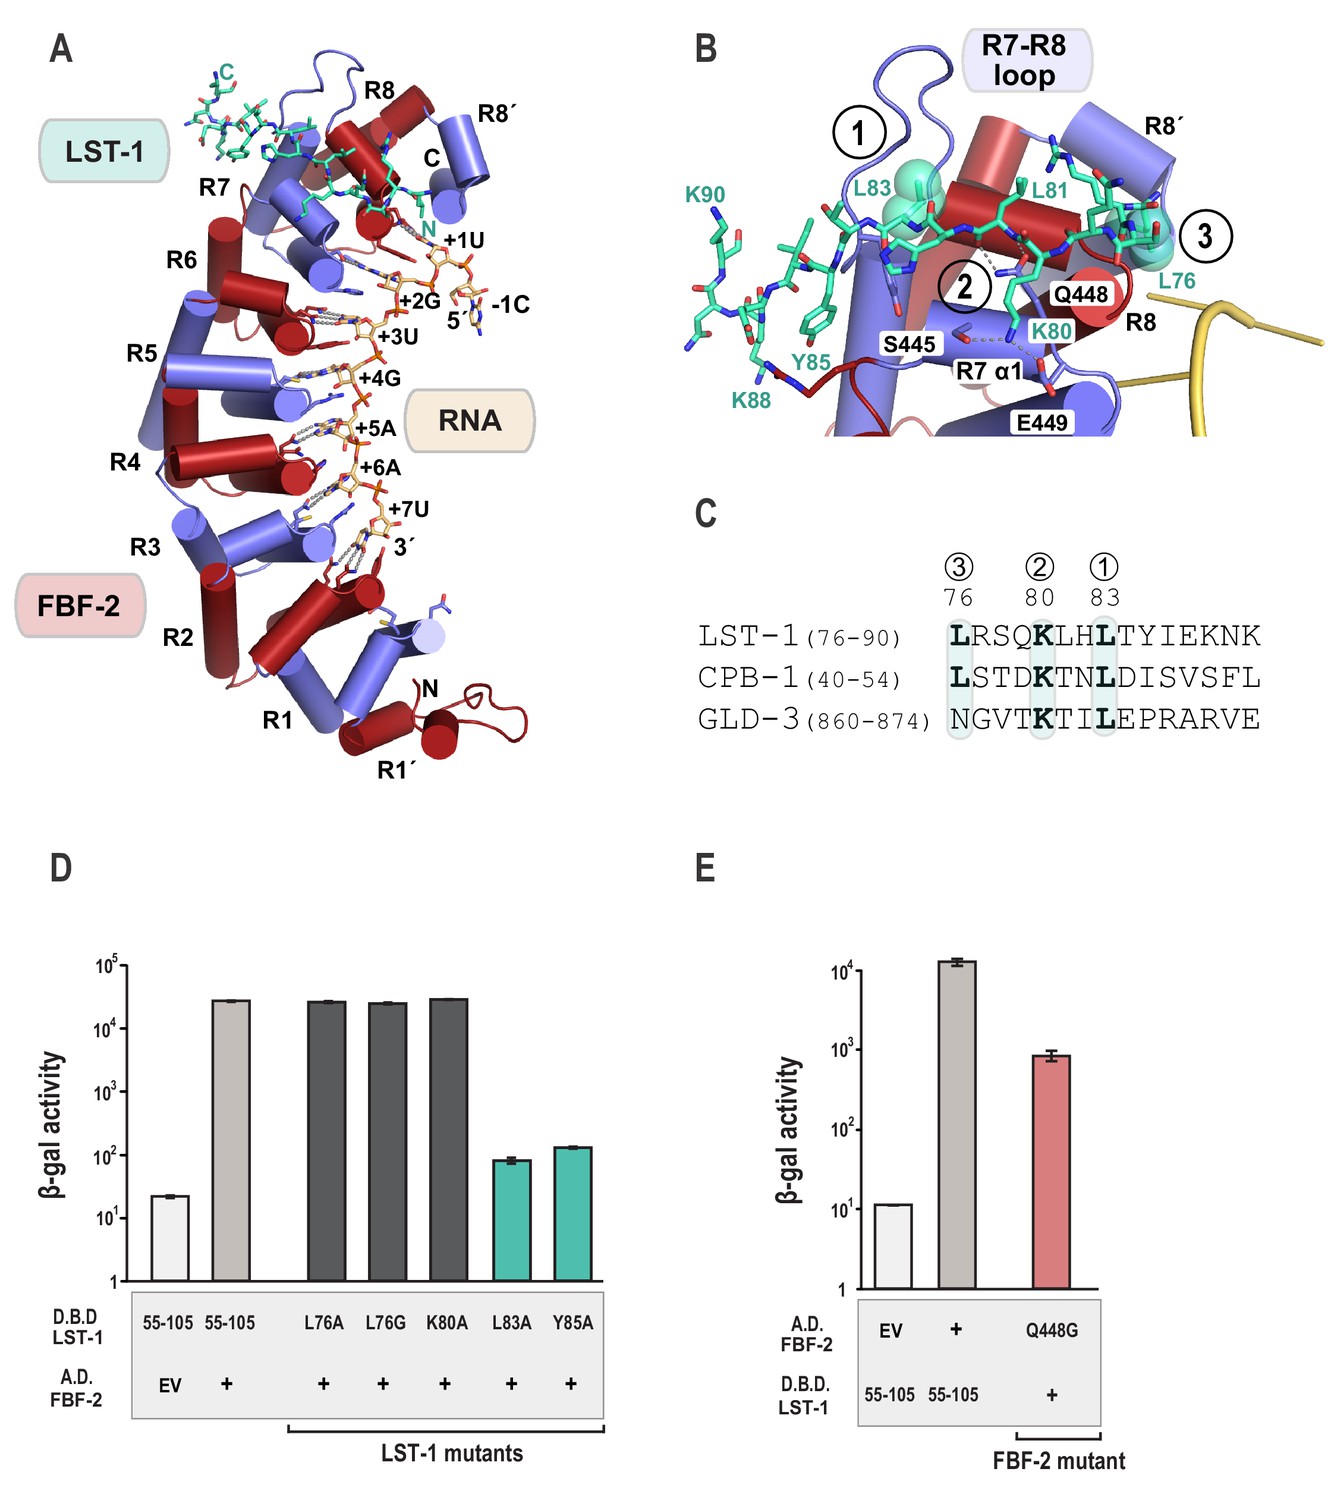
Crystal structure of an FBF-2/LST-1/RNA ternary complex reveals hotspots for protein-protein interaction.
(A) Crystal structure of an FBF-2/LST-1/RNA ternary complex. FBF-2 is shown as a ribbon diagram with cylindrical helices. PUM repeats are colored alternately red and blue. RNA recognition side chains from each PUM repeat are shown with dotted lines indicating interactions with the RNA bases. LST-1 (green) and the RNA (beige) are shown as stick representations colored by atom type (red, oxygen; blue, nitrogen; orange, phosphorus). (B) LST-1 contacts FBF-2 at conserved interaction hotspots. Zoomed-in view of interaction between FBF-2 and LST-1. Three interaction hotspots are labeled, and LST-1 L83 and L76 at hotspots 1 and 3, respectively, are shown with space-filling atoms. LST-1 K80 and FBF-2 Q448 at hotspot 2 are shown as stick models. Interactions between LST-1 and FBF-2 are indicated by dotted lines. Electron density for the LST-1 peptide is shown in Figure 2—figure supplement 1. (C) Conservation of LST-1 interacting residues in CPB-1 and GLD-3. Amino acid sequence alignment of the LST-1 interacting peptide and conserved sequences in CPB-1 and GLD-3. Residues at the interaction hotspots in (B) are highlighted and conserved residues are in boldface. (D) LST-1 L83 and Y85 at interaction hotspot 1 are essential for tight binding to FBF-2. Yeast 2-hybrid analyses were conducted with LST-1 residues 55–105 fused to the LexA DNA-binding domain (D.B.D.) and the PUM domain of FBF-2 fused to the GAL4 activation domain (A.D.). Mutants in LST-1 that interfered with FBF-2 interaction are colored green and those that were competent for interaction are colored gray. (E) FBF-2 Q448G at hotspot 2 has a minor effect on interaction with LST-1. FBF-2 variants that interfered with LST-1 interaction are colored red and those that were competent for interaction are colored gray. Binding activity is shown as units of β-gal activity normalized to cell count. Error bars indicate the standard deviation of three biological replicate measurements.
-
Figure 2—source data 1
Source data for Figure 2D-Yeast two-hybrid of LST-1 point mutants (D.B.D.) and WT FBF-2 (A.D.).
- https://doi.org/10.7554/eLife.48968.011
-
Figure 2—source data 2
Source data for Figure 2E-Yeast two-hybrid of FBF-2 point mutants (A.D.) and WT LST-1 (D.B.D.).
- https://doi.org/10.7554/eLife.48968.012
Figure 2—figure supplement 1
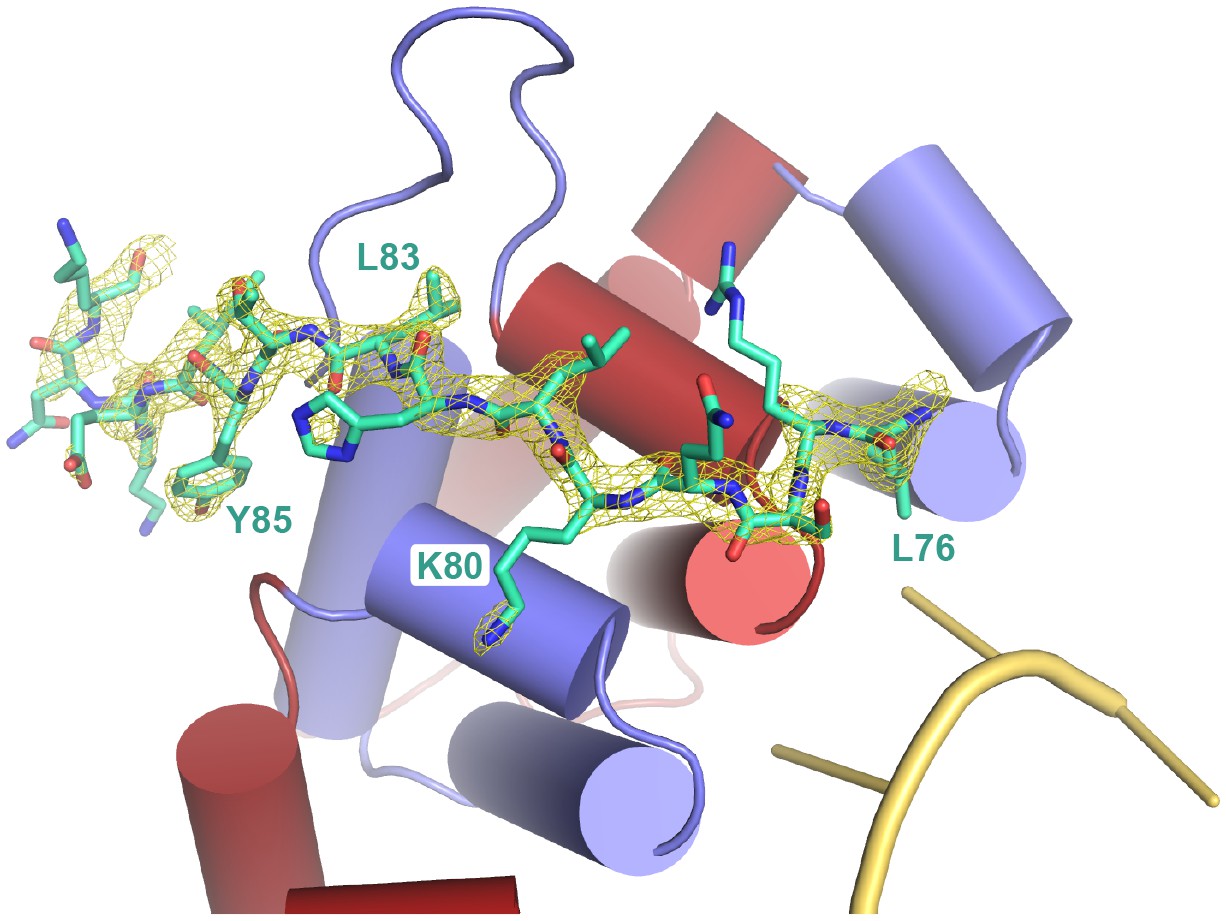
Fo-Fc simulated annealing omit map for the LST-1 peptide, contoured at 3 σ.
https://doi.org/10.7554/eLife.48968.010
Figure 3
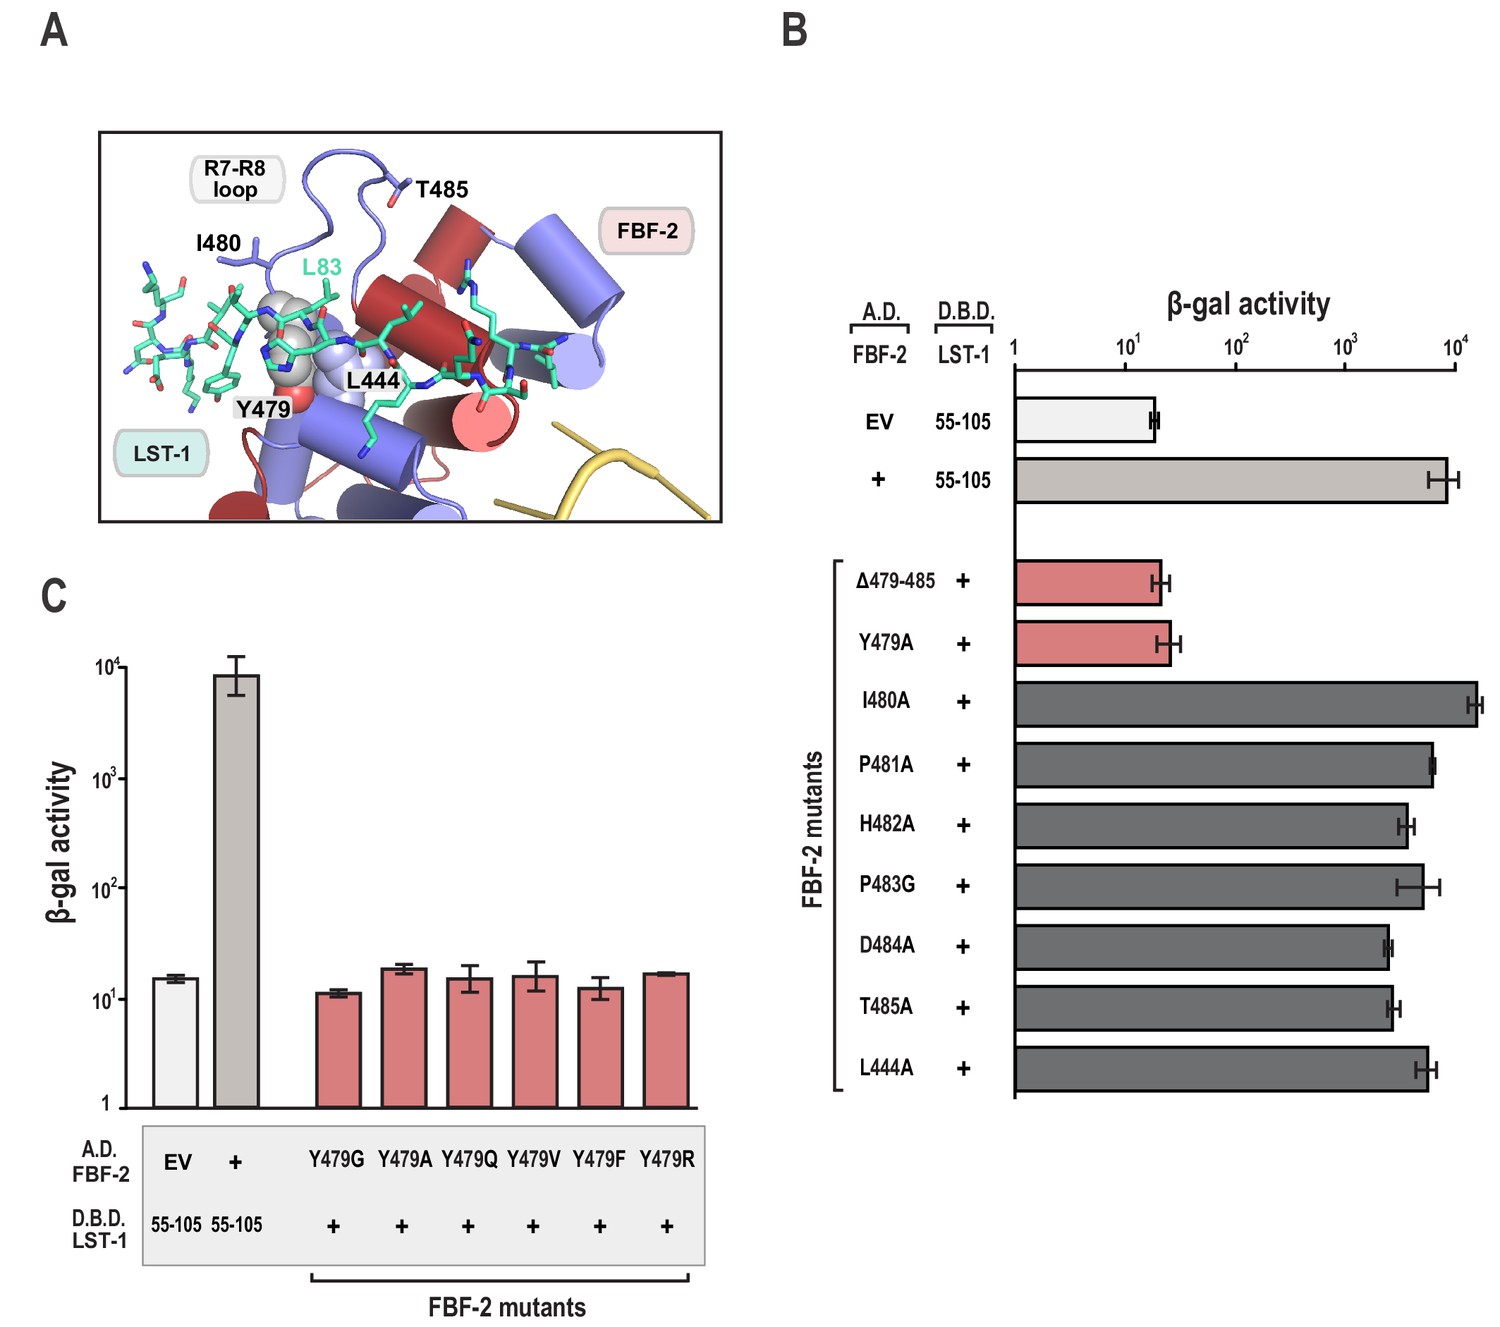
The FBF-2 R7-R8 loop is essential for interaction with LST-1.
(A) The essential residue LST-1 L83 interacts with FBF-2 at the base of the FBF-2 R7-R8 loop. FBF-2 L444 and Y479 at the R7-R8 loop are shown with space-filling atoms. (B) Yeast 2-hybrid analyses were conducted with LST-1 residues 55–105 fused to the LexA DNA-binding domain (D.B.D.) and the PUM domain of FBF-2 fused to the GAL4 activation domain (A.D.). (C) Yeast 2-hybrid analyses of mutations in Y479. Mutants in FBF-2 that interfered with LST-1 interaction are colored red and those that were competent for interaction are colored gray. Binding activity is shown as units of β-gal activity normalized to cell count. Error bars indicate the standard deviation of three biological replicate measurements.
-
Figure 3—source data 1
Source data for Figure 3B-Yeast two-hybrid of FBF-2 point mutants (A.D.) and WT LST-1 (D.B.D.).
- https://doi.org/10.7554/eLife.48968.014
-
Figure 3—source data 2
Source data for Figure 3C-Yeast two-hybrid of FBF-2 point mutants (A.D.) and WT LST-1 (D.B.D.).
- https://doi.org/10.7554/eLife.48968.015
Figure 4 with 1 supplement
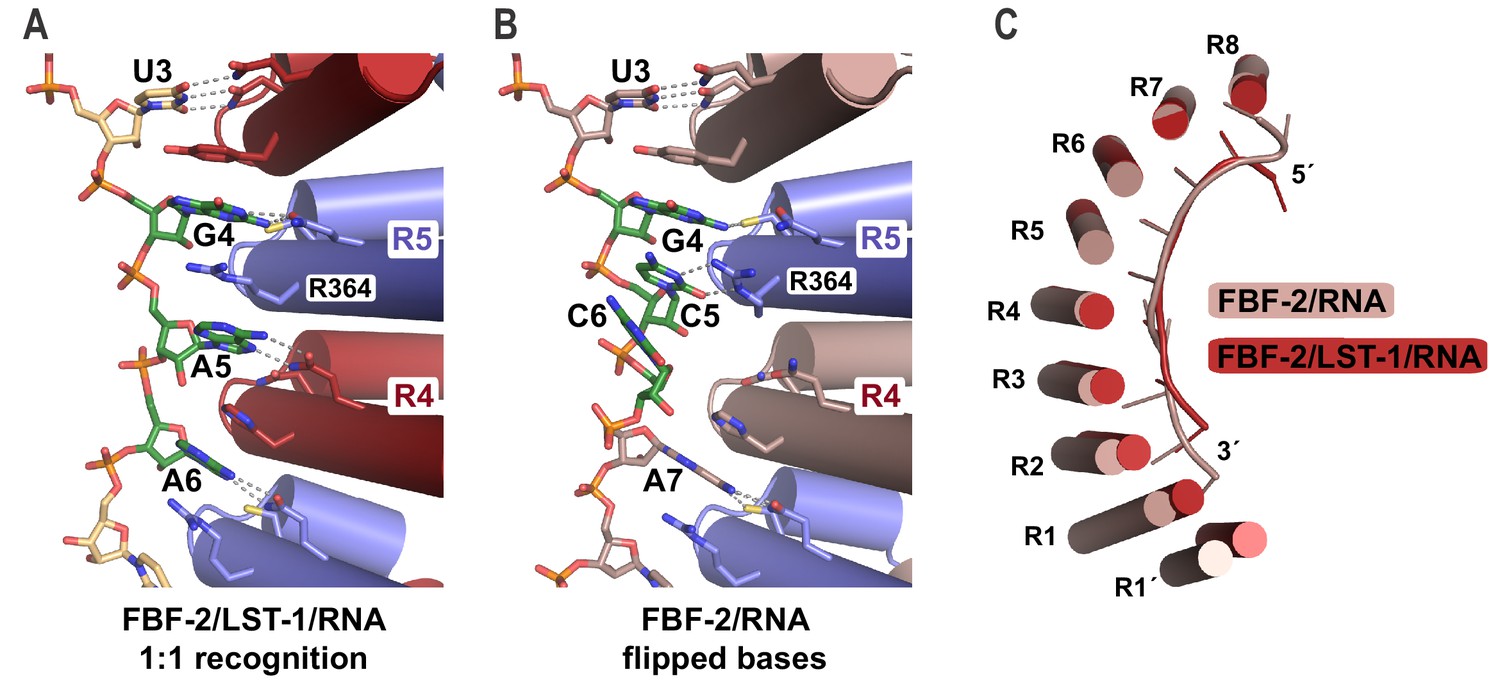
FBF-2 in the ternary complex binds to RNA using a 1:1 recognition mode and its curvature is more pronounced.
(A) FBF-2 recognizes the central nucleotides in a compact RNA using repeats 4 and 5. The crystal structure of the FBF-2/LST-1/RNA ternary complex is shown with FBF-2 displayed as a ribbon diagram with cylindrical helices. PUM repeats are colored alternately red and blue. RNA recognition side chains from each PUM repeat are shown with dotted lines indicating interactions with the RNA bases. Central nucleotides 4–6 (green) within a compact RNA element (beige) are shown as stick representations colored by atom type (red, oxygen; blue, nitrogen; orange, phosphorus). Electron density for the compact RNA nucleotides 4–6 is shown in Figure 4—figure supplement 1. (B) FBF-2 binds to directly stacked and flipped central nucleotides in the extended gld-1 RNA motif. The crystal structure of the FBF-2/gld-1 RNA binary complex (PDB ID 3V74) is shown as a ribbon diagram with cylindrical helices. Central nucleotides 4–6 (green) within the gld-1 RNA (mauve) are shown as stick models. (C) Superposition of FBF-2 within ternary and binary complexes reveals increased curvature in the FBF-2/LST-1/RNA ternary complex. RNA-binding helices and RNA cartoons are shown for FBF-2 in the binary (mauve) and ternary (red) complexes.
Figure 4—figure supplement 1
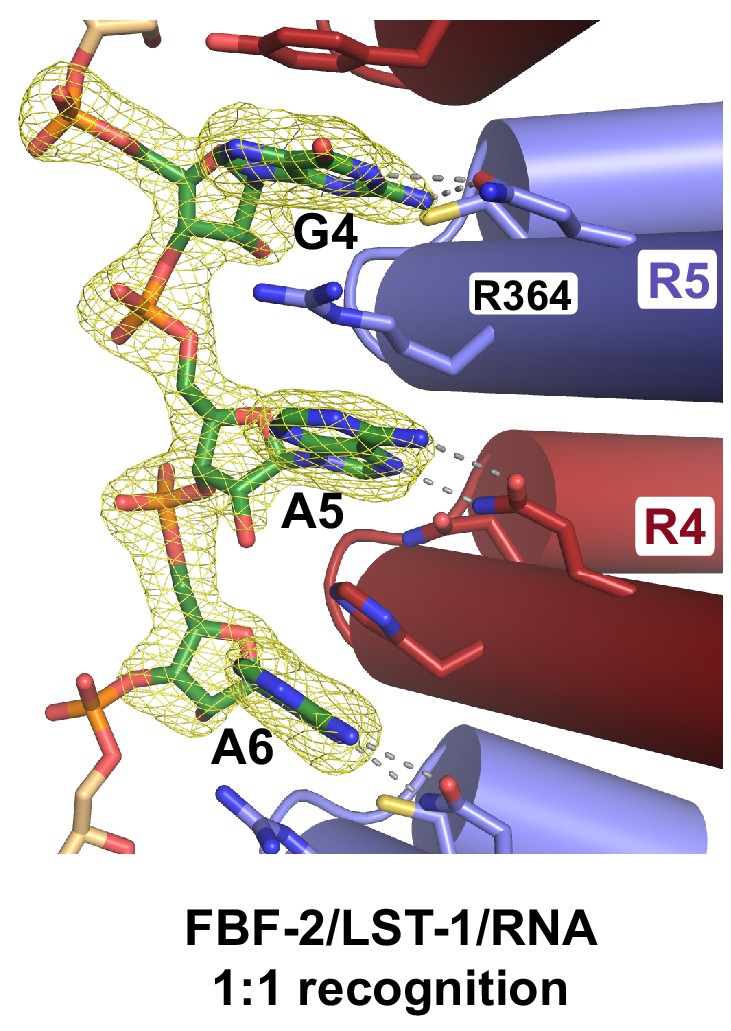
Fo-Fc simulated annealing omit map for the cFBE RNA nucleotides 4–6, contoured at 3 σ.
https://doi.org/10.7554/eLife.48968.017
Figure 5 with 1 supplement
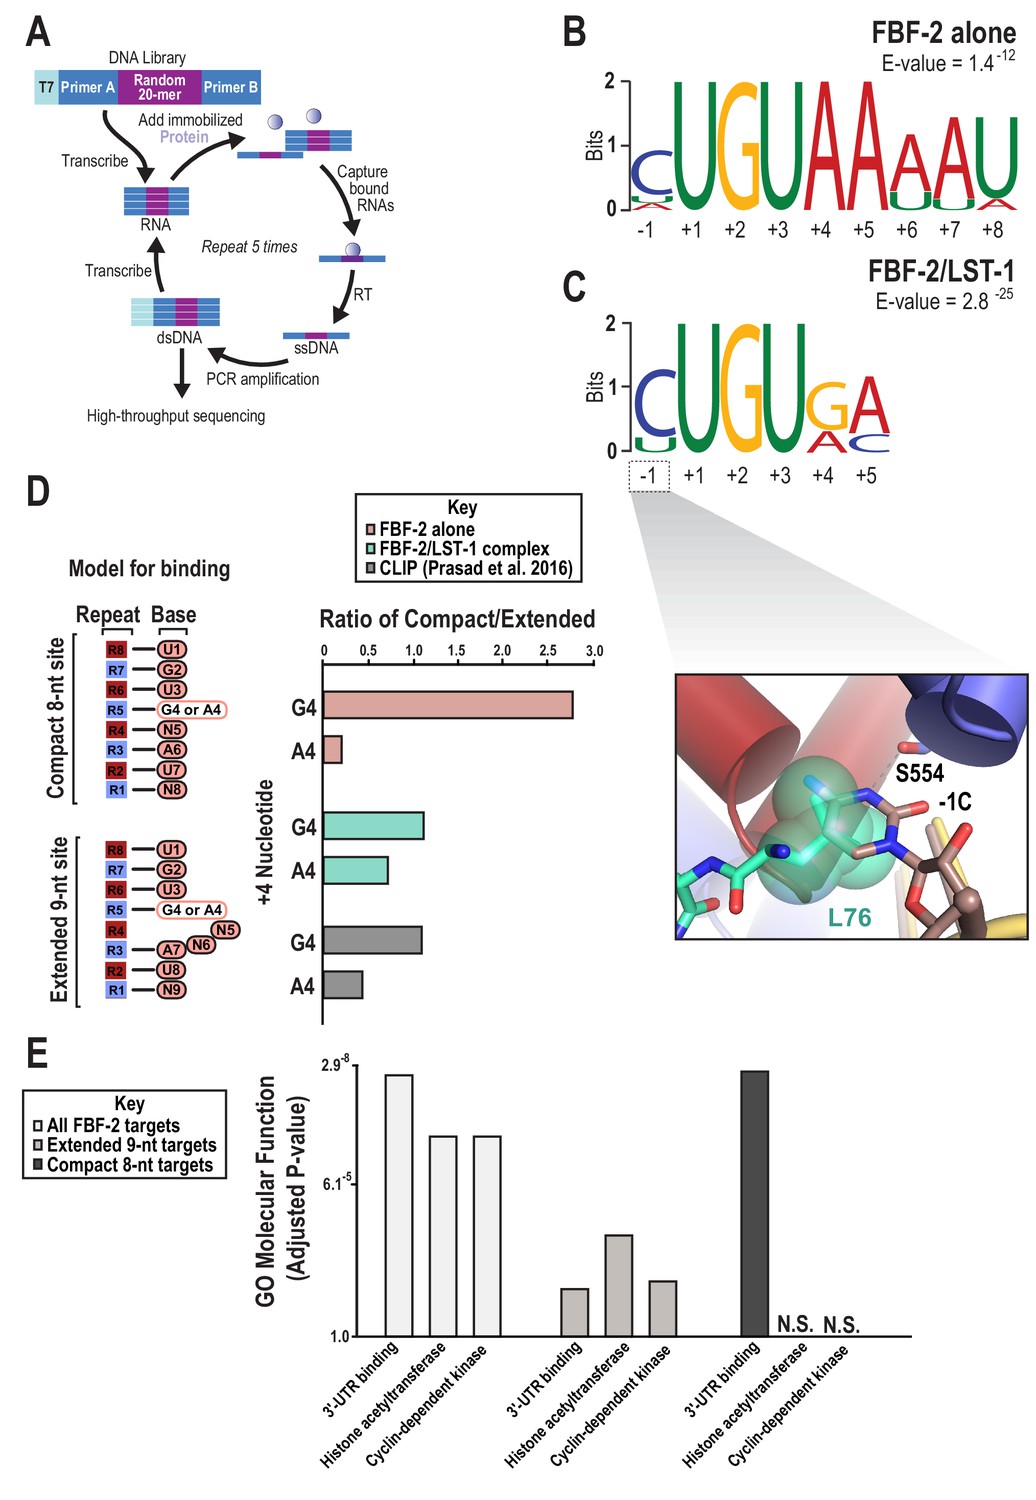
SEQRS analysis of FBF-2/LST-1 and FBF-2 reveals distinct specificities.
(A) Diagram of the SEQRS procedure. (B) Motif from SEQRS analysis of the FBF-2/LST-1 complex. (C) Motif from SEQRS analysis of FBF-2. Inset, superposition of the upstream C pocket in structures of the FBF-2/LST-1/RNA ternary and FBF-2/RNA binary complexes demonstrates that LST-1 L76 occupies the upstream C pocket in the structure of the ternary complex. (D) Comparative analysis of biases at base +4 in compact vs extended motifs. Sequences that conform to either the compact 8-nt or extended 9-nt sites were quantified in SEQRS data for FBF-2 alone (pink), the LST-1/FBF-2 complex (cyan), or CLIP data for FBF-2 (gray). (E) GO term analysis of FBF-2 mRNA targets. P-values were corrected using the Benjamini-Hochberg method (Kuleshov et al., 2016). Enrichment for compact sequences or extended binding elements was determined using the grep command on FBF-2 CLIP targets (Prasad et al., 2016). The abbreviation N.S. indicates that enrichment failed to achieve significance (adjusted p<0.05).
-
Figure 5—source data 1
Source data for Figure 5B,C-Sequences for MEMEs.
- https://doi.org/10.7554/eLife.48968.020
-
Figure 5—source data 2
Source data for Figure 5E-mRNA targets for GO term enrichment.
- https://doi.org/10.7554/eLife.48968.021
Figure 5—figure supplement 1
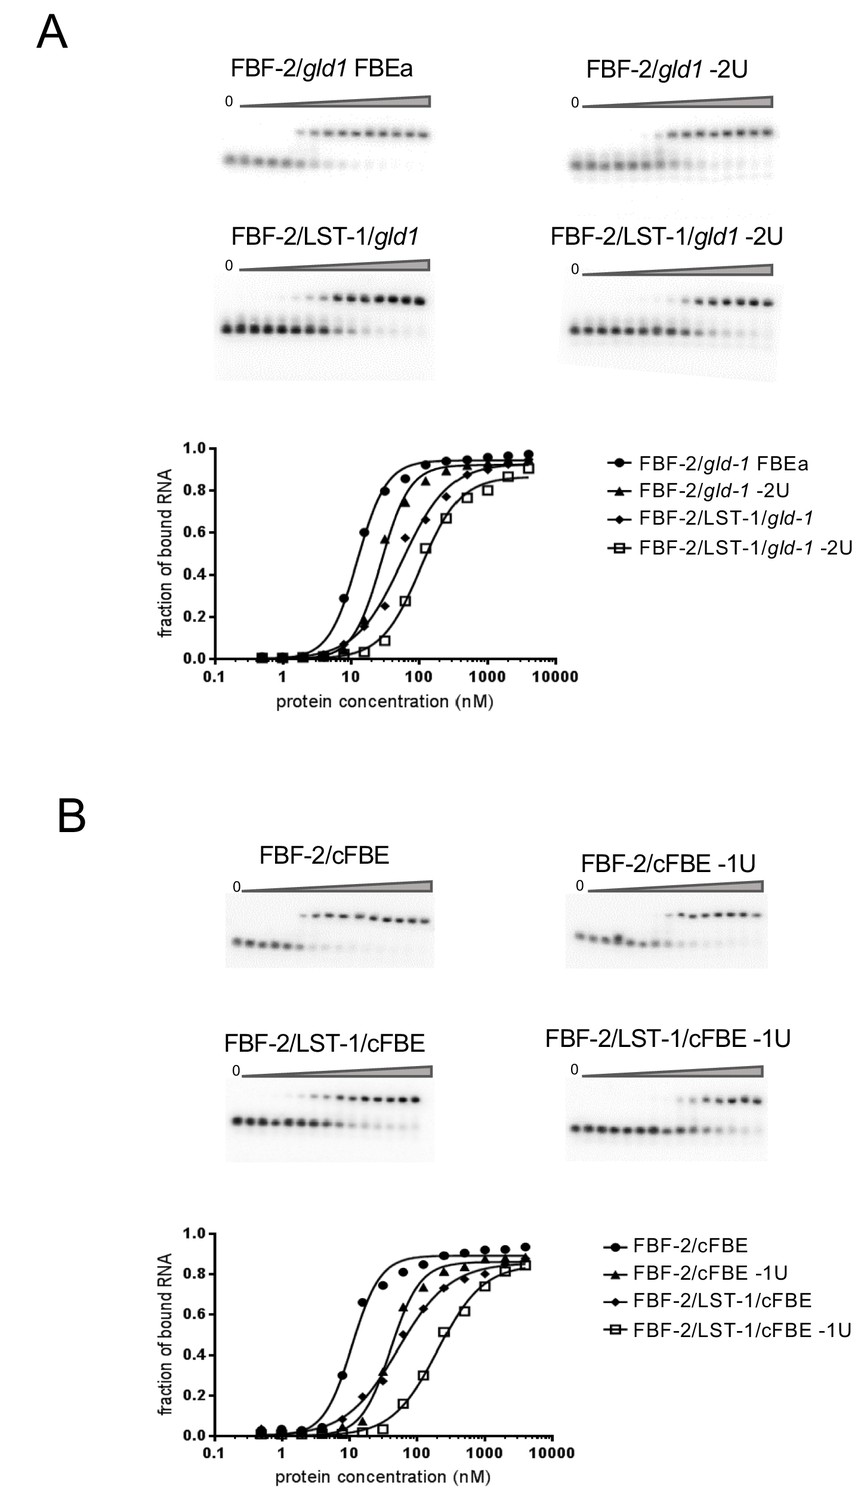
Representative EMSA gels and corresponding binding curves are shown for binding to gld-1 (A) and compact FBE (cFBE, (B) RNAs.
Triangles above the gels indicate increasing concentrations of FBF-2 from 0.49 to 4000 nM. The left lanes in each gel contained no protein. Kd values for triplicate experiments are presented in .
-
Figure 5—figure supplement 1—source data 1
Source data for Figure 5—figure supplement 1 and Table 2-Kd values for triplicate measurements.
- https://doi.org/10.7554/eLife.48968.022
Tables
Table 1
X-ray data collection and refinement statistics.
https://doi.org/10.7554/eLife.48968.008| Resolution range | 39.7–2.1 (2.174–2.1) |
|---|---|
| Space group | P 1 |
| Unit cell dimensions a, b, c (Å) α, β, γ (°) | 42.75, 74.38, 81.55 107.17, 104.40, 101.76 |
| Total reflections* | 180,242 (13587) |
| Unique reflections | 26,619 (4934) |
| Multiplicity | 6.8 (7.0) |
| Completeness (%) | 96.6 (95.3) |
| Mean I/sigma(I) | 11.8 (2.5) |
| Wilson B-factor | 41.2 |
| R-merge | 0.101 (0.795) |
| R-meas | 0.109 (0.858) |
| R-pim | 0.041 (0.322) |
| CC1/2 | 0.995 (0.885) |
| Refinement | |
| Reflections used in refinement | 50,102 (4931) |
| Reflections used for R-free | 2000 (197) |
| R-work | 0.198 (0.296) |
| R-free | 0.240 (0.343) |
| Number of atoms | |
| protein | 6565 |
| RNA | 266 |
| Solvent | 189 |
| RMSD bonds (Å) | 0.003 |
| RMSD angles (°) | 0.82 |
| Ramachandran favored (%) | 98.38 |
| Ramachandran allowed (%) | 1.62 |
| Ramachandran outliers (%) | 0.00 |
| Average B-factors (Å2) | |
| protein | 53.6 |
| RNA | 76.7 |
| solvent | 52.2 |
-
*Statistics for the highest-resolution shell are shown in parentheses.
Table 2
RNA-binding analyses of FBF-2 and FBF-2/LST-11.
https://doi.org/10.7554/eLife.48968.023| RNA | 87654 321 rpt C-UGUGA-AUG (8) C-UGUGCCAUA (9) 12345 pos2 | FBF-2, Kd (nM) | Krel2 | FBF-2/LST-1, Kd (nM) | Krel3 |
|---|---|---|---|---|---|
| gld-1 FBEa | CAUGUGCCAUA | 12.4 ± 2.0 | 1 | 46.4 ± 5.0 | 1 |
| gld-1 –2U | UAUGUGCCAUA | 32.2 ± 4.7 | 2.6 | 101.3 ± 13.2 | 2.2 |
| gld-1 G4A | CAUGUACCAUA | 12.0 ± 1.4 | 1 | 34.4 ± 5.6 | 0.7 |
| gld-1 C5A | CAUGUGACAUA | 27.1 ± 5.4 | 2.2 | 79.2 ± 8.8 | 1.7 |
| cFBE-7 | C-UGUGA-AU | 22.0 ± 2.7 | 2.1 | 111.7 ± 7.7 | 2.9 |
| cFBE | C-UGUGA-AUG | 10.3 ± 2.9 | 1 | 38.7 ± 5.0 | 1 |
| cFBE −1U | U-UGUGA-AUG | 46.5 ± 4.3 | 4.5 | 175.9 ± 37.8 | 4.5 |
| PBE | C-UGUAU-AUA | 56.8 ± 13.7 | 5.5 | 814.0 ± 180 | 21 |
| cFBE G4A | C-UGUAA-AUG | 18.8 ± 3.0 | 1.8 | 82.7 ± 16.0 | 2.1 |
| cFBE A5C | C-UGUGC-AUG | 19.5 ± 2.5 | 1.9 | 82.3 ± 18.8 | 2.1 |
| cFBE A5U | C-UGUGU-AUG | 25.5 ± 5.5 | 2.5 | 133.2 ± 23.8 | 3.4 |
| cFBE G8A | C-UGUGA-AUA | 21.1 ± 2.5 | 1.9 | 84.4 ± 20.2 | 2.2 |
-
1Representative EMSA gels and binding curves are shown in Figure 5—figure supplement 1. Source data for the three technical replicate EMSAs are included in Figure 5—figure supplement 1—source data 1.
2RNA sequences of the cFBE compact element and gld-1 FBEa motif are shown with the FBF-2 repeat (rpt) that binds to the respective nucleotide above and the RNA motif position below. Nucleotides in boldface differ from the sequences of the gld-1 FBEa motif (top four lines) or the cFBE.
-
3Relative Kd values (Krel) are calculated with respect to the Kd for binding to the gld-1 FBEa motif (top four lines) or the cFBE.
Table 3
SEQRS enrichment for specific sequence elements.
https://doi.org/10.7554/eLife.48968.024| Protein | Pattern | Base +4 | Terminal AU position | Count | Ratio compact/ |
|---|---|---|---|---|---|
| extended | |||||
| 87654 321 repeat CUGUGA AUG (8mer) CUGUGCCAUA (9mer) | |||||
| FBF-2 | CTGTA..AT | A | +8U | 119374 | 0.21 |
| FBF-2 | CTGTA. AT | A | +7U | 24819 | |
| FBF-2 | CTGTG..AT | G | +8U | 1970 | 2.8 |
| FBF-2 | CTGTG. AT | G | +7U | 5506 | |
| Complex | CTGTA..AT | A | +8U | 170 | 0.7 |
| Complex | CTGTA. AT | A | +7U | 118 | |
| Complex | CTGTG..AT | G | +8U | 113 | 1.1 |
| Complex | CTGTG. AT | G | +7U | 126 | |
| CLIP | CTGTA..AT | A | +8U | 266 | 0.44 |
| CLIP | CTGTA. AT | A | +7U | 117 | |
| CLIP | CTGTG..AT | G | +8U | 92 | 1.1 |
| CLIP | CTGTG. AT | G | +7U | 102 |
Key resources table
| Reagent type (species) or resource | Designation | Source or reference | Identifiers | Additional information |
|---|---|---|---|---|
| Gene (Caenorhabditis elegans) | LST-1 | UniprotKB: P91820_(CAEEL) | ||
| Gene (Caenorhabditis elegans) | FBF-2 | UniprotKB: Q09312_(CAEEL) | ||
| Strain, strain background (Saccharomyces cerevisiae)) | L40 | ATCC | Cat. #: MYA-3332 | Yeast 2-hybrid strain |
| Strain, strain background (Escherichia coli) | DH5-alpha | Thermo Fisher | Cat. #: 18265017 | Chemically competent cells |
| Strain, strain background (Escherichia coli) | BL21-CodonPlus (DE3)-RIL | Agilent | Cat. #: 230245 | Competent cells |
| Recombinant DNA reagent | pACT2 (plasmid) | PMID: 21372189 | GenBank Accession #: U29899 | Yeast two-hybrid expression vector with Gal4 activation domain fusion |
| Recombinant DNA reagent | pBTM116 (plasmid) | Clonetech | Vojtek et al., 1993 | Yeast two hybrid vector with LexA DNA binding ORF |
| Recombinant DNA reagent | pSMT3 (plasmid) | provided by Dr. Christopher Lima | Mossessova and Lima (2000) | Encodes an N-terminal His6-SUMO fusion tag followed by a TEV protease cleavage site |
| Recombinant DNA reagent | pGEX4T-3 (plasmid) | GE Healthcare | Cat. #: 27-4583-01 | Bacterial vector for expressing fusion proteins with a thrombin site |
| Recombinant DNA reagent | pMAL-C2T (plasmid) | New England Biolabs | Accession #: JF795283 | Bacterial vector for cytoplasmic expression of maltose-binding protein fusion |
| Sequence-based reagent | Yeast tRNA | Thermo Fisher | Cat. #: 15401011 | Carrier for nucleic acid precipitation |
| Peptide, recombinant protein | TURBO DNase | Thermo Fisher | Cat. #: AM2238 | |
| Peptide, recombinant protein | ImProm-II reverse transcription reaction | Promega | Cat. #: A3803 | |
| Peptide, recombinant protein | GoTaq reaction | Promega | Cat. #: M7123 | |
| Peptide, recombinant protein | T4 polynucleotide kinase | New England Biolabs | Cat. #: M0201S | |
| Peptide, recombinant protein | lysozyme | Thermo Fisher | Cat. #: 89833 | |
| Commercial assay or kit | β-Glo reagent | Promega | Cat. #: E4720 | |
| Commercial assay or kit | Phusion High- Fidelity PCR Kit | Thermo Fisher | Cat. #: F553S | |
| Commercial assay or kit | AmpliScribe T7-Flash Transcription Kit | Lucigen | Cat. #: ASF3507 | |
| Chemical compound, drug | EDTA-free Protease Inhibitor | Roche | Cat. #: 11836170001 | |
| Chemical compound, drug | Amylose resin | New England Biolabs | Cat. #: E8021S | |
| Chemical compound, drug | Glutathione agarose resin | Gold Biotechnology | Cat. #: G-250 | |
| Chemical compound, drug | Ni-NTA resin | Qiagen | Cat. #: 30210 | |
| Chemical compound, drug | reduced glutathione | Sigma-Aldrich | Cat. #: G4251 | |
| Chemical compound, drug | Glutathione magnetic beads | Thermo Fisher | Cat. #: 78602 | |
| Software, algorithm | HKL2000 | http://www.hkl-xray.com/ | Otwinowski and Minor, 1997 | |
| Software, algorithm | Phaser | http://www.ccp4.ac.uk/html/phaser.html | McCoy et al., 2007 | |
| Software, algorithm | Phenix | https://www.phenix-online.org | Adams et al., 2010 | |
| Software, algorithm | Coot | https://www2.mrc-lmb.cam.ac.uk/personal/pemsley/coot | Emsley and Cowtan, 2004 | |
| Software, algorithm | MEME | http://meme-suite.org/ | Bailey et al., 2006 | |
| Software, algorithm | Enrichr | https://amp.pharm.mssm.edu/Enrichr/ | Kuleshov et al., 2016 | |
| Software, algorithm | ImageQuant Version 5.1 | GE Healthcare | ||
| Software, algorithm | GraphPad Prism 7 | GraphPad | ||
| Software, algorithm | Matlab R2008a | MathWorks |
Additional files
-
Transparent reporting form
- https://doi.org/10.7554/eLife.48968.025
Download links
A two-part list of links to download the article, or parts of the article, in various formats.
Downloads (link to download the article as PDF)
Open citations (links to open the citations from this article in various online reference manager services)
Cite this article (links to download the citations from this article in formats compatible with various reference manager tools)
A crystal structure of a collaborative RNA regulatory complex reveals mechanisms to refine target specificity
eLife 8:e48968.
https://doi.org/10.7554/eLife.48968


