Self-assembling manifolds in single-cell RNA sequencing data
- Stanford University, United States
- Chan Zuckerberg Biohub, United States
- Stanford University School of Medicine, United States
Figures
Figure 1 with 2 supplements
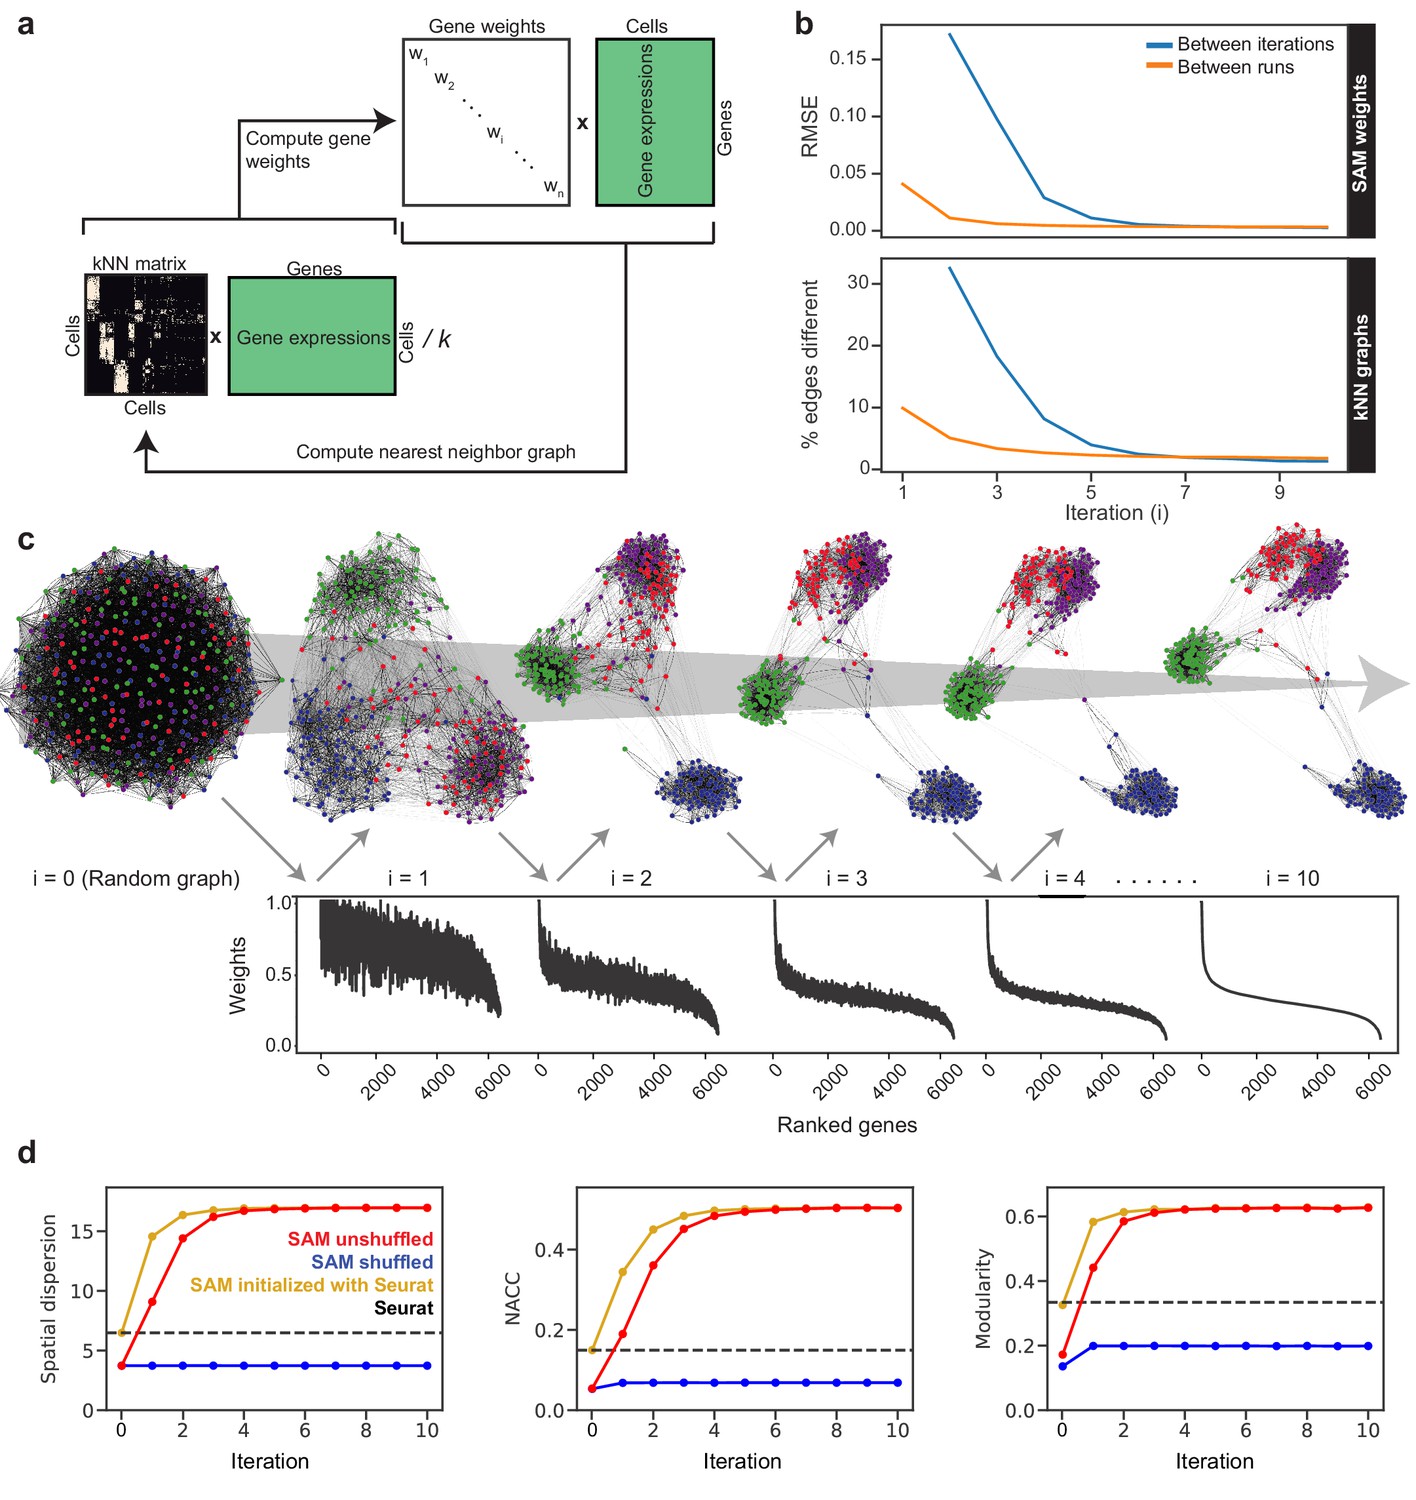
The SAM algorithm.
(a) SAM starts with a randomly initialized kNN adjacency matrix and iterates to refine the adjacency matrix and gene weight vector until convergence. (b) Root mean square error (RMSE) of the gene weights (top) and the fraction of different edges of the nearest-neighbor adjacency matrices (bottom) between adjacent iterations (blue) and between independent runs at the same iteration (orange) to show that SAM converges to the same solution regardless of initial conditions. The differences between the gene weights and nearest-neighbor graphs from independent runs are relatively small, indicating that SAM converges to the same solution through similar paths. (c) Graph structures and gene weights of the schistosome stem cell data converging to the final output over the course of 10 iterations (i denotes iteration number). Top: nodes are cells and edges connect neighbors. Nodes are color-coded according to the final clusters. Bottom: weights are sorted according to the final gene rankings. (d) Network properties iteratively improve for the graphs reconstructed from the original data (red) but not on the randomly shuffled data (blue). The network properties converge to the same values when initializing SAM with the Seurat-reconstructed graph instead of a random graph (yellow). Dashed lines: metrics measured from the Seurat-reconstructed graphs.
Figure 1—figure supplement 1
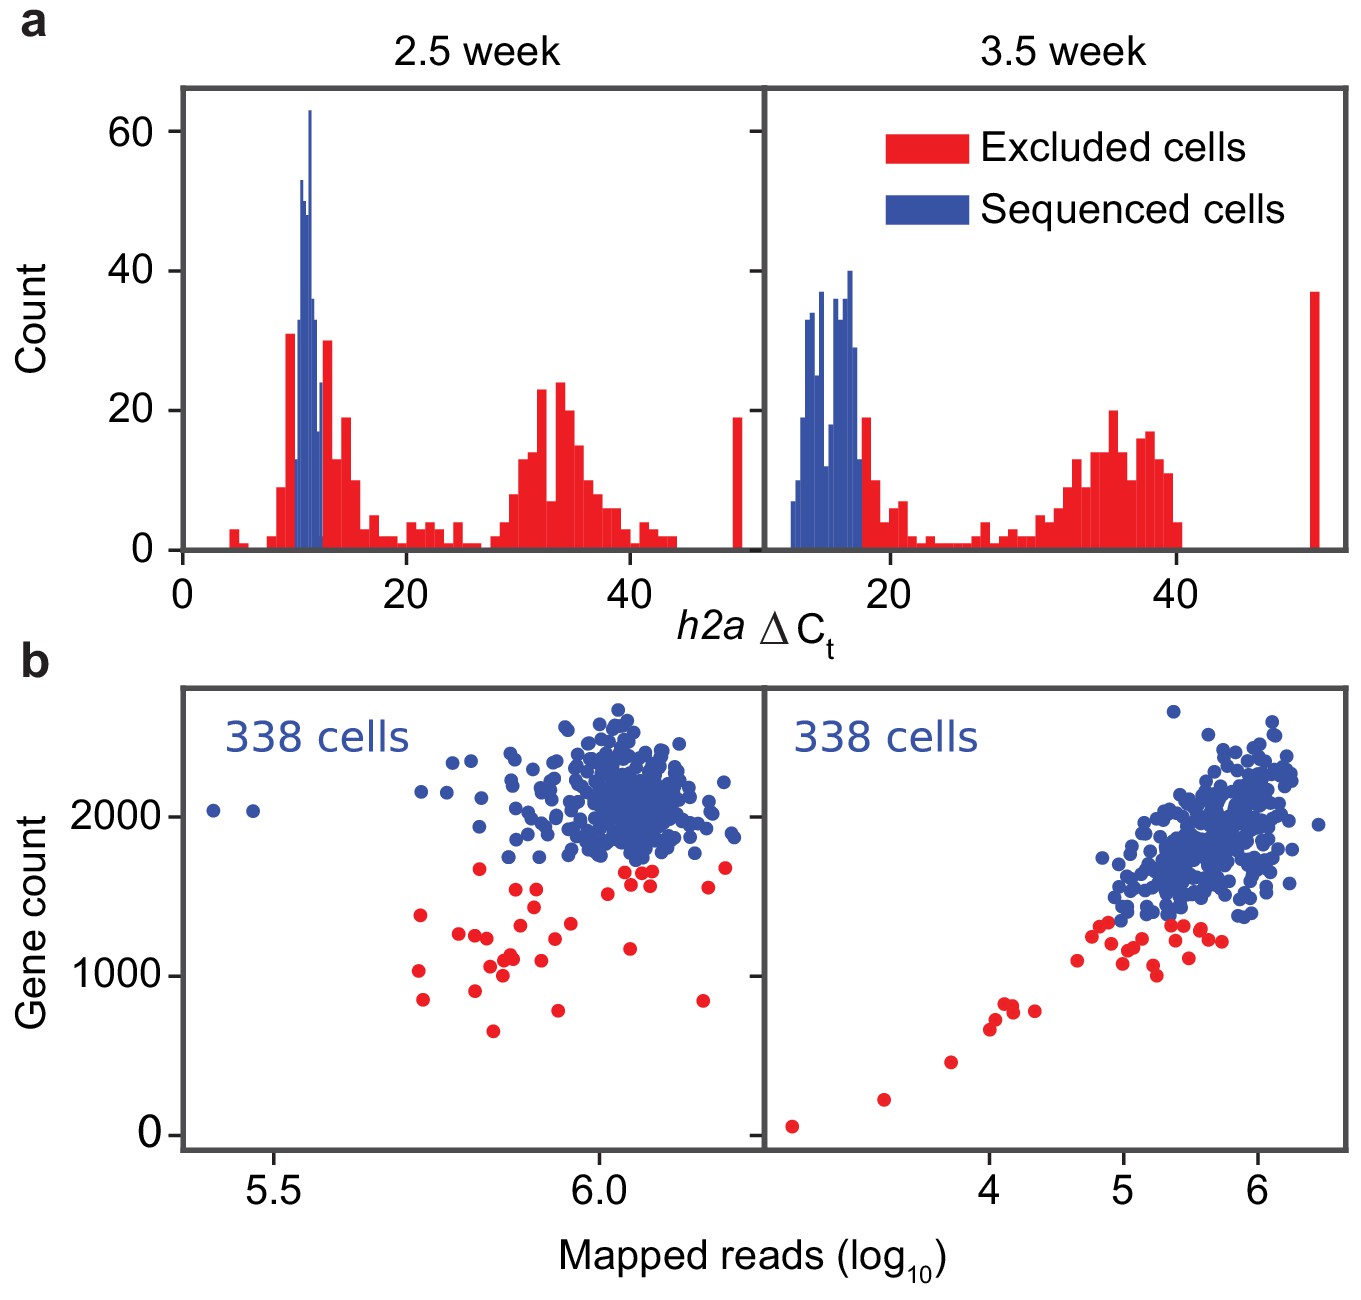
Quality control of library preparation and sequencing of the schistosome stem cells.
(a) Histograms of h2a qPCR measurements in 2.5- (left) and 3.5- (right) week post infection samples. (b) Scatter plot of gene count (>2 TPM) vs. mapped read count of individual sequenced cells. Cells with low gene count or h2a expression are discarded and filtered from analysis (red) and the remaining cells are analyzed (blue). The number of final cells kept for analysis is specified on the top left corner of each plot.
Figure 1—figure supplement 2
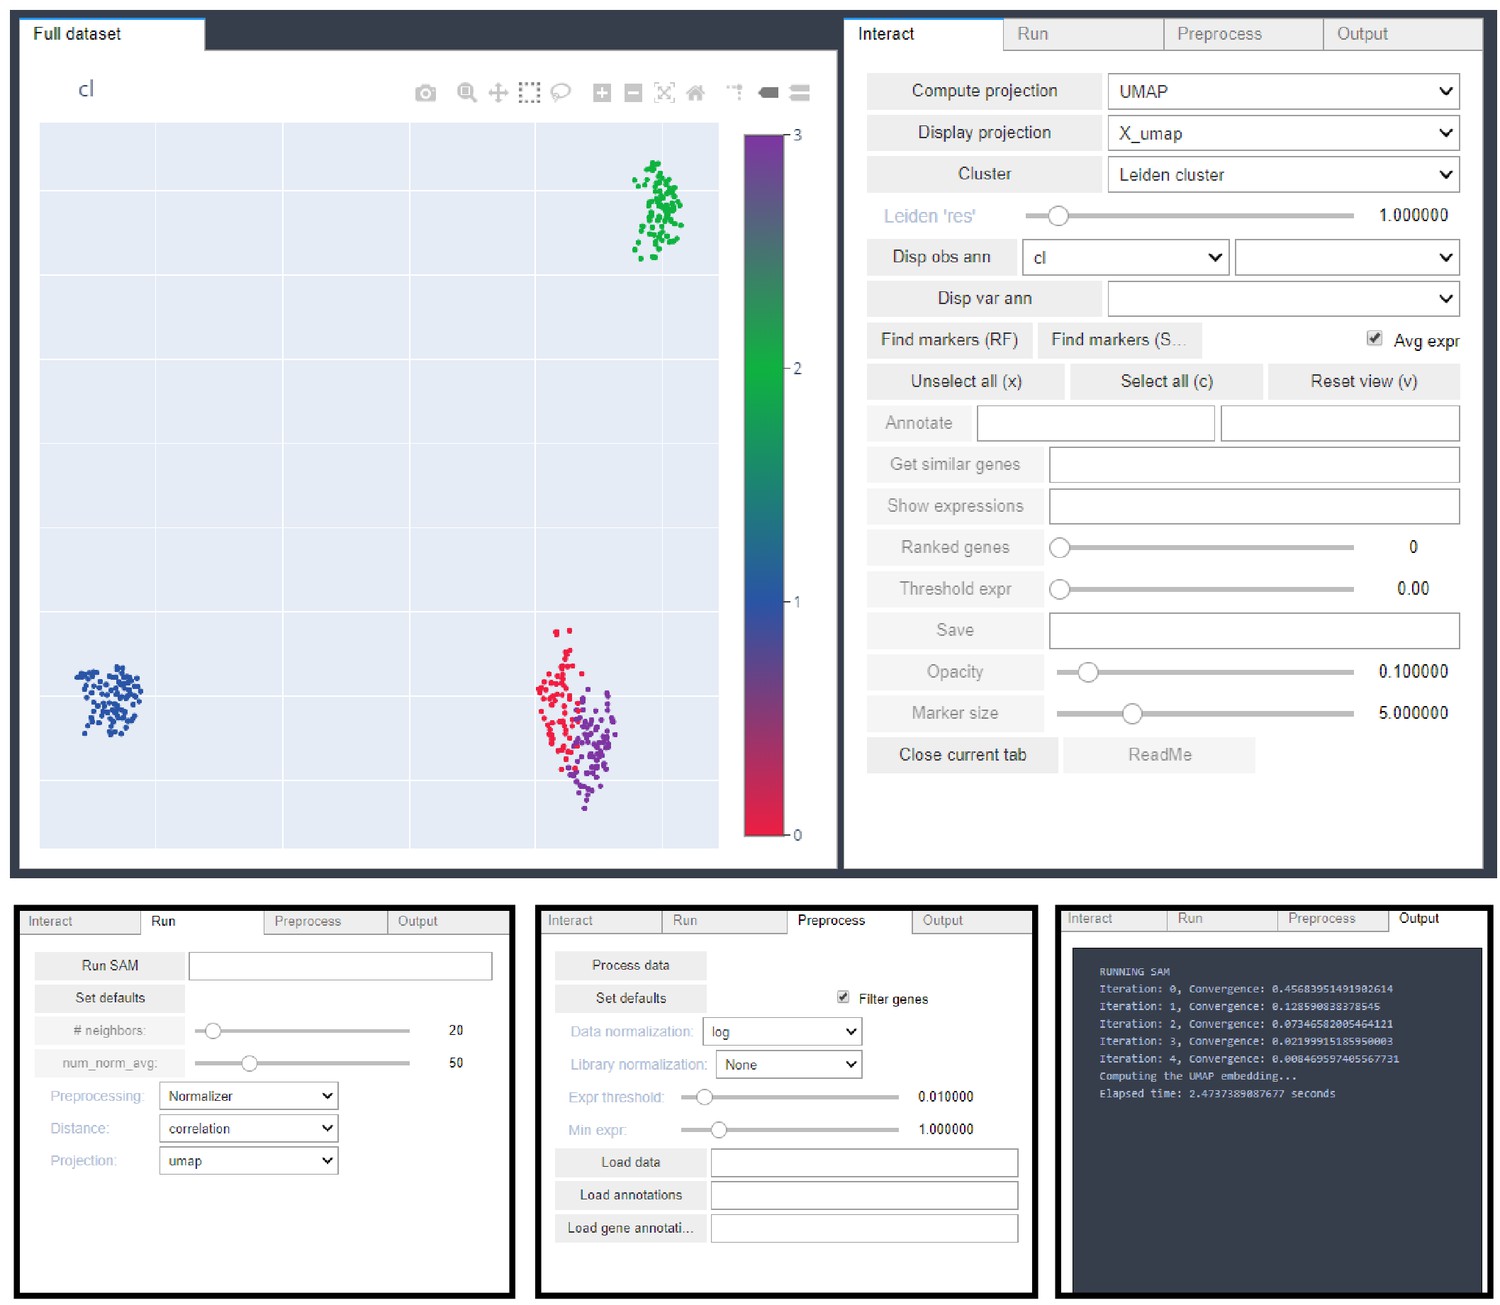
A user interface for interactively exploring single-cell data using SAM.
An interactive Jupyter notebook interface provided by the SAM package facilitates convenient visualization of single cell data (upper left) and changing of SAM parameters using various control panels (upper right, and bottom). This interface allows clustering, subclustering, visualizing of gene expression, and many other applications.
Figure 2 with 1 supplement
SAM identifies novel subpopulations within schistosome stem cells.
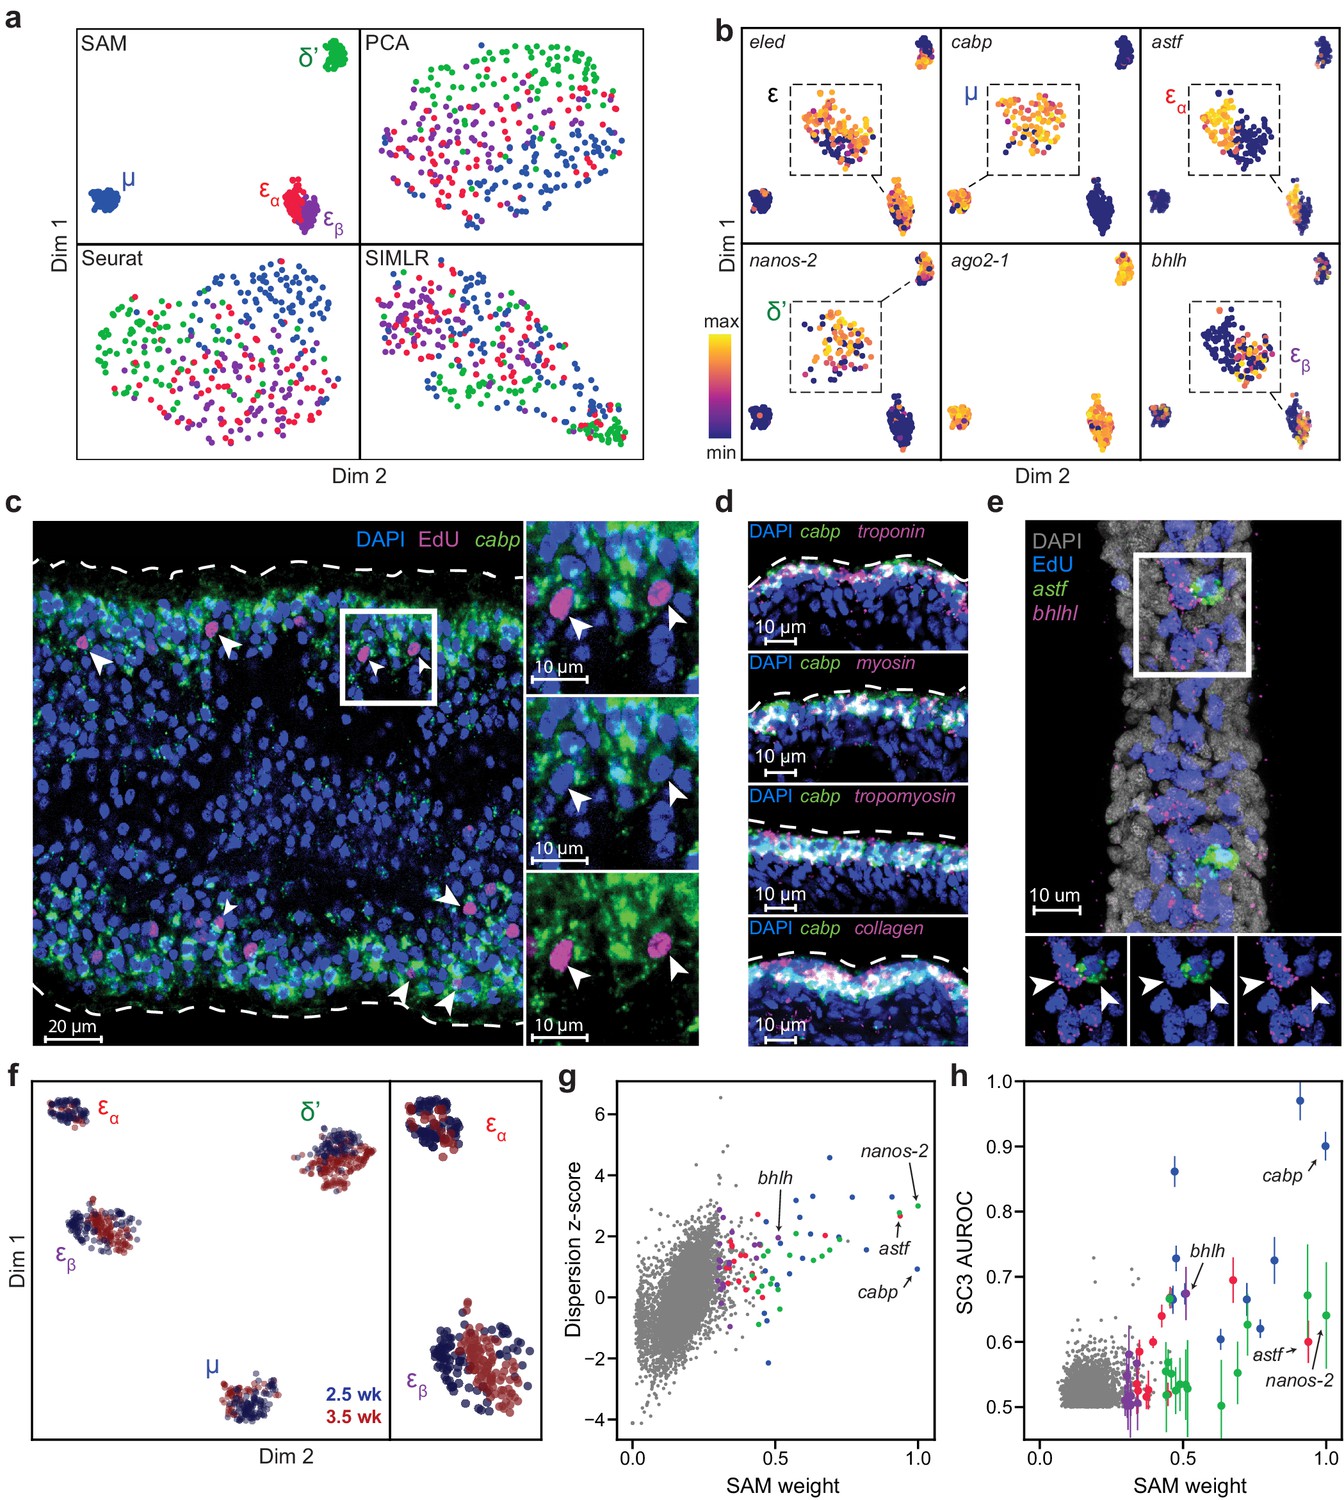
(a) UMAP projections of the manifolds reconstructed by SAM, PCA, and Seurat. SIMLR outputs its own 2D projection based on its constructed similarity matrix using a modified version of t-SNE. The schistosome cells are color-coded by the stem cell subpopulations μ, δ’, εɑ, and εβ determined by Louvain clustering. (b) UMAP projections with gene expressions of subpopulation-specific markers (eledh, nanos-2, cabp, astf, bhlh,) and a ubiquitous stem cell marker, ago2-1, overlaid. Insets: magnified views of the expressing populations. (c) FISH of cabp and EdU labeling of dividing stem cells in juvenile parasites at 2.5 weeks post-infection show that μ-cells (cabp+EdU+, arrowheads) are close to the parasite surface and beneath a layer of post-mitotic cabp+ cells. Dashed outline: parasite surface. Right: magnified views of the boxed region. (d) FISH of cabp and a set of canonical muscle markers, troponin, myosin, tropomyosin, and collagen, shows colocalization in post-mitotic cabp+ cells. Images in (c–d) are single confocal slices. (e) FISH of astf and bhlh shows their orthogonal expression in adjacent EdU+ cells (arrowheads). Bottom: magnified views of the boxed region. Image is a maximum intensity projection of a confocal stack with a thickness of 12 µm. (f) UMAP projection of stem cells isolated from juveniles at 2.5 and 3.5 weeks post-infection. Cell subpopulation assignments based on marker gene expressions are specified. Right: a magnified view to show the mapping of εɑ- and εβ-cells. (g) Standardized dispersions as calculated by Seurat plotted vs. the SAM gene weights. (h) SC3 AUROC scores plotted vs. the SAM gene weights. Error bars indicate the standard deviation of SC3 AUROC scores between trials using different chosen numbers of clusters. In (g) and (h), the top 20 genes specific to each subpopulation are colored according to the color scheme used in (a).
Figure 2—figure supplement 1
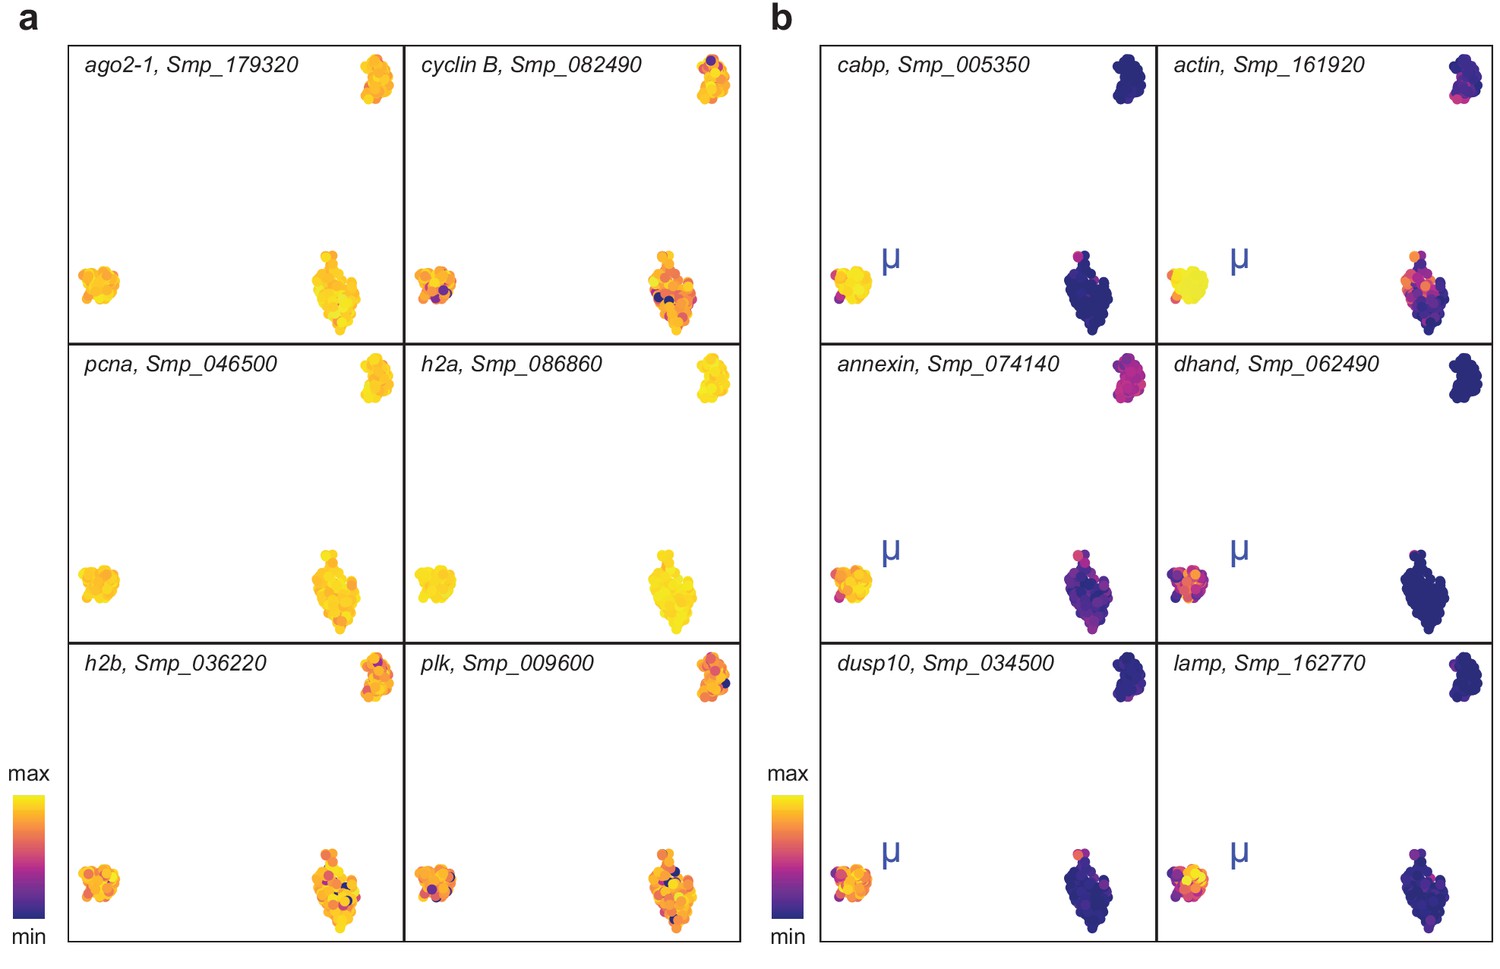
μ-cells express ubiquitous stem cell marker and population specific genes.
UMAP projections with gene expressions of (a) stem cell markers and (b) μ-cell-specific genes overlaid.
Figure 3 with 1 supplement
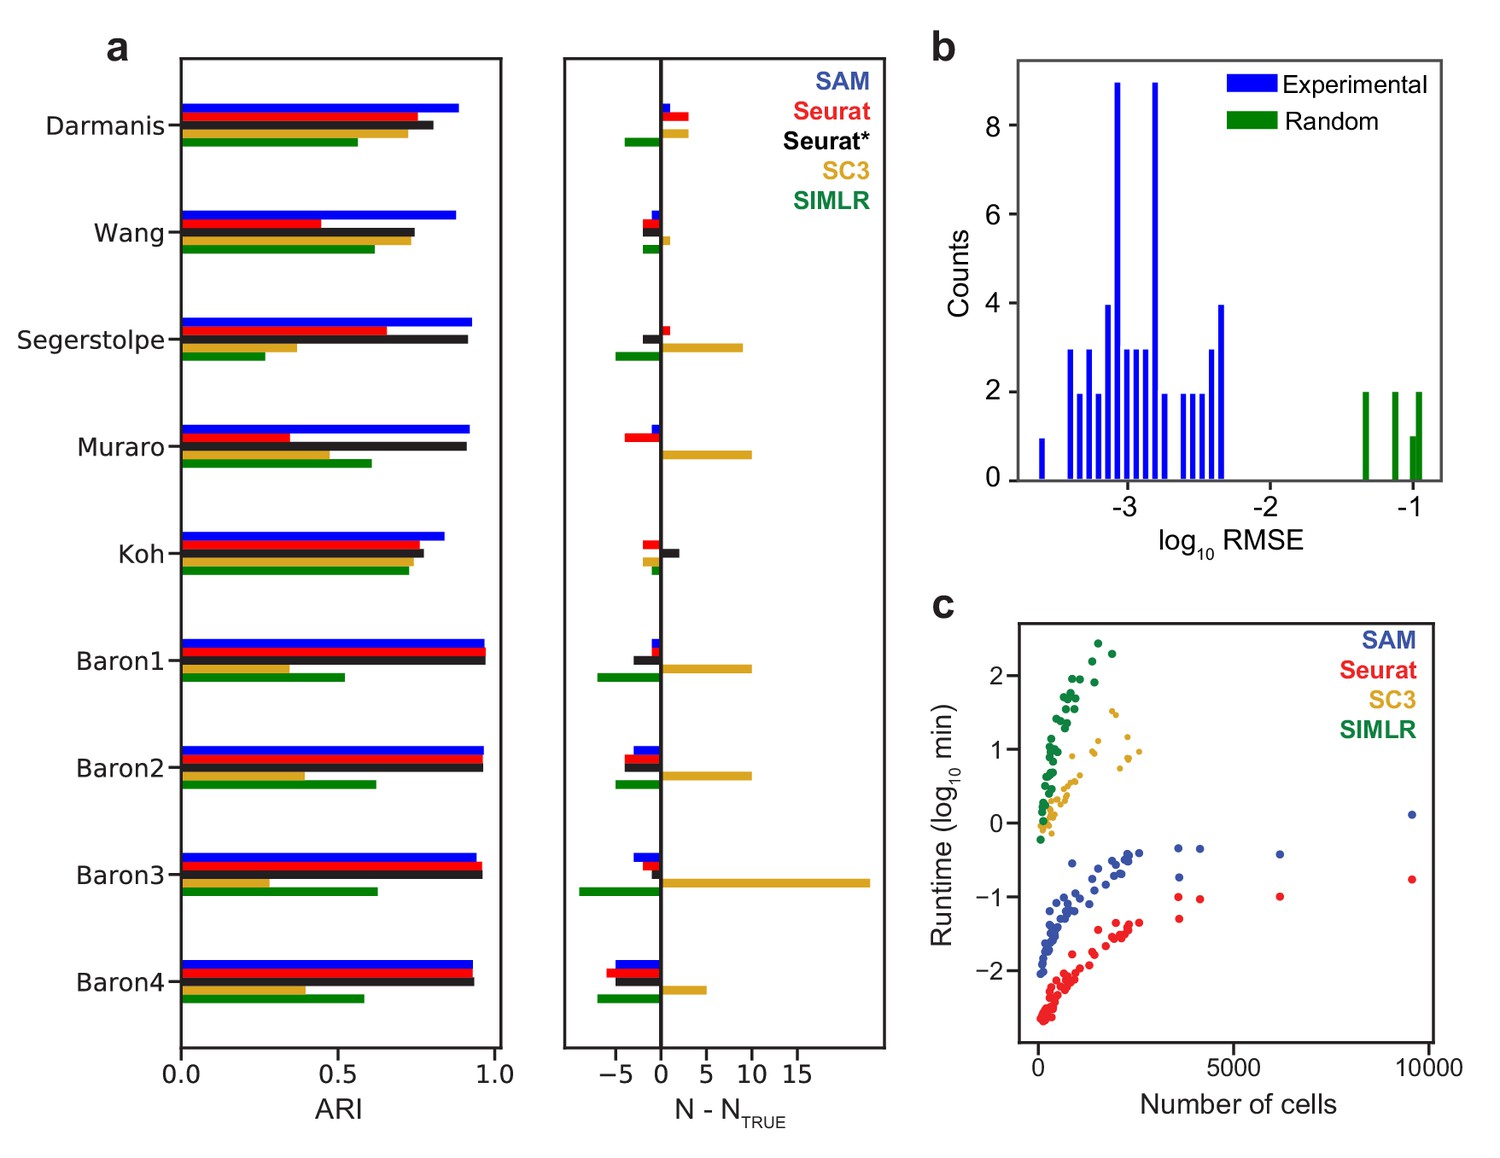
SAM improves clustering accuracy and runtime performance.
(a) Accuracy of cluster assignment quantified by adjusted rand index (ARI) on nine annotated datasets (left). Right: differences between the number of clusters found by each method (N) and the number of annotated clusters (NTRUE). Smaller differences indicate more accurate clustering. Seurat* denotes Seurat analysis using parameters that maximize ARI. (b) RMSE of gene weights output by SAM averaged across ten replicate runs with random initial conditions for 56 datasets (blue) and simulated datasets with no intrinsic structure (green, Materials and methods). (c) Runtime of SAM, SC3, SIMLR, and Seurat as a function of the number of cells in each dataset. SC3 and SIMLR were not run on datasets with >3000 cells as the run time exceeds 20 min.
Figure 3—figure supplement 1
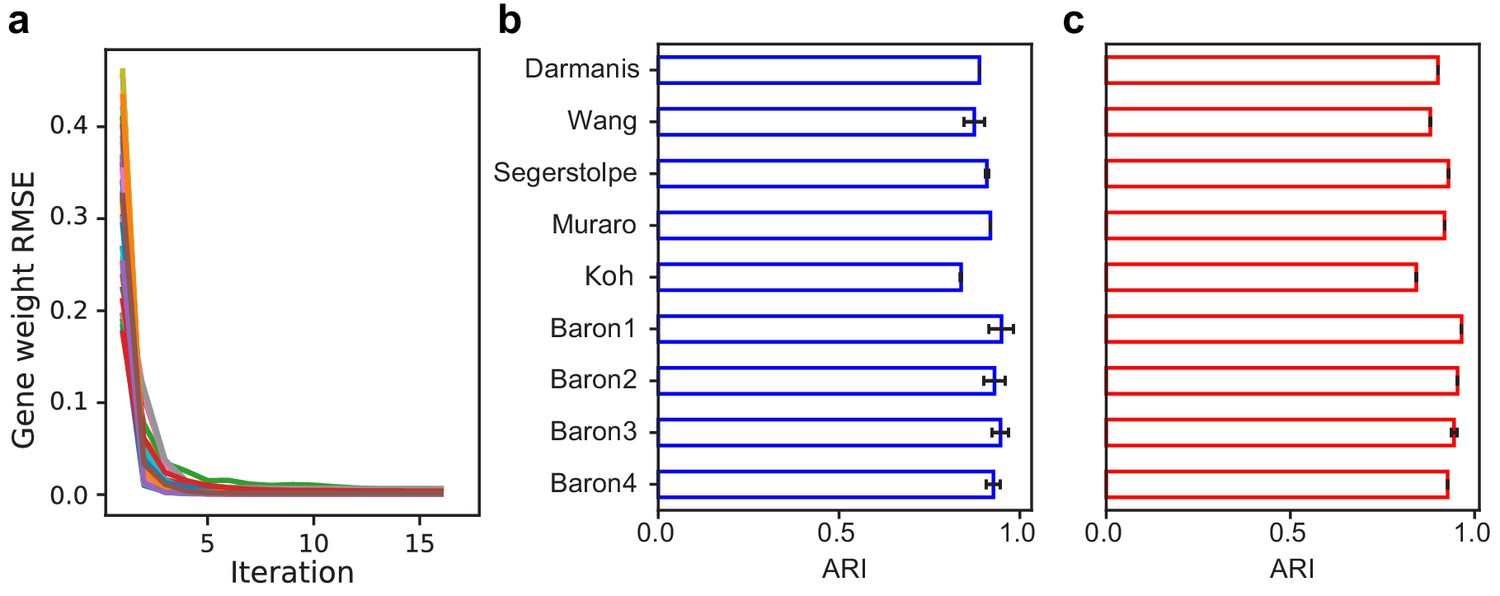
SAM converges to a stable solution independent of random initial conditions and is robust to the number of nearest neighbors and choice of distance metric.
(a) RMSE of gene weights between adjacent iterations within a run, averaged across ten replicate runs for all datasets. (b–c) Average ARI scores for the nine annotated benchmarking datasets when varying (b) the number of nearest neighbors, k, from 10 to 30 or (c) the choice of distance metric (Euclidean or Pearson correlation). Error bars indicate standard deviations of ARI scores across the different values of k and distance metrics. The errors for data with no error bars are too small to be seen.
Figure 4
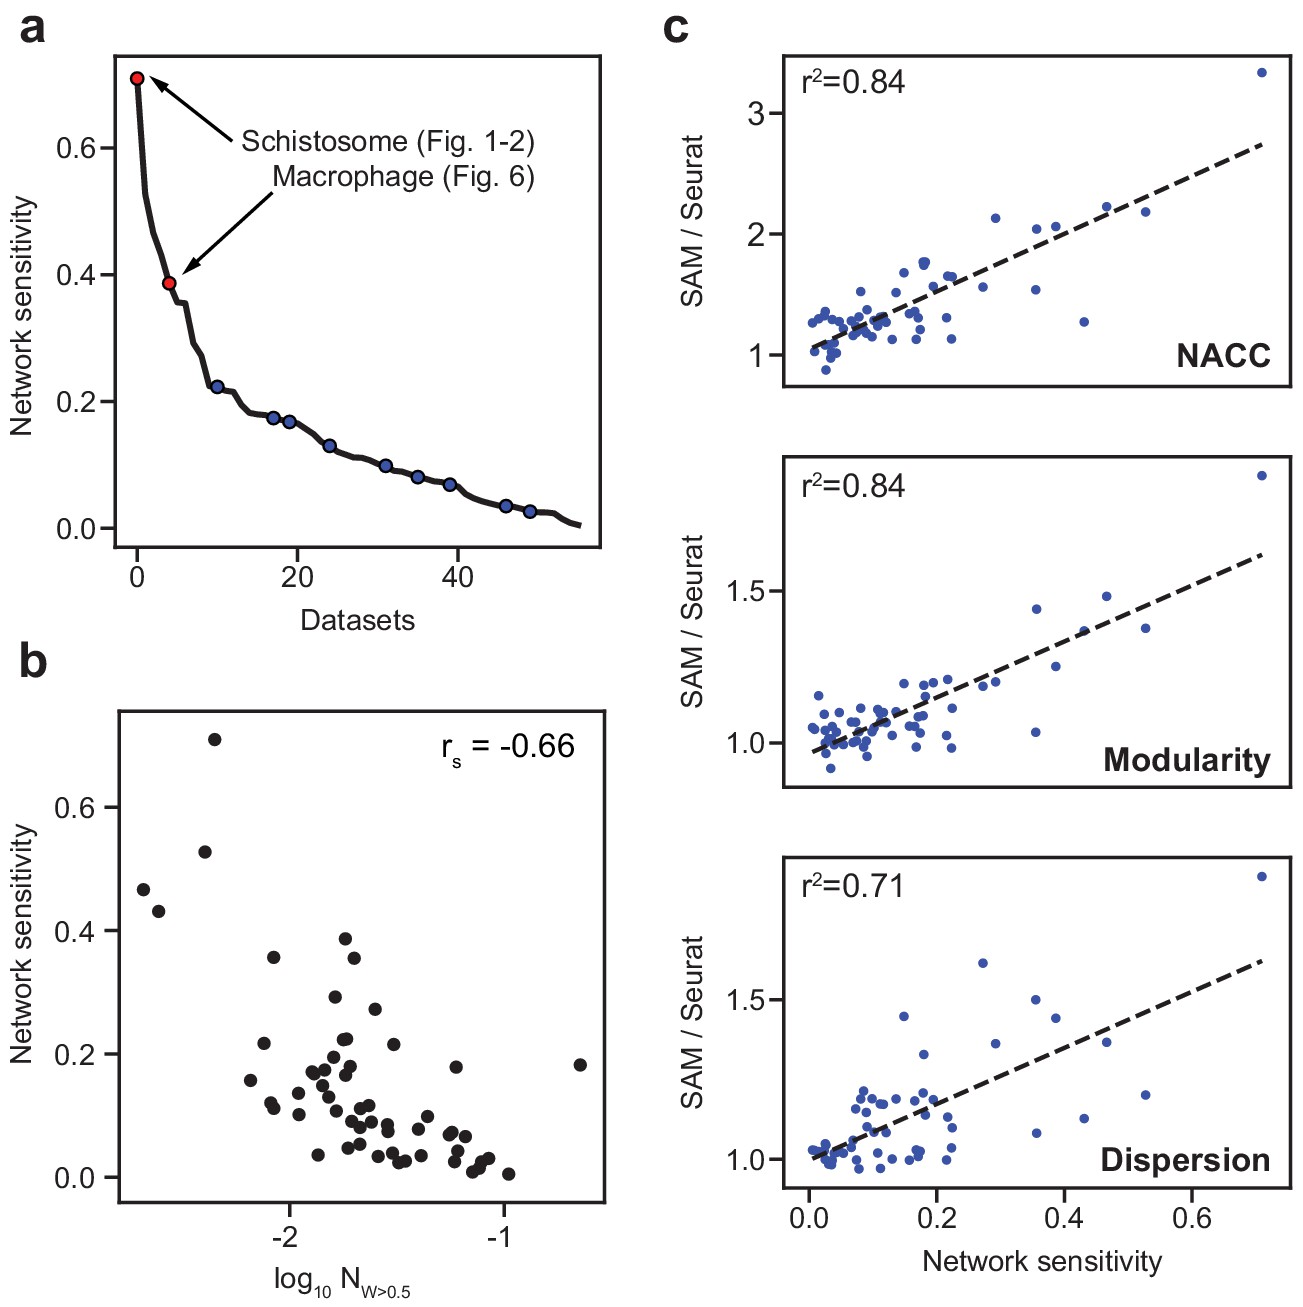
SAM improves the analysis of datasets with varying network sensitivities.
(a) Network sensitivity of all 56 datasets ranked in descending order. Blue: the nine benchmarking datasets used in Figure 3a. Sensitivity measures the robustness of a dataset to changes in which features are selected (Materials and methods). (b) The network sensitivity plotted against the fraction of genes with SAM weight greater than 0.5 (in log scale) with Spearman correlation coefficient specified in the upper-right corner. (c) Fold improvement of SAM over Seurat for NACC, modularity, and spatial dispersion with respect to sensitivity for all 56 datasets. These ratios are linearly correlated with network sensitivity with Pearson correlations (r2) specified in the upper-left corner of each plot.
Figure 5
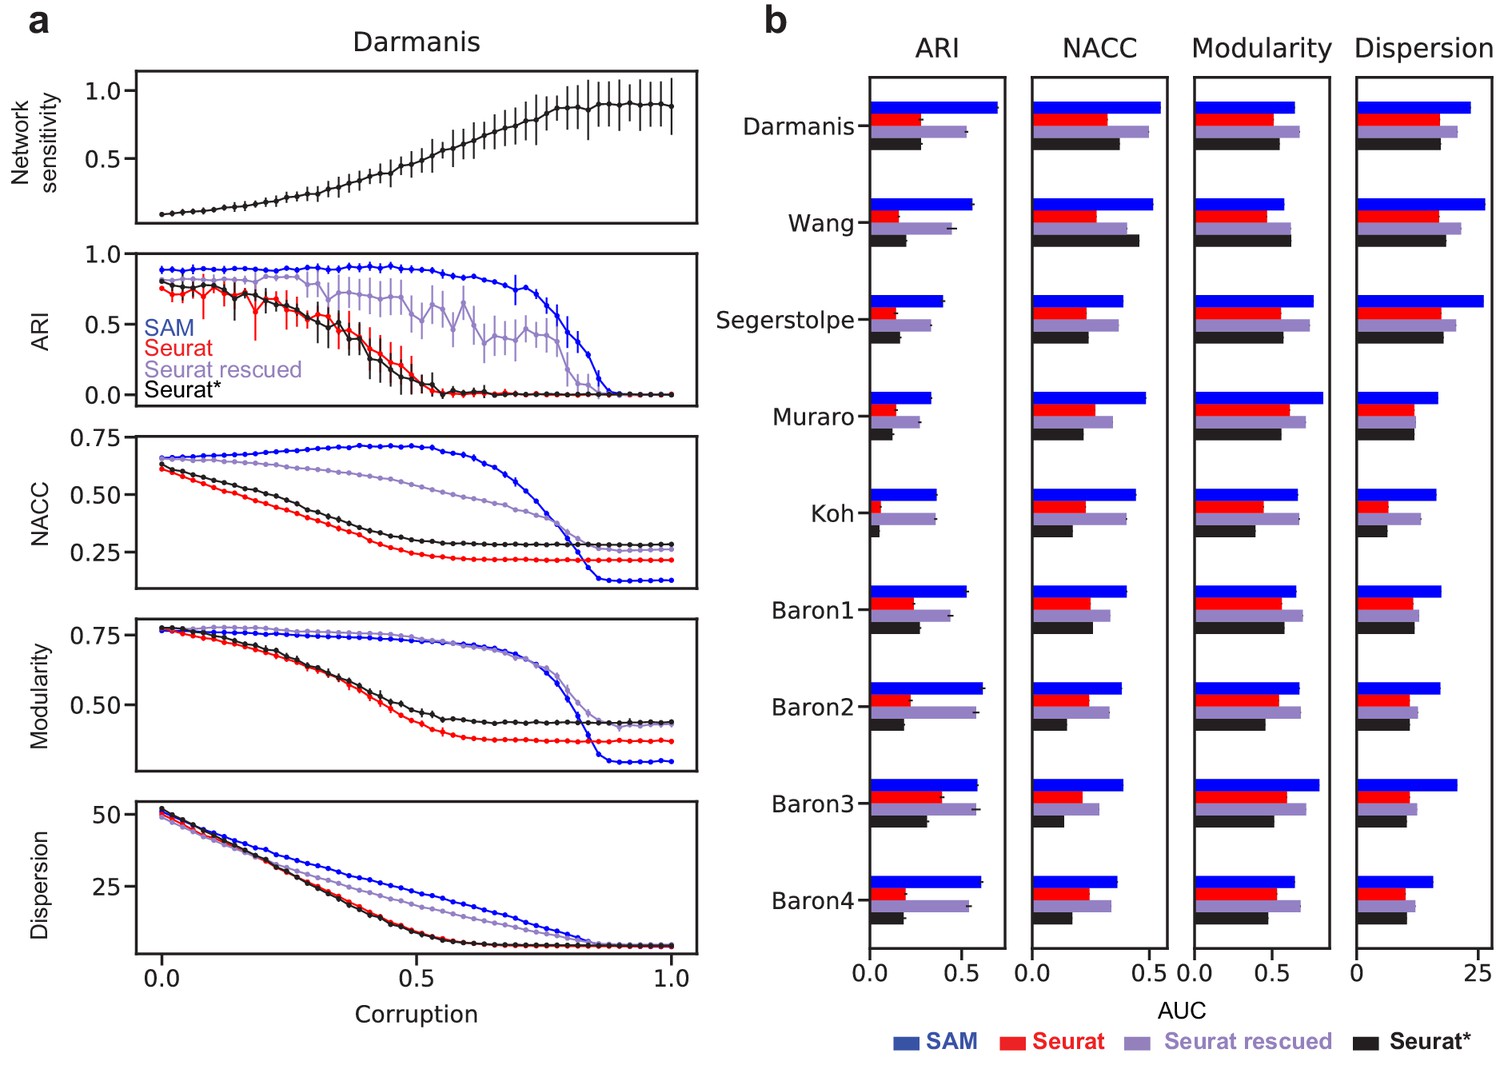
Robust feature selection improves cell clustering and manifold reconstruction.
(a) Network sensitivity, ARI, NACC, modularity, and spatial dispersion with respect to corruption of the Darmanis dataset, in which we randomly permute fractions of the data ranging from 0 to 100% of the total number of elements (Materials and methods). Performance is compared between SAM (blue), Seurat (red), Seurat with optimal parameters (black), and Seurat rescued with the top-ranked SAM genes (indigo). Error bars indicate the standard deviations across 10 replicate runs. The errors for points with no bars are too small to be seen. (b) Comparison of the area under curve (AUC) of the metrics in (a) with respect to data corruption for all nine datasets. Error bars indicate the standard deviations across 10 replicate runs. The errors for data with no error bars are too small to be seen.
Figure 6 with 2 supplements
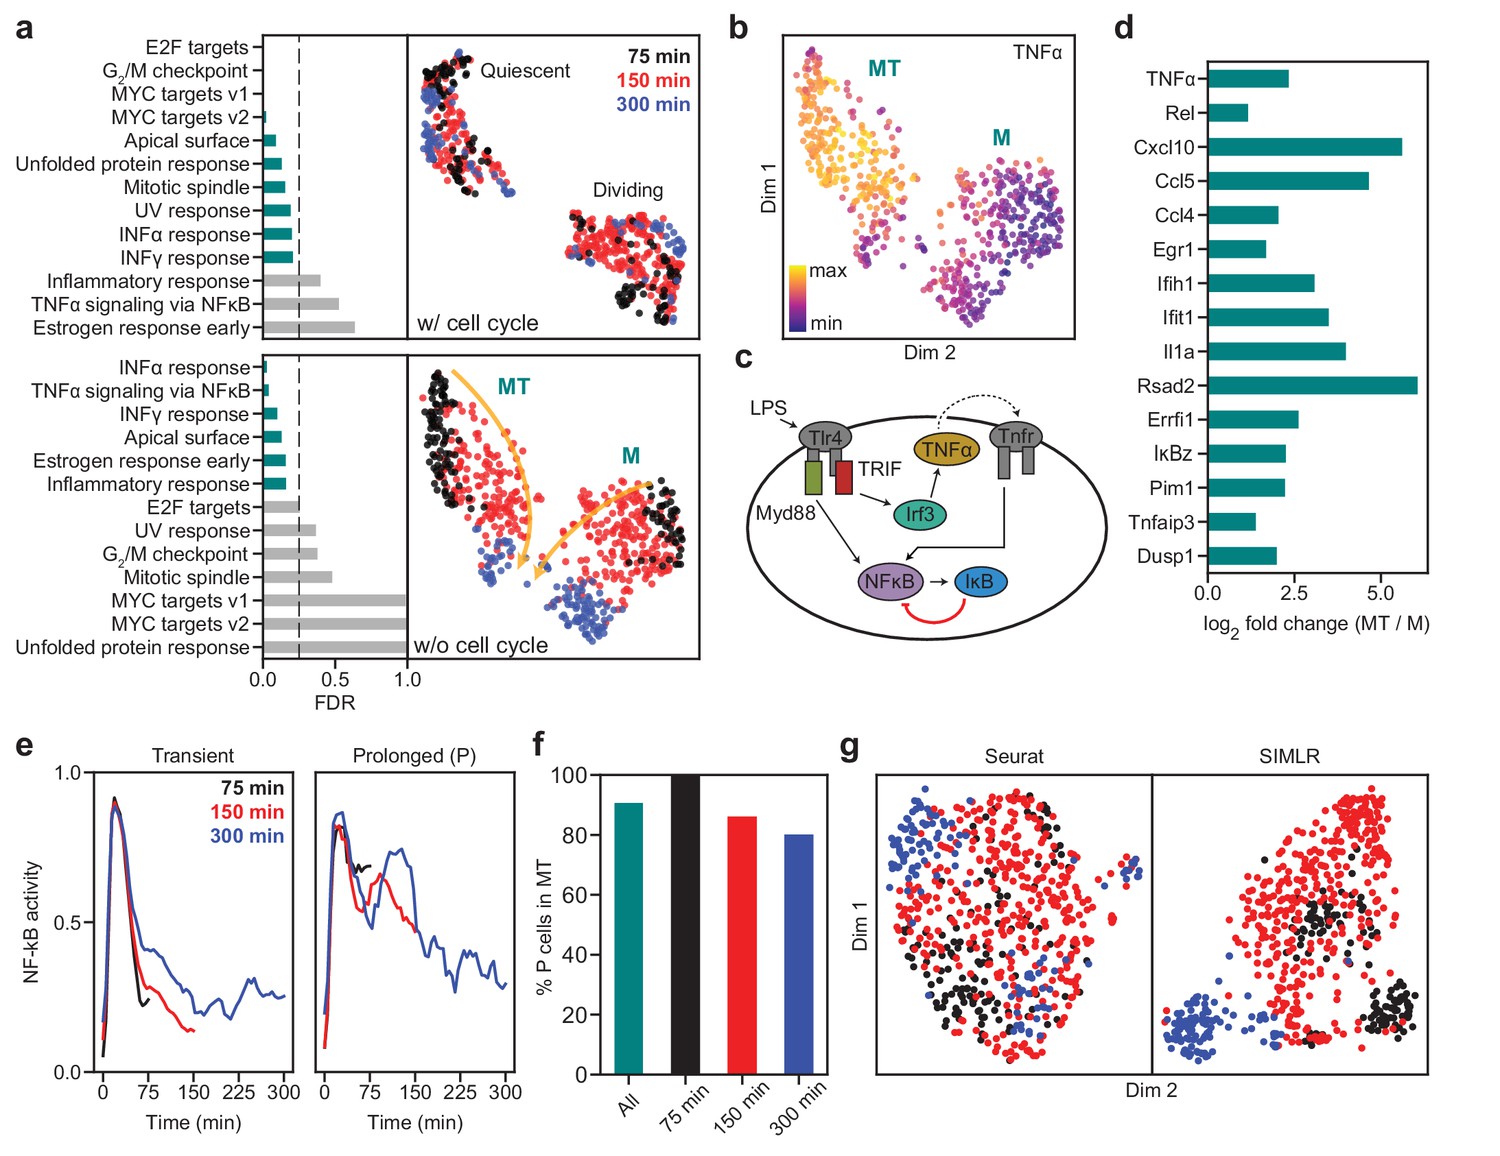
SAM captures the cellular activation dynamics in a stimulated macrophage dataset.
(a) GSEA analysis (left) and UMAP projections (right) of the activated macrophages before (top) and after (bottom) removing cell cycle effects. Teal: significantly enriched gene sets determined by the significance threshold of 0.25 for the False Discovery Rate (FDR, dashed lines). Bottom: the two clusters are denoted as MT and M with colors representing the time since LPS induction. Arrows: evolution of time. (b) TNFα is enriched in the MT cluster. (c) Diagram of NF-κB activation in response to LPS stimulation via the Myd88 and TRIF signaling pathways. (d) Log2 fold changes of the average expressions of selected inflammatory genes in the MT cluster vs. the M cluster. All genes are significantly differentially expressed between the two clusters according to the Welch’s two-sample t-test (). (e) Representative traces for transient (left) and prolonged (right) NF-κB activation (Materials and methods). (f) Cells with prolonged NF-κB response (denoted as P) are primarily in the MT population. (g) Seurat and SIMLR projections show that they fail to order the cells by time since LPS induction and do not identify cell clusters representing the different modes of NF-κB activation.
Figure 6—figure supplement 1
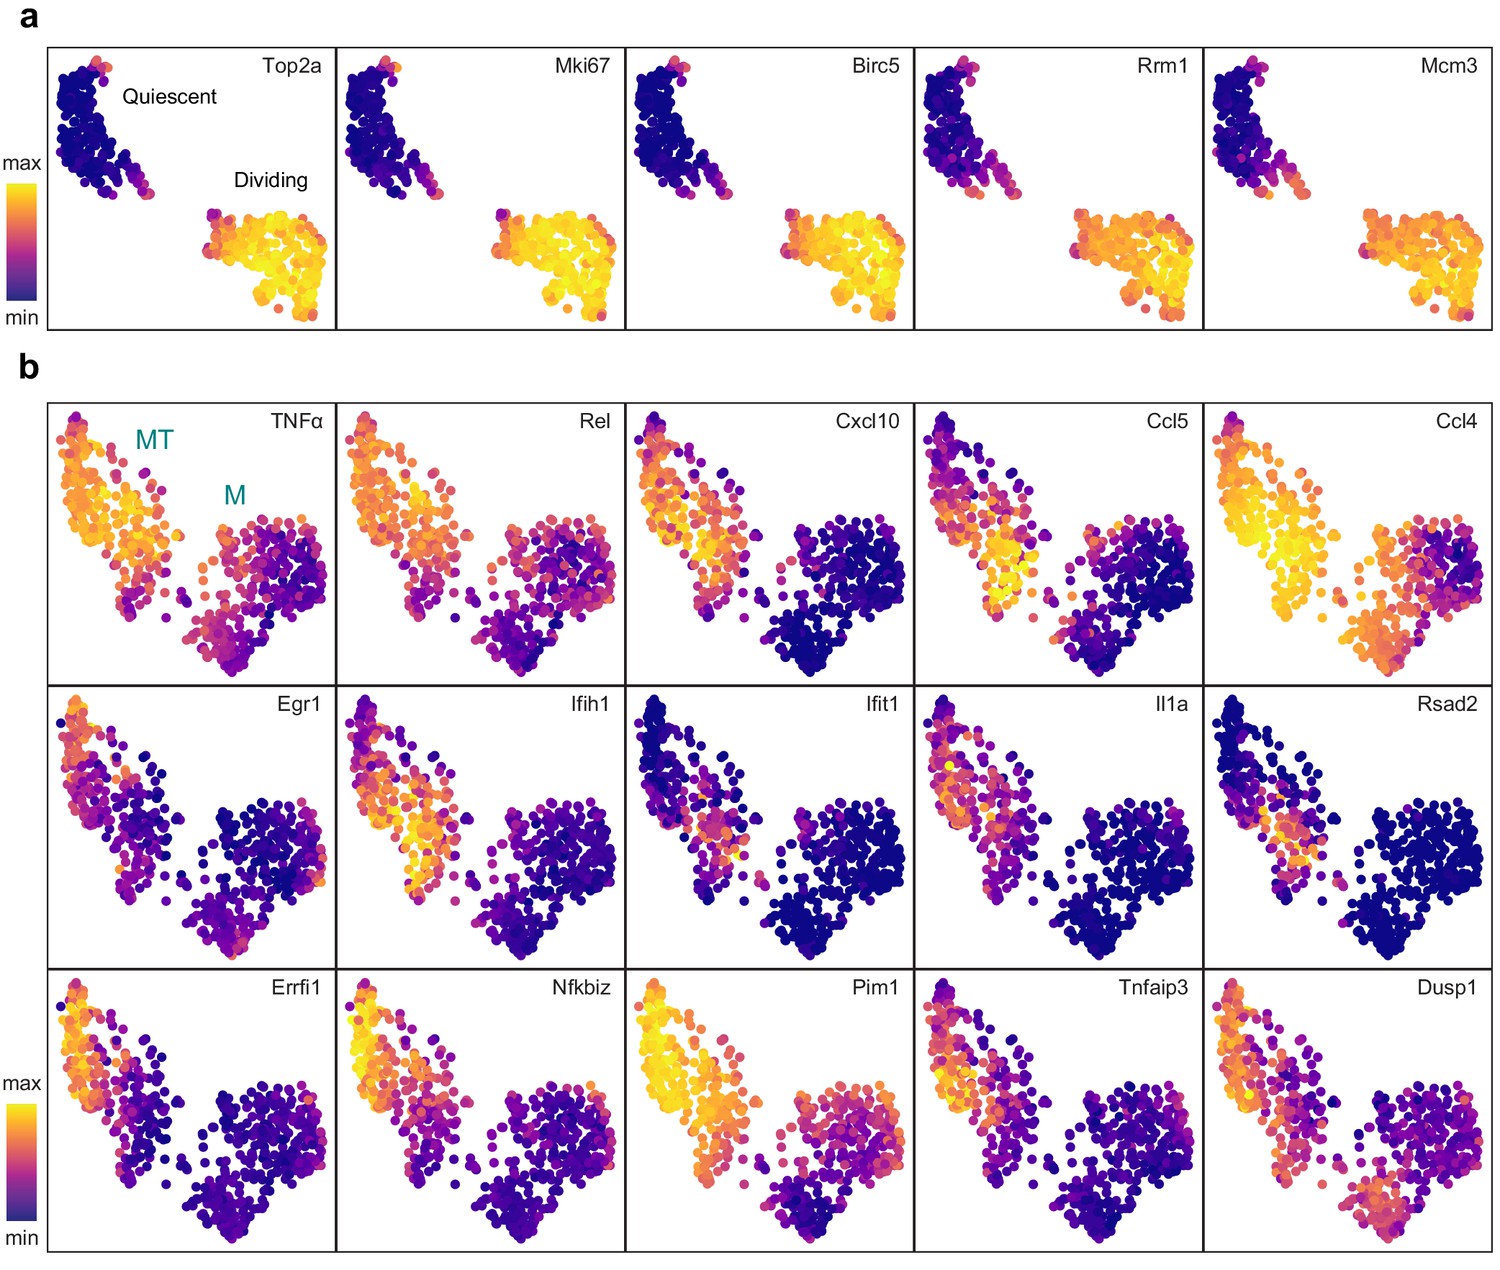
Cluster-specific marker genes before and after removing cell cycle effects.
UMAP projections with marker genes specific to the dividing cells (a) and the MT cluster (b) overlaid.
Figure 6—figure supplement 2
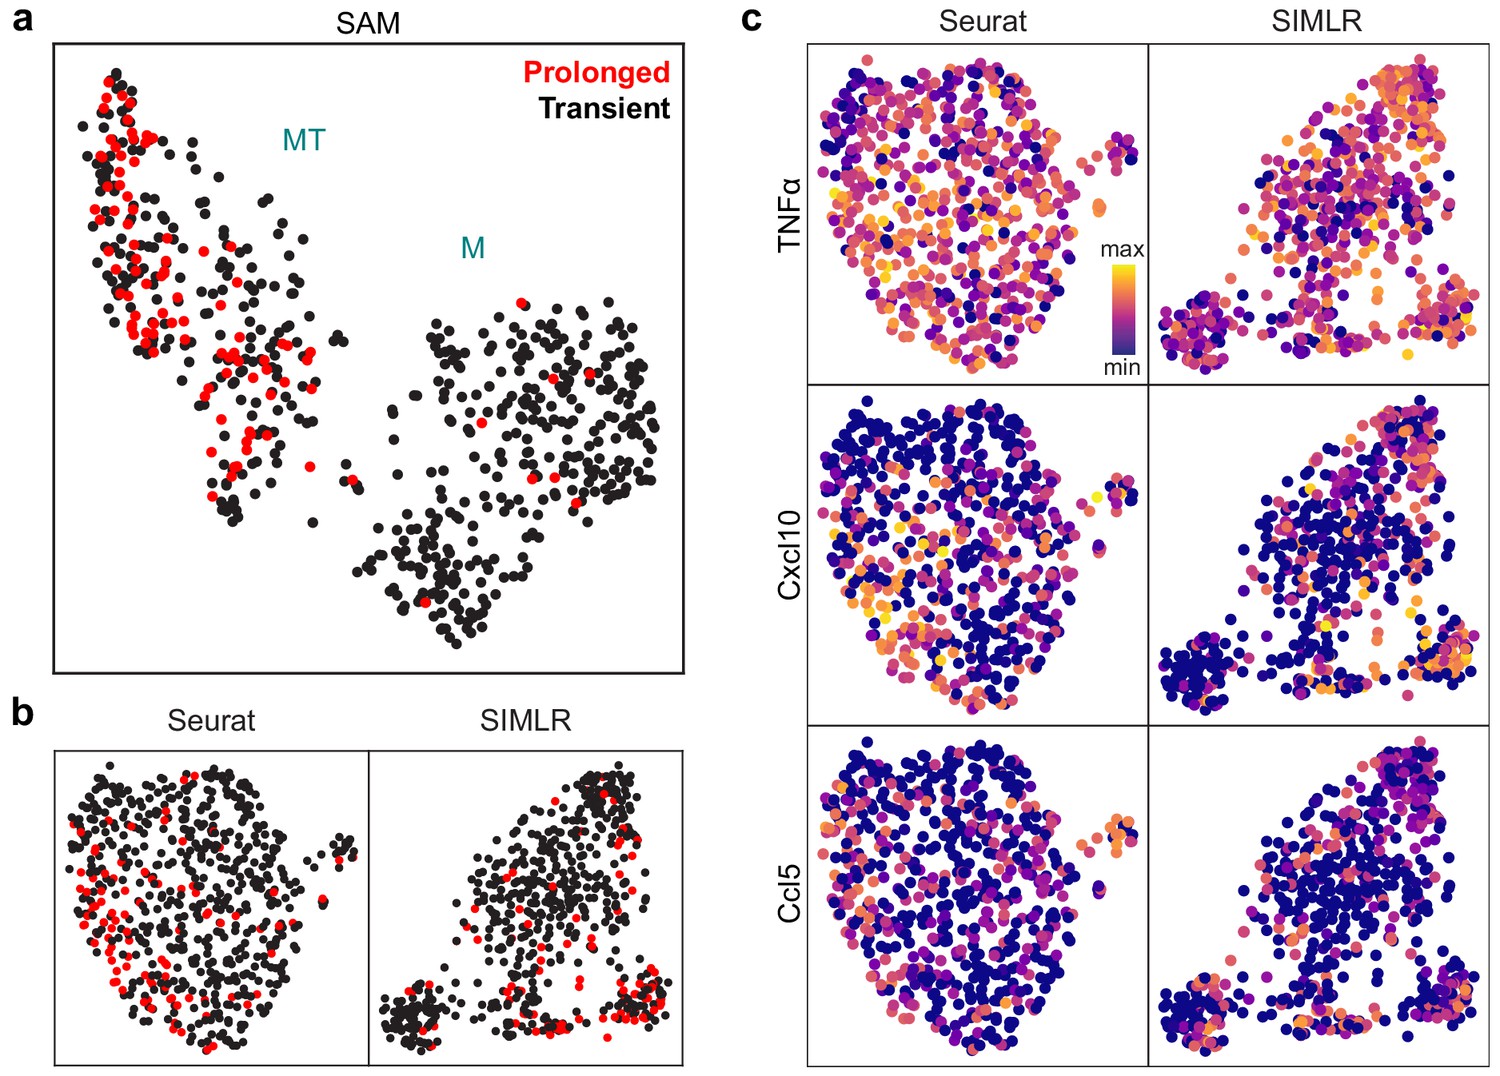
SAM groups cells based on NF-κB activation dynamics while other methods cannot.
(a) UMAP projection of the macrophage cells after the removal of cell cycle effects. Cells with prolonged NF-κB dynamics are highlighted in red. (b) UMAP and t-SNE projections for Seurat and SIMLR, respectively, after the removal of cell cycle effects. Cells with prolonged NF-κB dynamics are highlighted in red. (c) UMAP projections for Seurat and SIMLR with three MT-specific marker gene expressions overlaid.
Tables
Key resources table
| Reagent type (species) or resource | Designation | Source or reference | Identifiers | Additional information |
|---|---|---|---|---|
| Commercial assay or kit | SsoAdvanced Universal SYBR Green Supermix | Biorad | 1725270 | qPCR |
| Commercial assay or kit | Quant-iT PicoGreen dsDNA Assay Kit | Thermo-Fisher | P7589 | cDNA quantification |
| Peptide, recombinant protein | RNase Inhibitor | Takara Bio | 2313B | RT mix |
| Chemical compound, drug | dNTP Set 100 mM solutions | Thermo-Fisher | R0181 | RT mix and cDNA pre-amplification |
| Sequence-based reagents | 100 µM oligo-dT | IDT | AAGCAGTGGTATCAACGCAGAGTACT(30)VN | |
| Sequence-based reagents | 100 µM TSO | Exiqon | AAGCAGTGGTATCAACGCAGAGTACATrGrG+G | |
| Commercial assay or kit | ERCC RNA Spike-In Mix | Thermo-Fisher | 4456740 | RT mix |
| Chemical compound, drug | 10% Triton X-100 | Thermo-Fisher | 28314 | RT mix |
| Peptide,recombinant protein | SMARTscribe reverse transcriptase | Takara Bio | 639538 | RT mix |
| Chemical compound, drug | 100 mM DTT | Promega | P1171 | RT mix |
| Chemical compound, drug | 5 M Betaine | Thermo-Fisher | B0300-1VL | RT mix |
| Commercial assay or kit | Kapa Hotstart Ready Mix | Roche | KK2602 | cDNA pre-amplification |
| Sequence-based reagents | 100 μM IS_PCR primer | IDT | AAGCAGTGGTATCAACGCAGAGT | |
| Peptide, recombinant protein | lambda exonuclease | NEB | M0262S | Depletion of primer dimers |
| Commercial assay or kit | Ampure purification beads | NEB | M0262S | DNA purification |
| Commercial assay or kit | TG Nextera XT DNA Sample Preparation Kit | Illumina | FC-131–1096 | Library preparation |
| Commercial assay or kit | TG Nextera XT Index Kit v2 Set A (96 Indices, 384 Samples) | Illumina | TG-131–2001 | Library preparation |
| Strain, strain background (S. mansoni) | NMRI | BEI Resources | NR-21963 | |
| Antibody | Anti-Digoxigenin-POD, Fab fragments from sheep | Roche | 11207733910 | (1:1,000); FISH experiments |
| Antibody | Anti-Fluorescein-POD, Fab fragments from sheep | Roche | 11426346910 | (1:1,500); FISH experiments |
| Peptide, recombinant DNA reagents | Plasmid-pJC53.2 | Addgene | 26536 | Cloning vector |
| Chemical compound, drug | Cy5-azide | Click Chemistry Tools | AZ118 | EdU detection |
| Chemical compound, drug | 5-ethynyl-2-deoxyuridine (EdU) | Invitrogen | A10044 | |
| Chemical compound, drug | Vybrant DyeCycle Violet (DCV) | Invitrogen | V35003 | FACS |
| Chemical compound, drug | TOTO-3 | Invitrogen | T3604 | FACS |
Additional files
-
Supplementary file 1
Ranked gene list with high SAM weights in the schistosome stem cell data.
Gene IDs and annotations are given in the S. mansoni genome version 9 (WormBase, WS268). Genes are assigned to the cluster corresponding to the marker gene, nanos-2, cabp, astf, or bhlh, with which they have the highest correlation. Genes found in our prior work (Wang et al., 2018) to be enriched in subsets of stem cells are specified.
- https://doi.org/10.7554/eLife.48994.015
-
Supplementary file 2
Datasets used in this study.
Accession numbers, library size normalization methods, data preprocessing methods, sensitivity scores, and corresponding references are provided for each dataset. Accession numbers with asterisks indicate datasets that are sourced from the conquer database (Soneson and Robinson, 2018). Accession numbers with crosses indicate the nine well-annotated datasets that were used for benchmarking.
- https://doi.org/10.7554/eLife.48994.016
-
Supplementary file 3
ARI clustering accuracy of individual annotated cell types.
The ARI scores of SAM, Seurat, SC3, and SIMLR applied to the nine benchmarking datasets are provided for each annotated ground truth cluster.
- https://doi.org/10.7554/eLife.48994.017
-
Supplementary file 4
Cloning primer sequences used for generating riboprobes for the FISH experiments and primer sequences for qPCR analysis.
Functional annotations of the genes were given in the S. mansoni genome version 9 (WormBase, WS268).
- https://doi.org/10.7554/eLife.48994.018
-
Transparent reporting form
- https://doi.org/10.7554/eLife.48994.019
Download links
A two-part list of links to download the article, or parts of the article, in various formats.
Downloads (link to download the article as PDF)
Open citations (links to open the citations from this article in various online reference manager services)
Cite this article (links to download the citations from this article in formats compatible with various reference manager tools)
Self-assembling manifolds in single-cell RNA sequencing data
eLife 8:e48994.
https://doi.org/10.7554/eLife.48994


