Deep-learning-based three-dimensional label-free tracking and analysis of immunological synapses of CAR-T cells
- Department of Physics, Korea Advanced Institute of Science and Technology (KAIST), Republic of Korea
- KAIST Institute for Health Science and Technology, Republic of Korea
- Department of Biological Sciences, Korea Advanced Institute of Science and Technology, Republic of Korea
- Curocell Inc, Republic of Korea
- Tomocube Inc, Republic of Korea
Figures
Figure 1 with 1 supplement
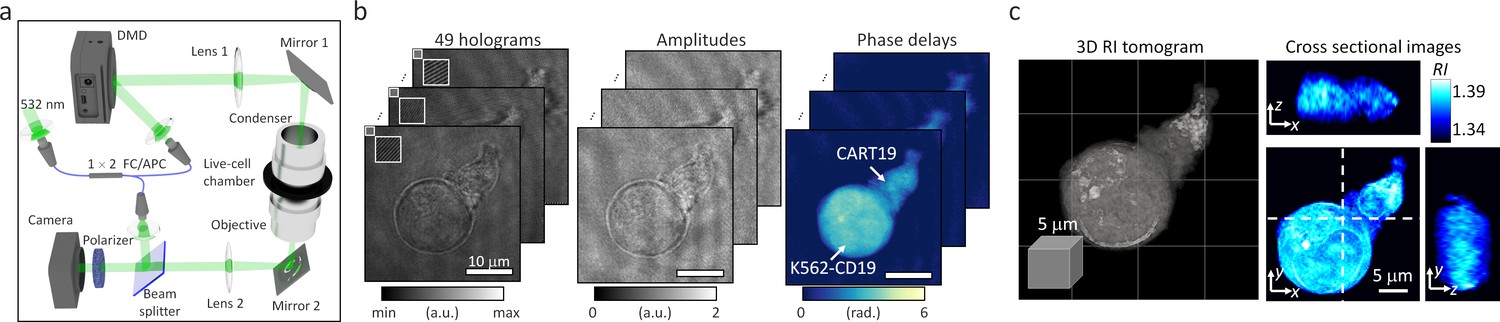
Data acquisition in optical diffraction tomography (ODT).
(a) The experimental setup for ODT is based on a digital micro-mirror device (DMD) for high-speed illumination scanning. (b) Forty-nine holograms of 1:1 conjugate between a CART19 and a K562-CD19 cell were recorded at various illumination angles, and their amplitude and phase delay distributions were retrieved. (c) A reconstructed refractive index (RI) map.
Figure 1—video 1
Eight-hour time-lapse ODT imaging did not indicate photobleaching or signal losses.
Figure 2 with 4 supplements

Data flowchart in DeepIS framework.
(a) Dataset preparation; raw RI tomograms were annotated with manual parameter selections and curated by three experts. (b) Training stage; the prepared dataset was employed to iteratively train the DCNN model that regressed the distance map of CART19 and K562-CD19 cells with the opposite signs. (c) Inference stage; a raw RI tomogram was converted into an output distance map by the trained DCNN model. After post-processing, 3D masks of CART19, K562-CD19, and IS were reconstructed.
Figure 2—figure supplement 1
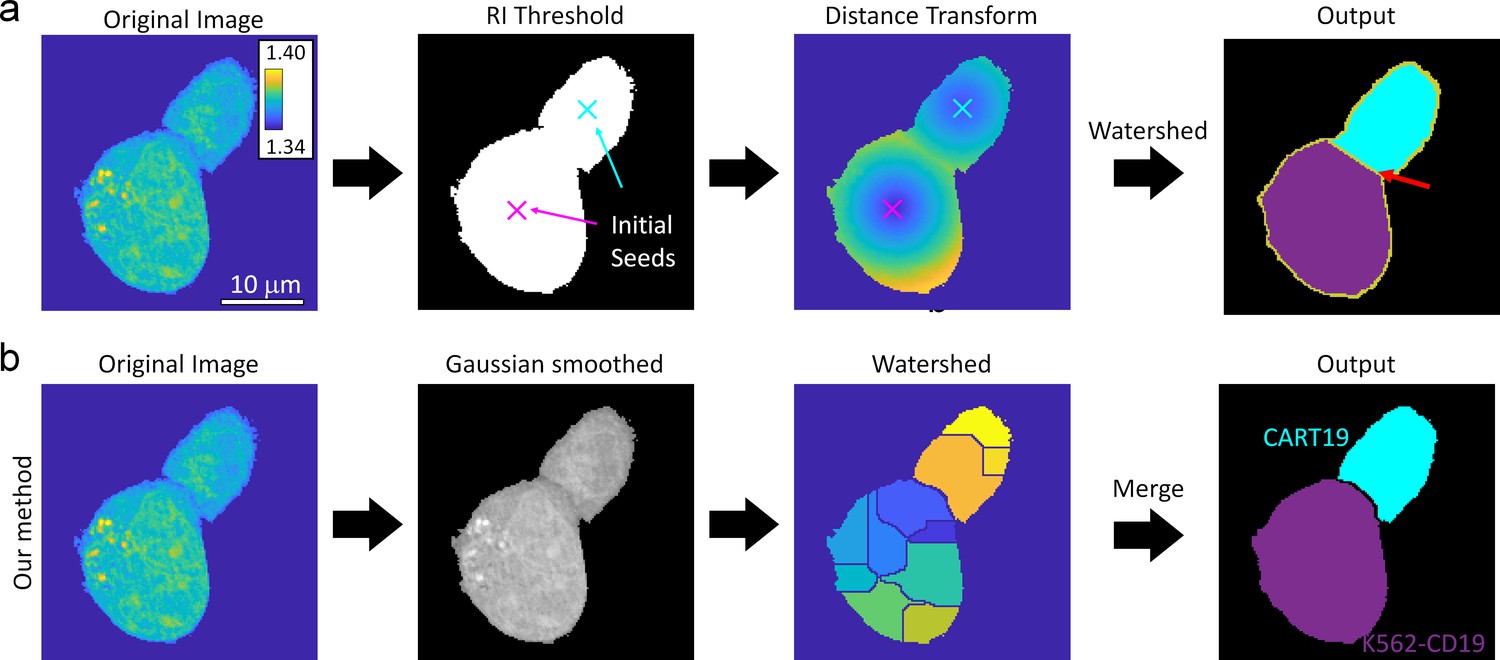
The details of the annotation process.
(a) A distance-transform map of a binary mask caused ill segmentation. Red arrow indicates the ill-segmented boundary. (b) Our annotation method was based on iterative parameter adjustment based on a Gaussian-smoothed RI tomogram. The pre-processed data was segmented by the watershed algorithm and merged into CART19 and K562-CD19 cell masks.
Figure 2—figure supplement 2
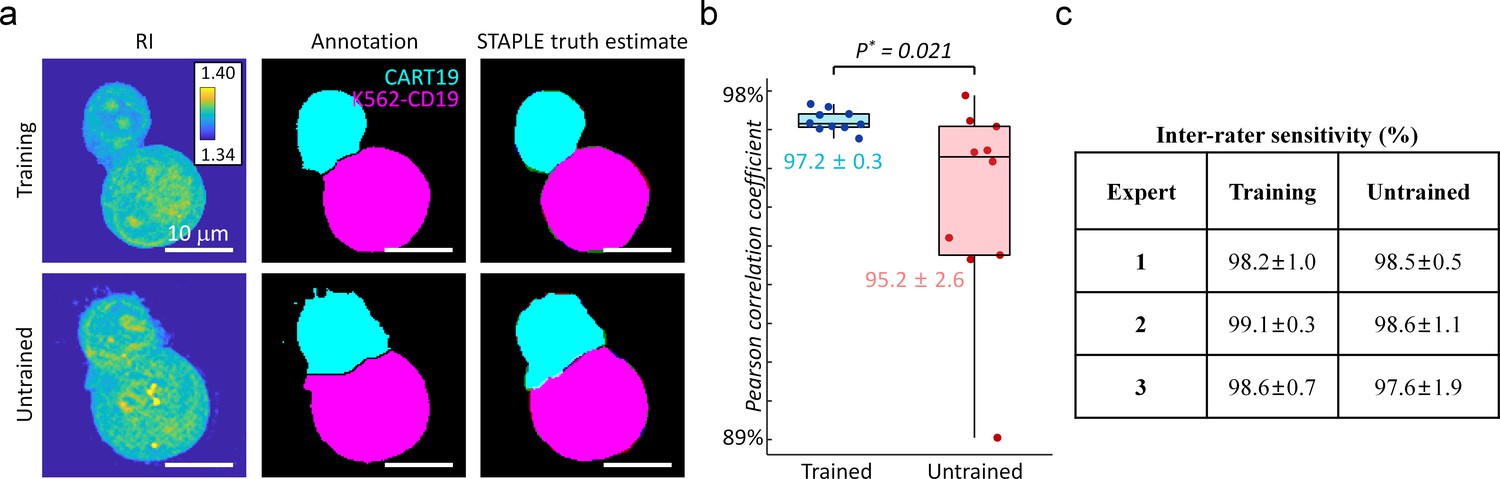
Simultaneous truth and performance level estimation between three experts and annotation masks generated by manual parameter selections.
(a) Representative results of RI maps (first column), annotation masks, (second column), and STAPLE truth estimates from the manually delineated masks of three experts (third column). Top row: training set, Bottom row: untrained set. (b) Statistics of Pearson correlation coefficient between the annotation mask and the STAPLE truth estimate. The comparison showed higher mean and smaller standard deviation values of the coefficient in the training dataset, indicating that the quality of curated annotation masks reached the expert levels. n = 10 for both training and untrained datasets, respectively. Each boxplot indicates the median, upper, and lower quartiles of each population. The vertical lines indicate population ranges. Two-tail unpaired Wilcoxon tests were performed. (c) The inter-rater sensitivity between experts shows that the experts heuristically curated well-segmented data with consensus. Mean ± SD data are presented.
Figure 2—figure supplement 3

The schematic architecture of our deep neural network.
(a) Overall U-shaped feature flowline of the DCNN architecture. The architecture has the contracting path consisting of ResNet blocks and down-pooling layers and the expanding path consisting of convolutional layers and up-pooling layers. Features are passed from the contracting path and to the expanding path through global convolutional network (GCN) layers. The number of features for each level is 32, 64, 128, 256, 512, respectively. (b) Detailed structure of colored blocks and layers in the previous architecture.
Figure 2—figure supplement 4

Definition of cell interface, interior, and synapse.
Cell surface was obtained by finding the edge of each cell mask. The remaining mask was defined as the cell interior. The synapse was defined as an overlapped region of the dilated masks of CART19 and K562-CD19 cells. The green arrow and a dashed line indicate the direction of the en face projection and the projection plane, respectively. The en face projected view is also presented.
Figure 3 with 1 supplement
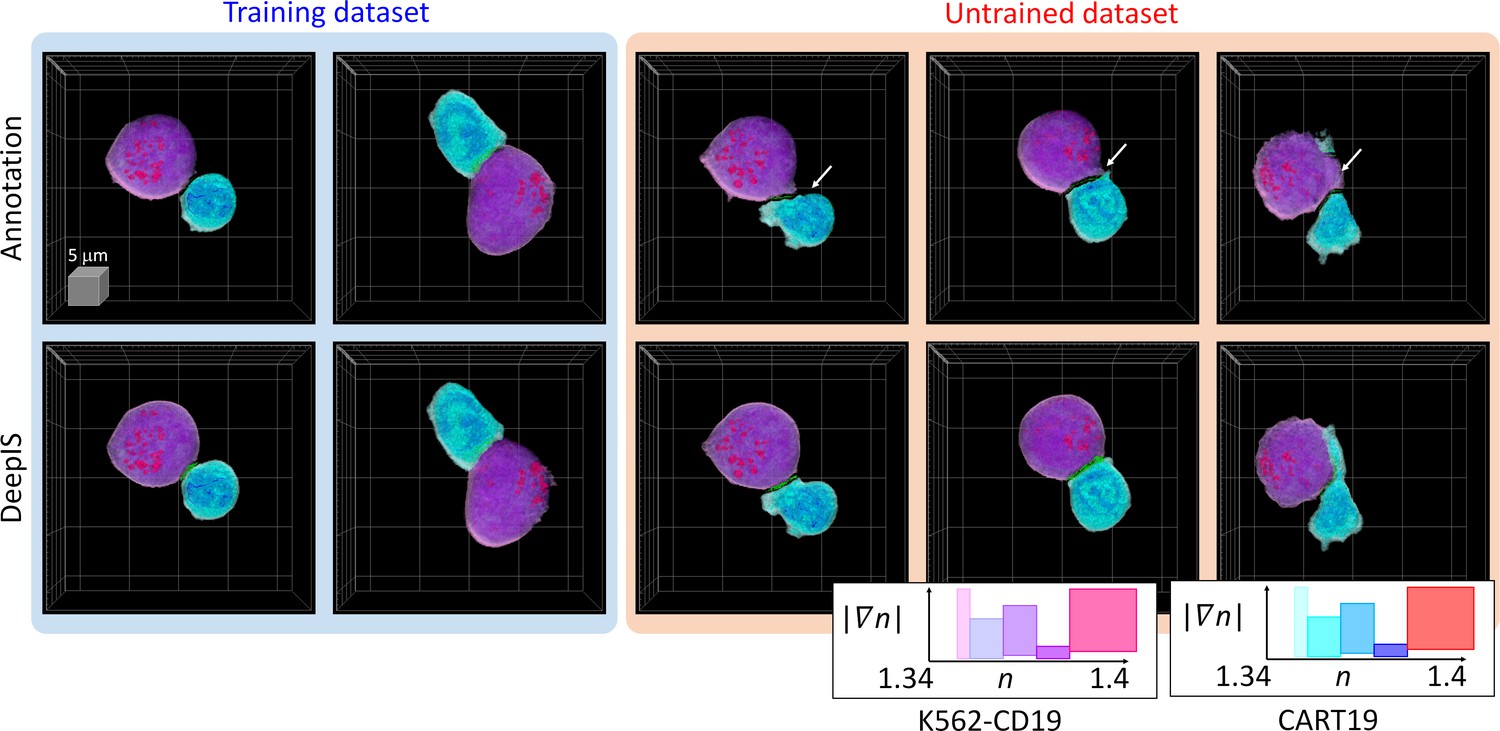
Representative segmentation results.
(Top row) Masks annotated by manual parameter selections. (Bottom row) Segmentation results using DeepIS. Blue shade indicates the curated data in the training stage. Red shade indicates the data which were poorly segmented by parameter-based annotation. White arrows illustrate poorly segmented regions. Lower right graph: rendering colormaps determined by the ranges of RI and RI gradient norm.
Figure 3—video 1
A number of annotated data and DeepIS results for training and untrained datasets.
Figure 4
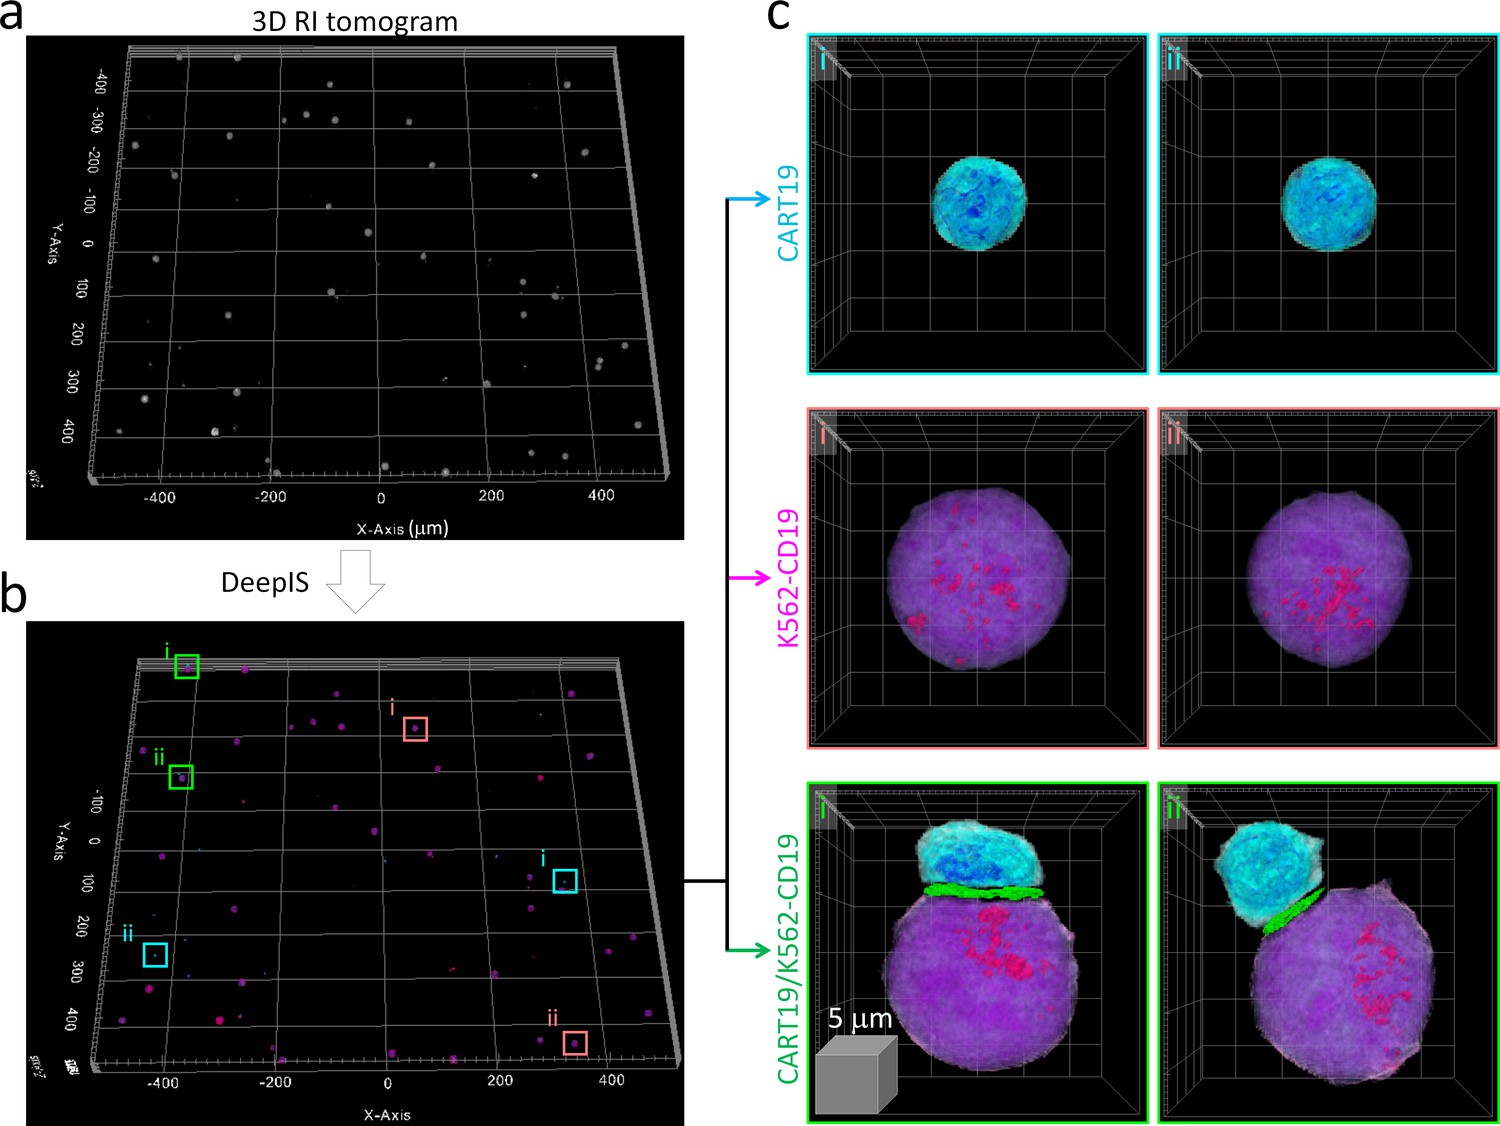
High-throughput semantic segmentation using DeepIS.
(a) RI tomogram over 0.98 × 1.05 × 0.04 mm3 obtained by stitching method. (b) Segmentation using DeepIS. (c) Representative CART19, K562-CD19, and CART19/K562-CD19 cell conjugates are magnified.
Figure 5 with 2 supplements
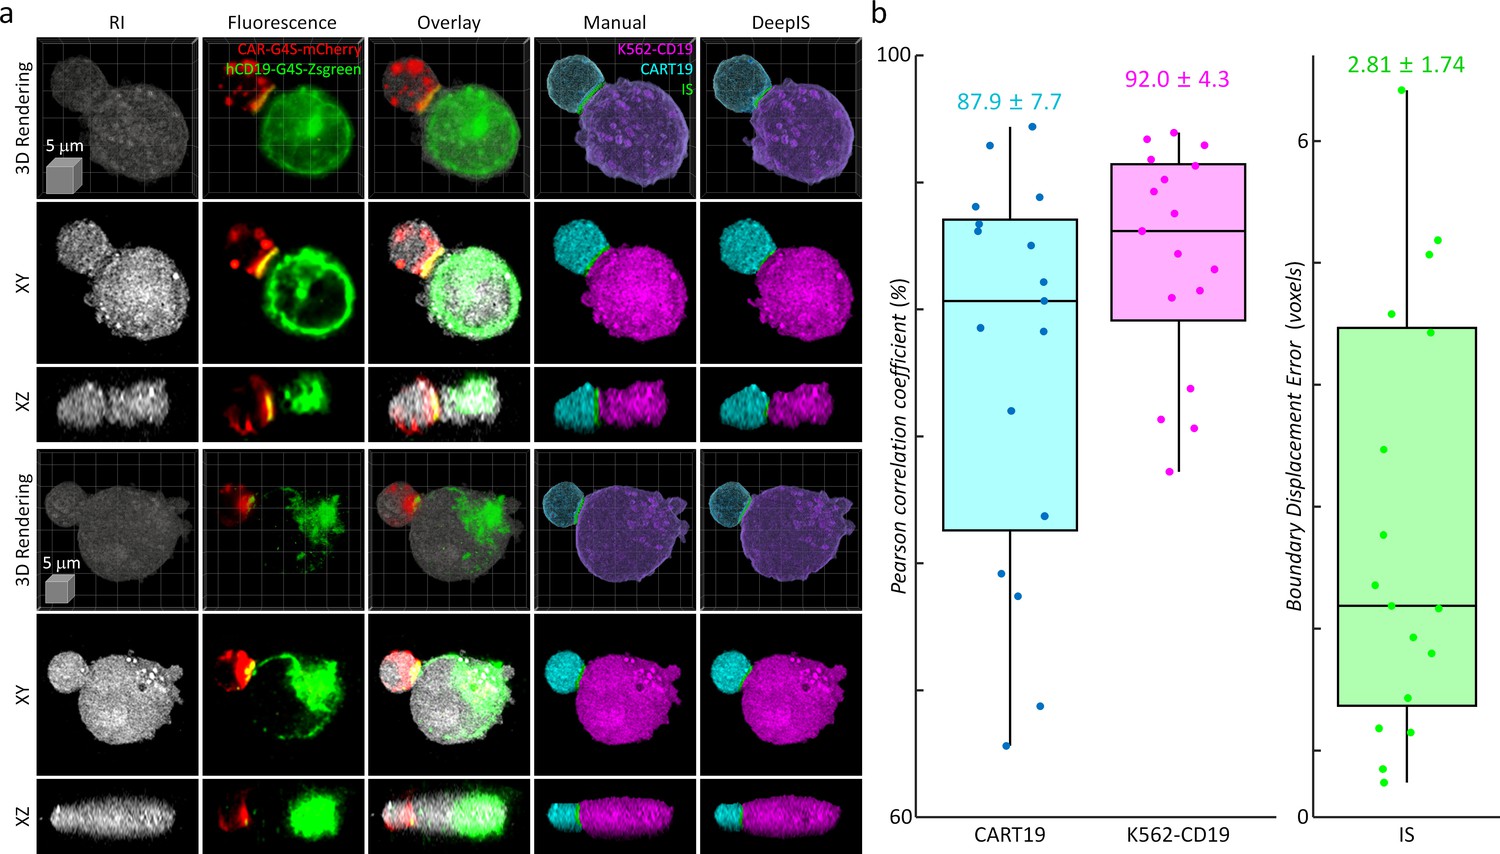
Quantitative analysis of segmentation performance using correlative fluorescence microscopy and ODT.
(a) Representative 3d rendering images, the xy- and the xz- cross-sections of RI (first column), fluorescence (second column), and their overlapped images (third column). CART19 and K562-CD19 labels were manually delineated based on the correlative images (fourth column) and compared with the labels obtained from DeepIS (fifth column). (b) Quantifications of DeepIS segmentation performance (n = 17). Pearson correlation coefficient was measured for CART19 (87.9 ± 7.7%) and K562-CD19 (92.0 ± 4.3%). Boundary displacement error was measured for IS (2.82 ± 1.74 voxels; 615.5 ± 379.8 nm). Each boxplot indicates the median, upper, and lower quartiles of each population.
Figure 5—figure supplement 1
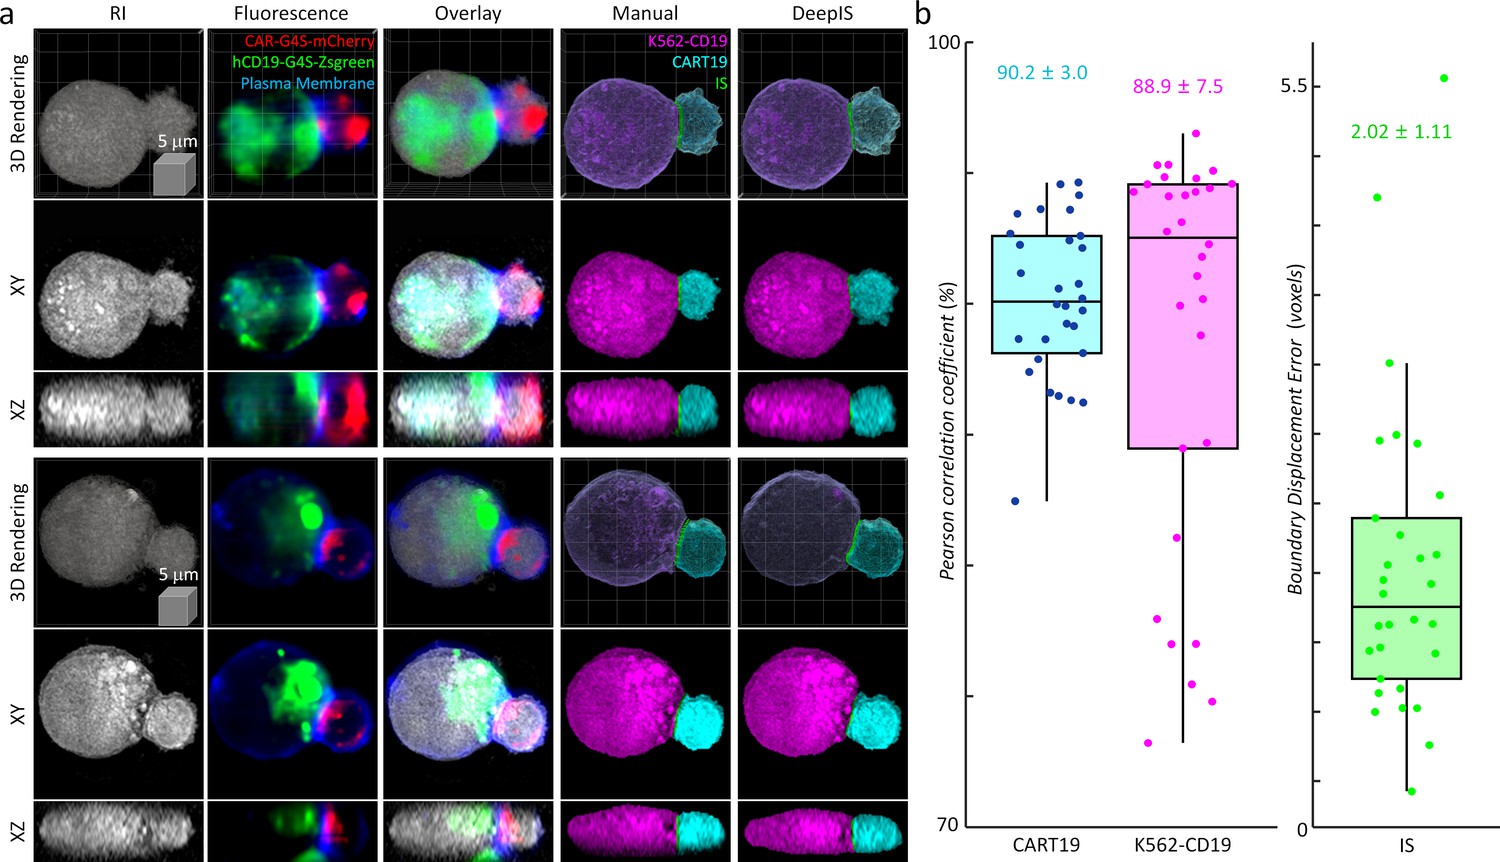
Membrane staining indicates good overlaps between RI maps and 3D cell topologies and results in comparable segmentation performance to the experiment without membrane staining.
(a) Representative 3D rendering maps of RI (first column), fluorescence (second column), and their overlapped images (third column). CART19 and K562-CD19 labels were manually delineated based on the correlative images (fourth column) and compared with the labels obtained from DeepIS (fifth column). (b) Quantifications of DeepIS segmentation performances (n = 30). Pearson correlation coefficient was measured for CART19 (90.2 ± 3.0%) and K562-CD19 (88.9 ± 7.5%). Boundary displacement error was measured for IS (2.02 ± 1.11 voxels; 440.9 ± 242.3 nm). Each boxplot indicates the median, upper, and lower quartiles of each population. The numbers of analyzed cells per each experiment are listed in Table 1.
Figure 5—figure supplement 2

3D multi-color confocal microscopic images show that membrane CAR and CD19 are concentrated on the immunological synapse and generated at the plasma membrane between CART19 and K562-CD19 cells.
(a) A 2D wide-field image. (b) Four-channel zoom-in images of CART19/K562-CD19 pair. (c) Merged cross-section images. (d) A 3D Rendering image.
Figure 6 with 2 supplements
High-resolution validation of 3D IS using a negative stain method.
(a) The XY- and XZ-slice images of fluorescein-labeled dextran. White dashed lines: slice regions. (b) Corresponding XY- and XZ- images of SIM and ODT. (c) Comparison of dextran fluorescence, CAR fluorescence, and the IS defined by DeepIS. (d) Mean lateral line profiles for lines drawn across the IS.
Figure 6—figure supplement 1

Implementations of complementary 3D-SIM and ODT.
(a) Experimental setup. (b) Raw image (left) and corresponding widefield and SIM images (right) of 100-nm-diameter Tetraspeck beads excited by structured illumination beams. (c) Slice images of multicolor widefield (left), 3D-SIM (middle), and ODT (right) of the beads after image registrations. (d) Line profiles from c and the corresponding full-width half-maxima of 3D-SIM and ODT.
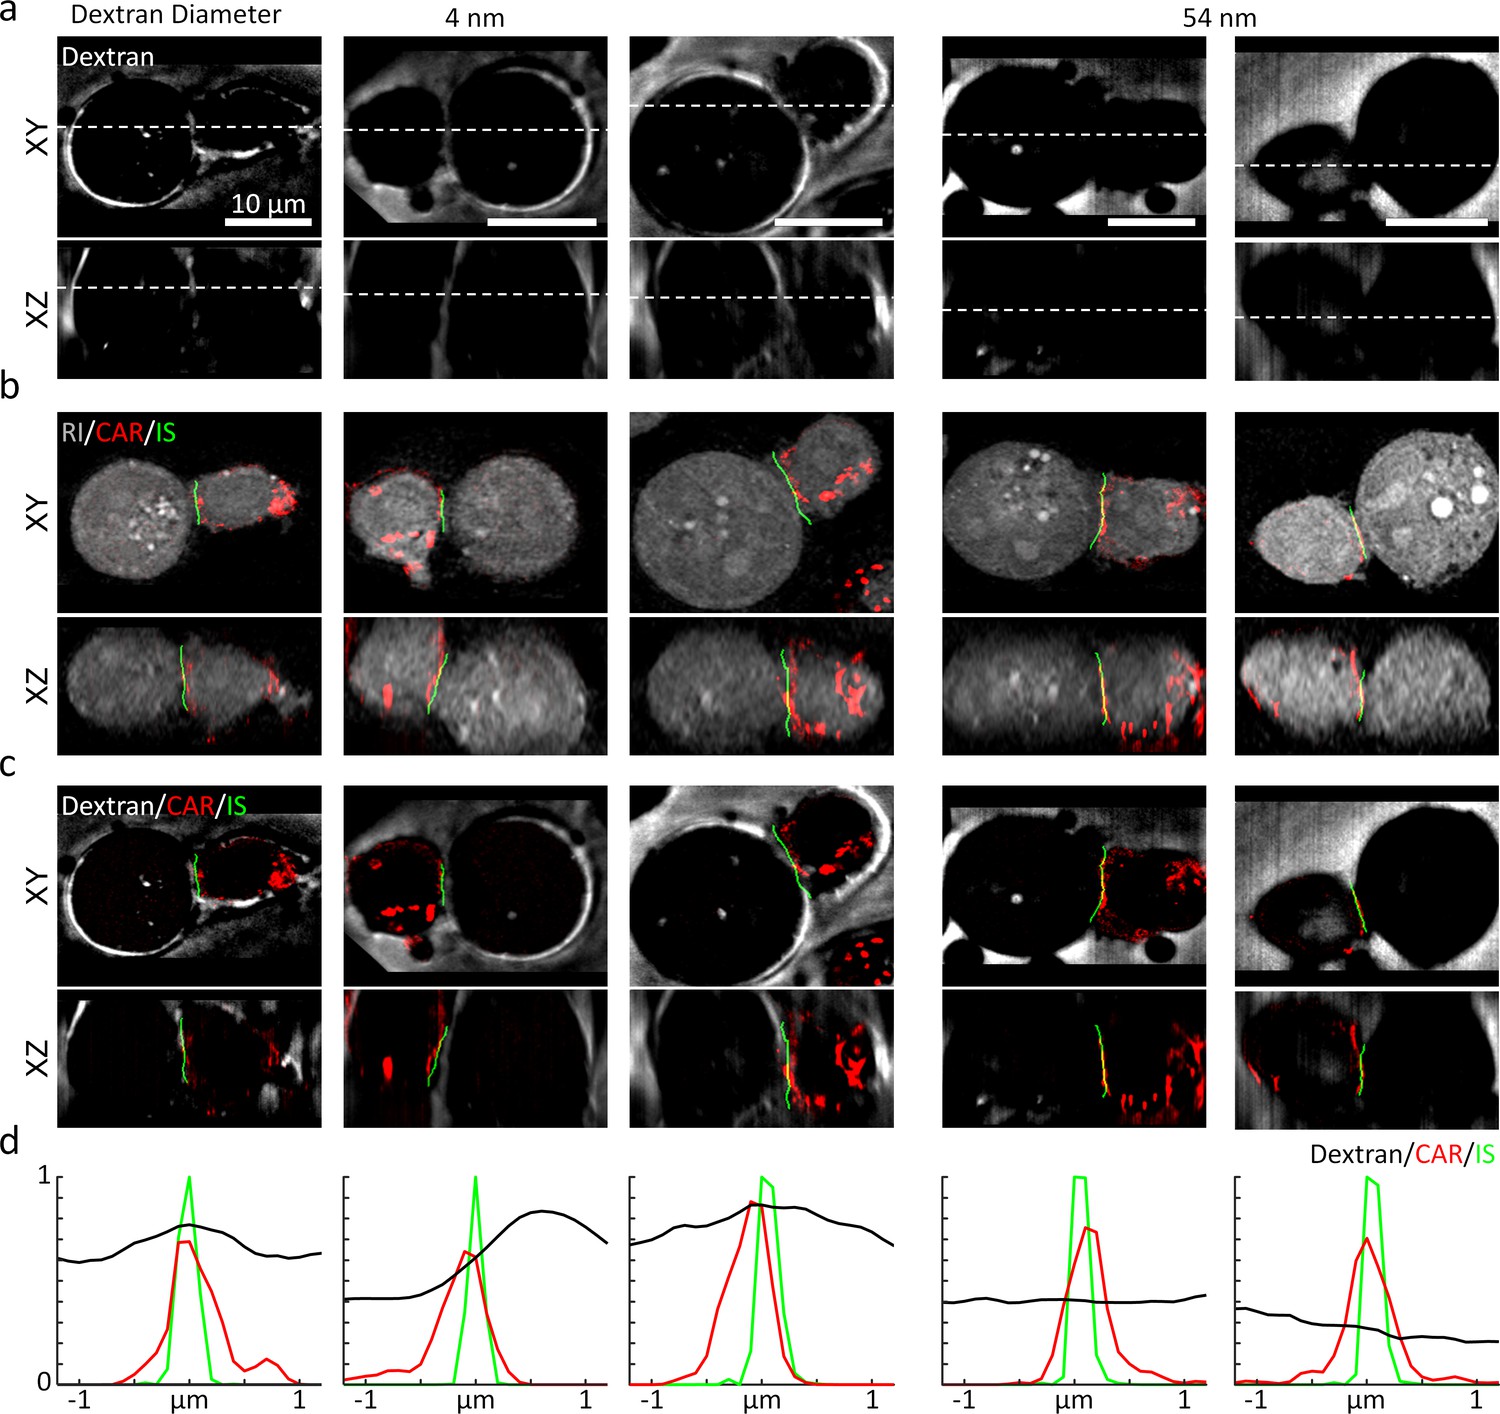
Figure 6—figure supplement 2
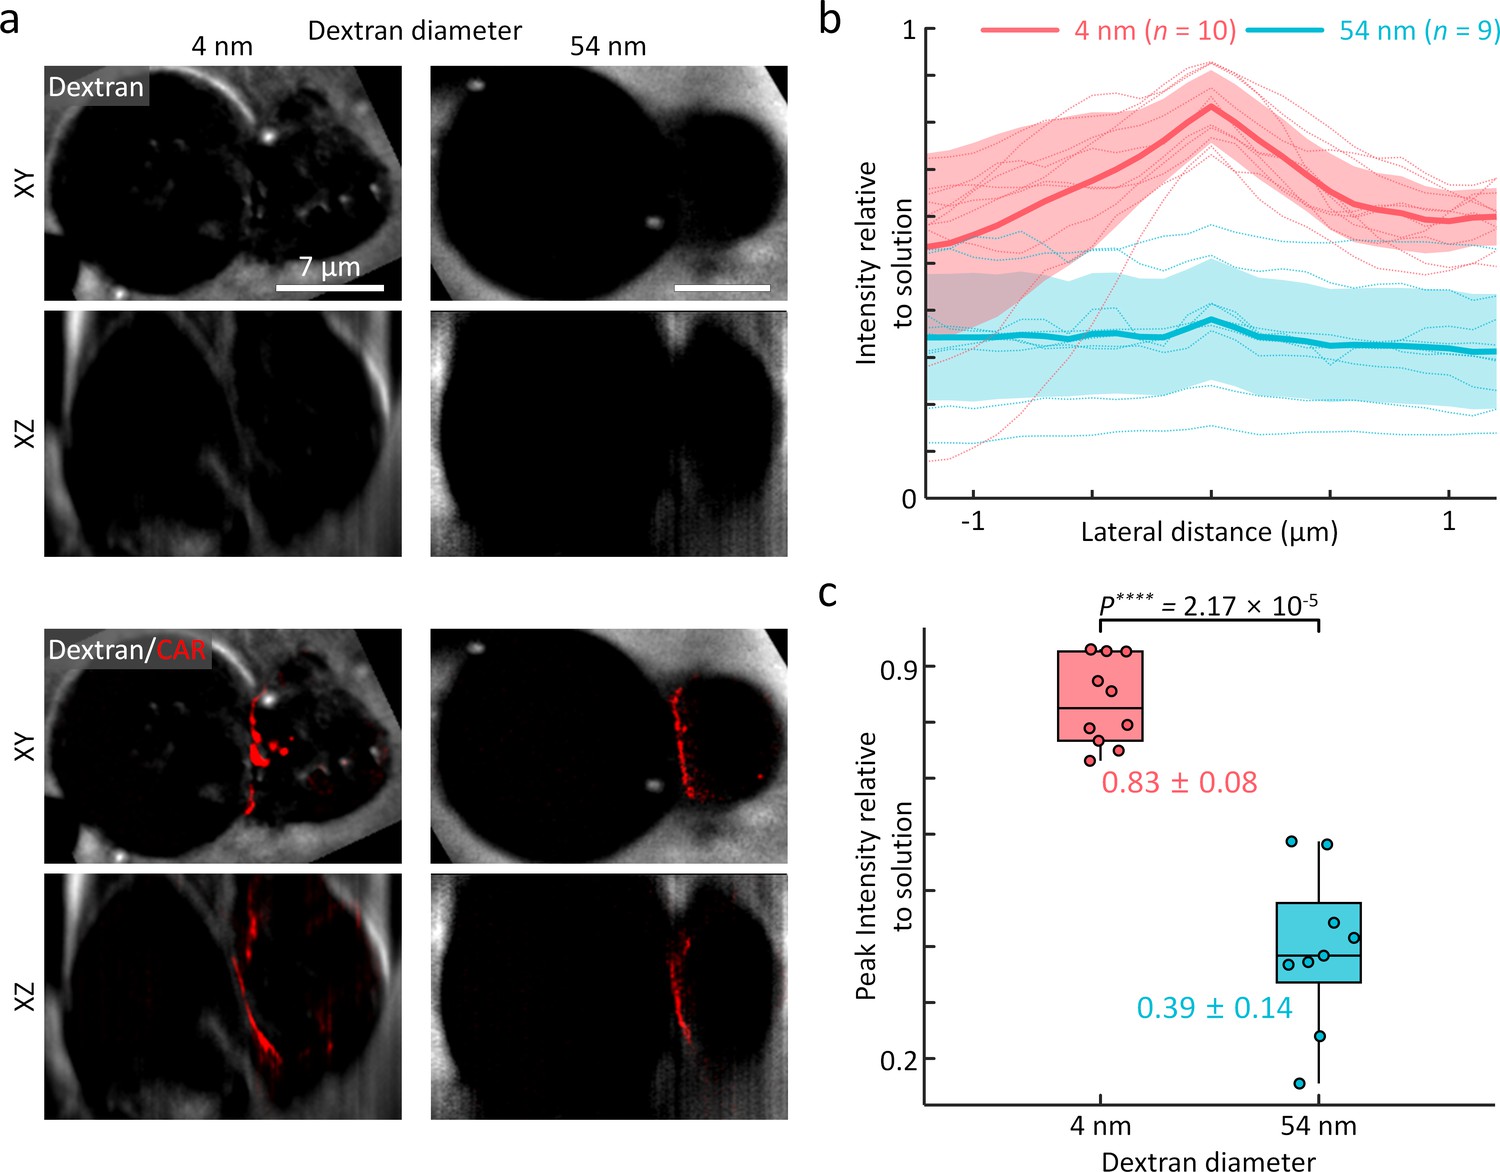
CAR IS excludes dextran molecules in a size-dependent manner.
(a) The XY- and XZ-slice images of fluorescein-labeled dextran (top) and merged fluorescence of dextran and CAR (bottom). The 3D-SIM images showed that the synaptic cleft in the vicinity of the CAR protein was visible only with the smaller dextran. (b) Lateral fluoresce intensity relative to background solution across CAR IS. The shaded error bars indicate the mean and standard deviation of the dotted curves. The fluorescence intensity of dextran relative to the background solution quantified the size-dependent access of dextran into the CAR IS. (c) A two-tail unpaired Wilcoxon test indicated that the fluorescence peaks were significantly larger for the smaller dextran used.
Figure 7 with 3 supplements
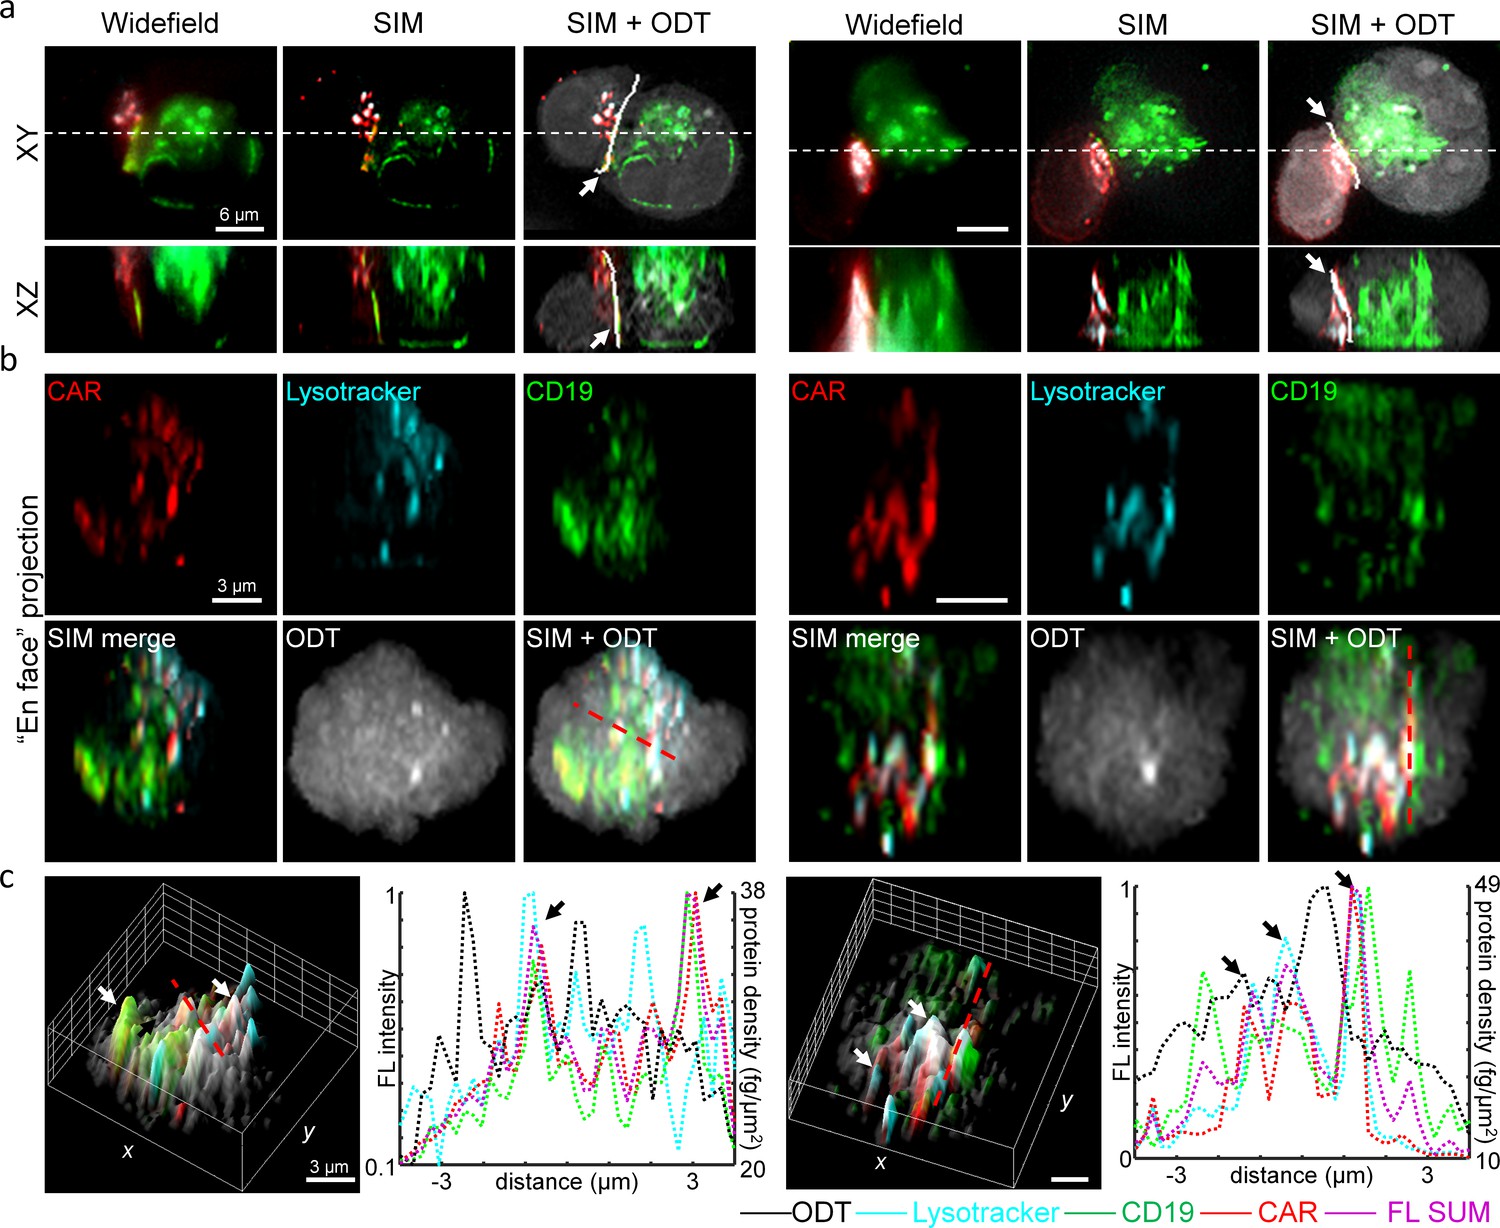
High-resolution analysis of 3D IS compositions using 3D-SIM and DeepIS.
(a) XY- and XZ-slice images of representative CART19/K562-CD19 conjugates. White-dashed lines: slice regions. White bold lines in SIM + ODT: 3D IS areas defined by DeepIS. (b) En face projected images of the defined IS areas in a. (c) Surface (left each) and line (right each) profiles along the dashed lines of normalized fluorescence intensities and surficial protein densities. Arrows indicate representative colocalized signals.
Figure 7—figure supplement 1

3D lytic granule transport imaged by ODT and 3D widefield deconvolution microscopy.
Figure 7—figure supplement 2

RI sensitivity analysis.
(a) Representative XY- and XZ- cross section of background, cell volume (gray), obtained IS (green), and lytic granules (red, defined by the overlapping region between a RI cell volume and a fluorescence image with higher than 20% intensity). (b) RI statistics of the corresponding four regions. The experimental signal-to-background ratios of the RI contrast were larger than 30. Among the signal groups, the IS and the lytic granules exhibited the significantly large RI differences. The low RI value of the IS is due to the presence of the synaptic cleft, and the higher RI value of the lytic granules is due to the protein clustering. Numbers denote mean ± standard deviation.
Figure 7—video 1
Two 3D dynamic videos of ODT and 3D widefield deconvolution fluorescence imaging showing rapid coalesce of lytic granules to the IS.
Figure 8 with 4 supplements
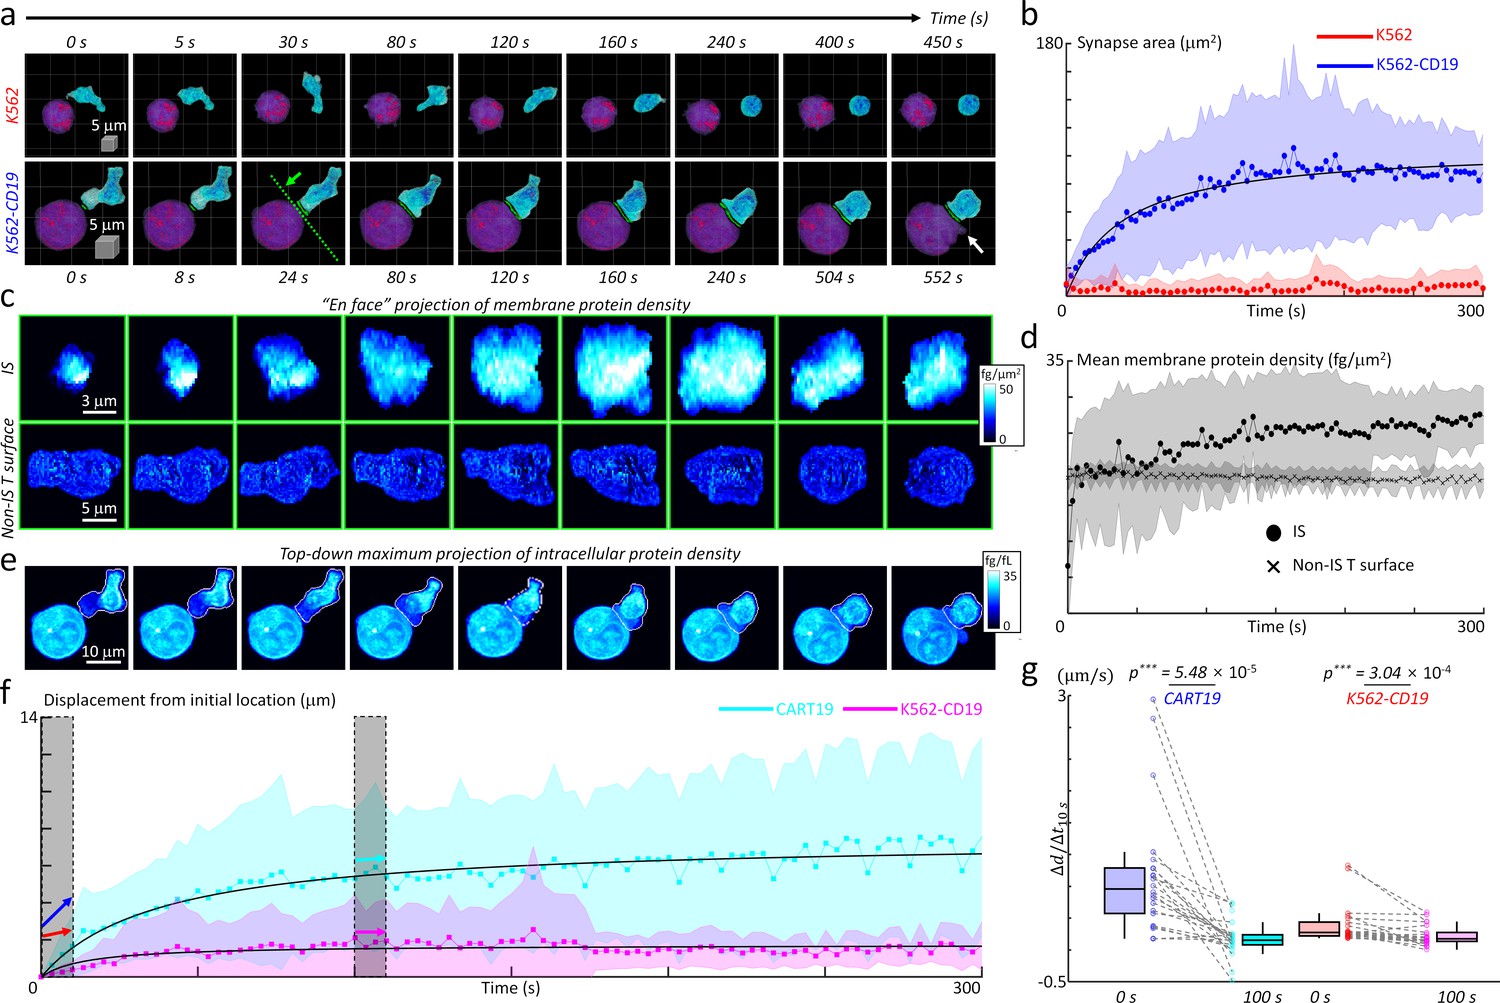
Quantification of initial IS formation kinetics of CART19 cells.
(a) Representative snapshots of a video of CART19 cells responding to K562 (top row) and K562-CD19 (bottom row) cells. Purple: K562, Blue: CART19. 0 s: the initial contact point of the effector cell and target cells. White arrow: the blebbing point. (b) Temporal changes in the synapse areas of CART19 cells responding to K562 cells (n = 5) and K562-CD19 cells (n = 22). Black line: fitting curve with A(t)=Amaxt/(t + τ1/2), where Amax = 106.16 μm2 and τ1/2 = 39.63 seconds, Pearson correlation coefficient (ρ)=0.93. (c) Maximum en face projection of membrane protein density of IS (top row) and non-IS T surface (bottom row) for CART19/K562-CD19 conjugate. The direction of the en face projection and the projection plane: the green arrow and a dashed line in (a). (d) Temporal changes in the mean membrane protein density of CART19 immunological synapses (circles) and non-IS T surfaces (crosses) responding to K562-CD19 cells. (e) Maximum z-axis projection of intracellular protein density distributions of the CART19/K562-CD19 conjugate. The white contours: the boundaries of the CART19 mask. (f) Temporal changes in the displacements of the center-of-masses of CART19 and K562-CD19 cells from their initial locations. Black lines: Δd(t) = Δdmax t/(t + τ1/2), where Δdmax = 7.48 and 1.74 μm, τ1/2 = 37.84 and 14.56 s, ρ = 0.91 and 0.58 for CART19 and K562-CD19 respectively. (g) The average changes for 10 s in the early (0 s) and late (100 s) stages are marked by colored arrows, and statistically compared by two-tail paired Wilcoxon tests for CART19 and K562-CD19 cells, respectively. CART19: Δd/Δt10s = 818.5 ± 788.5 nm/s, and 26.6 ± 223.6 nm/s in the early and late stages. K562-CD19: Δd/Δt10s = 194.3 ± 246.5 nm/s, and 63.7 ± 125.6 nm/s in the early and late stages. *** indicates p<0.001. Each shaded error bar indicates the mean and standard deviation of line plots. Each boxplot indicates the median, upper, and lower quartiles of each population. The central points and shades in Figures 7b, d and f indicate the mean and standard deviations respectively. The numbers of analyzed cells per each experiment are listed in Table 1.
Figure 8—figure supplement 1
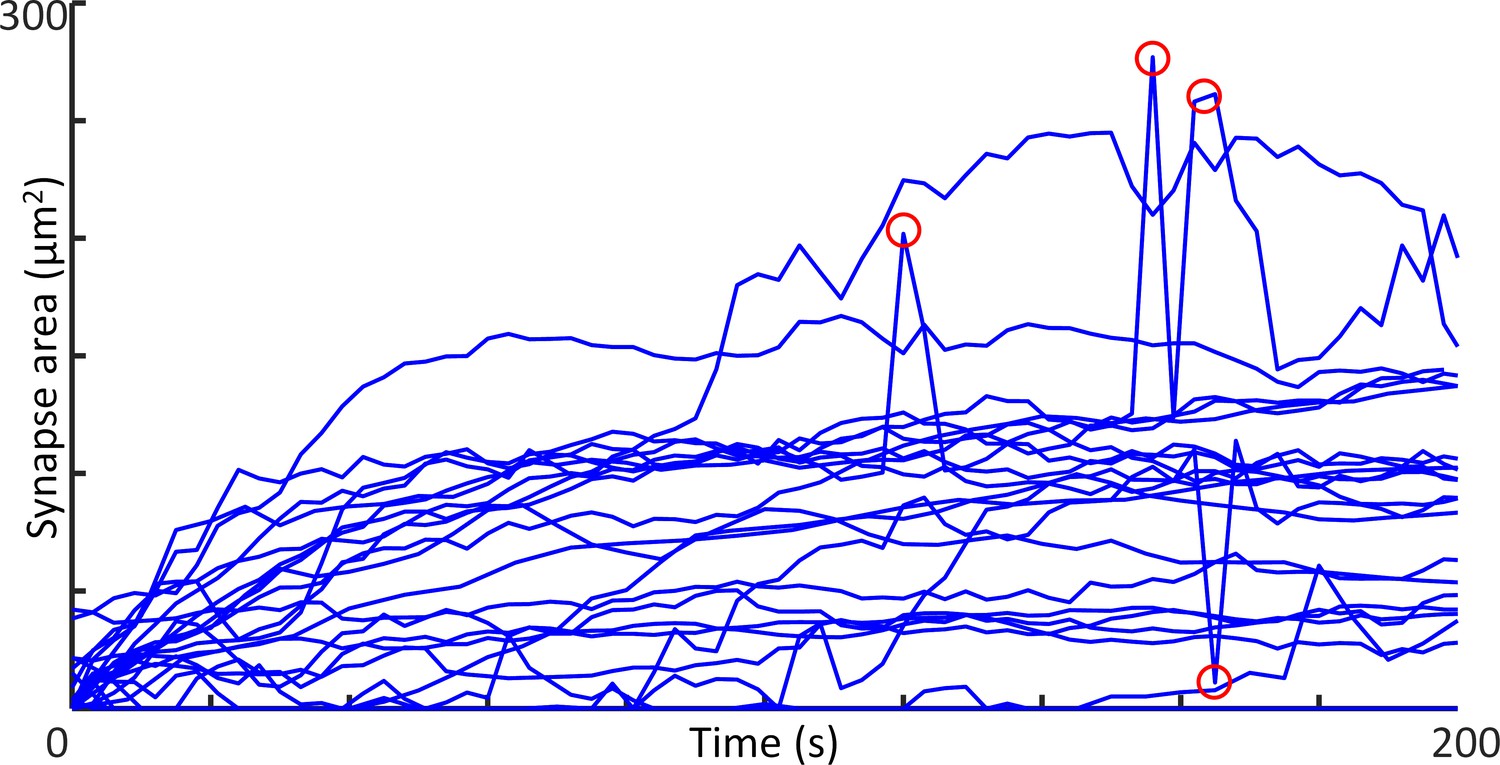
Individual temporal synapse area graphs of CART19 cells responding to K562-CD19 cells (n = 22).
Red circles indicate spikes due to ill segmentation (5 spikes out of 1329 points; 0.38%).
Figure 8—video 1
A CART19 cell fails to form a stable IS with a K562 cell.
Figure 8—video 2
CART19 cells formed a stable IS with K562-CD19 cells and induced apoptotic blebbing on the target cells about 9 min after the initial contact.
Figure 8—video 3
A CART19 cell exerted mechanical forces during the dynamic IS formation that led to the subsequent translational displacement and deformation of the K562-CD19 cells.
Figure 9 with 3 supplements
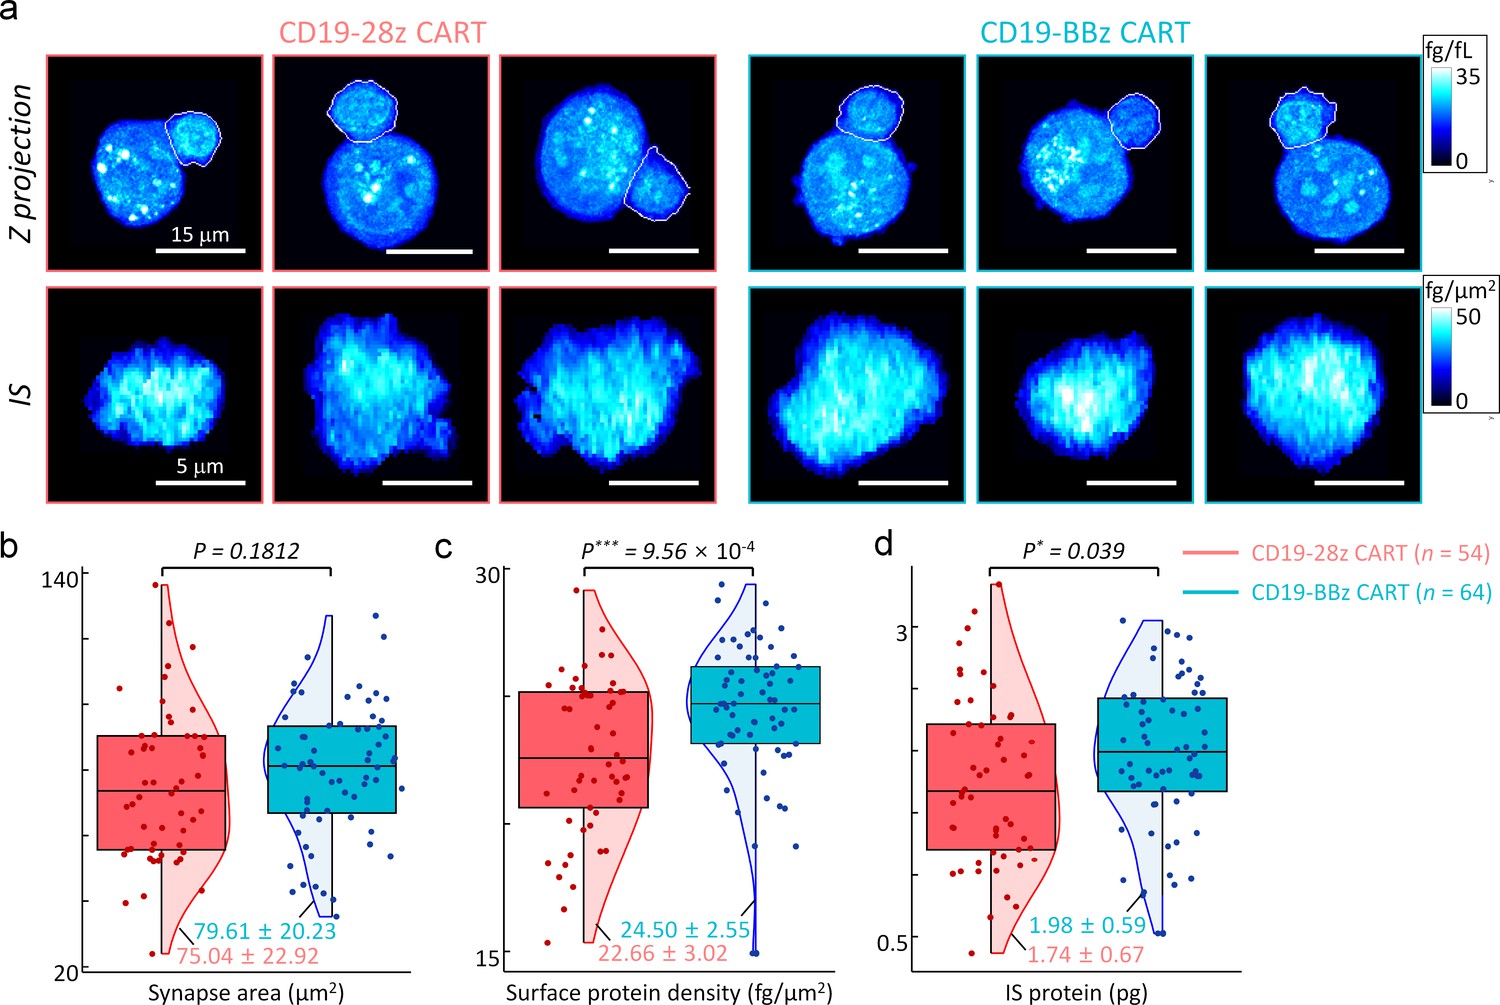
Statistical analyses of synapse morphologies depending on the co-stimulatory domains.
(a) Representative images for maximum z-axis projection of intracellular protein density distributions (top row) and en face projection of surface protein density distributions of IS (bottom row). White boundaries indicate the annotated membranes of CART19 cells using DeepIS. (b–d) Scatterplots of (b) synapse areas, (c) mean surface protein density, and (d) total IS protein amount. Each boxplot indicates the median, upper, and lower quartiles of each population. The vertical lines indicate population ranges. Perpendicular shades indicate normalized population density distributions. Two-tail unpaired Wilcoxon tests were performed. mean ± SD data are presented. The numbers of analyzed cells per each experiment are listed in Table 1.
Figure 9—figure supplement 1
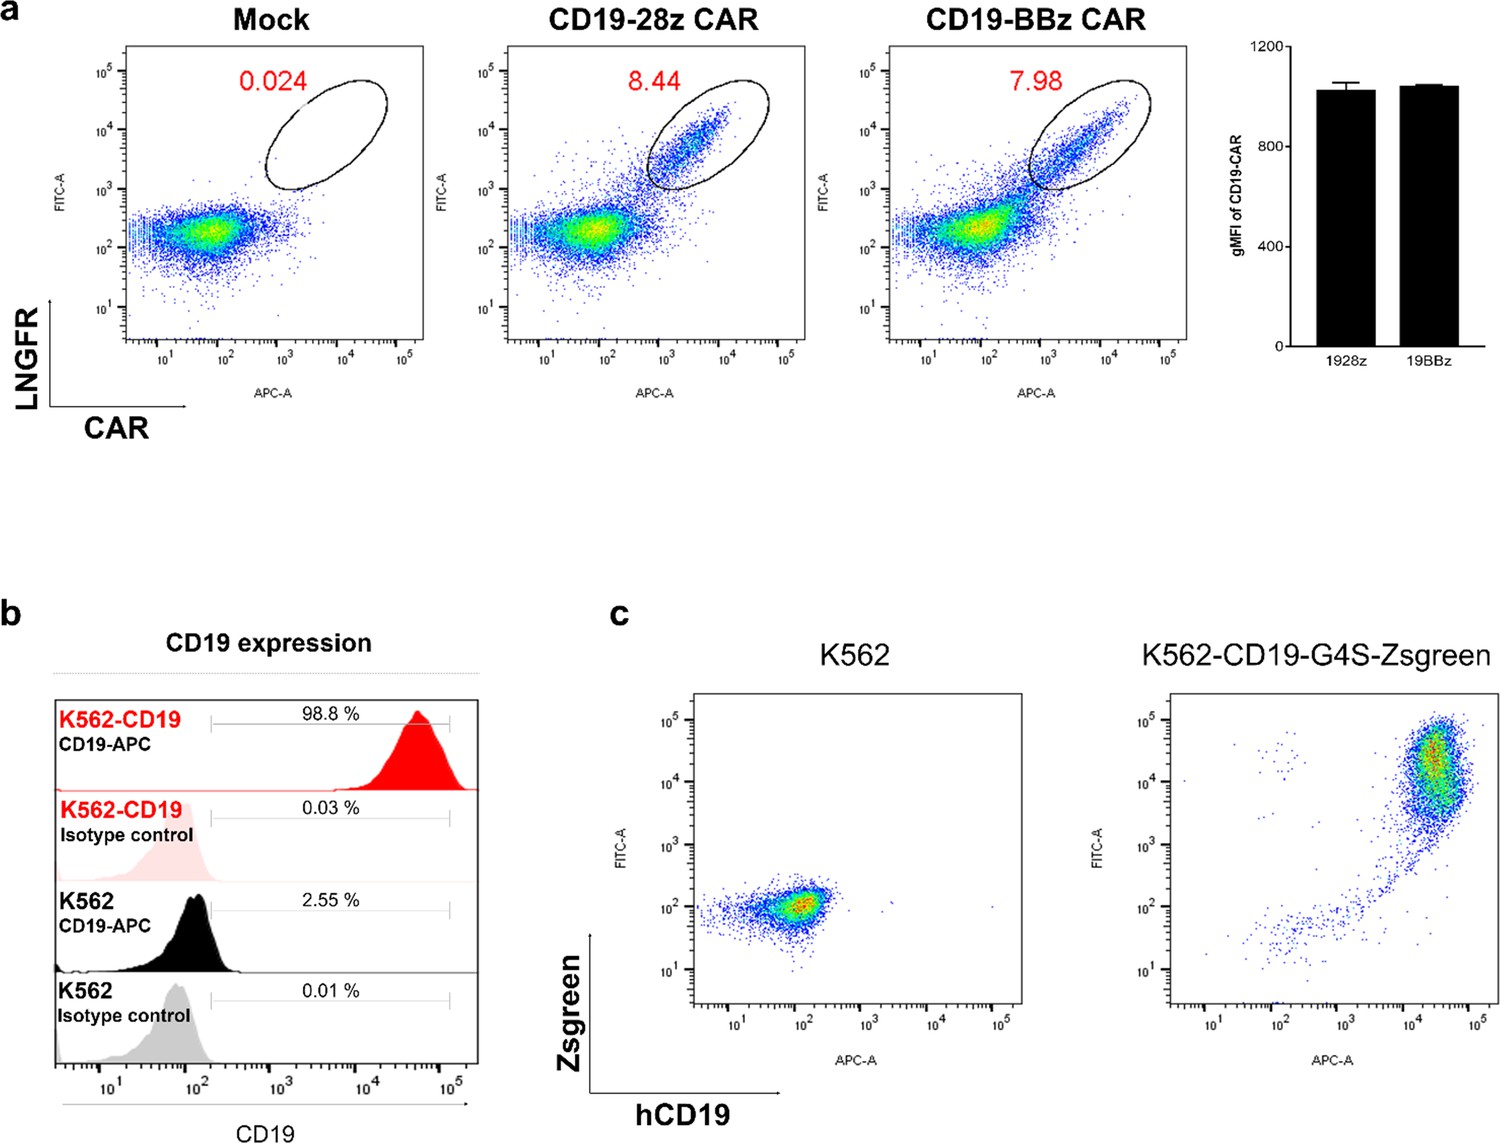
Generations of CD19 specific CAR-T cells and hCD19 transduced target cells for investigating synapse formation dynamics.
(a) LNGFR and CAR expressions at four days after transduction. (b) hCD19 expression of K562-CD19 and K562 cells. (c) hCD19-G4S-Zgreen expression of K562 cells.
Figure 9—figure supplement 2
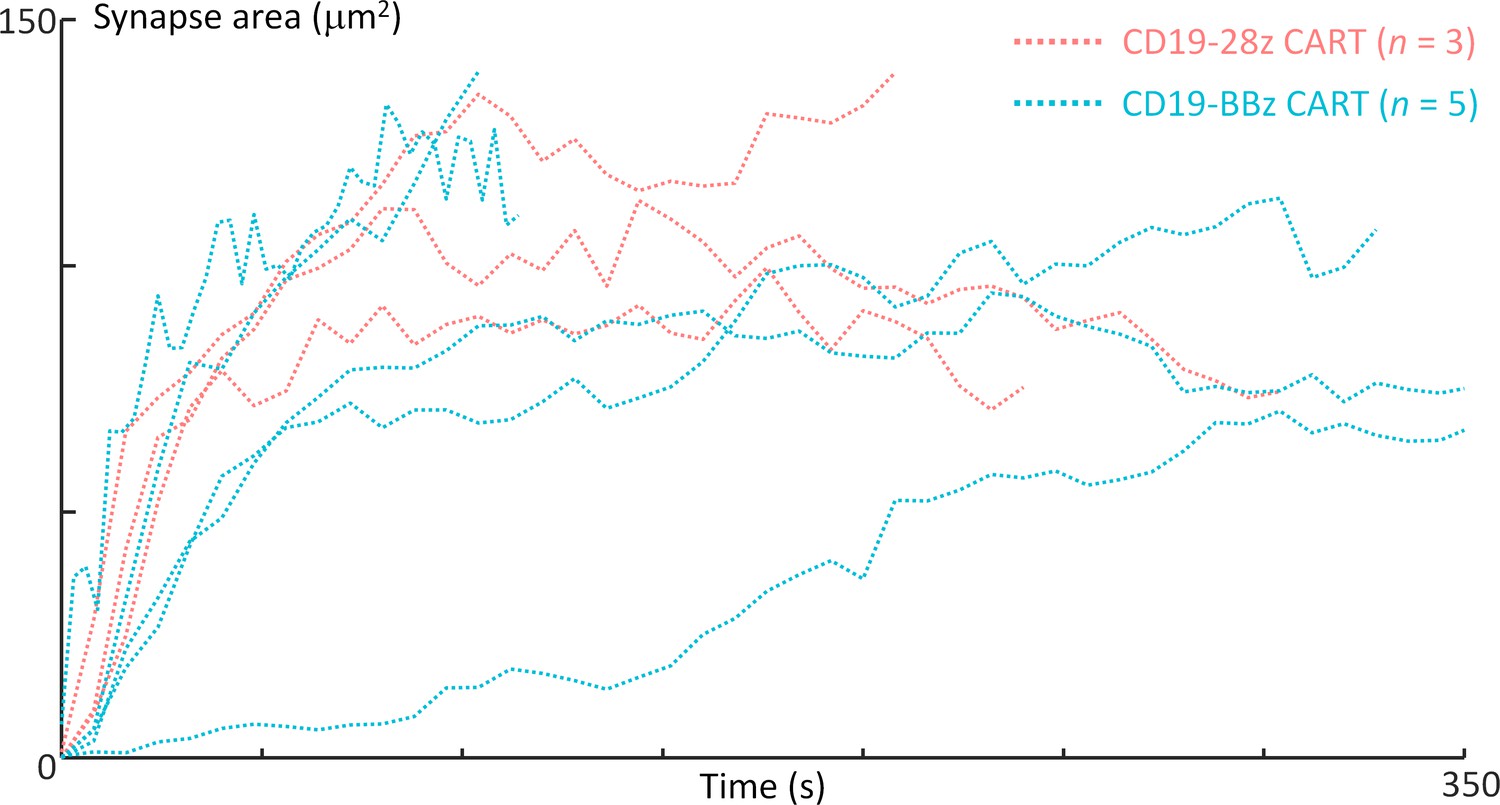
Individual temporal synapse area curves of CD19-28z (n = 3) and CD19-BBz (n = 5) CART19 cells.
In both cases, IS was formed and stabilized within five minutes.
Figure 9—video 1
Both CD28 and 4-1BB based CART19 cells formed stable IS within several minutes.
Tables
Table 1
Numbers of analyzed cells per each experiment.
| Data | Experiment | 1 | 2 | 3 | 4 | 5 | 6 | 7 | 8 | 9 | 10 | Total |
|---|---|---|---|---|---|---|---|---|---|---|---|---|
| # of data | Statistics (Figure 5) | 7 | 10 | - | - | - | - | - | - | - | - | 17 |
| dynamics (Figure 7) | 9 | 3 | 3 | 1 | 3 | 3 | 1 | 1 | 2 | 1 | 27 | |
| 4-1BB (Figure 8) | 20 | 19 | 25 | - | - | - | - | - | - | - | 64 | |
| CD28 (Figure 8) | 1 | 11 | 10 | 9 | 23 | - | - | - | - | - | 54 | |
| Statistics (Figure 5—figure supplement 1) | 8 | 22 | - | - | - | - | - | - | - | - | 30 | |
| 10 kDa (Figure 6—figure supplement 2) | 3 | 7 | - | - | - | - | - | - | - | - | 10 | |
| 2000 kDa (Figure 6—figure supplement 2) | 6 | 3 | - | - | - | - | - | - | - | - | 9 | |
| 4-1BB (Figure 8—figure supplement 1) | 1 | 1 | 2 | 1 | - | - | - | - | - | - | 5 | |
| CD28 (Figure 8—figure supplement 1) | 2 | 1 | - | - | - | - | - | - | - | - | 3 |
Key resources table
| Reagent type (species) or resource | Designation | Source or reference | Identifiers | Additional information |
|---|---|---|---|---|
| Cell line (Homo sapiens) | K562 | Other | RRID:CVCL_0004 | Obtained from Dr. Travis S. Young at California Institute for Biomedical research. The original stock was purchased from ATCC |
| Cell line (Homo sapiens) | K562-CD19 | Other | Obtained from Dr. Travis S. Young at California Institute for Biomedical research. CD19-negative K562 cells were transduced wtih lentiviral vector encoding human CD19. | |
| Cell line (Homo sapiens) | Lenti-X 293T | Takara | Cat. #: 632180 | Lentivirus production |
| Recombinant DNA reagent | pLV-ΔLNGFR-P2A-CD19-BBz CAR | This paper | Signal peptide: aa 1–28 hLNGFR (Uniprot TNR16_Human) Extracellular domain: aa 29–250 hLNGFR (Uniprot TNR16_Human) Transmembrane domain: aa 251–272 hLNGFR (Uniprot TNR16_Human) Cytosolic sequence: aa 273–275 (Uniprot TNR16_Human) ΔLNGFR was fused with P2A sequence (GGAAGCGGAGCTACTAACTTCAGCCTGCTGAAGCAGGCTGGCGACGTGGAGGAGAACCCTGGACCT) and followed by CAR sequence Signal peptide: aa 2–21 hCD8 (Uniprot CD8A_Human) Extracellular domain: anti-CD19 scFv (Clone: FMC 63); VL –G4S linker VH Hinge/Transmembrane domain aa 138–206 hCD8 (Uniprot CD8A_Human) Co-stimulatory domain sequence: aa 214–255 (Uniprot TNR9_Human) Signaling domain: aa 52–164 (Uniprot CD3Z_Human) | |
| Recombinant DNA reagent | pLV- ΔLNGFR -P2A-CD19-28z CAR | This paper | Signal peptide: aa 1–28 (Uniprot TNR16_Human) Extracellular domain: aa 29–250 (Uniprot TNR16_Human) Transmembrane domain: aa 251–272 (Uniprot TNR16_Human) Cytosolic sequence: aa 273–275 (Uniprot TNR16_Human) ΔLNGFR was fused with P2A sequence (GGAAGCGGAGCTACTAACTTCAGCCTGCTGAAGCAGGCTGGCGACGTGGAGGAGAACCCTGGACCT) and followed by CAR sequence Signal peptide: aa 2–21 hCD8 (Uniprot CD8A_Human) Extracellular domain: anti-CD19 scFv (Clone: FMC 63); VL-G4S linker-VH Hinge/Transmembrane domain: aa 138–206 (Uniprot CD8A_Human) Co-stimulatory domain sequence: aa 180–220 (Uniprot CD28_Human) Signaling domain: aa 52–164 (Uniprot CD3Z_Human) | |
| Recombinant DNA reagent | pLV-CD19-BBz CAR-G4S-mcherry | This paper | Signal peptide: aa 1–21 (Uniprot CD8A_Human) Extracellular domain: anti-CD19 scFv (Clone: FMC 63) VL –G4S linker VH Hinge/Transmembrane domain: aa 138–206 (Uniprot CD8A_Human) Co-stimulatory domain sequence: aa 214–255 (Uniprot TNR9_Human) Signaling domain: aa 52–164 (Uniprot CD3Z_Human) CAR and mcherry was fused with G4S linker mCherry: aa 2–236 (Uniprot X5DSL3_ANAMA) | |
| Recombinant DNA reagent | pLV-hCD19-G4S-Zsgreen | This paper | Signal peptide: aa 1–19 (Uniprot CD19_Human) Extracellular domain: aa 20–291 (Uniprot CD19_Human) Cytoplasmic domain: aa314-556 (Uniprot CD19_Human) CD19 and Zsgreen was fused with G4S linker Zsgreen: aa 2–231 (Uniprot GFPL1_ZOASP) | |
| Recombinant DNA reagent | pMDLg/pRRE | other | RRID:Addgene12251 | 3rd Lentivirus packaging vector |
| Recombinant DNA reagent | pRSV-Rev | other | RRID:Addgene12253 | 3rd Lentivirus packaging vector |
| Recombinant DNA reagent | pMD2.G | other | RRID:Addgene12259 | Lentivirus envelop vector |
| Recombinant DNA reagent | pMACS LNGFR | Miltenyi Biotec | Cat. #:130-091-890 | |
| Peptide,recombinant protein | rhIL-2 | BMI KOREA | 300IU/mL | |
| Peptide,recombinant protein | rhCD19-Fc | ACRO Biosystems | Cat. #: CD9-H5259 | FACS |
| Peptide,recombinant protein | AF647-conjugated streptavidin | Biolegend | Cat. #: 405237 | FACS |
| Antibody | InVivoMab anti-human CD3 | Bio X cell | Cat. #: BE0001-2-5MG | OKT3 clone 4 μg/mL coated |
| Antibody | InVivoMab anti-human CD28 | Bio X cell | Cat. #: BE0291-5MG | CD28.2 clone 2 μg/mL soluble |
| Antibody | hLNGFR-APC antibody | Miltenyi Biotec | Cat. #: 130-113-418 | FACS |
| Antibody | hCD19-APC antibody | Biolegend | Cat. #: 302212 | FACS |
| Other | DPBS | Welgene | Cat. #: LB001-02 | |
| Other | Fetal Bovine Serum (FBS) | Gibco | Cat. #: 26140–079 | |
| Other | DMEM | Gibco | Cat. #: 11965–118 | |
| Other | RPMI | Gibco | Cat. #: 21870–092 | |
| Other | HBSS with Ca2+ and Mg2+ | Gibco | Cat #: 14-025-092 | |
| Other | HEPES | Gibco | Cat. #: 1530080 | |
| Other | 2-Mercaptoethanol | Sigma | Cat. #: M6250-100mL | |
| Other | Lipofectamine 2000 | ThermoFisher | Cat. #: 11668019 | |
| Other | Glutamax | Gibco | Cat. #: 35050–061 | |
| Other | Protamine Sulfate | Sigma | Cat. #: P3369 | |
| Other | MEM Non-essential amino acid | Gibco | Cat. #: 111400500 | |
| Other | Sodium pyruvate | ThermoFisher | Cat. #: 11360070 | |
| Other | penicillin/streptomycin | Gibco | Cat. #: 15140–122 | |
| Other | Tomodish | Tomocube | ||
| Other | Paraformaldehyde Solution, 4% in PBS | ThermoFisher | Cat. #: AAJ19943K2 | Fixation |
| Other | CellBrite Fix 640 Membrane Dye | Biotium | Cat. #: 30089 | Plasma membrane staining |
| Other | VECTASHIELD Hardset w/DAPI | VECTOR Laboratory | Cat. #: H-1400 | Mounting Medium |
| Other | LysoTracker Deep Red | ThermoFisher | Cat #: L12492 | Dye for labeling and tracking lytic granules |
| Other | TetraSpeck Microspheres,0.1 µm, fluorescent blue/green/orange/dark red | ThermoFisher | Cat #: T7279 | Fiducial markers |
| Other | FITC-dextran 10 kDa | TdB Labs | Cat #: 20682 | Fluorescein-labeled dextran, 10 kDa |
| Other | FITC-dextran 2000 kDa | TdB Labs | Cat #: 20584 | Fluorescein-labeled dextran, 2000 kDa |
| Commercial assay or kit | CD271 Microbeads kits, Human | Miltenyi Biotec | Cat. #: 130-099-023 | Isolation of CAR+ T cells |
| Commercial assay or kit | SepMate PBMC Isolation tube | STEMCELL | 86460 | PBMC Isolation |
| Software, algorithm | Flowjo | Flowjo | Version 10 | |
| Software, algorithm | Prism | GraphPad | Version 7 | |
| Software, algorithm | ImageJ | NIH |
Additional files
-
Supplementary file 1
Documents for cell line authentication.
- https://cdn.elifesciences.org/articles/49023/elife-49023-supp1-v2.docx
-
Transparent reporting form
- https://cdn.elifesciences.org/articles/49023/elife-49023-transrepform-v2.docx
Download links
A two-part list of links to download the article, or parts of the article, in various formats.
Downloads (link to download the article as PDF)
Open citations (links to open the citations from this article in various online reference manager services)
Cite this article (links to download the citations from this article in formats compatible with various reference manager tools)
Deep-learning-based three-dimensional label-free tracking and analysis of immunological synapses of CAR-T cells
eLife 9:e49023.
https://doi.org/10.7554/eLife.49023


