Neuronal TORC1 modulates longevity via AMPK and cell nonautonomous regulation of mitochondrial dynamics in C. elegans
- Harvard T. H. Chan School of Public Health, United States
- National Cheng Kung University, Taiwan
- Université Côte d’Azur, CNRS, INSERM, IRCAN, France
Figures
Figure 1 with 1 supplement
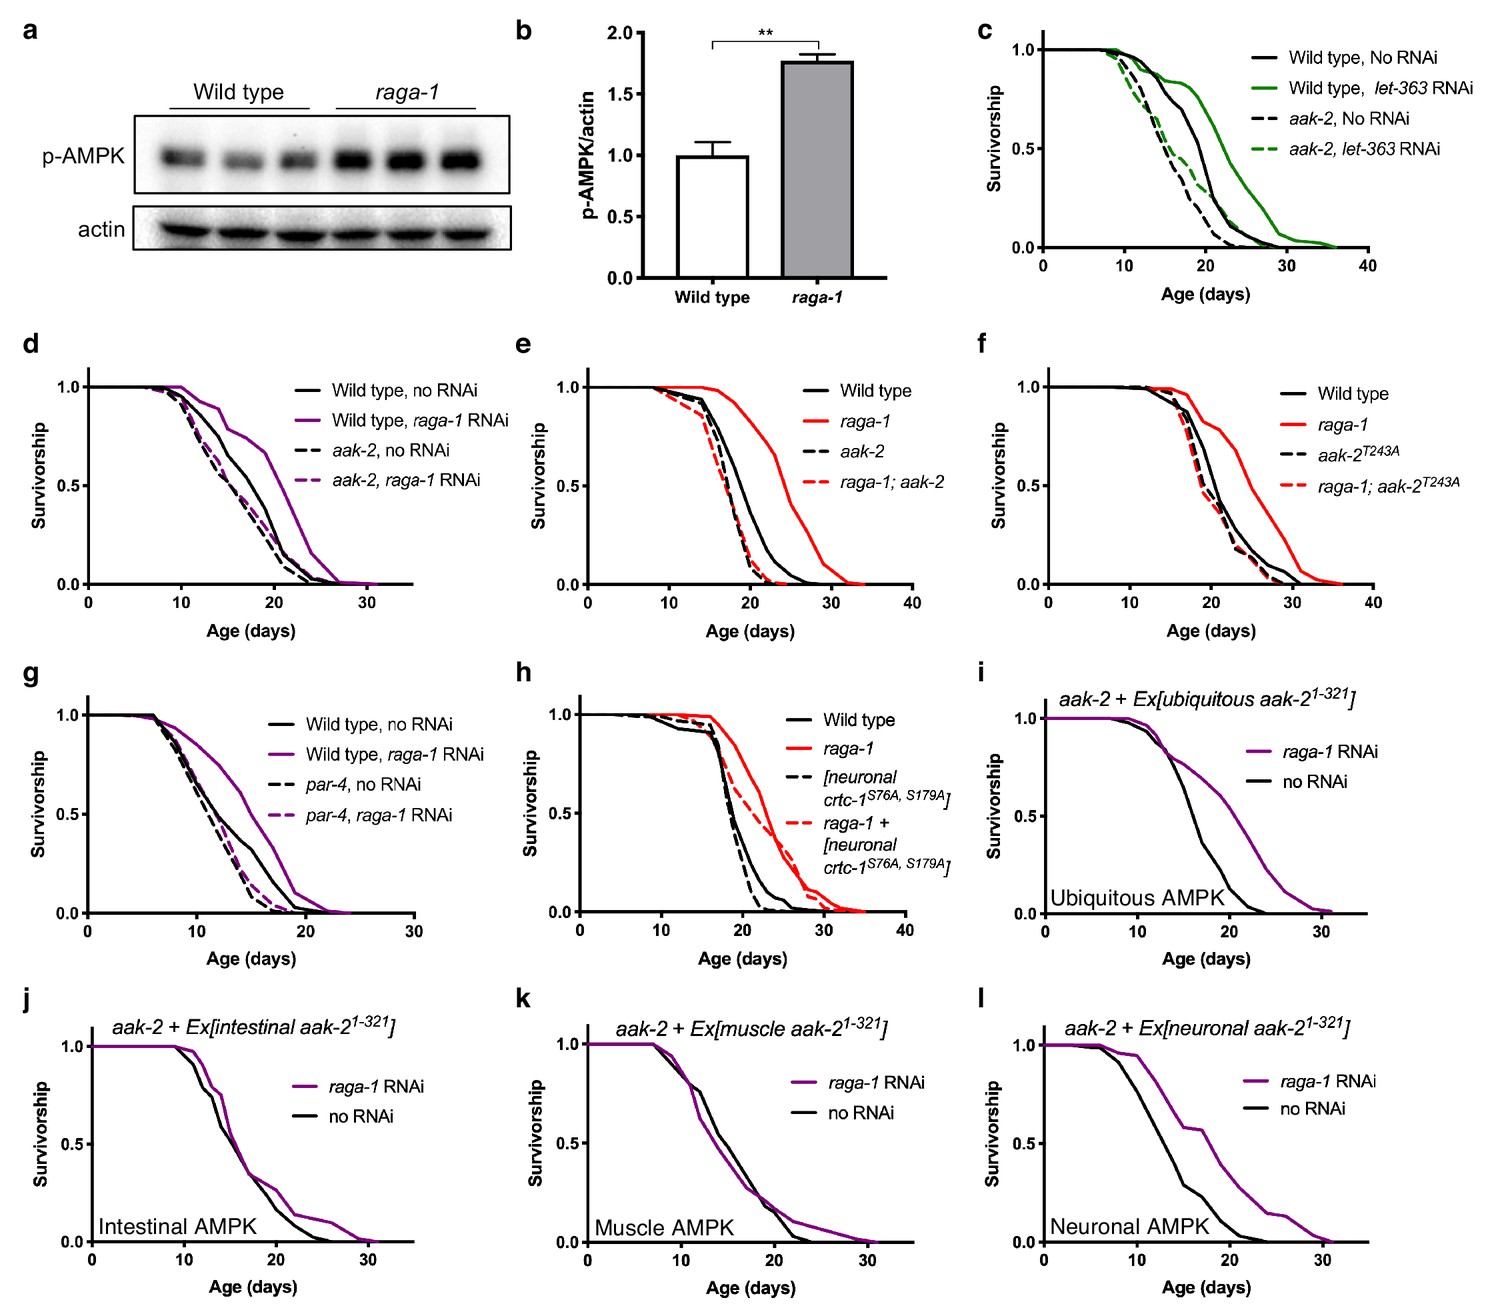
Neuronal AMPK is required for TORC1-mediated longevity.
(a, b) AMPK T172 phosphorylation is increased in raga-1(ok386) null mutants compared to wild type animals. Actin levels are used as loading controls (representative immunoblot and corresponding quantification, n = 3 independent blots). Source data for Figure 1b are provided in Figure 1—source data 1. (c, d) Knockdown of (c) let-363 (TOR) (n = 3 independent biological replicates) or (d) raga-1 from day 1 of adulthood extends lifespan in wild type animals (p<0.0001), but not in aak-2(ok524) null mutants (n = 8 independent biological replicates). P values: wild type on no RNAi vs let-363 RNAi (p<0.0001), aak-2(ok524) on no RNAi vs let-363 RNAi (p=0.0122), wild type vs aak-2(ok524) on let-363 RNAi (p<0.0001); wild type on no RNAi vs raga-1 RNAi (p<0.0001), aak-2(ok524) on no RNAi vs raga-1 RNAi (p=0.1968). Sample size ranges between 62–115 deaths per treatment each replicate. P values are calculated with Log-rank (Mantel-Cox) test. Details on strains and lifespan replicates can be found in Supplementary file 6. (e) raga-1(ok386) mutants live longer than wild type (p<0.0001). raga-1(ok386); aak-2(ok524) double mutant animals do not live significantly longer than aak-2(ok524) single mutants (p=0.9735). n = 5 independent biological replicates, sample size ranges between 90–129 deaths per treatment each replicate. P values are calculated with Log-rank (Mantel-Cox) test. Details on strains and lifespan replicates can be found in Supplementary file 6. (f) raga-1(ok386) mutants live longer than wild type (p<0.0001). raga-1(ok386) does not extend lifespan in an aak-2(wbm20) [AAK-2 (T243A)] CRISPR-generated allele background (p=0.5354). n = 3 independent biological replicates, sample size ranges between 93–119 deaths per treatment each replicate. P values are calculated with Log-rank (Mantel-Cox) test. Details on strains and lifespan replicates can be found in Supplementary file 6. (g) At the restrictive temperature 22.5°C to induce par-4 loss-of-function, raga-1 RNAi from adulthood extends lifespan in wild type animals (p<0.0001) but does not extend lifespan of par-4(it57) mutant animals (p=0.206). Worms were grown at 15°C until L4 stage before shifting to restrictive temperature. n = 3 independent biological replicates, sample size 68–115 deaths per treatment each replicate. P values are calculated with Log-rank (Mantel-Cox) test. Details on strains and lifespan replicates can be found in Supplementary file 6. (h) raga-1(ok386) null allele extends lifespan in animals expressing the non-phosphorylatable CRTC-1S76A, S179A driven by a pan-neuronal rab-3 promoter (p<0.0001). n = 3 independent biological replicates; sample size ranges between 90–121 deaths per treatment each replicate. P values are calculated with Log-rank (Mantel-Cox) test. Details on strains and lifespan replicates can be found in Supplementary file 6. (i) raga-1 RNAi from adulthood extends median lifespan of animals overexpressing aak-2aa1-321 driven by the ubiquitous sur-5 promoter in aak-2 mutant background (p<0.0001). n = 3 independent biological replicates; sample size ranges between 78–109 deaths per treatment. P values are calculated with Log-rank (Mantel-Cox) test. Details on strains and lifespan replicates can be found in Supplementary file 6. (j, k) raga-1 RNAi from adulthood does not extend median lifespan of animals overexpressing aak-2 aa1-321 driven by (j) an intestine-specific gly-19 promoter (p=0.0342) or (k) a muscle-specific myo-3 promoter in aak-2 mutant background (p=0.9827). n = 3 independent biological replicates; sample size ranges between 72–102 (intestine) and 44–107 (muscle) deaths per treatment each replicate. P values are calculated with Log-rank (Mantel-Cox) test. Details on strains and lifespan replicates can be found in Supplementary file 6. (l) raga-1 RNAi from adulthood can extend median lifespan of animals overexpressing aak-2 aa1-321 driven by the pan-neuronal rab-3 promoter in an aak-2 mutant background (p<0.0001). n = 4 independent biological replicates, sample size ranges between 66–117 deaths per treatment each replicate. P values are calculated with Log-rank (Mantel-Cox) test. Details on strains and lifespan replicates can be found in Supplementary file 6.
-
Figure 1—source data 1
Figure 1b AMPK activity is increased in raga-1 mutants.
- https://doi.org/10.7554/eLife.49158.004
Figure 1—figure supplement 1
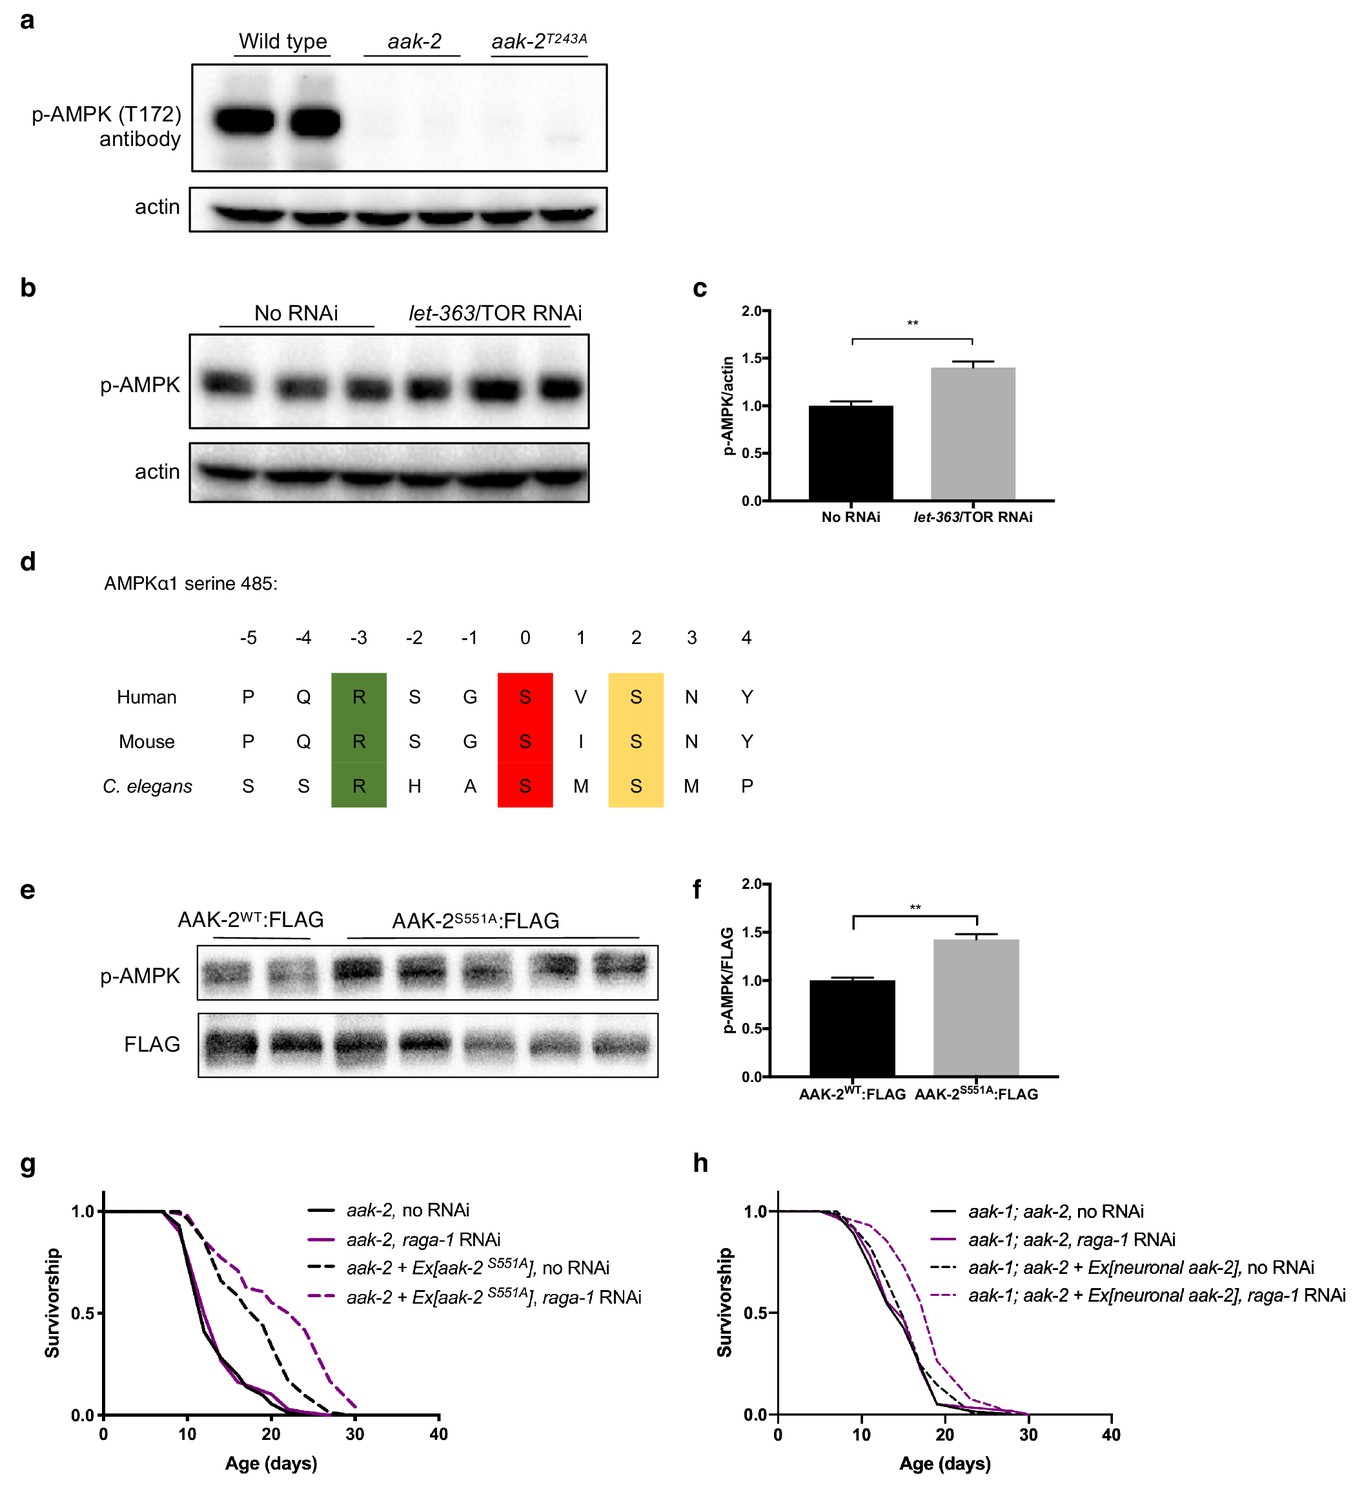
Conservation of critical residues in AAK-2 and their requirement for TORC1-mediated longevity.
(a) Western blot showing that a threonine-to-alanine mutation at T243 generated by CRISPR on aak-2 completely loses recognition for antibodies against phosphorylation at the conserved residue T172 in mammalian AMPKα. aak-2(ok524) mutants, which carry a 408 bp deletion spanning T243, are used as controls (representative immunoblot, n = 3 independent blots). (b, c) Western blot showing that AMPK T172 phosphorylation is increased in wild type worms treated with let-363 (TOR) RNAi. Actin levels are used as loading controls (representative immunoblot and corresponding quantification, n = 2 independent blots). Source data for quantification are provided in Figure 1—figure supplement 1—source data 1. (d) Alignment of C. elegans AAK-2 and human and mouse AMPKα1 around serine 485 showing the S6K target site is conserved in C. elegans.. (e, f) AMPK T172 phosphorylation is increased in strains overexpressing FLAG-tagged AAK-2 with serine-to-alanine mutation at the conserved S6K/Akt phosphorylation site S551 compared to wild type AAK-2. Actin levels are used as loading controls (quantification of n = 1 blot with two biological replicates for wild type AAK-2 and 5 biological replicates for AAK-2S551A). Source data for quantification are provided in Figure 1—figure supplement 1—source data 2. (g) raga-1 RNAi from day 1 of adulthood can still extend lifespan in aak-2(ok524) animals expressing AAK-2S551A (n = 2, sample size 53–98 deaths per treatment each replicate). Details on strains and lifespan replicates can be found in Supplementary file 6. (h) Pan-neuronal expression of full-length aak-2 rescues lifespan extension from raga-1 RNAi in aak-1; aak-2 double mutant background (p<0.0001, n = 1, sample size 58–80 deaths per treatment). P values are calculated with Log-rank (Mantel-Cox) test. Details on lifespan replicates and strains can be found in Supplementary file 6.
-
Figure 1—figure supplement 1—source data 1
Figure 1—figure supplement 1c AMPK activity is increased by knockdown of TOR.
- https://doi.org/10.7554/eLife.49158.005
-
Figure 1—figure supplement 1—source data 2
Figure 1—figure supplement 1f The conserved S6K/Akt phosphorylation site serine 551 on AAK-2 modulates AMPK activity.
- https://doi.org/10.7554/eLife.49158.006
Figure 2 with 3 supplements
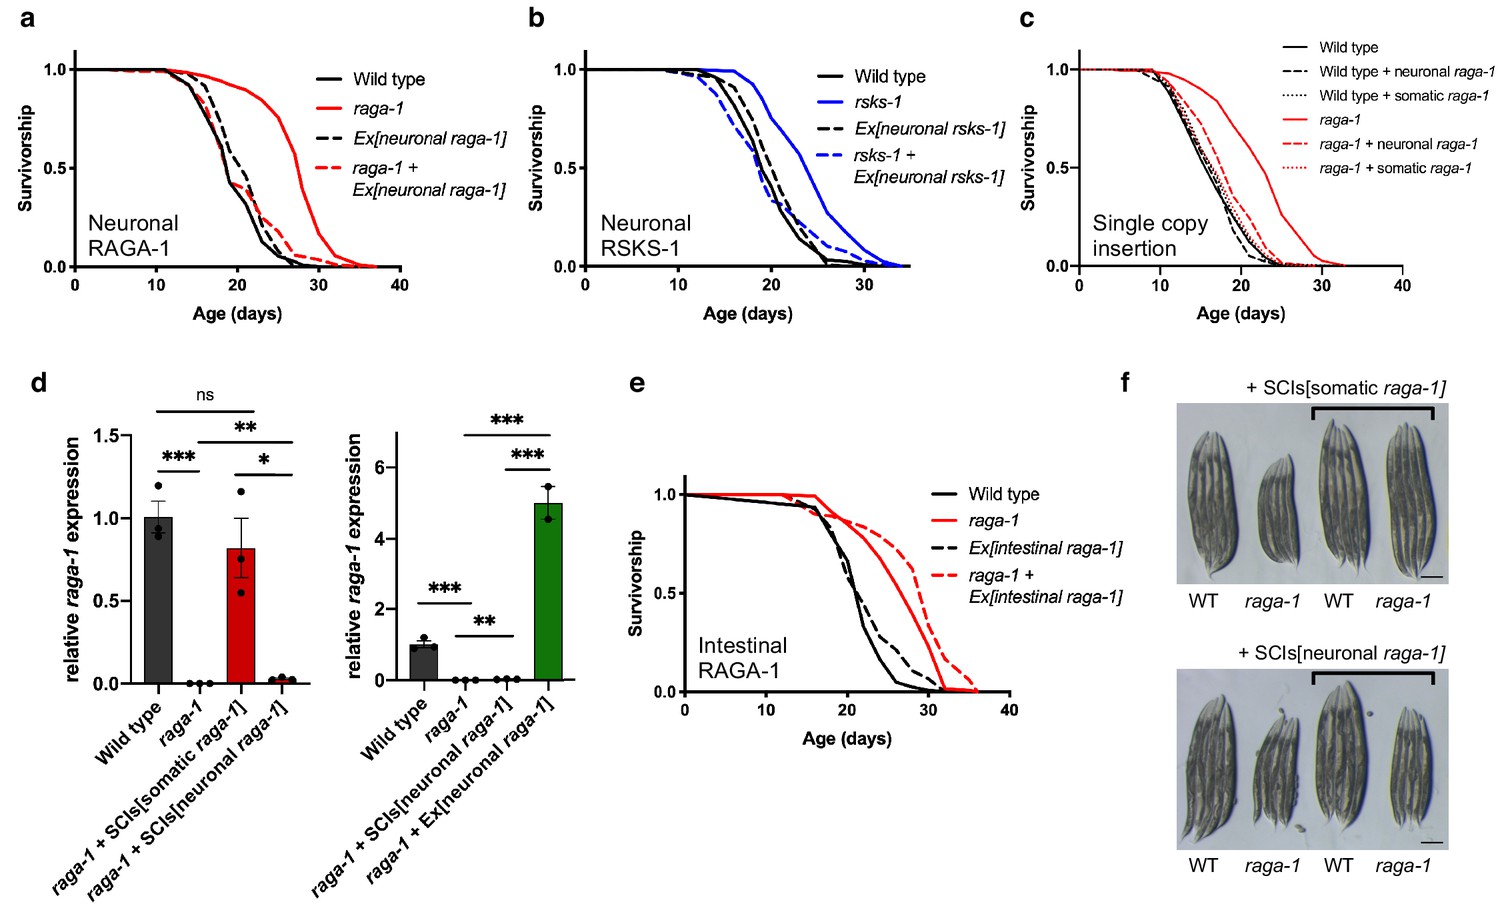
TORC1 signaling is required in neurons to regulate lifespan.
(a) The raga-1(ok386) deletion increases lifespan (p<0.0001). However, when raga-1 is expressed in the nervous system via extrachromosomal array using the rab-3 promoter, raga-1(ok386) does not extend lifespan (p=0.7932). n = 6 independent biological replicates; sample size ranges between 77–192 deaths per treatment each replicate. P values are calculated with Log-rank (Mantel-Cox) test. Details on strains and lifespan replicates can be found in Supplementary file 6. (b) The rsks-1(ok1255) deletion increases lifespan (p<0.0001). However, when rsks-1 is expressed in the nervous system by extrachromosomal array using the rab-3 promoter, rsks-1(ok1255) does not extend lifespan (p=0.6539). n = 4 independent biological replicates; sample size ranges between 81–121 deaths per treatment each replicate. P values are calculated with Log-rank (Mantel-Cox) test. Details on strains and lifespan replicates can be found in Supplementary file 6. (c) The lifespan extension resulting from raga-1(ok386) deletion is significantly suppressed by reintroduction of raga-1 in the nervous system as a single copy transgene (p<0.0001). n = 3 independent biological replicates. P value calculated with Log-rank (Mantel-Cox) test. As described in Materials and methods, ‘neuronal raga-1’ refers to single copy transgene driven by the rab-3 promoter. ‘somatic raga-1’ refers to single copy transgene driven by the eft-3 promoter. Details on strains used and lifespan replicates can be found in Supplementary file 6. (d) Relative raga-1 expression generated from integrated single copy transgenes (left) compared to extrachromosomal array (right) as determined by qPCR. Points plotted are from independent biological samples. Error bars denote mean + /- SEM. P values determined by 2-tailed t test. raga-1 expression driven from single copy insertion transgenes (SCIs) and controls shown on the left were replotted next to expression generated by extrachromosomal array on the right to highlight relative differences in expression. All samples were run in parallel. (e) raga-1(ok386) allele extends lifespan both in the wild type background (p<0.0001) and with raga-1 expressed in the intestine by extrachromosomal array using the intestine-specific ges-1 promoter (p<0.0001). n = 3 independent biological replicates; sample size ranges between 83–126 deaths per treatment each replicate. P values are calculated with Log-rank (Mantel-Cox) test. Details on strains and lifespan replicates can be found in Supplementary file 6. (f) Somatic (top), but not neuronal (bottom), expression of raga-1 driven by single copy transgene rescues the small body size exhibited by raga-1(ok386) mutants. Scale bar = 200 μm.
-
Figure 2—source data 1
Figure 2e qPCR of raga-1 expression in SCIs and extrachromosomal lines.
- https://doi.org/10.7554/eLife.49158.011
Figure 2—figure supplement 1
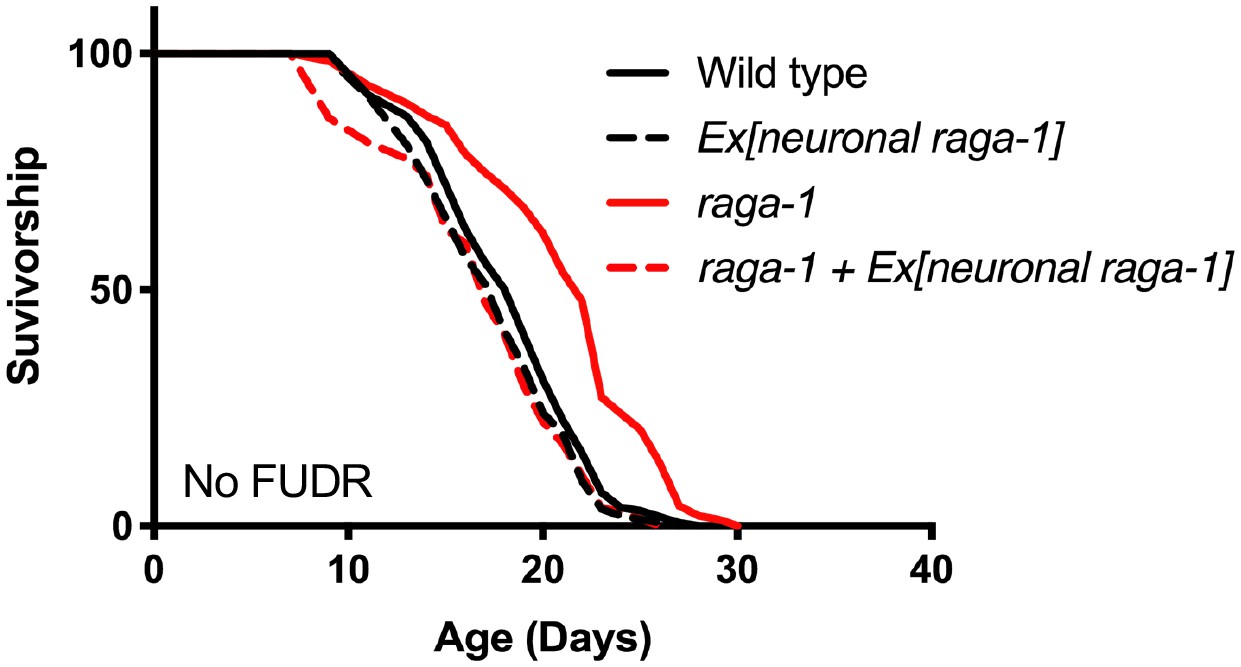
Neuronal raga-1 expressed by extrachromosomal transgene suppresses raga-1 mutant longevity when animals are not treated with FUDR to prevent progeny development.
Details on strains and lifespan replicates can be found in Supplementary file 6.
Figure 2—figure supplement 2
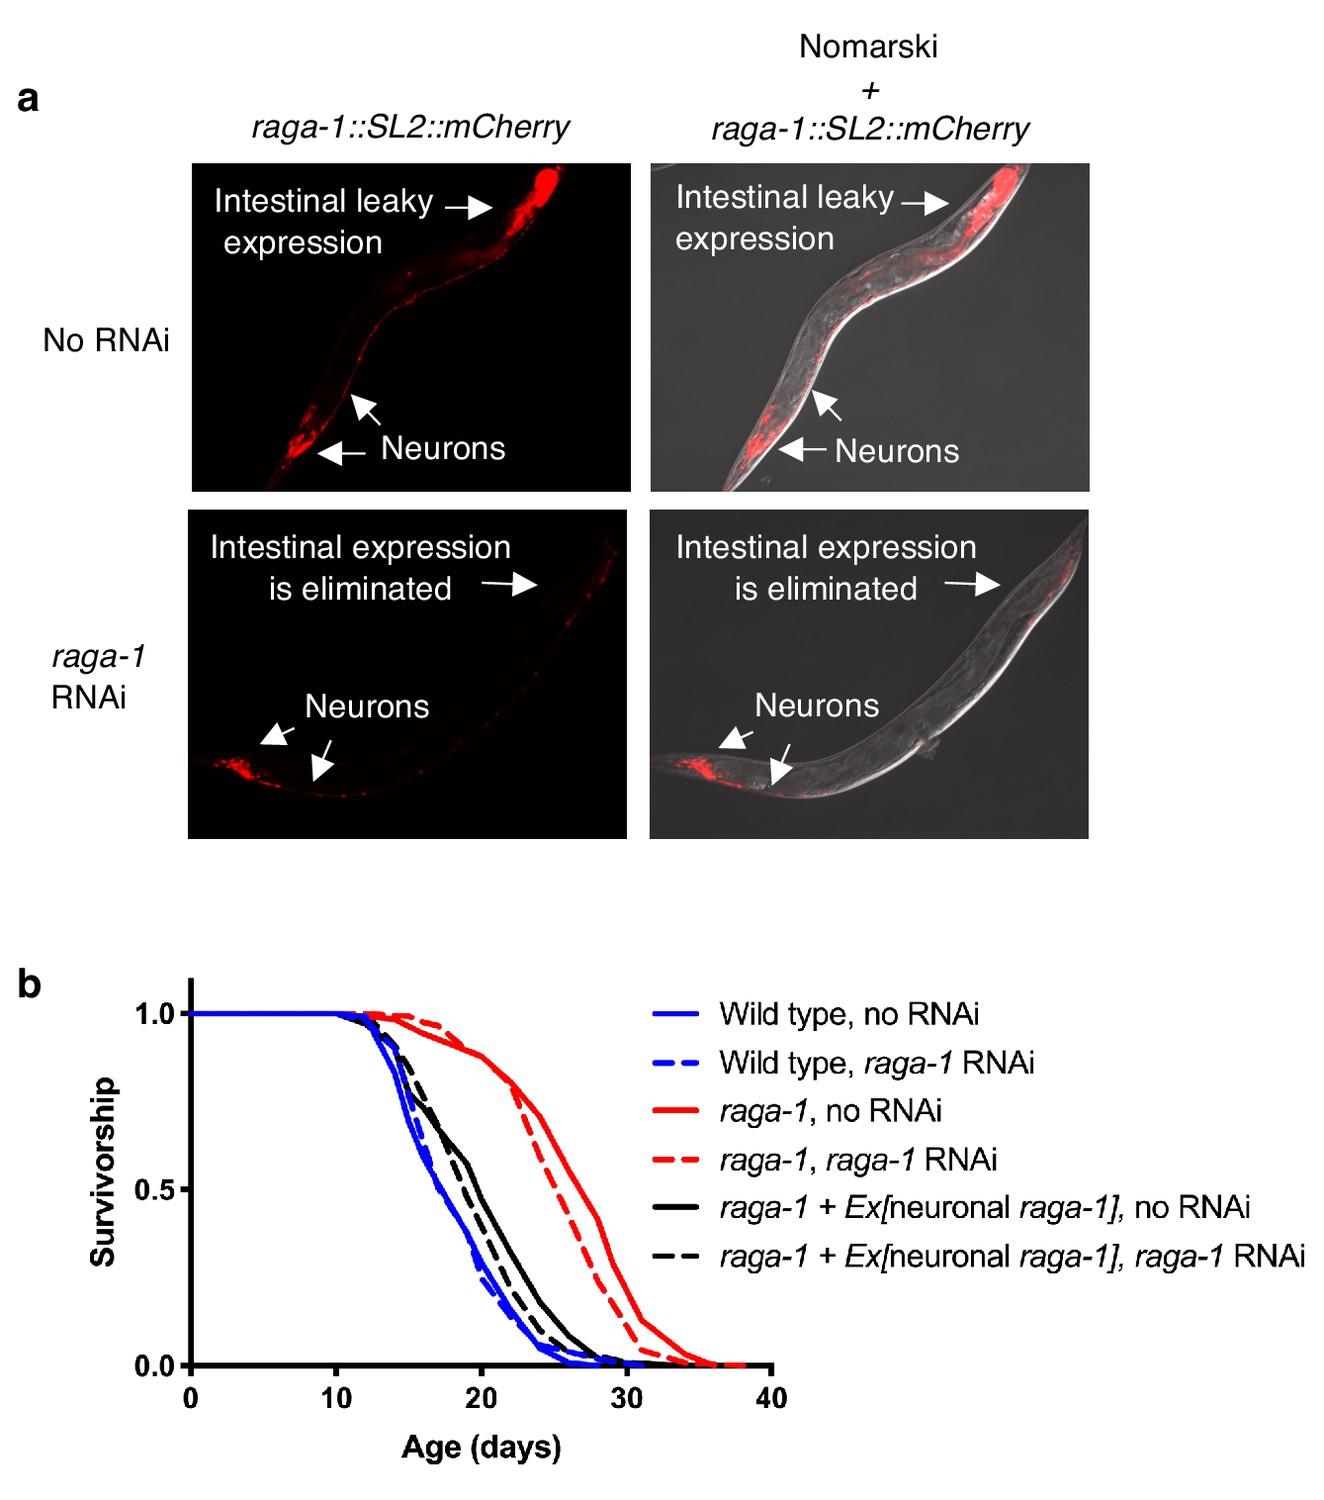
Elimination of raga-1 in the intestine by RNAi does not impair rescue by the extrachromosomal neuronal raga-1 array.
(a) raga-1 RNAi eliminates non-specific expression of the rab-3p::raga-1::SL2::mCherry extrachromosomal transgene in the intestine but preserves expression in neurons. Images were taken from adult day 10 animals using 25 ms exposure time. n = 2 independent trials, images are representative of 12–16 worms per treatment per replicate. (b) raga-1 RNAi eliminates non-specific expression in the intestine but does not restore longevity in raga-1 neuronal rescue animals (n = 2, sample size ranges between 83–123 per treatment per replicate). RNAi was combined with FUDR treatment. Details of protocol are in the Materials and methods section. P values calculated with Log-rank (Mantel-Cox) test for lifespan replicates are included in Supplementary file 6.
Figure 2—figure supplement 3
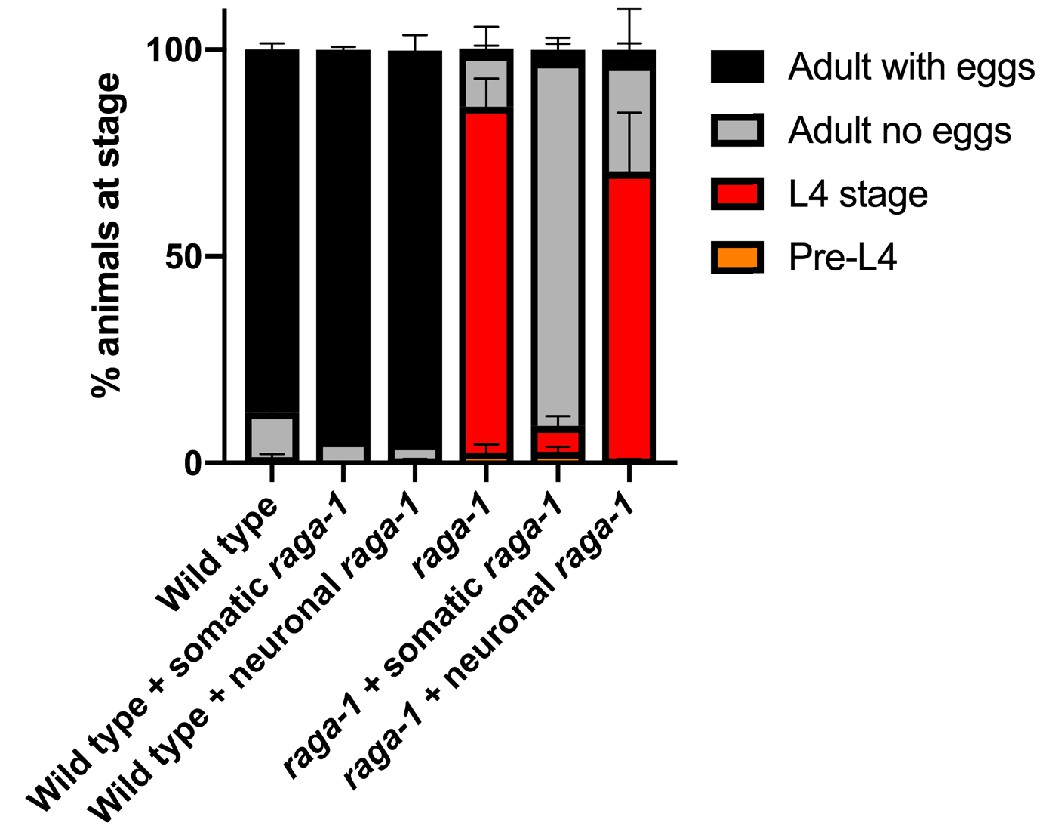
Neuronal raga-1 does not rescue development delay of raga-1(ok386) mutants.
Stacked bar graph showing percent of animals at the noted developmental stage after 72 hr at 20°C. Shown are averaged values from two independent experiments. Error bars denote SEM. ‘neuronal raga-1’ and ‘somatic raga-1’ refer to CRISPR-generated single copy transgenes driven by the rab-3 and eft-3 promoters, respectively.
-
Figure 2—figure supplement 3—source data 1
Figure 2—figure supplement 3 Developmental stages of raga-1 rescue lines.
- https://doi.org/10.7554/eLife.49158.012
Figure 3 with 3 supplements
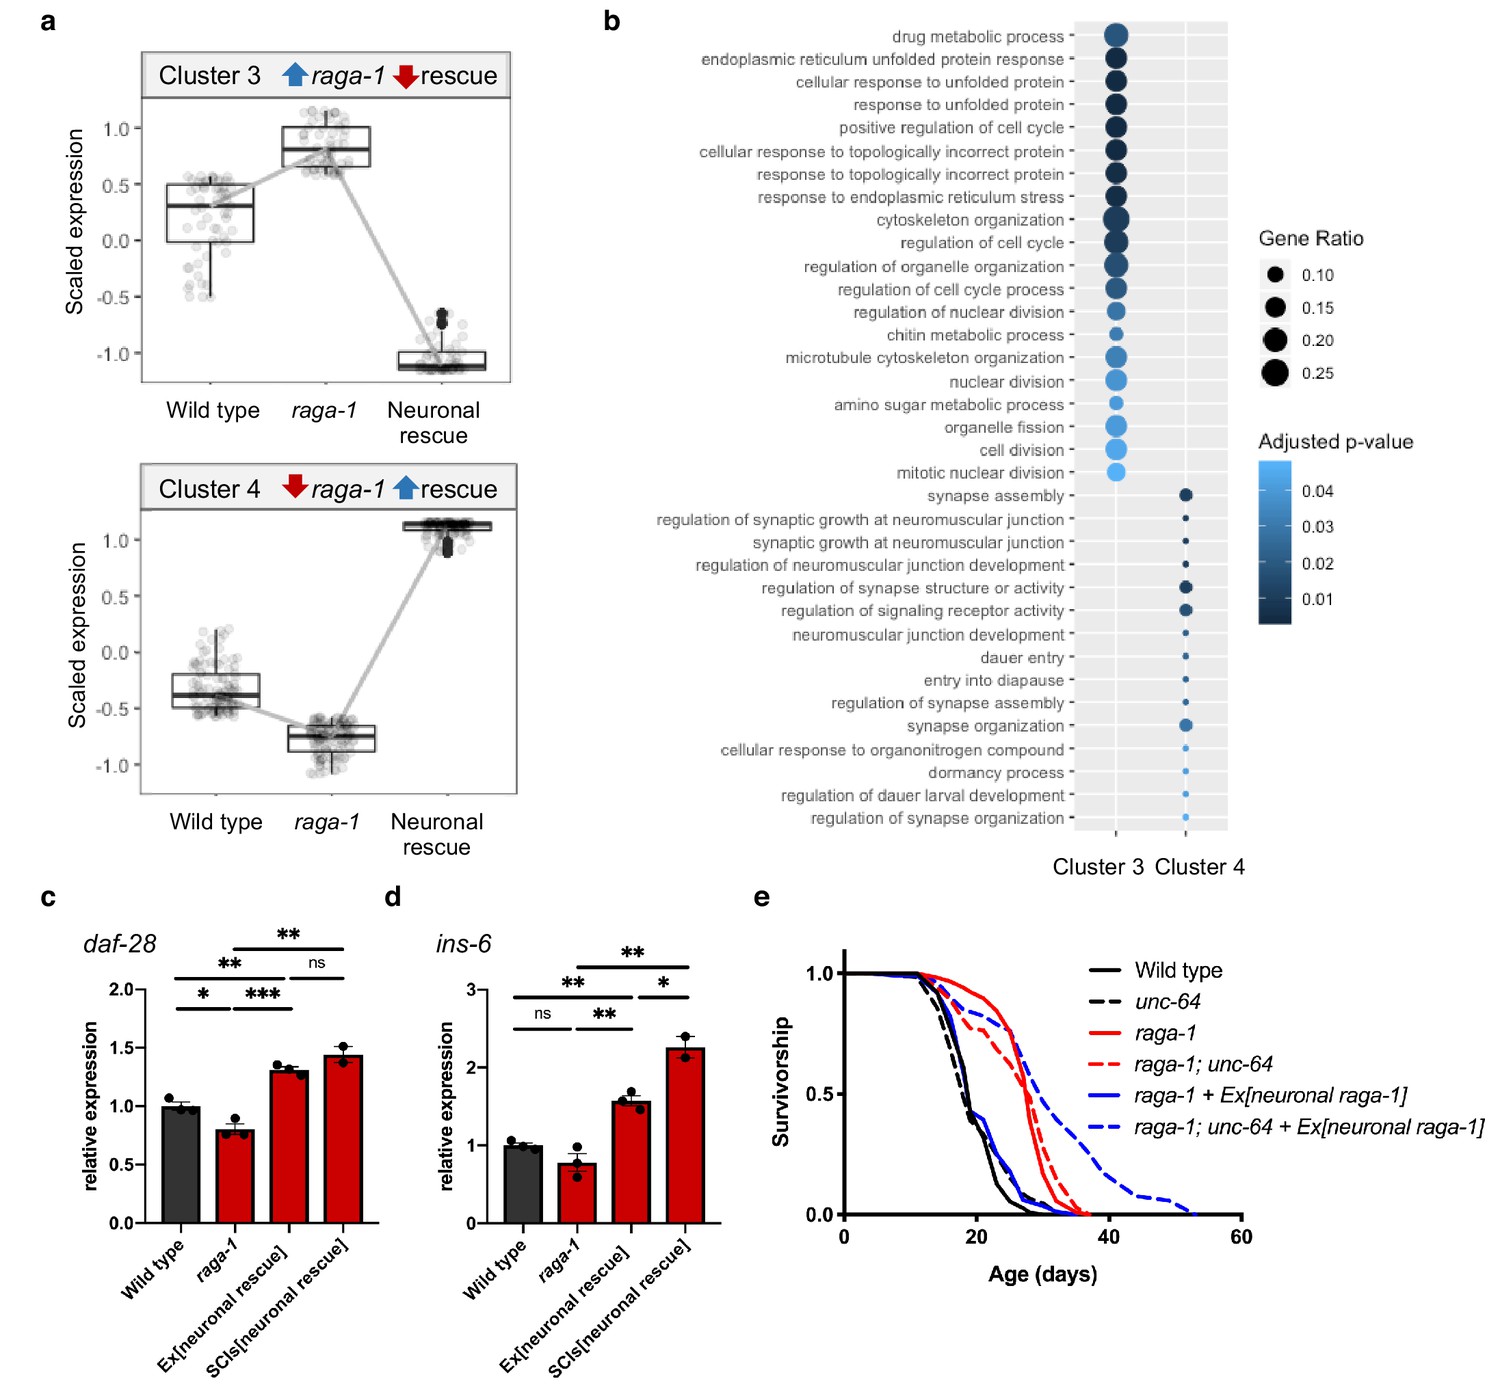
Neuronal TORC1 modulates aging via changes to organelle organization and neuropeptide signaling.
(a) Cluster analysis identified 59 genes that show increased expression in raga-1(ok386) that is reversed by neuronal rescue array (Cluster 3, top) and 107 genes that show decreased expression in raga-1 that is reversed by neuronal rescue (Cluster 4, bottom). (b) Over-representation analysis of the Gene Ontology biological process terms for genes comprising each of the clusters shown in panel (a). (c, d) qPCR to validate increased expression of daf-28 (c) and ins-6 (d) in independent samples. Samples were generated from L4 larvae to match the timepoint of RNA-Seq sample collection. Independent biological replicates were processed and amplified in parallel. ‘Ex[neuronal rescue]’ refers to raga-1(ok386) animals rescued by extrachromosomal array, ‘SCIs[neuronal rescue]’ refers to raga-1(ok386) animals rescued by single copy insertion. P values determined by 2-tailed t test. Source data are provided in Figure 3—source data 1. (e) The unc-64(e246) hypomorphic allele significantly extends lifespan in raga-1 neuronal rescue background (p<0.0001), but not in wild type (p=0.3449) or raga-1 mutant (p=0.2708). n = 3 independent biological replicates, sample size ranges between 64–121 deaths per treatment each replicate. P values are calculated with Log-rank (Mantel-Cox) test. Details on strains and lifespan replicates can be found in Supplementary file 6.
-
Figure 3—source data 1
Figure 3c and d qPCR of daf-28 and ins-6.
- https://doi.org/10.7554/eLife.49158.017
Figure 3—figure supplement 1
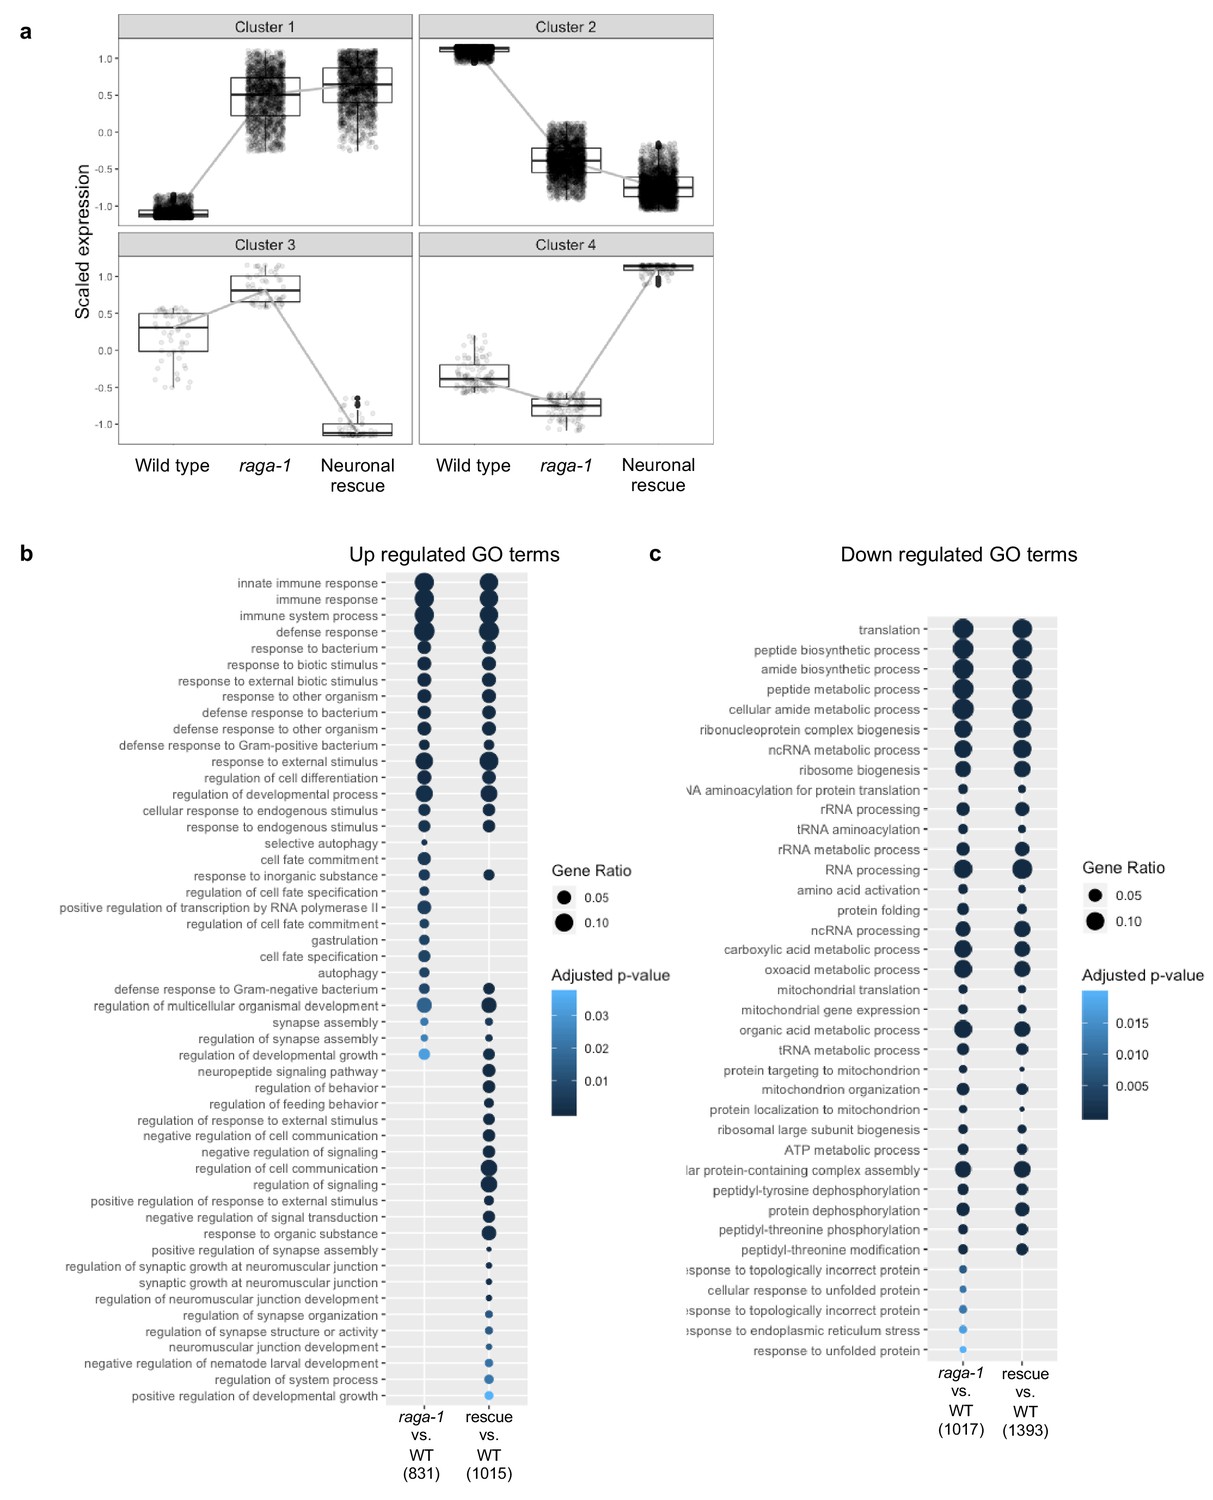
Gene clusters and differentially represented GO terms identified by analysis of RNA-seq.
(a) Plot depicting the profiles of gene expression defining each cluster of differentially expressed genes. Most differentially expressed genes in raga-1(ok386) are not rescued by the neuronal raga-1 array. Clusters 1 and 2 contain 1737 and 2325 genes, respectively, that show similar changes in expression in both raga-1 samples and in samples with neuronal rescue. Cluster 3 contains 59 genes that show increased expression in raga-1 that is reversed by neuronal rescue, Cluster 4 contains 107 genes that show decreased expression in raga-1 that is reversed by neuronal rescue. (b) Over-representation analysis of Gene Ontology biological process terms for significant genes identified from pair-wise analysis of raga-1 samples relative to WT and in neuronal rescue samples relative to WT.
Figure 3—figure supplement 2

Validation of changes identified by RNA-seq in independent biological samples.
Independent biological samples were collected and tested for gene expression changes identified by RNA-Seq by qPCR. Three new samples for each strain used in the RNA-Seq experiment (wild type (N2), raga-1(ok386), and neuronal rescue strain) as well as two samples from the single copy transgene neuronal rescue line were collected as L4 staged larvae, processed, tested, and analyzed in parallel. Genes selected for validation were among the most significantly changed genes in pairwise comparison between raga-1 and neuronal rescue. For each gene, the expression profile obtained by RNA-Seq is plotted to the left, and relative expression determined in new samples by qPCR is plotted to the right. The qPCR results for ins-6 and daf-28 shown in Figure 2e are shown again here for comparison to values obtained by RNA-Seq. Data are presented as mean ± s.e.m. P value: NS no significance, *<0.05, **<0.01, ***<0.001, ****<0.0001 relative to controls. Statistical significance for qPCR was determined by two-tail t-test. Significance values for RNA-Seq are corrected for false discovery rate. Source data are provided in Figure 3—figure supplement 2—source data 1.
-
Figure 3—figure supplement 2—source data 1
Figure 3—figure supplement 2 qPCR validation of RNA seq results.
- https://doi.org/10.7554/eLife.49158.018
Figure 3—figure supplement 3
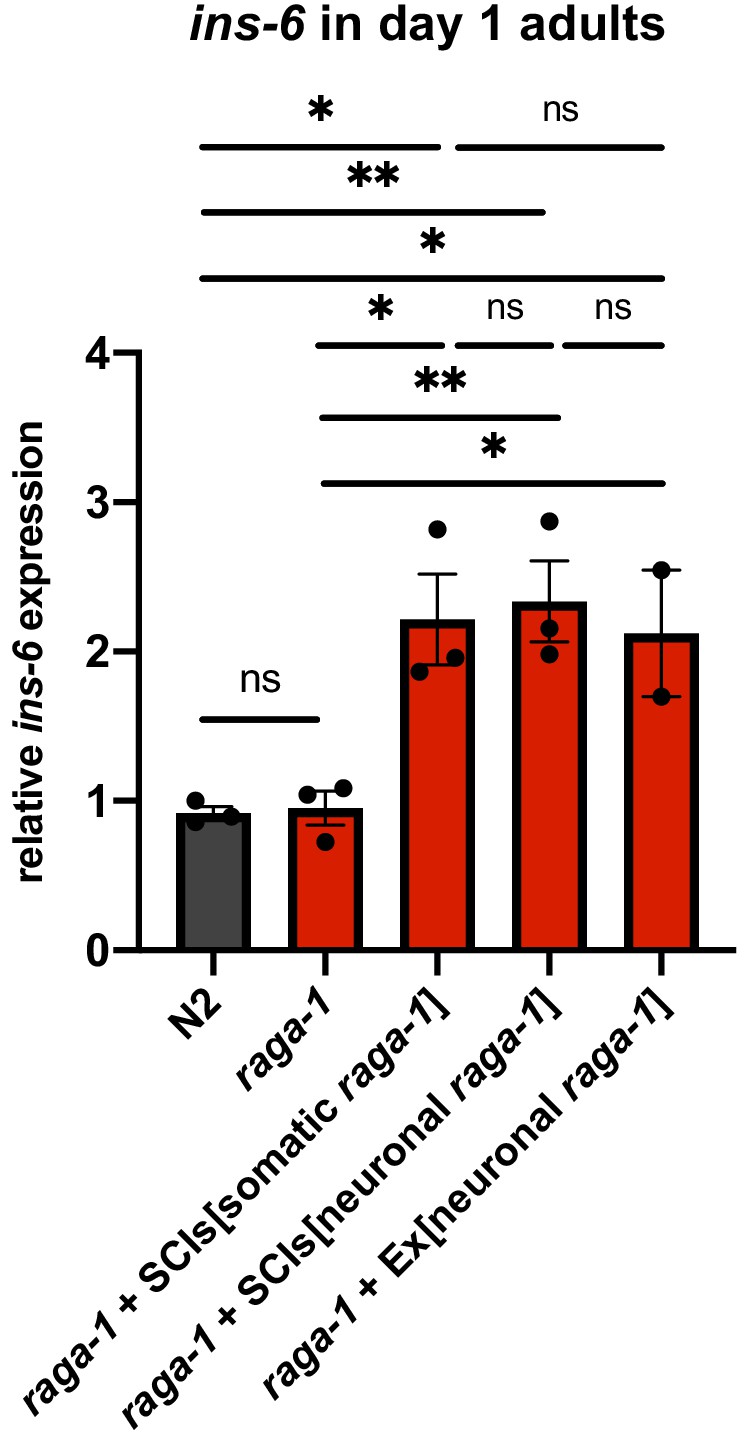
Neuronal raga-1 regulates ins-6 expression in adults.
Relative expression of ins-6 in animals at day 1 of adulthood as determined by qPCR. Points plotted are from independent biological samples. Error bars denote mean + /- SEM. P values determined by 2-tailed t test. Source data are provided in Figure 3—figure supplement 3—source data 1.
-
Figure 3—figure supplement 3—source data 1
Figure 3—figure supplement 3 qPCR of ins-6 in day 1 adults.
- https://doi.org/10.7554/eLife.49158.019
Figure 4 with 6 supplements
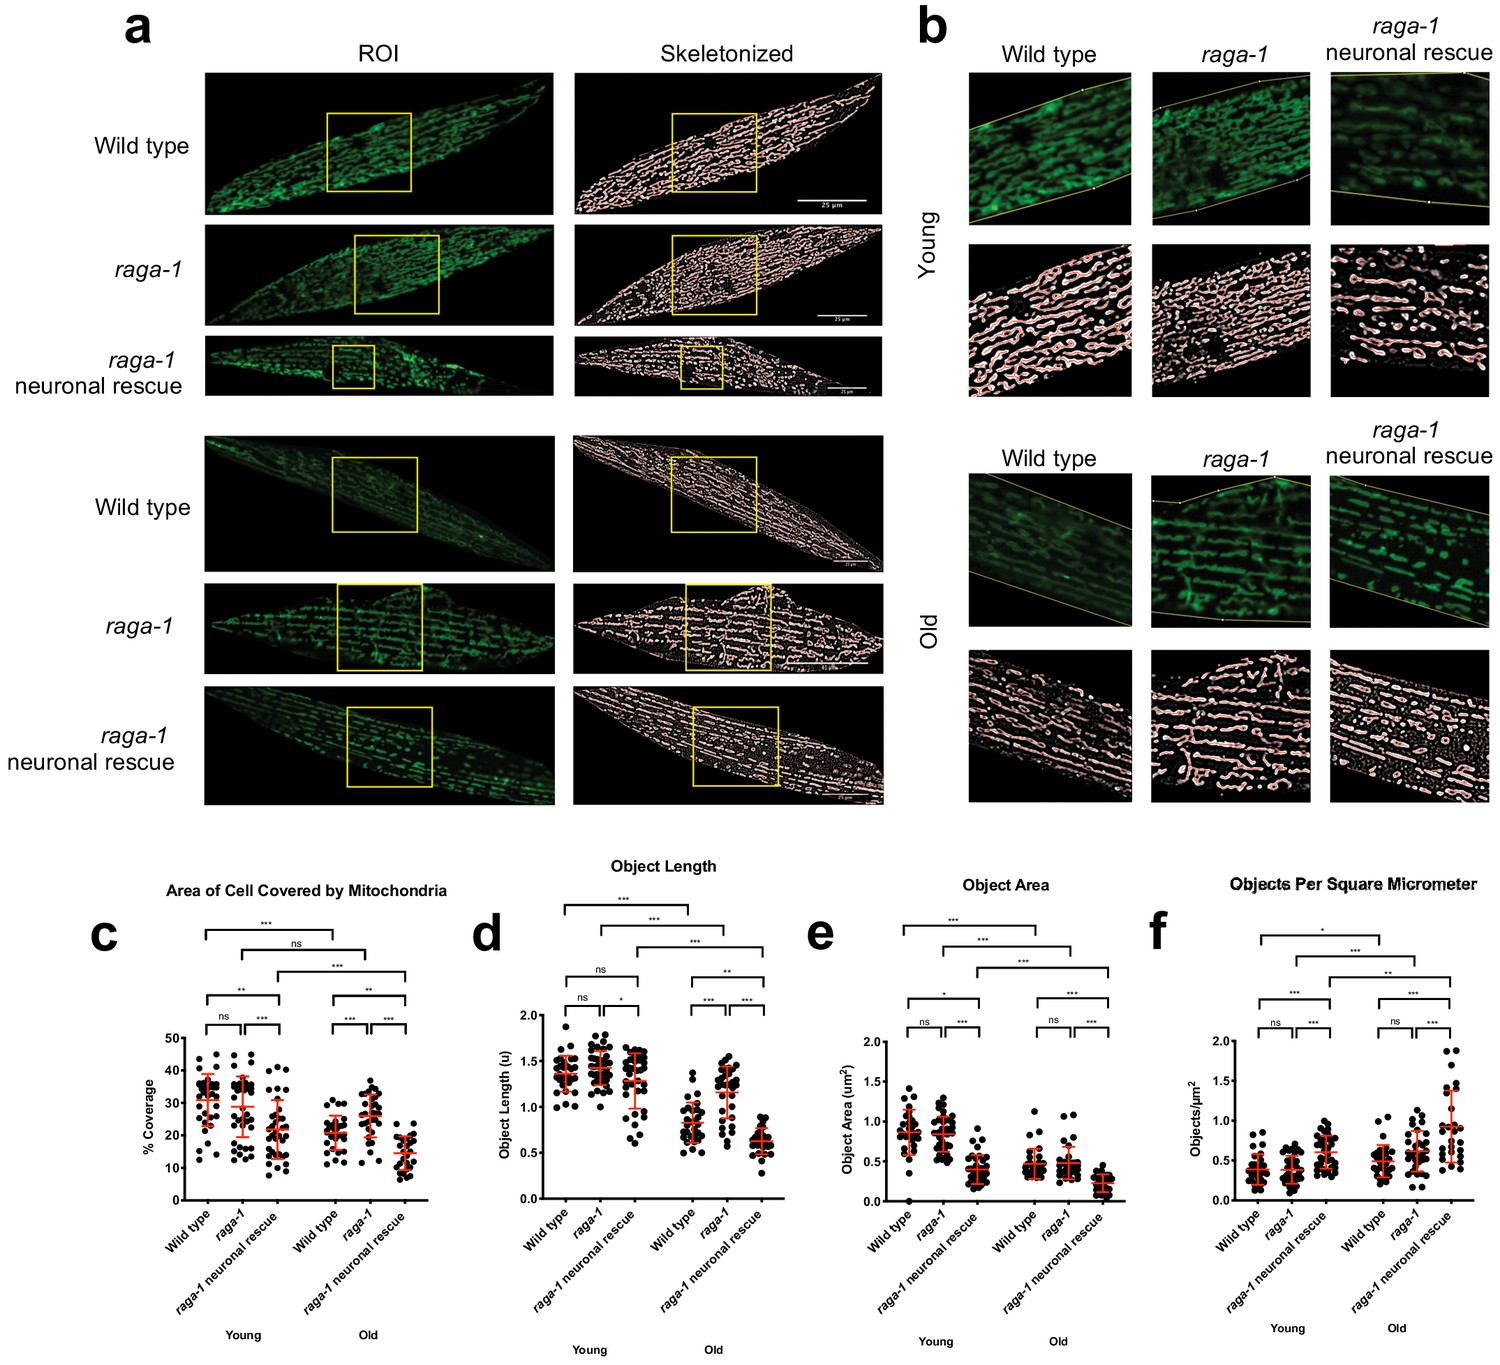
Neuronal RAGA-1 drives mitochondrial fragmentation in muscle cells.
(a) Representative pictures showing that loss of raga-1 preserves muscle mitochondrial content during aging, while neuronal RAGA-1 reverses these effects as seen in the corresponding skeletonized images (Left) post MitoMAPR processing. The mitochondrial skeleton (red) is overlaid on binary images. TOMM-20aa1-49::GFP reporter labels mitochondria in young (day 2) and old (day 11) wild type, raga-1(ok386) mutant and raga-1 neuronal rescue animals (n = 2 independent trials, 16–29 cells were imaged per genotype each time point per replicate). Scale bar represents 25 μm. (b) zoomed insets from (a) (yellow boxes). (c–h) Quantification showing that neuronal raga-1 rescue animals also have decreased mitochondrial coverage (c), greater degree of fragmentation as seen by decreased mitochondrial length (d) and area (e) and increased object number normalized to area (f) compared to raga-1 mutants. Data are represented as mean ±S.D. P value: NS no significance, *<0.05, **<0.01, ***<0.001, between comparisons as indicated by bars. Statistical significance was determined by One-way ANOVA and Welch’s t test. 16–29 cells were quantified per genotype for each time point per replicate (n = 2 independent trials, 25–30 cells were imaged per genotype each time point per replicate). Source data are provided in Figure 4—source data 1.
-
Figure 4—source data 1
Figure 4c-h and Figure 4—figure supplement 5 Effects of neuronal raga-1 rescue on parameters of muscle mitochondrial morphology.
- https://doi.org/10.7554/eLife.49158.027
Figure 4—figure supplement 1
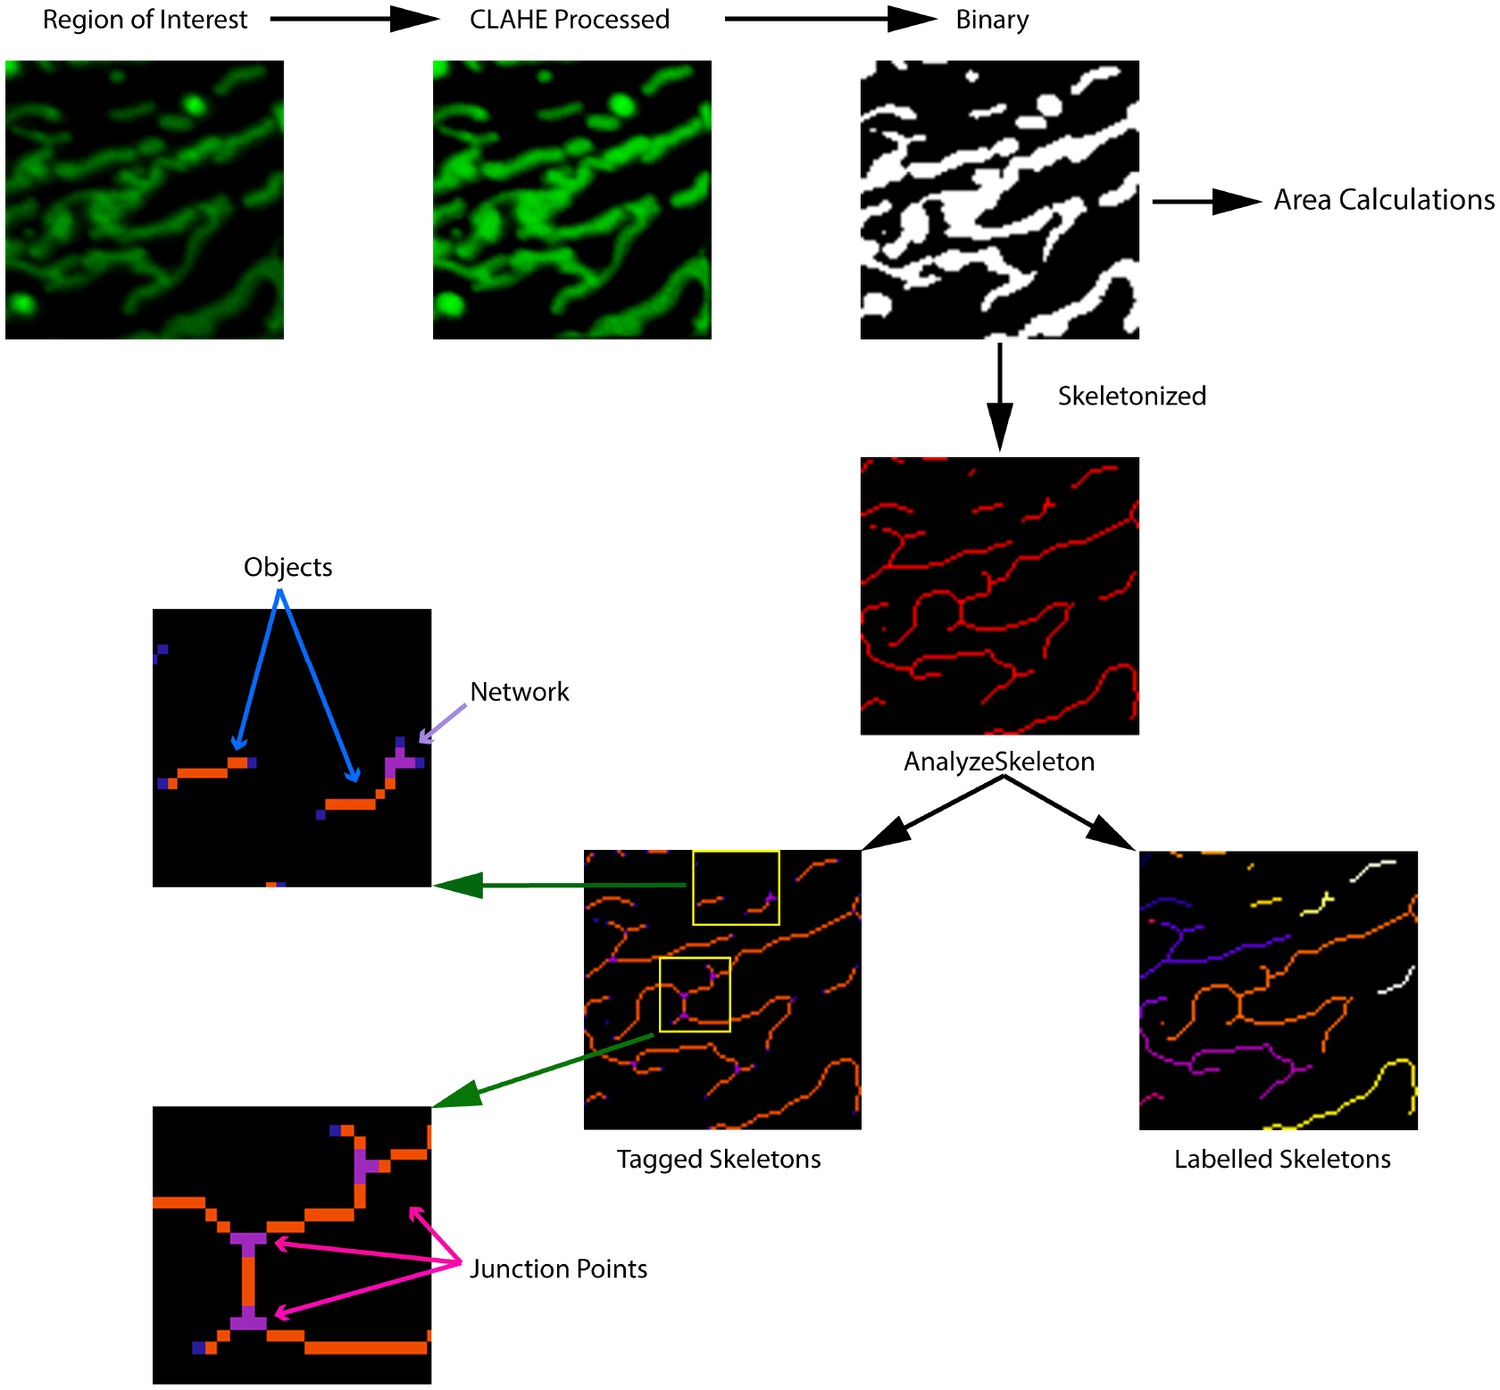
Workflow for MitoMAPR analysis.
A Region of Interest (15 × 15 um) was processed by the MitoMAPR macro. The ROI is enhanced for signal intensity by Enhance Local Contrast (CLAHE) followed by conversion to Binary. The binary image is then skeletonized and the skeletonized image is then processed by the AnalyzeSkeleton plugin to generated Tagged and Labelled Skeletons. Labelled Skeleton has each Object-Skeleton marked out in different colors to illustrate separation and Object Count (OC). Tagged Skeletons have junction points marked out in purple. The top zoomed inset illustrates two separate objects and one Network (N) with one Junction point. The bottom inset illustrates one network with three individual Junction Points (JP). The signal intensity from the binary image is used for area calculations to determine the Mitochondrial Footprint (MF) which then divided by the Object Count (OC) to calculate the Object Area (OA).
Figure 4—figure supplement 2

Examples of networks analyzed by MitoMAPR.
Using Networks (N) and Junction Point (JP) values, it is possible to estimate the degree of complexity of the mitochondrial network. As illustrated the four cells (A–D) have their mitochondria marked out in green. The mitochondrial objects are counted in orange (Object Counts), Networks in black and Junction Points (JP) are marked out in purple. While panel A has three objects, it has only two networks, with one Junction Point in one network and three in the other. Panel B has no networks since none of the objects have any junction points. Conversely, panel D has three distinct objects and two networks. The larger network has 9 Junction points while the smaller one possesses a single junction point. A higher number of junction points indicates a greater degree of branching and larger network spread. Building on these attributes, compared to samples A-C, sample D exhibits a higher mitochondrial complexity and interconnectivity.
Figure 4—figure supplement 3
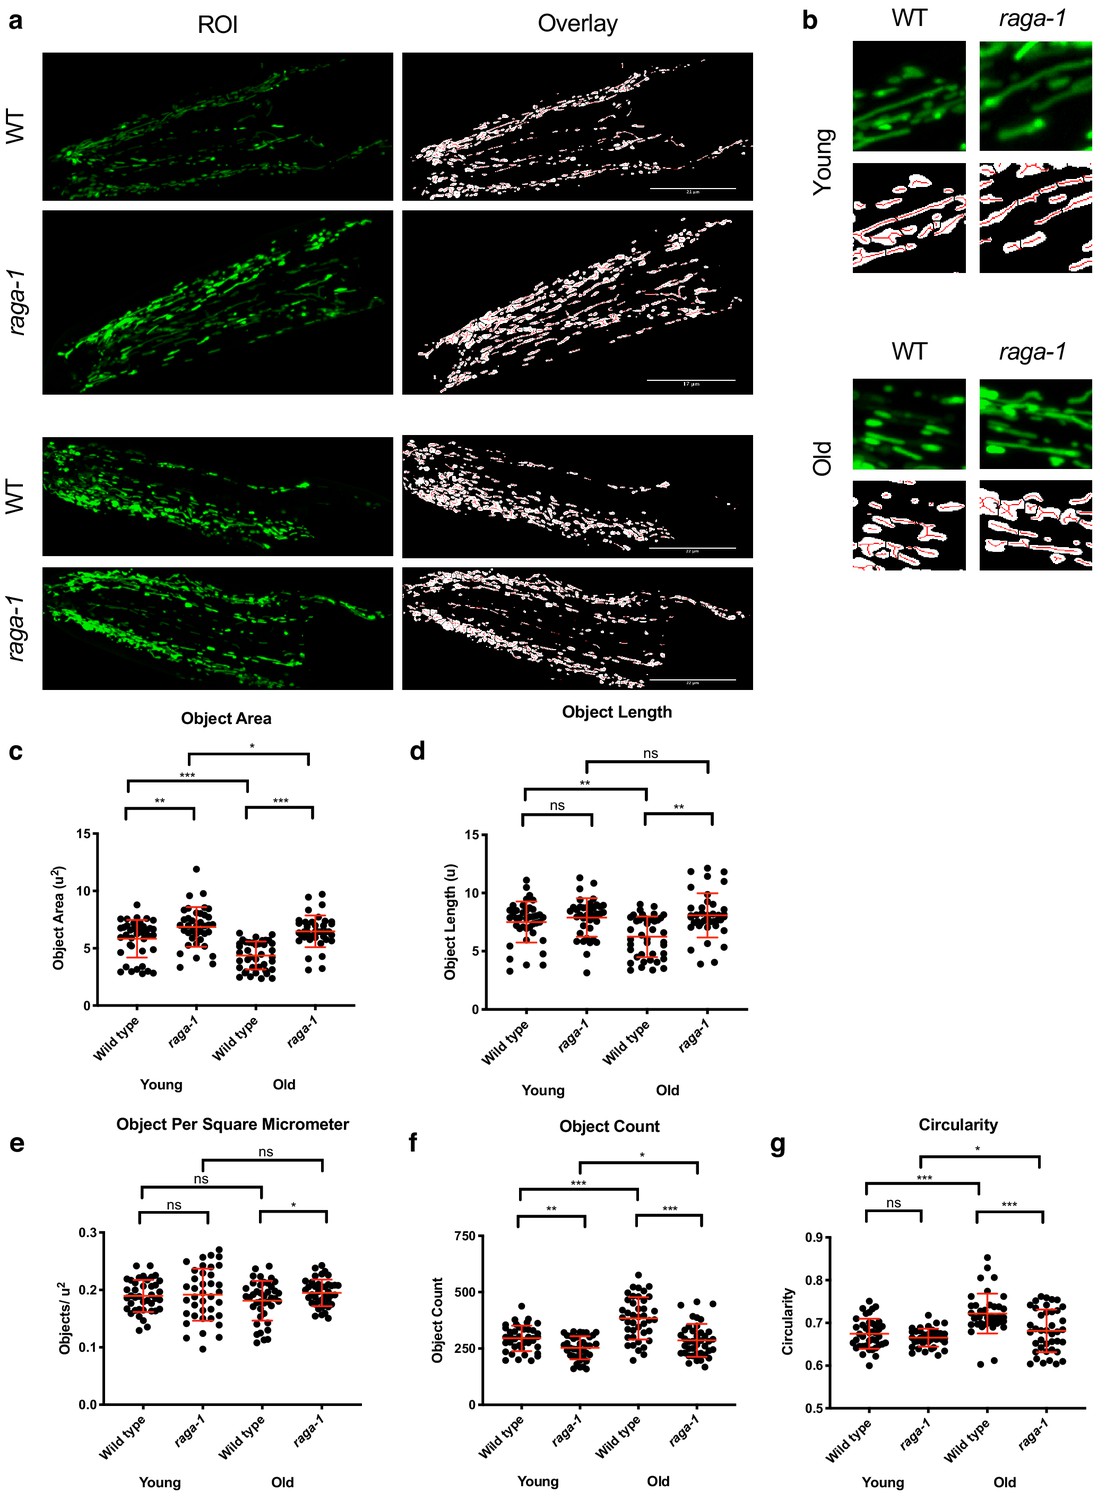
raga-1 deletion affects mitochondrial network states in neurons.
(a–b) Representative pictures (a) showing that loss of raga-1 preserves mitochondrial content during aging, in neurons as seen in the overlay images (Left) post MitoMAPR processing. The mitochondrial backbone (red) is overlaid on binary images. TOMM-20aa1-49::GFP reporter labels mitochondria in young (day 1/2) and old (day 15) wild type and raga-1(ok386) mutant (n = 3 independent trials,~30 cells were imaged per genotype each time point per replicate). Scale bar represents 25 μm. (b) zoomed insets from (a). (c–g) Quantification showing that raga-1 deletion animals exhibit increased object area (c) and object length (d) compared to aged wildtype animals in neurons. In accordance to these observations, the raga-1 deletion animals also have decreased mitochondrial particle count (f), mitochondrial particles per unit area (e) and circularity (g) indicating a tendency for to maintain a fused mitochondrial network state even at day 15. Data are represented as mean ±S.D.. P value: NS no significance, *<0.05, **<0.01, ***<0.001, between comparisons as indicated by bars. Statistical significance was determined by One-way ANOVA and Welch’s t test. 16–29 cells were quantified per genotype for each time point per replicate (n = 3 independent trials,~30 cells were imaged per genotype each time point per replicate).
-
Figure 4—figure supplement 3—source data 1
Figure 4—figure supplement 3c-f Effects of neuronal raga-1 rescue on parameters of neuronal mitochondrial morphology.
- https://doi.org/10.7554/eLife.49158.028
Figure 4—figure supplement 4
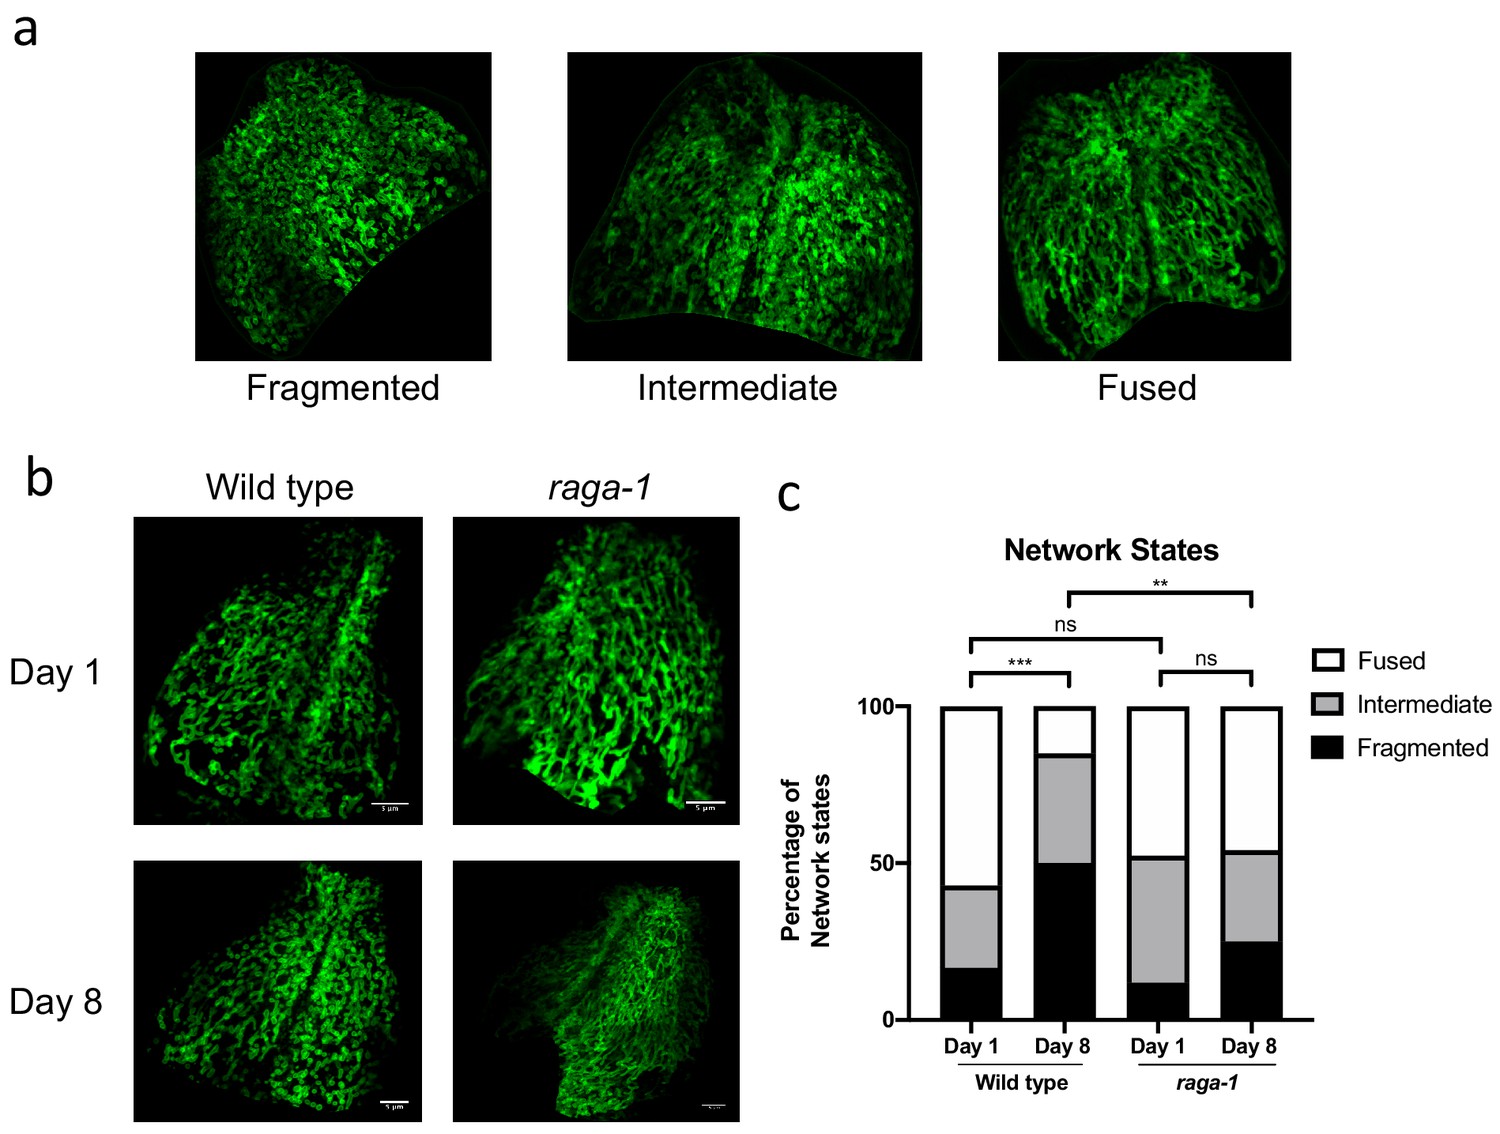
raga-1 deletion prevents mitochondria fragmentation in intestine.
(a) Mitochondrial architecture in the intestine can be categorized manually into fragmented, intermediate and fused network states. (b) Representative pictures showing that loss of raga-1 preserves mitochondrial content during aging, while the mitochondrial morphology undergoes age related fragmentation in aged wild type animals. (c) Categorization of intestinal mitochondria in wild type and raga-1 mutant animals with age. Based on the groups Fragmented, Intermediate and Fused, the blinded data sets were categorized individually and represented in the graphs as percentage of total population. Statistics on the data were derived from Chi-square test performed between Wt_day1 and Wt_day8, Wt_day1 and raga-1_day1, Wt_day8 and raga-1_day8 and raga-1_day1 and raga-1_day8. ns no significance, *<0.05, **<0.01, ***<0.001, between comparisons as indicated by bars. Age dependent changes in Mitochondrial network states was also derived by performing Chi-square test for trend between Wt_day1 and Wt_day8 and raga-1_day1 and raga-1_day8. Chi-square test for trend results: Wt_day1 vs Wt _day8; P value = <0.0001 (***); raga-1_day1 vs raga-1 _day 8 = 0.3544 (ns).
-
Figure 4—figure supplement 4—source data 1
Figure 4—figure supplement 4c Network states of intestinal mitochondria in raga-1 mutants.
- https://doi.org/10.7554/eLife.49158.029
Figure 4—figure supplement 5
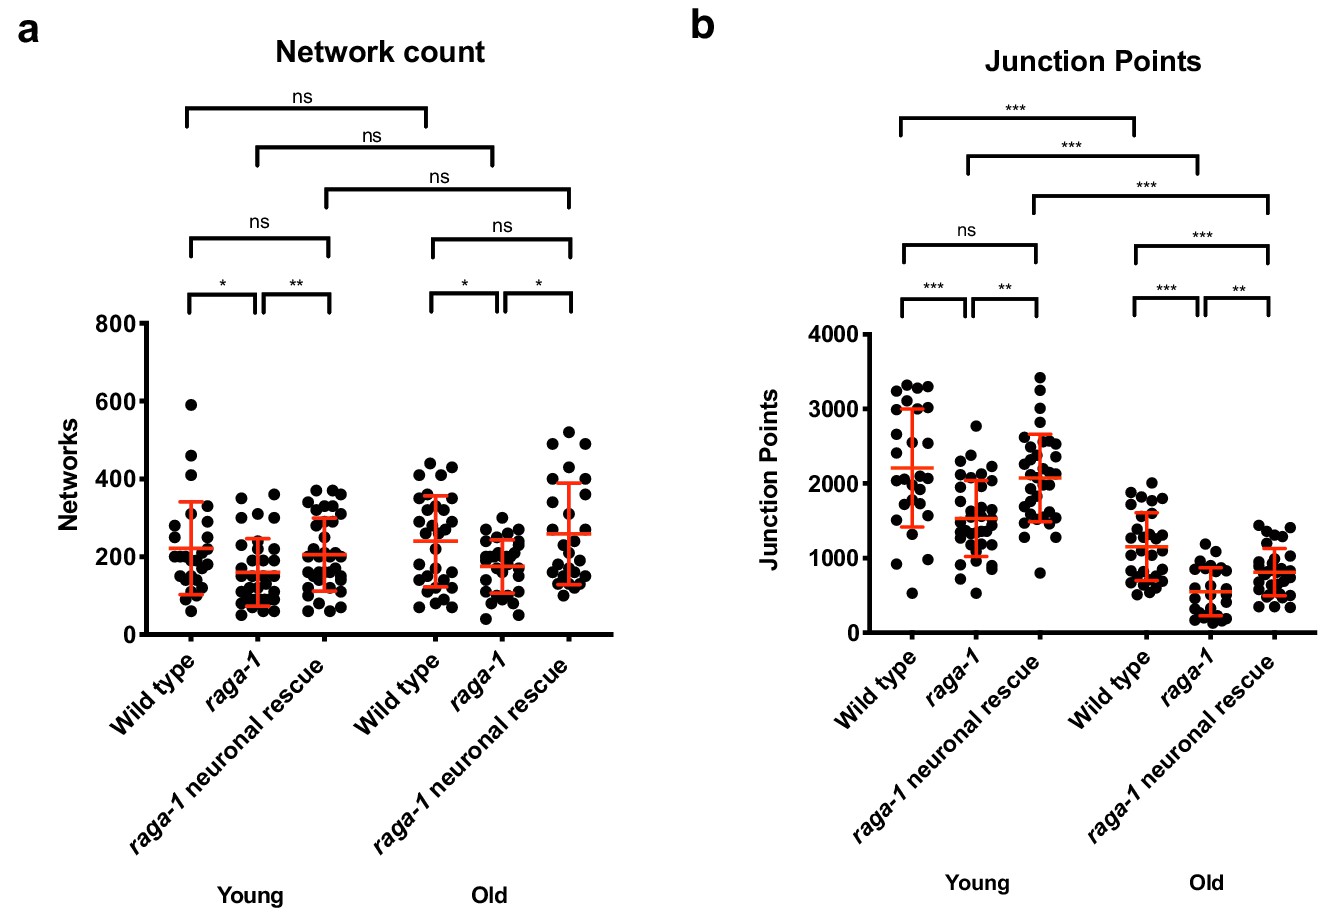
Neuronal raga-1 expression alters muscle mitochondrial architecture.
Quantification showing that neuronal raga-1 rescue animals also have decreased network count (a) and number of junction points (b) indicating that the mitochondrial architecture in these animals are of lower complexity and exhibit decreased interconnectedness. Data are represented as mean ±S.D. P value: NS no significance, *<0.05, **<0.01, ***<0.001, between comparisons as indicated by bars. Statistical significance was determined by One-way ANOVA and Welch’s t test. 16–29 cells were quantified per genotype for each time point per replicate (n = 2 independent trials, 25–30 cells were imaged per genotype each time point per replicate). Source data are provided in Figure 4—source data 1.
Figure 4—figure supplement 6
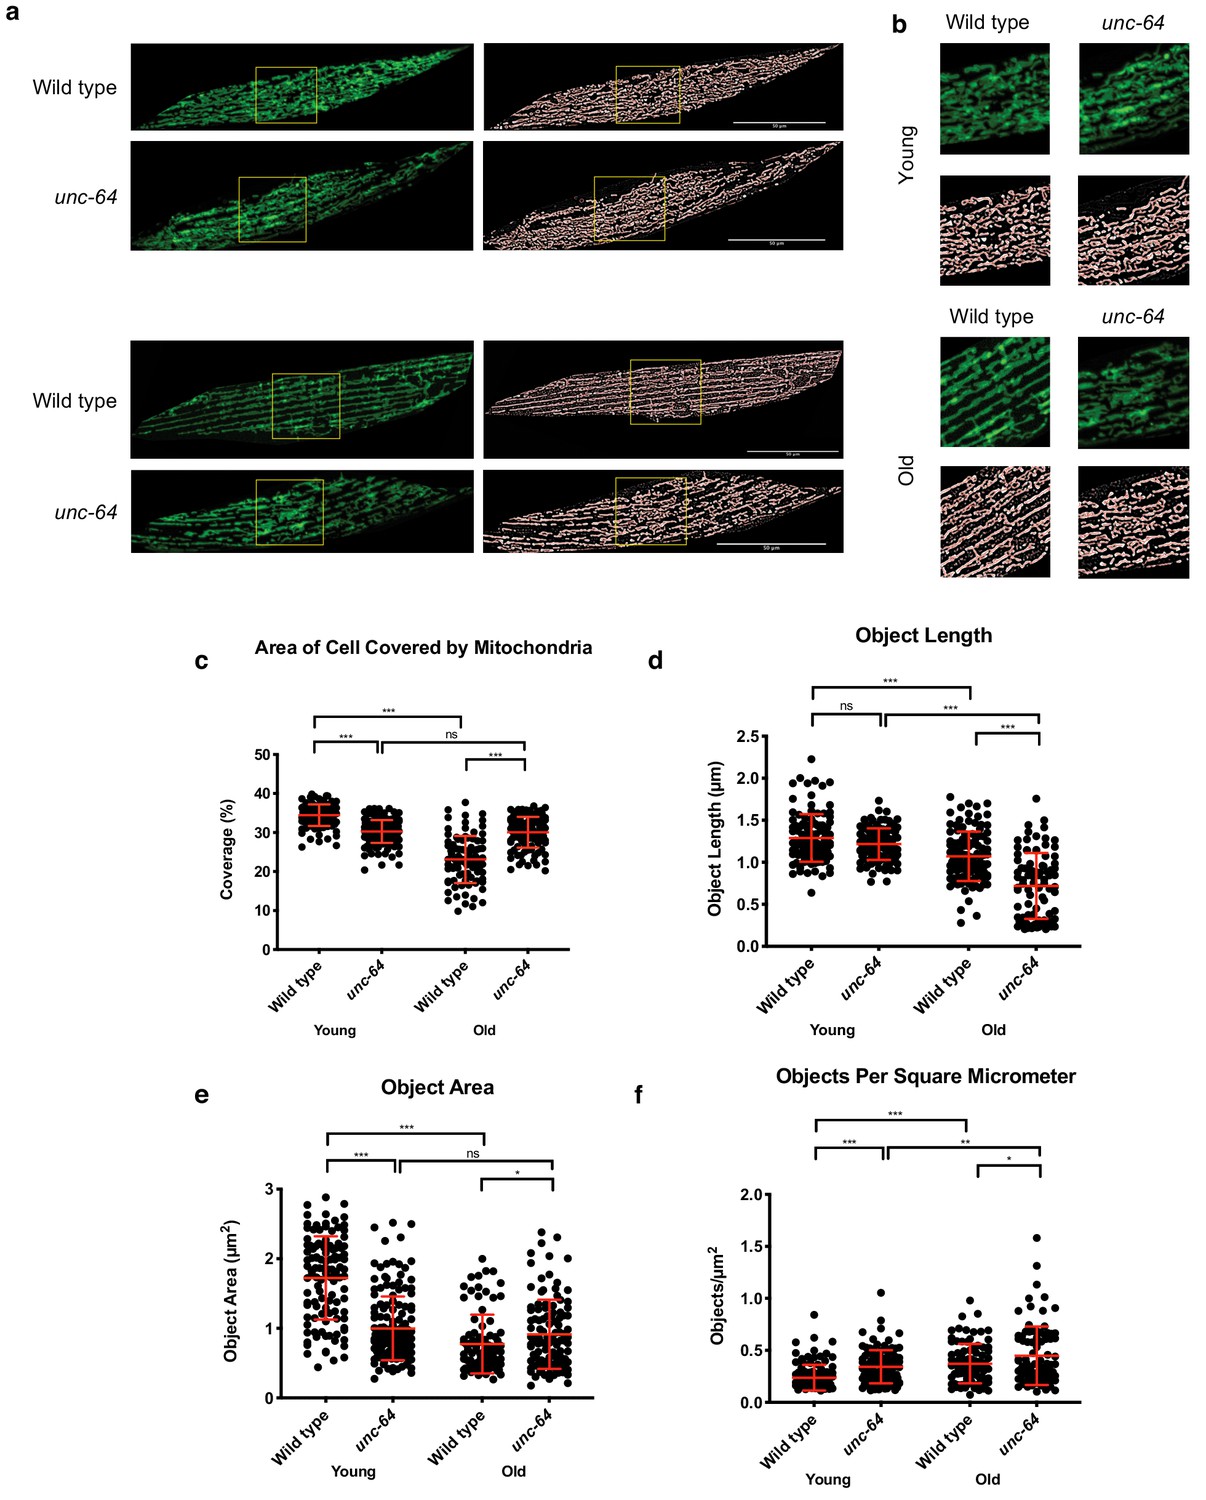
Effects of the unc-64 hypomorphic allele on muscle mitochondria morphology.
(a) Representative pictures showing that unc-64(e246) mutants preserve mitochondrial morphology during aging. The mitochondrial backbone (red) is overlaid on binary images. TOMM-20aa1-49::GFP reporter labels muscle mitochondria in young (day 2) and old (day 12) wild type and unc-64(e246) animals (n = 3 independent trials, 28–45 cells were imaged per genotype for each time point per replicate). Scale bar represents 50 μm. (b) zoomed insets from a (yellow boxes). (c–f) Quantification of mitochondrial (c) coverage, (d) length and (e) measure of object area and (f) object per square unit area from TOMM-20aa1-49::GFP reporter in young (day 2) and old (day 12) wild type and unc-64(e246) animals. Data are represented as mean ± SD. P value: NS no significance, *<0.05, **<0.01, ***<0.001, ****<0.0001 relative to controls. Statistical significance was determined by two-tail t-test (n = 3 independent trials,~40 cells were quantified per genotype for each time point per replicate). Source data are provided in Figure 4–figure supplement 6—source data 1.
-
Figure 4—figure supplement 6—source data 1
Figure 4—figure supplement 6c-f Mitochondria network characteristics of muscle mitochondria in unc-64 mutants.
- https://doi.org/10.7554/eLife.49158.030
Figure 5 with 1 supplement
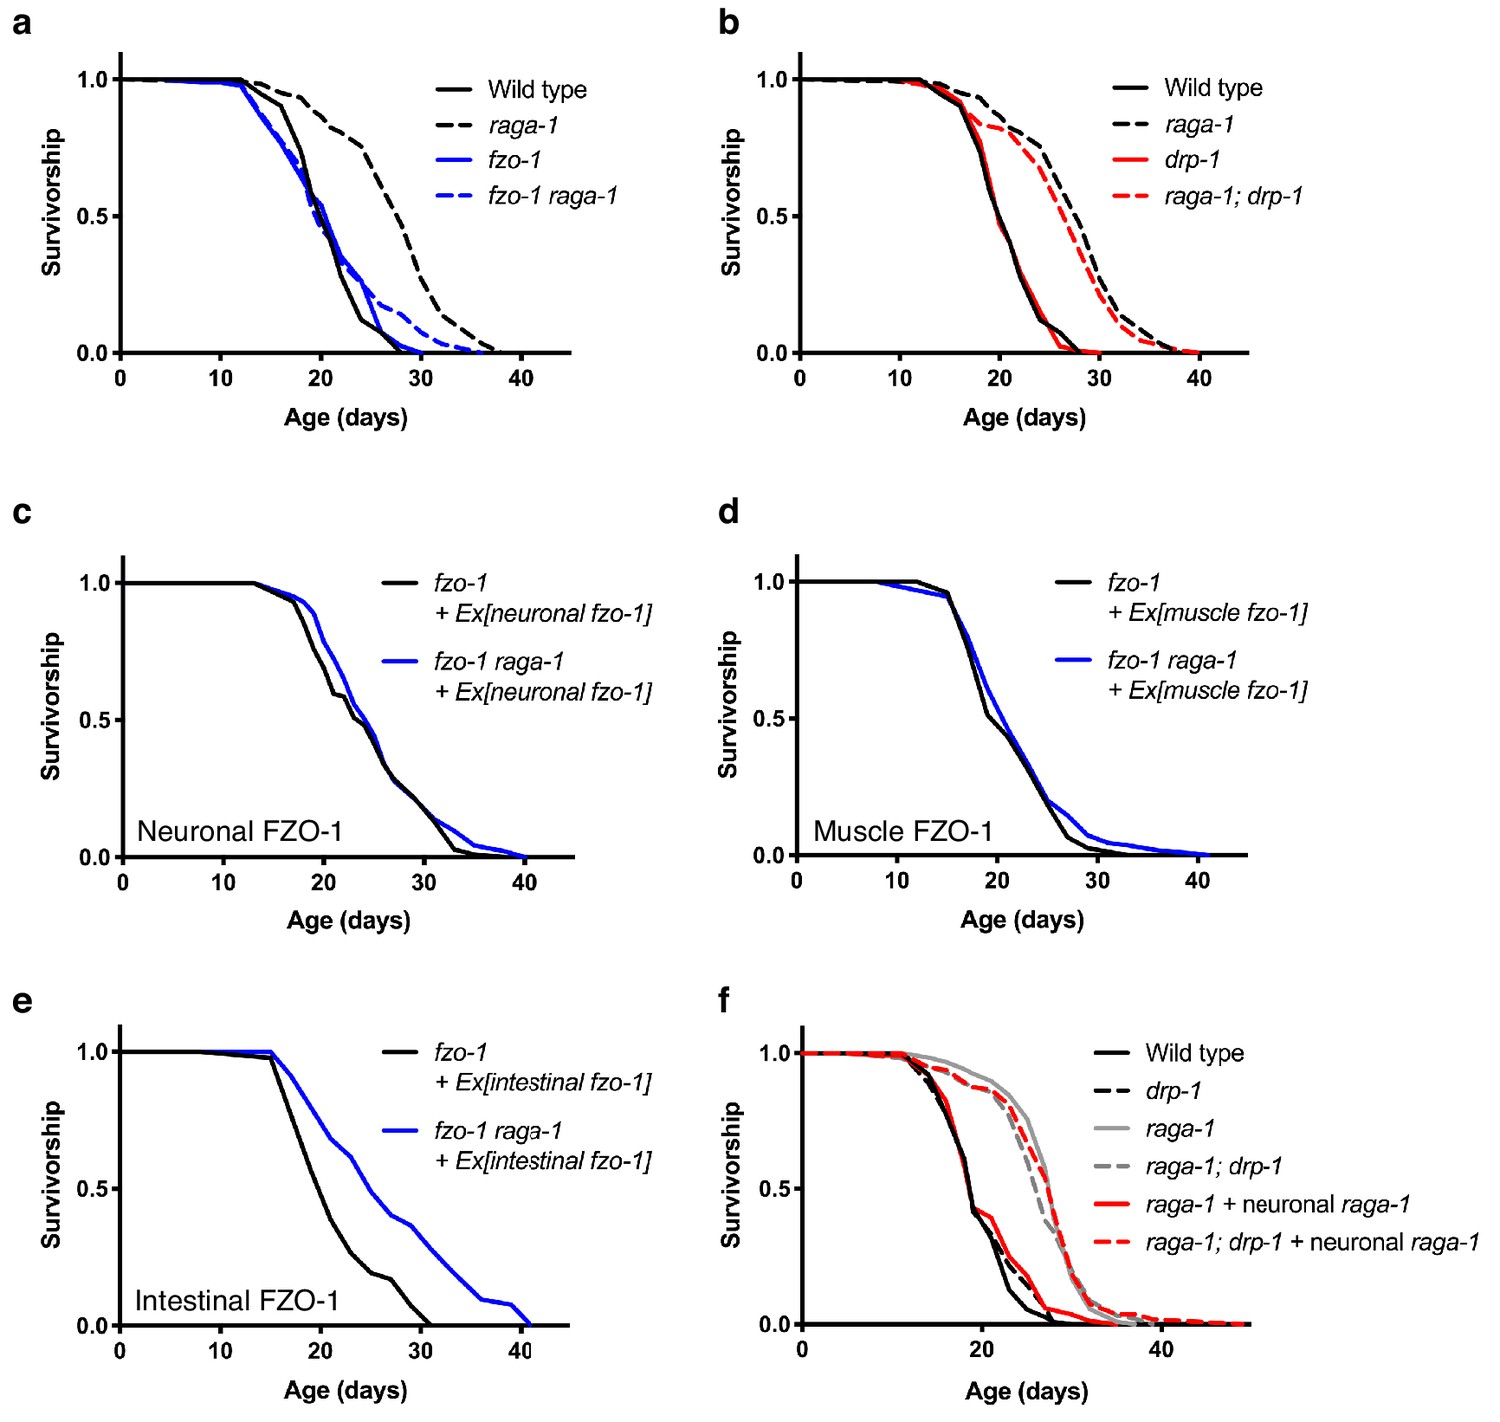
raga-1 deletion requires a fused mitochondrial network to promote longevity.
(a) fzo-1(tm1133) raga-1(ok386) double mutants, which are deficient in mitochondrial fusion, have significantly shortened lifespan compared to raga-1(ok386) single mutants (p<0.0001). However, raga-1(ok386); drp-1(tm1108) double mutants, which are deficient in mitochondrial fission, have similar lifespan compared to raga-1(ok386) single mutants (p=0.1420) (b). n = 4 independent biological replicates; sample size ranges between 71–128 deaths per treatment each replicate. Lifespan curves in a and b were generated in the same experiment but plotted separately for clarity, therefore wild type and raga-1 control curves are shared by both. P values were calculated with Log-rank (Mantel-Cox) test. Details on strains and lifespan replicates can be found in Supplementary file 6. (c) When fzo-1 is rescued in the fzo-1(tm1133) loss-of-function mutants using the neuronal-specific rab-3 promoter, the lifespan extension by raga-1 deletion is not fully restored (p=0.0428). n = 3 independent biological replicates; sample size ranges between 71–101 deaths per treatment each replicate. P values were calculated with Log-rank (Mantel-Cox) test. Details on strains and lifespan replicates can be found in Supplementary file 6. (d) When fzo-1 is rescued in the fzo-1(tm1133) loss-of-function mutants using the muscle-specific myo-3 promoter, the lifespan extension by raga-1 deletion is not restored (p=0.2011). n = 3 independent biological replicates; sample size ranges between 77–95 deaths per treatment each replicate. P values were calculated with Log-rank (Mantel-Cox) test. Details on strains and lifespan replicates can be found in Supplementary file 6. (e) When fzo-1 is rescued in the fzo-1(tm1133) loss-of-function mutants using the intestinal-specific ges-1 promoter, the lifespan extension by raga-1 deletion is fully restored (p<0.0001). n = 3 independent biological replicates; sample size ranges between 43–104 deaths per treatment each replicate. P values were calculated with Log-rank (Mantel-Cox) test. Details on strains and lifespan replicates can be found in Supplementary file 6. (f) The drp-1(tm1108) deletion allele significantly extends lifespan in raga-1 neuronal rescue background (p<0.0001), but not in wild type (p=0.3440) or raga-1 mutant animals (p=0.4934). n = 4 independent biological replicates; sample size ranges between 78–120 deaths per treatment each replicate. P values are calculated with Log-rank (Mantel-Cox) test. Details on strains and lifespan replicates can be found in Supplementary file 6.
Figure 5—figure supplement 1
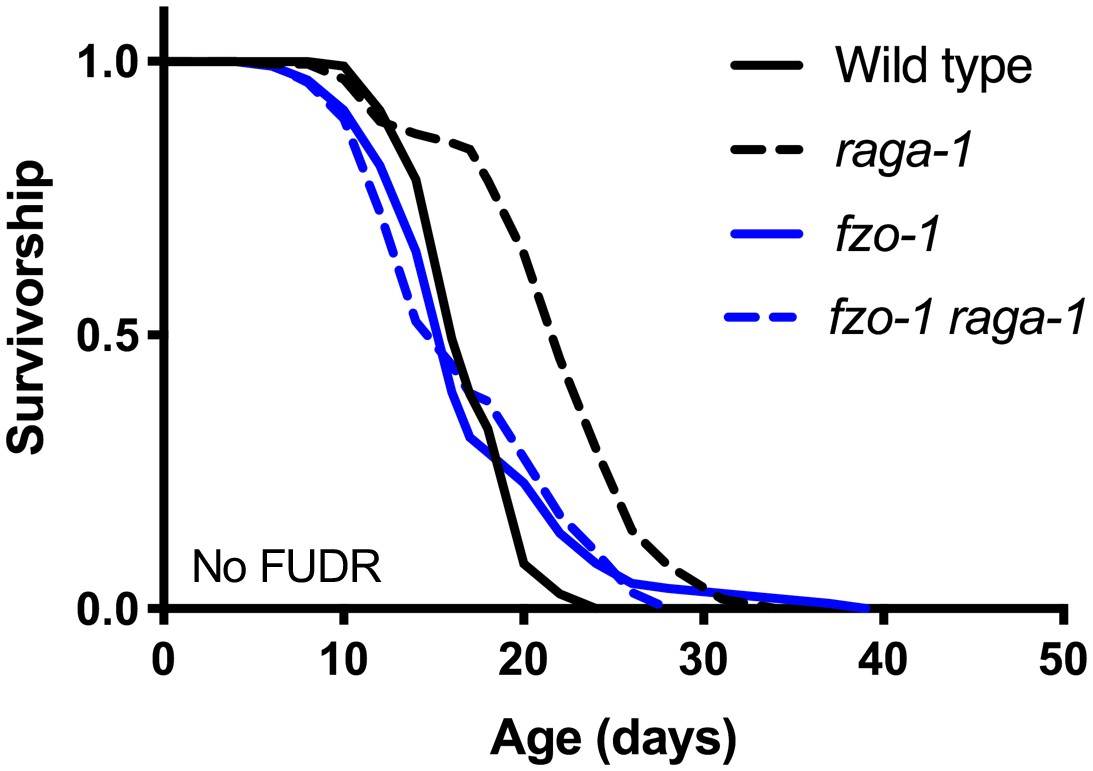
fzo-1(tm1133) suppresses extended lifespan of raga-1(ok386) without the use of FUDR.
The lifespan of fzo-1(tm1133) raga-1(ok386) double mutant is not longer than control animals (p=0.8252). n = 2 independent biological replicates; sample sizes range between 109–153 deaths per treatment each replicate. P values are calculated with Log-rank (Mantel-Cox) test. Details on lifespan replicates are in Supplementary file 6.
Tables
Key resources table
| Reagent type (species) or resource | Designation | Source or reference | Identifiers | Additional information |
|---|---|---|---|---|
| Strain (Caenorhabditis elegans) | N2 | Caenorhabditis Genetics Center | WB Cat# N2_(ancestral), RRID:WB-STRAIN:N2_(ancestral) | Laboratory reference strain |
| Strain (C. elegans) | VC222 | Caenorhabditis Genetics Center | WB Cat# VC222, RRID:WB-STRAIN:VC222 | Genotype:raga-1(ok386) II. |
| Strain (C. elegans) | RB754 | Caenorhabditis Genetics Center | WB Cat# RB754, RRID:WB-STRAIN:RB754 | Genotype: aak-2(ok524) X. |
| Strain (C. elegans) | WBM997 | This study | Genotype: aak-2(wbm20) X. | |
| Strain (C. elegans) | RB1206 | Caenorhabditis Genetics Center | WB Cat# RB1206, RRID:WB-STRAIN:RB1206 | Genotype: rsks-1(ok1255) III. |
| Strain (C. elegans) | WBM536 | This study | Genotype: wbmEx238[rab-3p::raga-1 cDNA::SL2::mCherry::unc-54 3'UTR] | |
| Strain (C. elegans) | WBM772 | This study | Genotype: wbmEx333 [rab-3p::rsks-1 cDNA::SL2::mCherry::unc-54 3'UTR] | |
| Strain (C. elegans) | WBM1167 | This study | Genotype: wbmIs79[eft-3p::3XFLAG::raga-1::SL2::wrmScarlet::unc-54 3'UTR, *wbmIs67] | |
| Strain (C. elegans) | WBM1168 | This study | Genotype: wbmIs80[rab-3p::3XFLAG::raga-1::SL2::wrmScarlet::rab-3 3'UTR, *wbmIs68] | |
| Strain (C. elegans) | WBM650 | This study | Genotype: wbmEx271 [ges-1p::raga-1 cDNA::SL2::mCherry::unc-54 3'UTR; rol-6 (su1006)] | |
| Strain (C. elegans) | WBM671 | PMID:29107506 | Genotype:wbmEx289 [myo-3p::tomm20 aa1-49::GFP::unc54 3'UTR] | |
| Strain (C. elegans) | WBM955 | This study | Genotype: wbmEx373 [rab-3p::tomm-20 aa1-49::GFP::unc-54 3'UTR, rol-6] | |
| Strain (C. elegans) | WBM926 | PMID:29107506 | Genotype: wbmEx367[ges-1p::tomm20 aa1-49::GFP::unc-54 3'UTR] | |
| Strain (C. elegans) | CU5991 | Caenorhabditis Genetics Center | WB Cat# CU5991, RRID:WB-STRAIN:CU5991 | Genotype: fzo-1 (tm1133) II. |
| Strain (C. elegans) | CU6372 | Caenorhabditis Genetics Center | WB Cat# CU6372, RRID:WB-STRAIN:CU6372 | Genotype: drp-1(tm1108) IV. |
| Strain (C. elegans) | WBM861 | This study | Genotype: fzo-1(tm1133) II; wbmEx335 [rab-3p:3xFLAG fzo-1 cDNA: unc54 3'UTR, myo-3p:mCherry] | |
| Strain (C. elegans) | WBM612 | PMID:29107506 | Genotype: fzo-1 (tm1133) II; wbmEx258 [pHW11 (myo-3p::3xFLAG::fzo-1 cDNA::unc-54 3'UTR) + pRF4 (rol-6(SU1006))] | |
| Strain (C. elegans) | WBM639 | PMID:29107506 | Genotype: fzo-1(tm1133) II; wbmEx276 [pHW18 (ges-1p::3xFLAG::fzo-1 cDNA::unc54 3’UTR) + pRF4(rol-6(SU1006))] | |
| Antibody | Phospho-AMPKα (Thr172) antibody | Cell Signaling Technology | Cat# 2535, RRID:AB_331250 | |
| Antibody | Beta actin antibody | Abcam | Cat# ab8226, RRID:AB_306371 | |
| Software | MitoMAPR | This study | Source code provided as Source code 1 | |
| Commercial assay or kit | TruSeq Stranded mRNA LT - Set A kit | Illumina | RS-122–2101 |
Additional files
-
Source code 1
Code for muscle mitochondria analysis using MitoMAPR.
- https://doi.org/10.7554/eLife.49158.033
-
Supplementary file 1
DEGs from pairwise comparisons of RNA-Seq.
- https://doi.org/10.7554/eLife.49158.034
-
Supplementary file 2
Genes in each cluster from RNA-seq.
- https://doi.org/10.7554/eLife.49158.035
-
Supplementary file 3
GO terms enriched in each cluster.
- https://doi.org/10.7554/eLife.49158.036
-
Supplementary file 4
Worm strains.
- https://doi.org/10.7554/eLife.49158.037
-
Supplementary file 5
Genotyping strategies.
- https://doi.org/10.7554/eLife.49158.038
-
Supplementary file 6
Lifespan replicates.
- https://doi.org/10.7554/eLife.49158.039
-
Supplementary file 7
List of MitoMAPR attributes.
- https://doi.org/10.7554/eLife.49158.040
-
Transparent reporting form
- https://doi.org/10.7554/eLife.49158.041
Download links
A two-part list of links to download the article, or parts of the article, in various formats.
Downloads (link to download the article as PDF)
Open citations (links to open the citations from this article in various online reference manager services)
Cite this article (links to download the citations from this article in formats compatible with various reference manager tools)
Neuronal TORC1 modulates longevity via AMPK and cell nonautonomous regulation of mitochondrial dynamics in C. elegans
eLife 8:e49158.
https://doi.org/10.7554/eLife.49158


