Telophase correction refines division orientation in stratified epithelia
- The University of North Carolina, United States
- The University of North Carolina School of Dentistry, United States
- University of California, San Francisco, United States
Figures
Figure 1 with 5 supplements
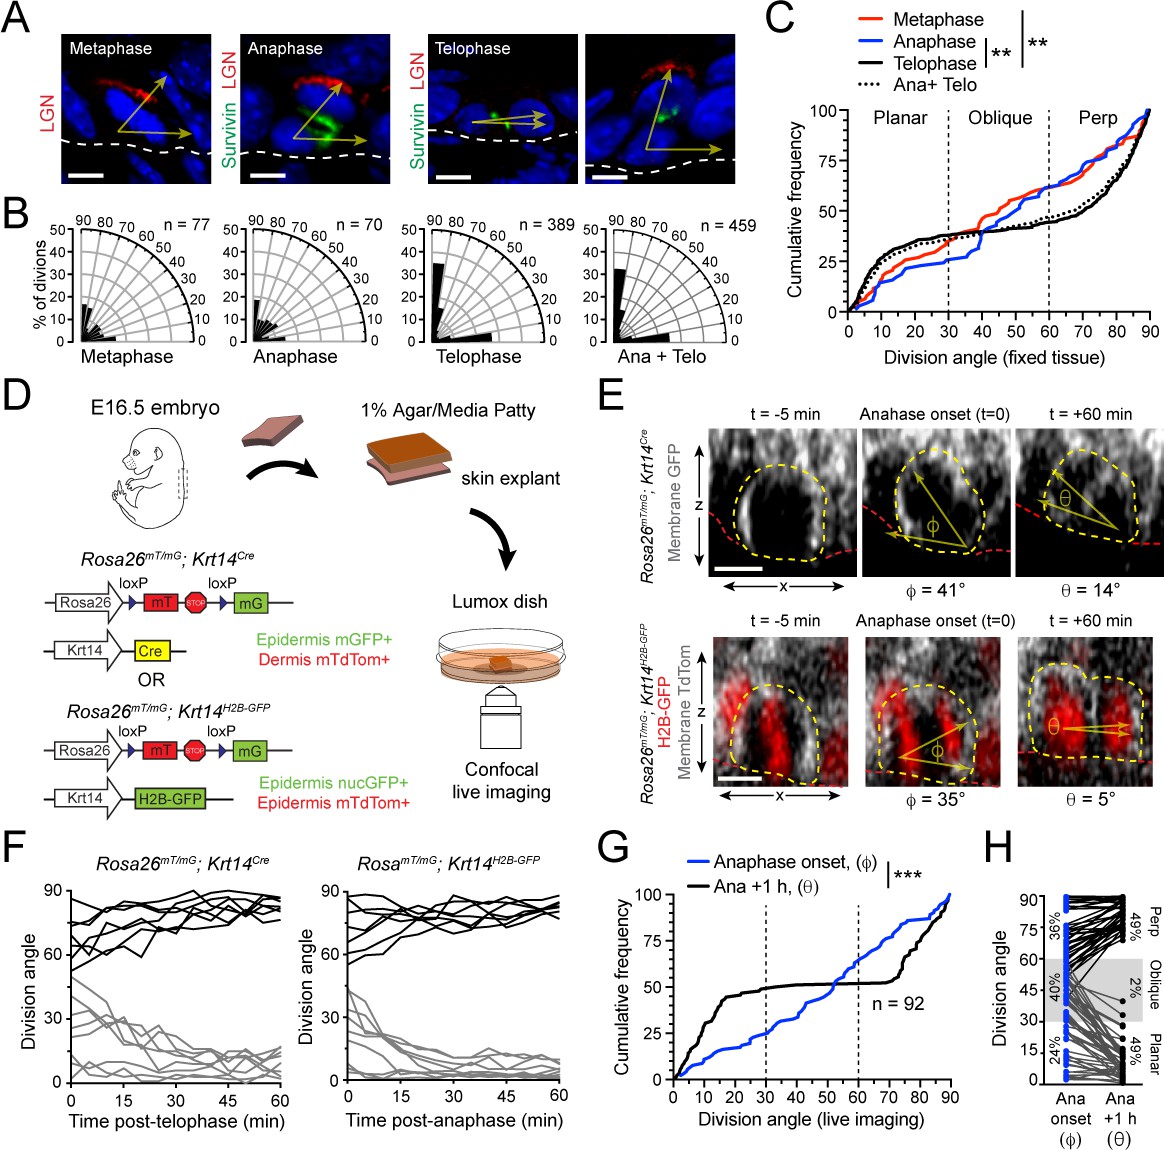
Telophase reorientation corrects oblique anaphase orientations.
(A) Sagittal sections from E16.5 embryos showing mitotic basal cells at indicated stages. Yellow arrows indicate division axis relative to basement membrane (dashed white line). Apical LGN (red) is generally present in oblique and perpendicular divisions, but absent from planar divisions. Survivin (green) is diffusely distributed between daughter pairs at anaphase, transitioning to stereotypic dual-puncta by telophase. (B) Radial histograms of division orientation at metaphase, anaphase, telophase and anaphase+telophase in E16.5 wild-type controls; n indicates number of divisions measured from >20 embryos per mitotic stage. (C) Same data as in (B), plotted as a cumulative frequency distribution. Note sigmoidal pattern at telophase (black, solid line), characteristic of bimodal distribution of division angles. Compare to linear pattern, characteristic of random distributions at metaphase (red) and anaphase (blue). (D) Schematic of experimental design for live imaging of embryonic epidermal explants. Krt14Cre; Rosa26mT/mG is used to label epidermis with membrane (m)-GFP and other tissues (including dermis) with mTdTomato. Alternatively, Krt14H2B-GFP is used to label nuclei while Rosa26mT/mG without Cre ubiquitously labels cells with membrane-tdTomato. (E) Z-projection stills from a movie of a Krt14Cre; Rosa26mT/mG (top) and Krt14H2B-GFP; Rosa26mT/mG (bottom) mitotic cell as it enters anaphase (defined as t = 0), through 60 min post-anaphase onset, depicting planar telophase correction. Epidermal-dermal boundary shown by red line. Dividing daughter pairs are outlined with yellow dashed lines. Division orientation angles are shown below (φ, anaphase onset; θ, +1 hr). (F) Traces of division orientation at five minute intervals for 15 representative cells from telophase onset to +1 hr. (G) Cumulative frequency distribution of division angles from Krt14Cre; Rosa26mT/mG live imaging experiments of E16.5 embryos at anpahse onset (blue; φ) and +1 hr later (black; θ). n indicates number of divisions from 4 embryos across four independent sessions. (H) Data from (G) depicting division orientations at anaphase onset and 1 hr later. Connecting lines demonstrate that ~60% oblique anaphase divisions reorient to planar (black lines) while the remaining ~40% correct to perpendicular (gray lines). Scale bars, 5 μm (A), 10 μm (E). **p<0.01, ***p<0.001, by Kolmogorov-Smirnov test. See also Figure 1—figure supplement 1.
-
Figure 1—source data 1
Original measurements used to generate panels B, C, F, G, H.
- https://cdn.elifesciences.org/articles/49249/elife-49249-fig1-data1-v2.xlsx
Figure 1—figure supplement 1
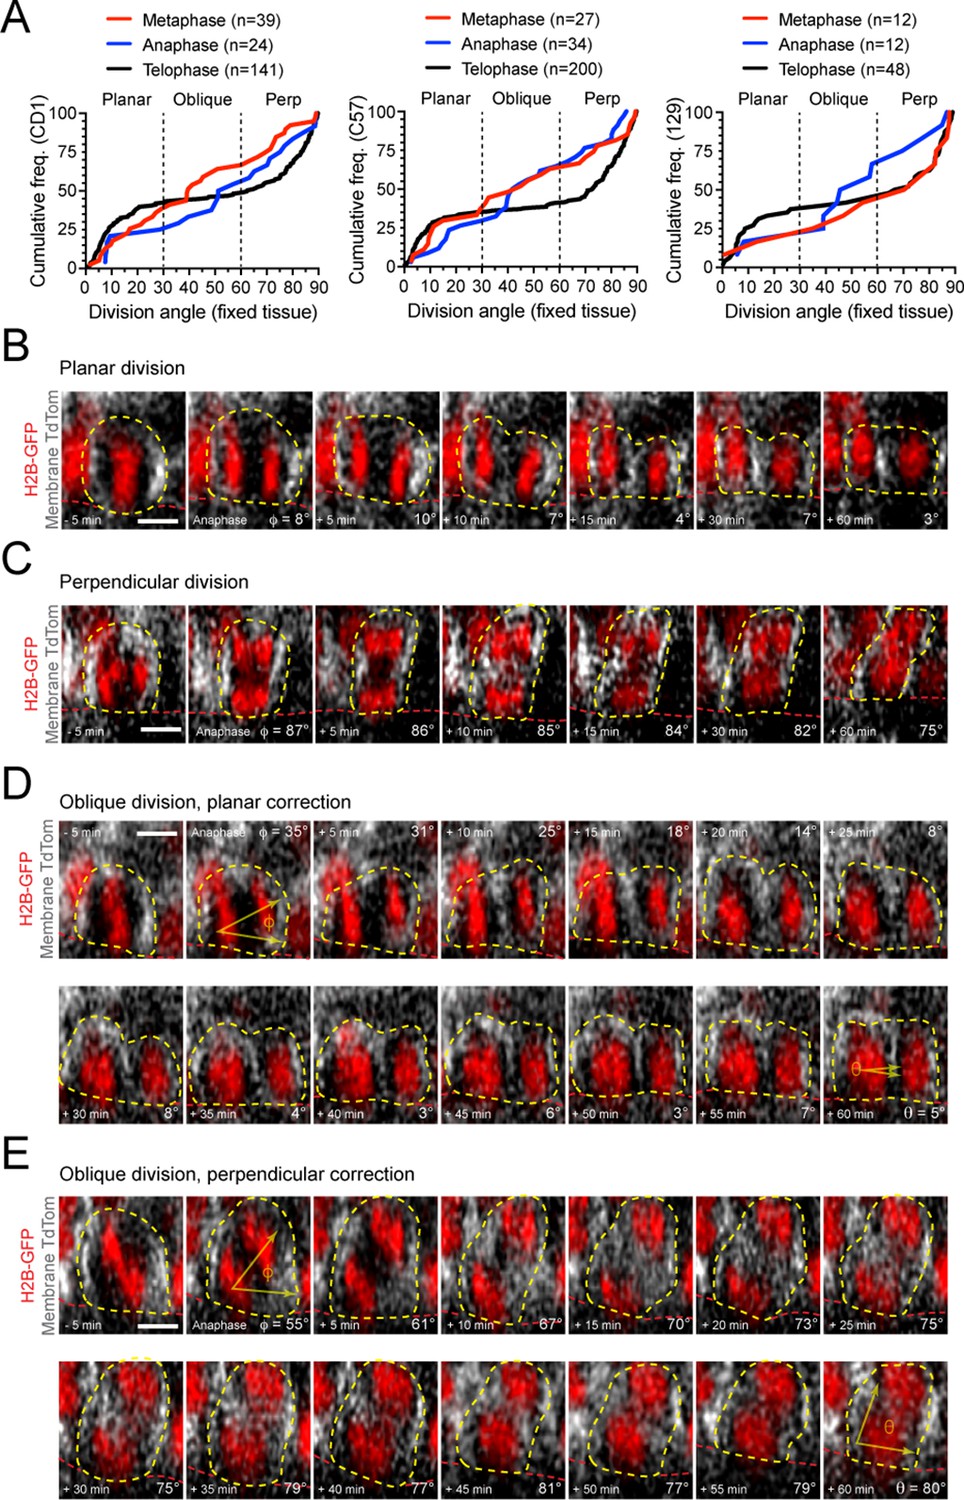
Telophase reorientation corrects oblique anaphase orientations.
(A) Cumulative frequency histograms of division angles from fixed sagittal sections organized by mouse background strain: CD1 (left), C57 (middle), and 129 (right) all show randomized division orientation at anaphase and metaphase, which shifts to a clear bimodal distribution of planar and perpendicular orientation at telophase. (B–E) Time-course stills from live imaging experiments using Rosa26mT/mG (gray) and Krt14H2B-GFP (red) alleles. Shown are examples of divisions that display planar (B), perpendicular (C), or oblique (D,E) orientations at anaphase onset. While those with planar or perpendicular anaphase division angles persist in their orientation through time, oblique anaphase divisions undergo rapid correction towards either planar (D) or perpendicular (E) orientations. Scale bars, 5 μm.
Figure 1—video 1
Planar anaphase orientation is fixed.
Z-projection of Krt14H2B-GFP; Rosa26mT/mG epidermal explant taken from an E16.5 embryo imaged in 5 min intervals. The mitotic cell (white dashed outline) orients its division parallel to the basement membrane (red) resultig in a persistent planar OCD. Nuclei (H2B-GFP) are shown in red and cell membranes (mTdTomato) in gray. Scale bar: 5 μm.
Figure 1—video 2
Perpendicular anaphase orientation is fixed.
Z-projection of Krt14H2B-GFP; Rosa26mT/mG epidermal explants taken from E16.5 embryos imaged in 5 min intervals. The mitotic cell (white dashed outline) orients its division orthogonal to the basement membrane (red) resulting in a persistent perpendicular OCD. Scale bar: 5 μm.
Figure 1—video 3
Oblique anaphase orientations undergo planar telophase reorientation.
Z-projection of Krt14H2B-GFP; Rosa26mT/mG epidermal explants taken from E16.5 embryos imaged in 5 min intervals. The mitotic cell (white dashed outline) initiates anaphase at an oblique (30–60°) orientation relative to the basement membrane (red). However, the apical daughter retains basement membrane contact (yellow arrowhead) and corrects into a planar orientation within one hour. Scale bar: 5 μm.
Figure 1—video 4
Oblique anaphase divisions display perpendicular correction.
Z-projection of Krt14H2B-GFP; Rosa26mT/mG epidermal explants taken from E16.5 embryos imaged in 5 min intervals. The mitotic cell (white dashed outline) initiates anaphase at an oblique (30–60°) orientation relative to the basement membrane (red). However, the apical daughter corrects into a perpendicular orientation within one hour. Scale bar: 5 μm.
Figure 2
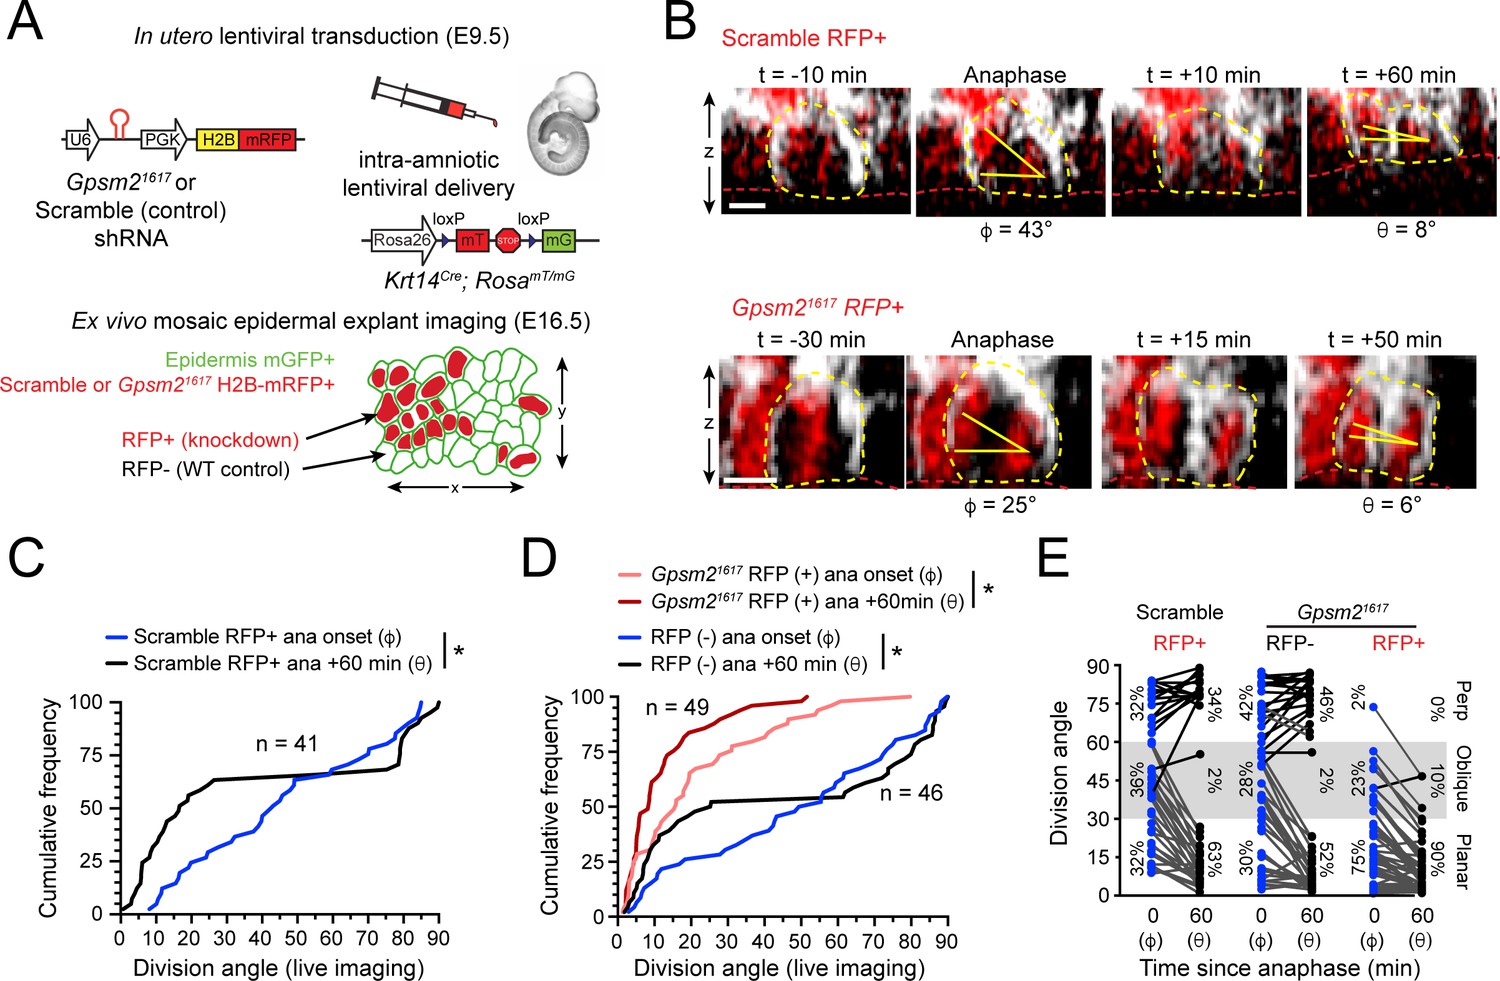
LGN mediates perpendicular but not planar telophase correction.
(A) Schematic of modified experimental protocol of live imaging of epidermal explants (see Figure 1D) incorporating lentiviral shRNA transduction to generate mosaic knockdown tissue. Transduced/knockdown regions are marked with histone H2B-mRFP1 (H2B-RFP). (B) Stills from live imaging of Scramble (top) or Gpsm21617 H2B-RFP+ cells (bottom) undergoing planar correction, annotated as in Figure 1E. (C,D) Cumulative frequency distributions of division orientation from (C) Scramble or (D) Gpsm21617 H2B-RFP (+/-) live imaging experiments at anaphase onset (φ) and one hour later (θ). Scramble RFP+ and Gpsm21617 RFP- cells display similar patterns of telophase correction as observed in wild-type explants (Figure 1G). While Gpsm21617 RFP+ cells are more biased toward planar/oblique at anaphase onset, significant planar correction still occurs; n indicates observed divisions from five embryos imaged in four technical replicates. (E) Data from (C,D) depicting orientation at anaphase onset (φ) and 1 hr later (θ) for Scramble RFP+ and Gpsm21617 RFP- and RFP+ cells. ~ 95% of LGN knockdown cells correct to planar (<30°) 1 hr later. Scale bars, 10 μm. *p<0.05 by Kolmogorov-Smirnov test.
-
Figure 2—source data 1
Original measurements used to generate panels C, D, E.
- https://cdn.elifesciences.org/articles/49249/elife-49249-fig2-data1-v2.xlsx
Figure 3 with 1 supplement

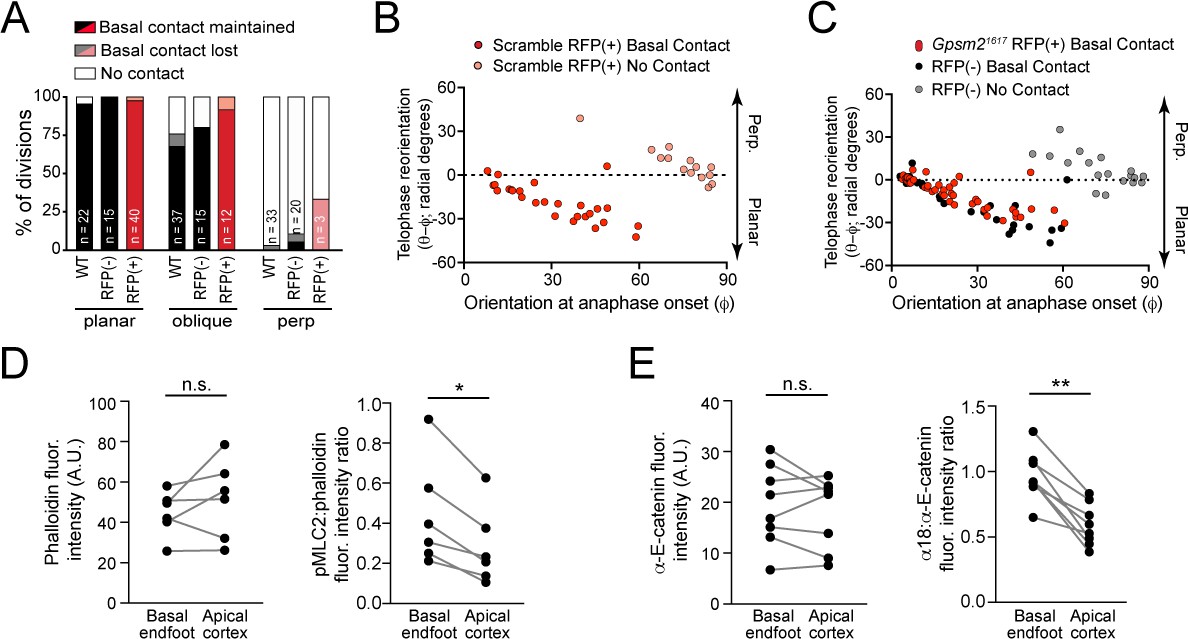
Maintenance of basal contact correlates with planar-directed telophase correction.
(A) (top) z-projection stills from a movie of a mitotic cell as it enters anaphase (t = 0) through 60 min post-anaphase onset, depicting planar telophase correction. Epidermal-dermal boundary shown by red line. Dividing daughter pairs are outlined with yellow dashed lines. Division orientation angles are shown below (φ, telophase onset; θ, +1h). (bottom), xz en face views at same timepoints. Yellow and white arrowheads indicate plane of optical section for apical and basal daughters, respectively. In most cases, planar correction is preceded by maintenance of basement membrane contact (open arrowheads), which are most apparent in the en face basal focal plane, where they appear as small membrane circles. (B) Data from Figure 1G,H sorted based on presence or absence of basal contact. Connecting lines demonstrate that oblique-dividing daughters retaining basal contact correct towards a planar orientation, while those losing contact correct towards perpendicular. (C) Data from (B) demonstrating that the degree of correction correlates with initial anaphase orientation. (D) Whole mount imaging of wild-type E16.5 epidermis stained with phalloidin and phosphorylated myosin-light chain 2 (pMLC2). Orthogonal views (top) of DAPI highlight oblique division orientation. The basal endfoot observed in live imaging of telophase correction (see panel A) can be observed in the basal en face view. Pair-wise measurements (inset graph) of pMLC2 at the cell cortex in the apical plane and basal endfoot of oblique divisions are connected by the gray line. (E) Cartoon representation of tension-sensitive model of AJ assembly. In the absence of tension, α-E-catenin exists in an autoinhibited closed conformation, masking the α18 epitope. In the presence of actin-mediated tension, α-E-catenin opens, exposing the α18 epitope and vinculin binding domain. (F) Whole mount images prepared as in (D) stained with total α-E-catenin and open conformation-specific α18 antibody. Pair-wise measurements (inset graph) of α18 at the cell cortex in the apical plane and basal endfoot of oblique daughter cells are connected by the gray line demonstrates increased open or ‘tensile’ α-E-catenin in the basal endfoot. (G) Quantification of α18: α-E-catenin fluorescence intensity ratio in variable division types or stages of mitosis. Anisotropy is greatest in oblique divisions between the basal endfoot and apical cortex of the oblique daughter cell. Scale bars, 10 μm (A,D,F). P values determined by Wilcoxon test (D,F). *p<0.05, **p<0.01. See also Figure 3—figure supplement 1.
-
Figure 3—source data 1
Original measurements used to generate panels B, C, D, F, G.
- https://cdn.elifesciences.org/articles/49249/elife-49249-fig3-data1-v2.xlsx
Figure 3—figure supplement 1
A basal endfoot mediates planar telophase correction.
(A) On the x-axis, divisions are grouped by orientation at anaphase onset (φ, planar = 0–30°; oblique = 30–60°; perpendicular = 60–90°) and Gpsm21617 status. The y-axis depicts the proportion of divisions that lack (white), maintain (black/red), or lose (gray/pink) basal contact in the following hour. ~95% of planar divisions initiate and maintain basal contact; oblique divisions make and initiate contact less frequently (~75% of the time); while perpendicular divisions almost never make contact. LGN knockdown (red bars) does not alter this behavior. (B–C) Radial anaphase correction (θ-φ) plotted versus initial anaphase orientation. Cells where apical daughter basal contacts were detected are shown as black/red circles, while those lacking basal contacts are shown in gray/pink. In wild-type controls (left) basal contact correlates with planar reorientation, while lack of contact results in perpendicular reorientation. (B) Telophase correction (θ-φ) in Scramble RFP+ cells (middle panel), grouped by basal contact status. Like wild-type cells, Scramble RFP+ cells undergo telophase reorientation in a basal contact-dependent manner. (C) Both Gpsm21617 RFP+ (right panel; red) and wild-type RFP- cells (black) with basal contacts correct to planar, demonstrating that LGN is not required for this behavior. LGN knockdown cells only rarely (n = 3) lack basement membrane contact, so this group is not shown. (D) Pair-wise measurements of phalloidin fluorescence intensity and pMLC2:phalloidin fluorescence intensity ratio at the cell cortex in the apical plane and basal endfoot of oblique daughter cells are connected by the gray line. (E) Pair-wise measurements of α-E-catenin fluorescence intensity and α18:α-E-catenin fluorescence intensity ratio at the cell cortex in the apical plane and basal endfoot of oblique daughter cells are connected by the gray line. *p<0.05, determined by Wilcoxon test (D,E).
Figure 4 with 1 supplement
Vinculin and afadin regulate α-E-catenin conformation and AJ linkage to the actin cytoskeleton.
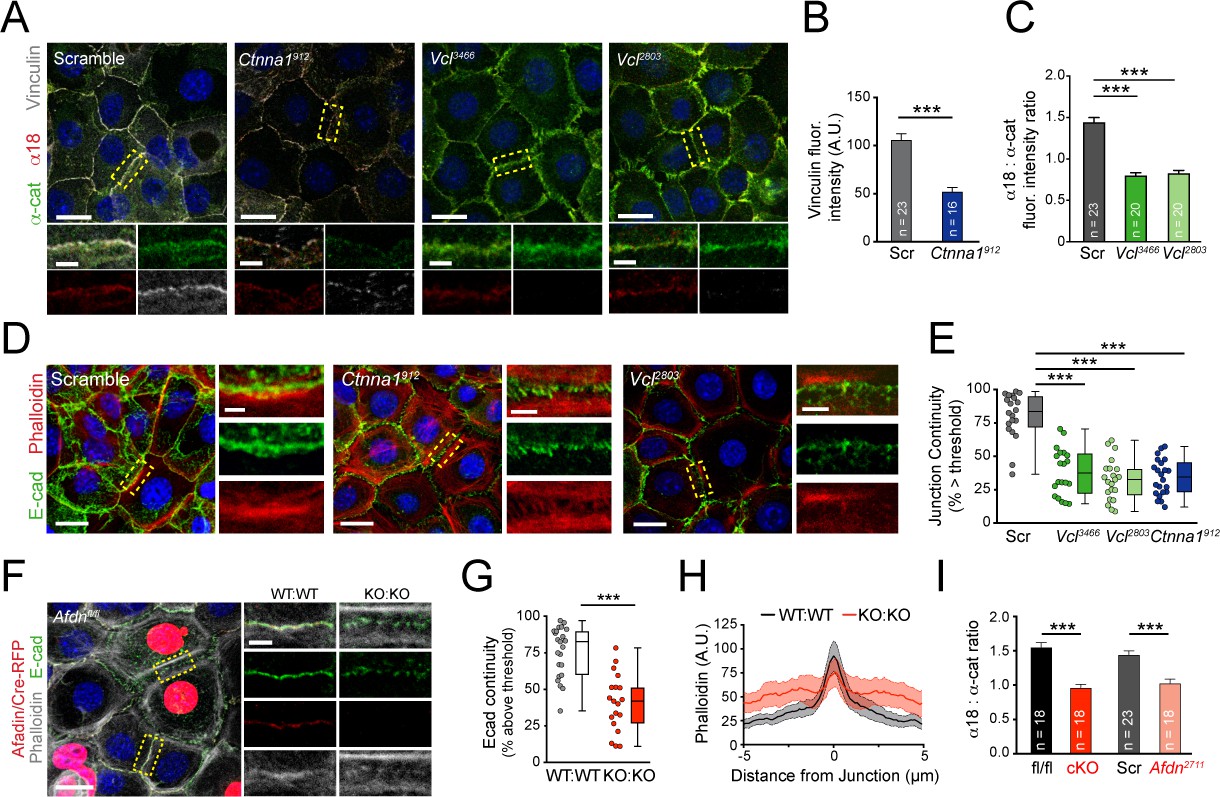
(A) Stable primary murine keratinocytes cell lines grown in the presence of high (1.5 mM) Ca2+ for 8h form nascent cell-cell adhesions, stained for total α-E-catenin (green); open, "tensile" α-E-catenin (α18, red); and vinculin (gray). Single junction magnifications (yellow dashed region) shown below, demonstrate that Vcl knockdown results in a reduced α18: α-E-catenin ratio, quantified in (B,C). (B) Fluorescence intensity quantification of junctional vinculin in Scramble and Ctnna1 knockdown keratinocytes. Loss of Ctnna1 reduces vinculin accumulation in nascent AJs. (C) Quantification of α18:α-E-catenin fluorescence intensity ratio in Scramble and two independent Vcl shRNA cell lines. Vcl knockdown reduces the proportion of α-E-catenin in the open conformation. (D) Primary mouse keratinocytes after 8h Ca2+ shift—labeled with phalloidin (red) and E-cad (green)—which accumulate in linear bands at cell-cell junctions in Scramble control cells. Yellow boxed region shown at high magnification below; n indicates junctions evaluated. Vcl and Ctnna1 knockdown cells show defects in linear actin accumulation and immature "zipper" junctional morphology. (E) Junction continuity quantification based on % of junction length above threshold for E-cad (see Materials and methods). Loss of Vcl or Ctnna1 reduces junction continuity. (F) Afdnfl/fl primary keratinocytes mosaically infected with Cre-RFP (red) after 8h 1.5 mM Ca2+ shift, stained for E-cad (green), afadin (red), and phalloidin (gray). Junctions between two uninfected cells (WT:WT) show linear morphology with consistent E-cad (green), afadin (red) and phalloidin (gray) labeling. In contrast, junctions between two infected cells are punctate, with less junction-associated phalloidin. (G) Quantification of E-cad continuity along junction length, as in (E). (H) Quantification of fluorescence intensity of actin (phalloidin) measured by orthogonal linescans. Phalloidin is decentralized in KO:KO junctions (red) compared to WT:WT (black;. n indicates junctions evaluated. (I) Quantification of α18:α-E-catenin fluorescence intensity ratios from homogenous Afdnfl/fl, Afdn-cKO, Scramble, and Afdn2711 primary keratinocytes stained as in (A); n indicates junctions analyzed. Scale bars, 20 μm or 5 μm (junctional insets). P values determined by student’s unpaired t-test; ***p<0.001. See also Figure 4—figure supplement 1.
-
Figure 4—source data 1
Original measurements used to generate panels B, C, E, G, H, I.
- https://cdn.elifesciences.org/articles/49249/elife-49249-fig4-data1-v2.xlsx
Figure 4—figure supplement 1

The α-E-catenin/vinculin/afadin complex demonstrates reciprocal regulation to form mature adherens junctions in vitro.
(A) Quantification of α18 (left) and α-E-catenin (right) fluorescence intensity in 8h Ca2+-shift assays in Scramble and Vcl shRNA expressing primary keratinocytes. (B) Time-course of junction formation in wild-type primary keratinocytes 30 min (left) and 8h (right) after the addition of 1.5 mM Ca2+, stained for E-cadherin (green), afadin (red), and phalloidin (gray). Between early and late timepoints, junctions transform from punctate to linear and actin becomes tightly associated with the junction. (C) Quantification of E-cad continuity along junction length in wild-type primary keratinocytes at 30 min and 8h timepoints. (D) Primary mouse keratinocytes after 8h Ca2+ shift—labeled with afadin (red), E-cadherin (green) and actin (phalloidin, gray)—which accumulate in linear bands at cell-cell junctions in Scramble control cells. Yellow boxed region shown at high magnification to the right; n indicates junctions evaluated. Vcl and Ctnna1 knockdown cells show defects in linear actin accumulation as well as afadin recruitment to AJs, quantified in (E). (F) Scramble, Afdn2711, Afdnfl/fl, and Afdn cKO keratinocytes after 8h Ca2+ shift and stained for α18 (red), α-E-catenin (green), and vinculin (gray). (G–H) fluorescence intensity quantification of α18 (G) and α-E-catenin (H) in 8hrcalcium-shifted Afdn mutant cell lines; n indicates junctions analyzed. (I) Quantification of vinculin:total α-E-catenin fluorescence intentisty ratios and (J) raw vinculin fluorescence intensity in 8h Ca2+-shifted Afdn mutant cell lines; n indicates junctions analyzed. Scale bars, 20 μm. P values determined by student’s unpaired t-test. ***p<0.001.
Figure 5 with 1 supplement
The α-E-catenin/vinculin/afadin pathway is required for normal division orientation.
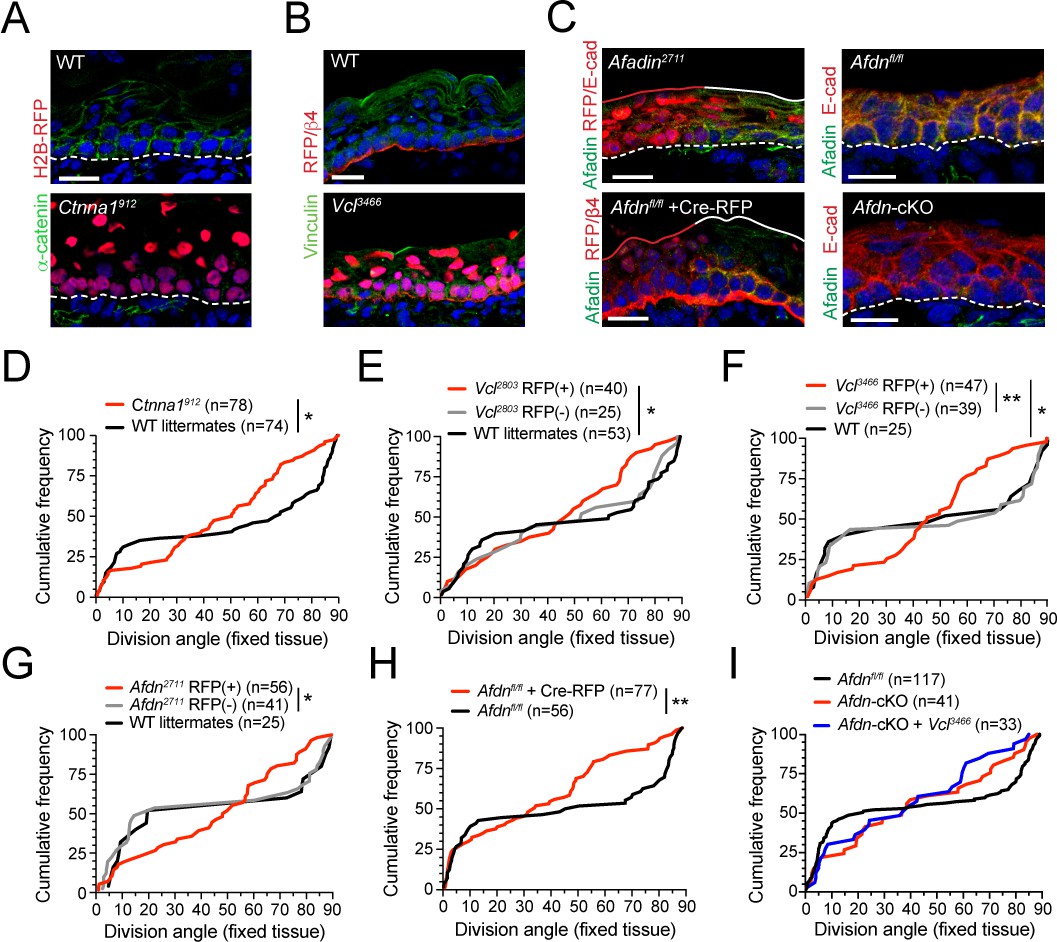
(A) Immunofluorescent images taken from E16.5 sagittal sections of wild-type littermate controls (left) or embryos transduced with Ctnna1912 H2B-RFP (right). Epidermal junctional α-E-catenin (green) is lost in Ctnna1912 RFP+ epidermis. (B) E16.5 epidermis infected with Vcl3466 H2B-RFP (red) and stained rabbit with anti-vinculin antibody. While suprabasal staining is dramatically reduced in infected samples, some non-specific cytoplasmic basal-layer staining remains. (C) Afadin (green) and E-cadherin (red) immunostaining in E16.5 sections. Mosaic region of Afdn2711 H2B-RFP (top panel) or Cre-RFP (in Afdnfl/fl embryo; bottom panel) lentiviral transduction. Region of high transduction (red line) demonstrates efficient loss of junctional afadin signal, spared in region of low transduction (white line). E16.5 Afdnfl/fl controls (right, top) with conditional deletion mediated by Krt14Cre (cKO) (right, bottom). (D–I) Cumulative frequency distributions of telophase division angles from fixed E16.5 sections of shRNA knockdown samples and littermate controls. (D) Ctnna1912 knockdown (red) and control littermates (black); n indicates measurements from 6 to 7 independent embryos. (E) Vcl2803 H2B-RFP mosaic samples showing RFP+ mutants (red) alongside RFP- internal (gray) and wild-type littermate (black) controls; n indicates measurements from 3 to 4 independent embryos. (F) Vcl3466 H2B-RFP mosaic samples shown as in E; n indicates measurements from 3 to 4 independent embryos. (G) Afdn2711 H2B-RFP mosaic samples shown as in E-F; n indicates measurements from 3 to 6 independent embryos. (H) Afdnfl/fl Cre-RFP samples (red) shown alongside uninjected littermates (black); n indicates measurements from 3 to 4 independent embryos. (I) Cumulative frequency distribution of E16.5 telophase division angles in Afdnfl/fl, Afdn cKO, and Afdn cKO + Vcl3466 H2B-RFP epidermis. Vinculin knockdown does not exacerbate Afdn knockout phenotype. Scale bars, 20 μm (A–C). P values determined by Kolmogorov-Smirnov test (D–I). *p<0.05, **p<0.01. See also Figure 5—figure supplement 1.
-
Figure 5—source data 1
Original measurements used to generate panels D, E, F, G, H, I.
- https://cdn.elifesciences.org/articles/49249/elife-49249-fig5-data1-v2.xlsx
Figure 5—figure supplement 1
AJ loss-of-function mutants display errors in division orientation.
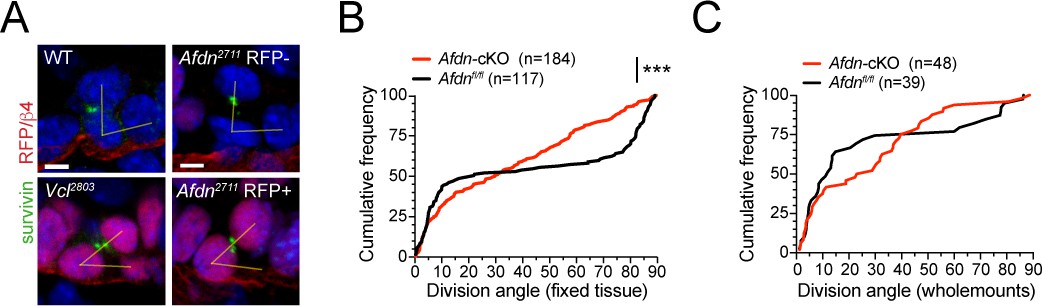
(A) Telophase cells marked by Survivin (green), from E16.5 wild-type littermates (left, top), Afdn2711 RFP- (top right), Afdn2711 RFP+ (bottom right), and Vcl2803 RFP+ knockdowns (bottom left). (B) Cumulative frequency distributions of telophase division angles from E16.5 sagittal sections of Afdn-cKO results in randomized division orientation at telophase; n indicates number of observed divisions from 3 to 4 independent embryos. (C) Cumulative frequency distributions of telophase division angles from E16.5 whole mount sections of Afdn knockouts. Loss of Afdn results in randomized division orientation at telophase. Note, fewer perpendicular divisions are observed in whole mounts compared to sections, likely due to 1) the relative difficulty of detecting perpendicular divisions compared to planar divisions in whole mounts, and 2) the likelihood of undercounting planar-mediolateral divisions in sagittal sections. Scale bars, 5 μm. P values determined by Kolmogorov-Smirnov test. ***p<0.001.
Figure 6 with 4 supplements
AJ mutants fail at both planar and perpendicular telophase correction.
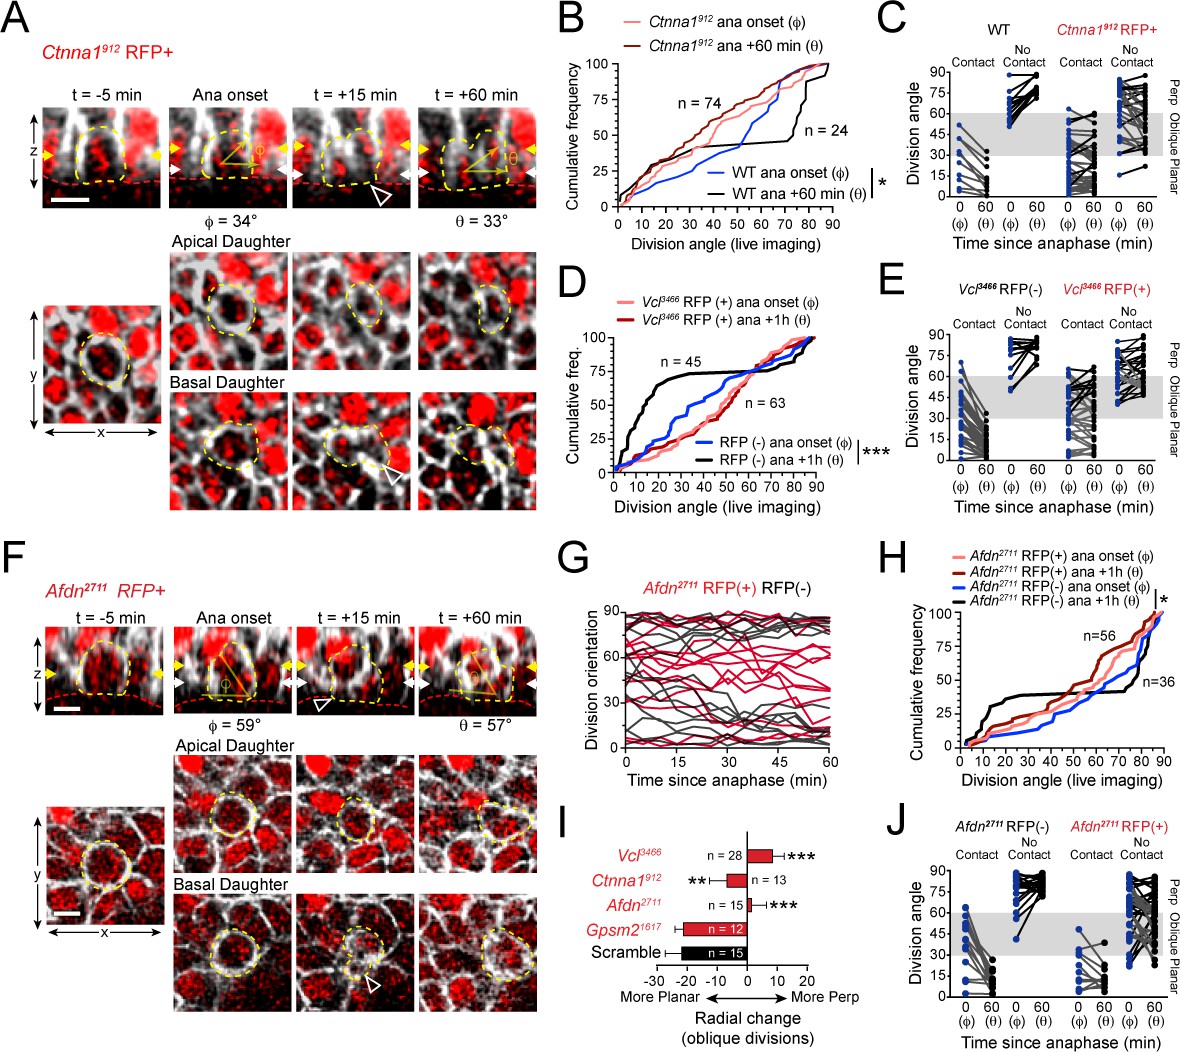
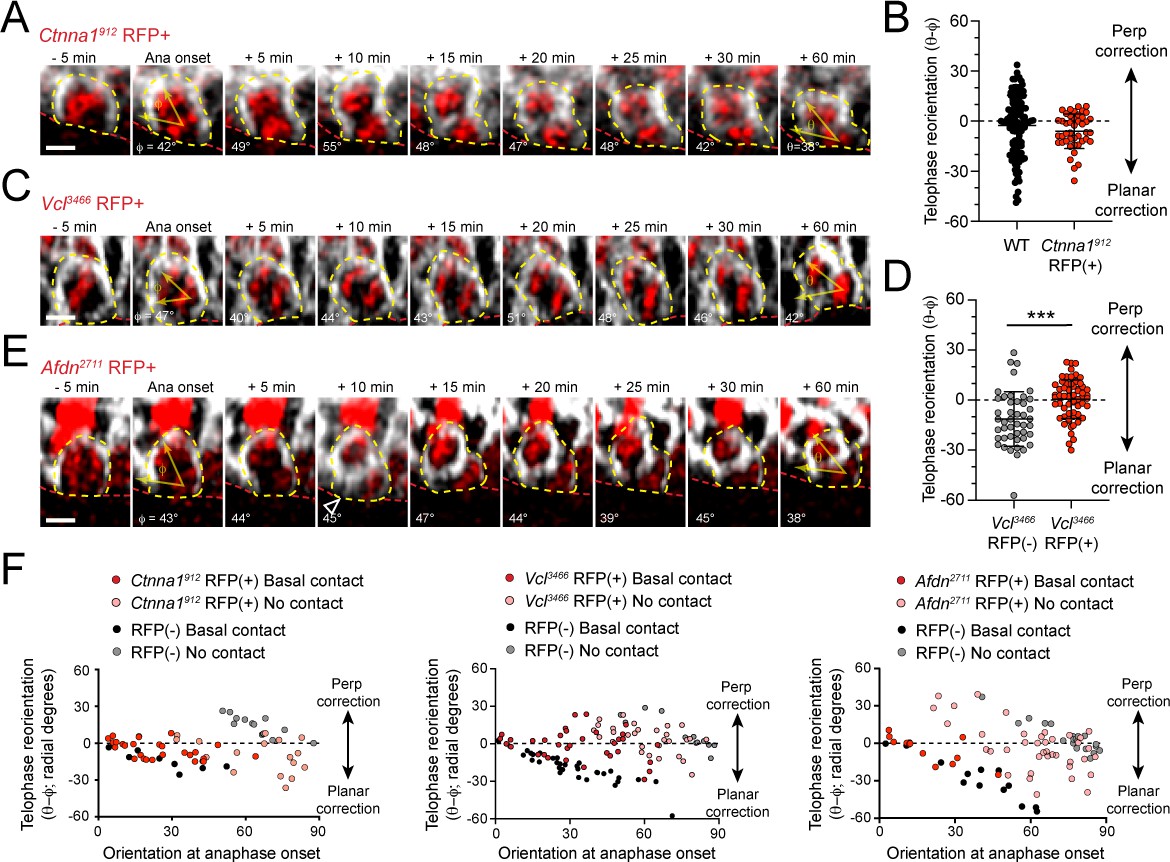
(A) Movie stills of Ctnna1912 RFP+ mitotic cell, annotated as in Figure 3A. While the presence of basal contact (open arrowhead) would predict planar correction, this division remains oblique when reevaluated 1h later. (B) Cumulative frequency distribution of division angles from E16.5 live imaging experiments of Ctnna1912 RFP+ and wild-type littermates; n values indicate cells imaged from three embryos images in two separate sessions. (C) Division orientation at anaphase onset (φ) and 1h later (θ) for Ctnna1912 knockdown and wild-type littermates, plotted from data in (B). Ctnna1912 RFP+ cells show no obvious correction pattern. (D) Cumulative frequency distribution of division orientation at anaphase onset (φ) and 1hrpost-anaphase (θ) for RFP+ and RFP- populations, from movies of Vcl3466 mosaic tissue; n indicates divisions from four embryos imaged in three separate sessions. (E) Data from (D) depicting orientation at anaphase onset (φ) and 1h later (θ) for RFP- and RFP+ cells. RFP- controls sort anaphase orientation (φ) into bimodal distribution within 1h(θ) in a basal-contact dependent manner; Vcl3466 RFP+ cells display minimal change, or correct irrespective of basal contact. (F) An obliquely-oriented Afdn2711 RFP+ cell fails to reorient, while losing basal contact (open arrowhead). (G) Timelines of division orientation at 5 min intervals from movies of Afdn2711 RFP- (black) and RFP+ (red) for 15 representative cells per group. Telophase reorientation establishes bimodal distribution within ~30 min in RFP- control cells that enter anaphase at oblique angles, while RFP+ cells fail to demonstrate any sorting behavior over a full hour following anaphase onset. (H) Cumulative frequency distributions of division orientation from E16.5 live imaging of Afdn2711 RFP+ and wild-type littermates; n indicates observed divisions from three embryos imaged in two separate sessions. (I) Radial change (φ-θ) for oblique anaphase divisions (30°−60°) in several shRNA conditions. While loss of LGN allows for normal telophase correction, Afdn, Ctnna1, and Vcl knockdown results in incoherent or minimal radial change; n indicates number of divisions from 3 to 6 individuals embryos images in 2–4 technical replicates. (J) Division orientation at anaphase onset (φ) and one hour later (θ) for Afdn2711 RFP+ and RFP- cells, plotted from data in (C). RFP- controls correct into a bimodal distribution, while RFP+ cells reorient randomly. Scale bars, 10 μm. P values determined by Kolmogorov-Smirnov test (B,D,H) or student’s t-test (I). *p<0.05, **p<0.01, ***p<0.001. See also Figure 6—figure supplement 1.
-
Figure 6—source data 1
Original measurements used to generate panels B, C, D, E, G, H, I, J.
- https://cdn.elifesciences.org/articles/49249/elife-49249-fig6-data1-v2.xlsx
Figure 6—figure supplement 1
AJ loss-of-function mutants display errors in division orientation.
(A) Time-course stills from Ctnna1912 H2B-RFP (red) and mGFP (gray) live imaging experiment demonstrating failed telophase correction. (B) Telophase reorientation (θ-φ) quantification in Ctnna1912 (red) and wild-type littermates (black). Ctnna1912 knockdown reduces the overall amount of cell reorientation following anaphase onset. (C) Time-course stills from Vcl3466 H2B-RFP (red) and mGFP (gray) live imaging experiment demonstrating failed telophase correction. (D) Telophase reorientation (θ-φ) quantification in Vcl3466 (red) and wild-type littermates (black). (E) Time-course stills from Afdn2711 H2B-RFP (red) and mGFP (gray) live imaging experiment demonstrating failed telophase correction. (F) Radial correction (θ-φ) for Ctnna1912, Vcl3466, and Afdn2711, RFP-negative (black/gray) and RFP+ (red/pink) plotted versus initial anaphase orientation (φ). Knockdown cells are less responsive to the orienting function of basal contacts compared to RFP-negative controls. Scale bars, 5 μm. P values determined by student’s t-test. ***p<0.001.
Figure 6—video 1
Persistent oblique division in Ctnna1912 knockdown mitotic basal cell.
Z-projection of RFP+ basal cell from Krt14Cre; Rosa26mT/mG epidermal explants transduced with Ctnna1912 shRNA, taken from E16.5 embryos imaged in 5 min intervals. The mitotic cell (white dashed outline) initiates anaphase at an oblique (30–60°) orientation relative to the basement membrane (red) and remains oblique throughout the 1 hr imaging period. H2B-mRFP1 labels nuclei (red) and mGFP labels cell membranes (gray). Scale bar: 5 μm.
Figure 6—video 2
Persistent oblique division in Vcl3466 knockdown mitotic basal cell.
Z-projection of RFP+ basal cell from Krt14Cre; Rosa26mT/mG epidermal explants transduced with Vcl3346 shRNA, taken from E16.5 embryos imaged in 5 min intervals. The mitotic cell (white dashed outline) initiates anaphase at an oblique (30–60°) orientation relative to the basement membrane (red) and remains oblique throughout the 1h imaging period. H2B-mRFP1 labels nuclei (red) and mGFP labels cell membranes (gray).
Figure 6—video 3
Persistent oblique division in Afdn2711 knockdown mitotic basal cell.
Z-projection of RFP+ basal cell from Krt14Cre; Rosa26mT/mG epidermal explants transduced with Afdn2711 shRNA, taken from E16.5 embryos imaged in 5 min intervals. The mitotic cell (white dashed outline) initiates anaphase at an oblique (30–60°) orientation relative to the basement membrane (red) and remains oblique throughout the 1h imaging period. H2B-mRFP1 labels nuclei (red) and mGFP labels cell membranes (gray). Scale bar: 5 μm.
Figure 7 with 2 supplements

AJ mutants alter division orientation via LGN-independent mechanisms.
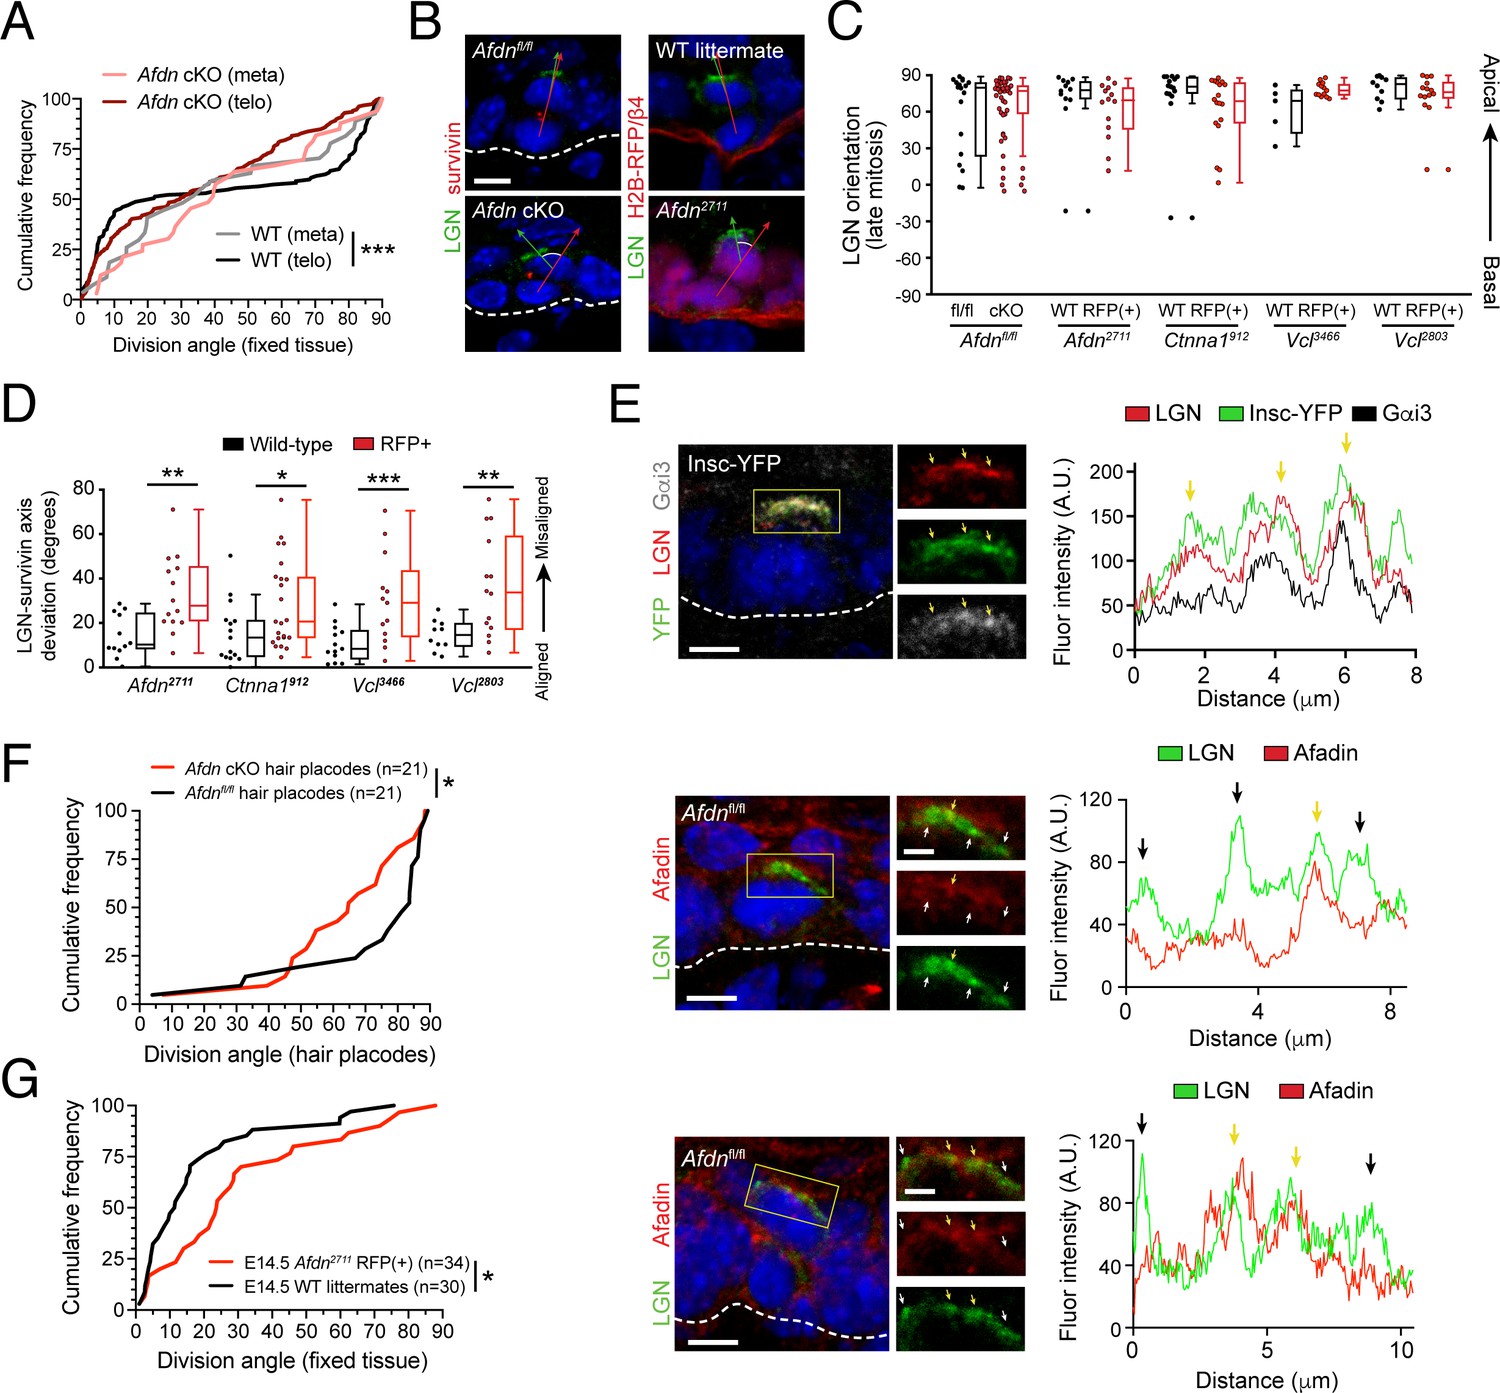
(A) Immunostaining for LGN (green) in E16.5 Afdnfl/fl and Afdn-cKO epidermis. LGN localizes at the apical cortex during mitosis regardless of afadin loss. (B) Quantification of LGN radial fluorescence intensity in E16.5 mitotic cells; n indicates LGN+ mitoses from 2 to 3 independent embryos. (C) Orientation of LGN crescents in E16.5 mitotic cells from indicated groups. Knockdown or knockout of AJ components does not significantly alter the tendency of LGN to localize apically. (D) (top) LGN (red) localization patterns in mitotic (green) basal keratinocytes. (Bottom) Quantification of LGN rate of recruitment, binned by genotype. LGN localizes to the apical cortex in ~50% of mitoses (black/red), is absent in ~45% (gray/pink), and "other" in the remaining ~5% (white), remaining unchanged in AJ knockdown/knockout mutants; n indicates mitotic cells from 2 to 3 independent embryos. (E) Costaining of E16.5 metaphase (left) and telophase (right) divisions with α-tubulin (red) and LGN (green) in Afdn-cKO (bottom) and Afdnfl/fl control littermates (top). (F) Quantification of the deviation between the metaphase spindle or division axis (red arrow in E) and LGN radial orientation (green arrow in E). Afdn knockout does not disrupt early spindle-LGN linkage, but shows oblique telophase orientation despite normal localization of LGN. (G) Immunostaining for the differentiation marker K10 (green) and lentiviral H2B-RFP reporter simultaneously with β4-integrin (red) in E16.5 Gpsm21617 infected embryos with an Afdnfl/fl (left) or Afdn-cKO (right) background. Dual loss of Afdn and Gpsm2 results in increased stratification relative to Gpsm2 loss alone. (H) Quantification of spinous layer (K10+) thickness from images as in (G). (I) Cumulative frequency distribution of telophase division angles from fixed sagittal sections of E16.5 embryos. n indicates number of divisions from 2 to 3 independent embryos. Scale bars, 5 μm (A,D,E), 25 μm (G). **p<0.01, ***p<0.001, determined by Kolmogorov-Smirnov test (I) or student’s t-test (F,H). See also Figure 7—figure supplements 1 and 2.
-
Figure 7—source data 1
Original measurements used to generate panels B, C, D, F, H, I.
- https://cdn.elifesciences.org/articles/49249/elife-49249-fig7-data1-v2.xlsx
Figure 7—figure supplement 1

Afdn loss-of-function does not affect functional apicobasal polarity or downstream components of spindle orientation.
(A) Immunostaining of E16.5 interphase cell with Par3 (red). (B) Quantification of Par3 radial fluorescent intensity. Apical accumulation is reduced by afadin knockout via Krt14Cre (Afdn cKO) or lentiviral Cre-RFP; n indicates interphase cells from 2 to 3 independent embryos. (C) E16.5 sagittal sections show that centrosomes (green) localize to the apical cortex of interphase cells in both Afdn cKO basal progenitors and Afdnfl/fl controls. (D) Quantification of centrosome radial position in basal keratinocytes; n indicates interphase cells from two independent embryos. (E) E16.5 Ctnna1912 (top) and Vcl3466 (bottom) RFP+ mitotic cell (pHH3+, white), showing normal apical localization of LGN (green). (F) NuMA (red) immunostaining in E16.5 mitotic cells. NuMA localizes predominantly in a bipolar manner, but displays unique patterns in the presence/absence of LGN (green). (G) Quantification of NuMA localization patterns binned by LGN presence/absence and genotype. Knockout of Afdn does not alter NuMA accumulation. (H) Dynactin (red) localization in LGN+ mitoses is unaffected by afadin knockout. Scale bars, 5 μm.
Figure 7—figure supplement 2
AJ components alter division orientation in an LGN-independent manner.
(A) Cumulative frequency distribution of spindle orientation at metaphase, and division orientation at telophase, in Afdn cKO and Afdnfl/fl control littermates. WT spindle orientation (gray line) is random at metaphase before becoming bimodal at telophase (black). In contrast, Afdn cKO orientation remains random at both metaphase (pink) and telophase (red); n indicates number of observed divisions from 2 to 3 independent embryos. (B) Afdn knockdown or knockout increases radial deviation between LGN (green) and the division plane (red line) (C) Quantification of LGN radial localization in late-stage (anaphase/telophase, Survivin+) mitoses. LGN apical bias is unaffected by loss of AJ components. (D) Deviation between telophase division axis (labeled with Survivin) and LGN orientation upon afadin, α-E-catenin, or vinculin knockdown (as measured in B). α-E-catenin and vinculin loss phenocopies Afdn knockout/knockdown. (E) Costaining of LGN (green) and afadin (red) in metaphase (top, middle) and telophase (bottom) mitoses from E16.5 epidermis with annotated genotype. Fluorescence intensity linescan across LGN crescent is displayed in the right panel. Regions of colocalization (yellow arrows) are more prevalent between LGN and mInsc or Gαi3 than with afadin, which display more regions lacking signal overlap (black arrows). (F) Cumulative frequency distribution of division orientation in E16.5 hair placodes (determined by P-cadherin staining). Afdn knockout (red) results in an increase in oblique orientations when compared to predominantly perpendicular orientation observed in Afdnfl/fl control littermates; n indicates observed divisions from 3 to 4 independent embryos. (G) Cumulative frequency distribution of E14.5 division orientation in Afdnfl/fl controls (black) and Afdn2711 (red). Afdn knockout increases the frequency of oblique OCDs; n indicates observed divisions from 3 to 4 independent embryos. Scale bars, 5 μm. P values determined by Kolmogorov-Smirnov test (A,F,G), or student’s t-test/Mann-Whitney test depending on tests of normality (D). *p<0.05, **p<0.01, ***p<0.001.
Figure 8 with 1 supplement
Planar telophase correction limits precocious and sustained differentiation and biases clones towards symmetric cell divisions.
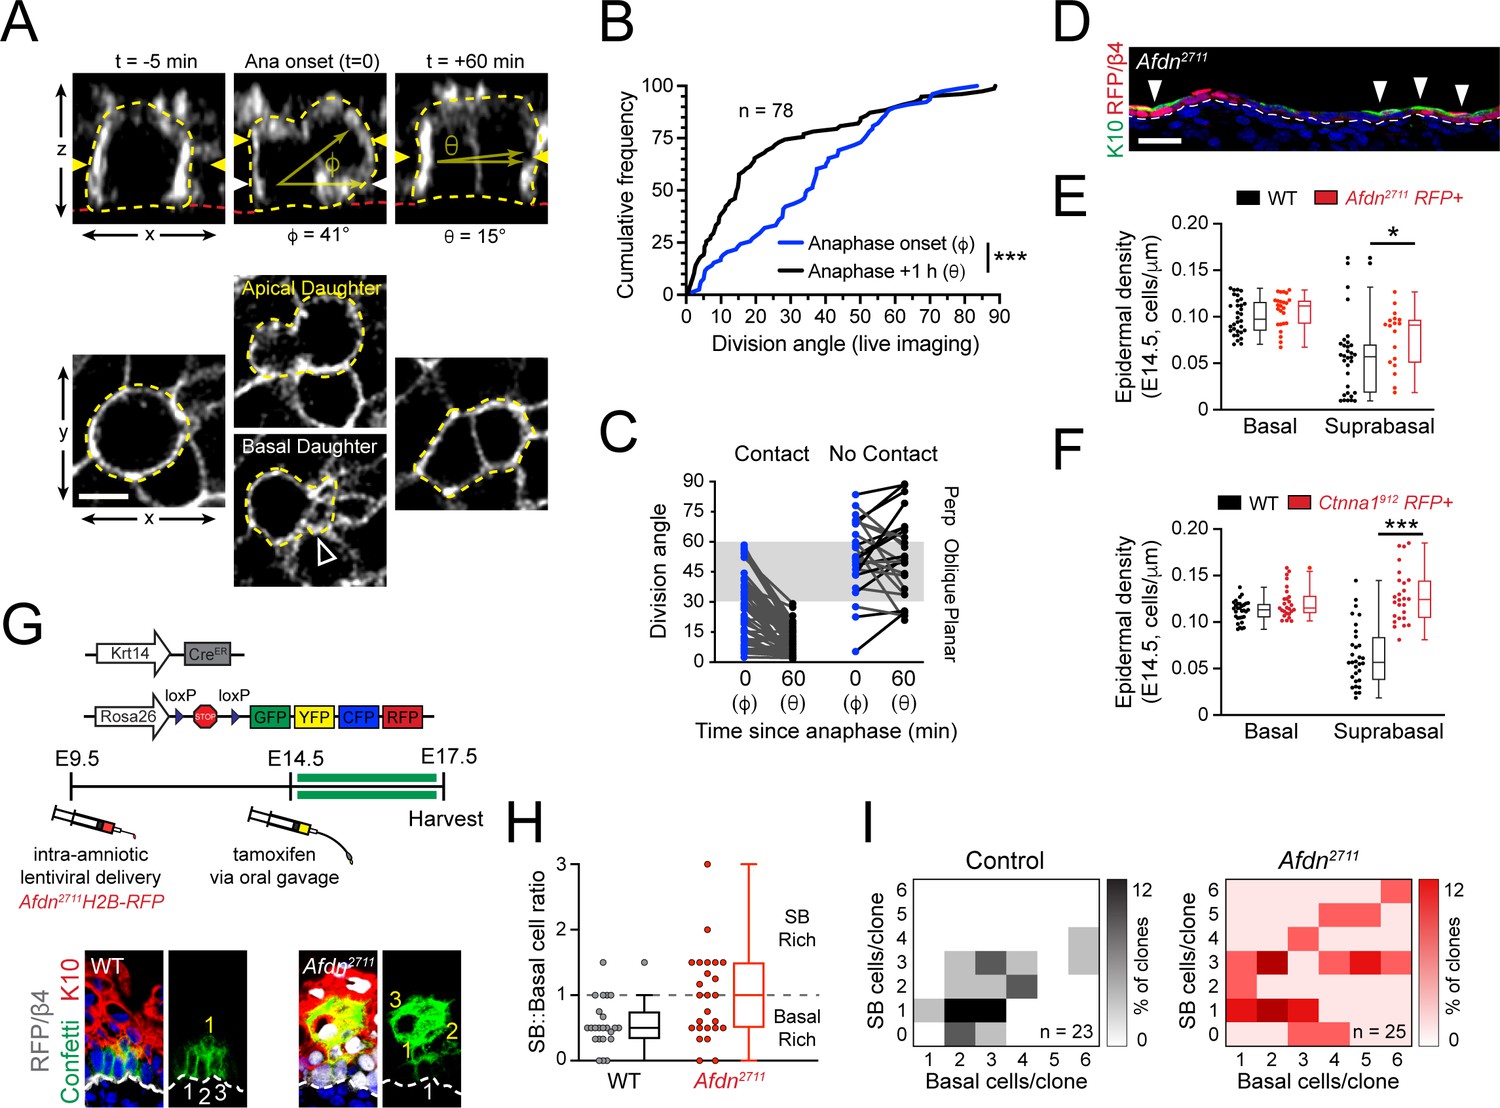
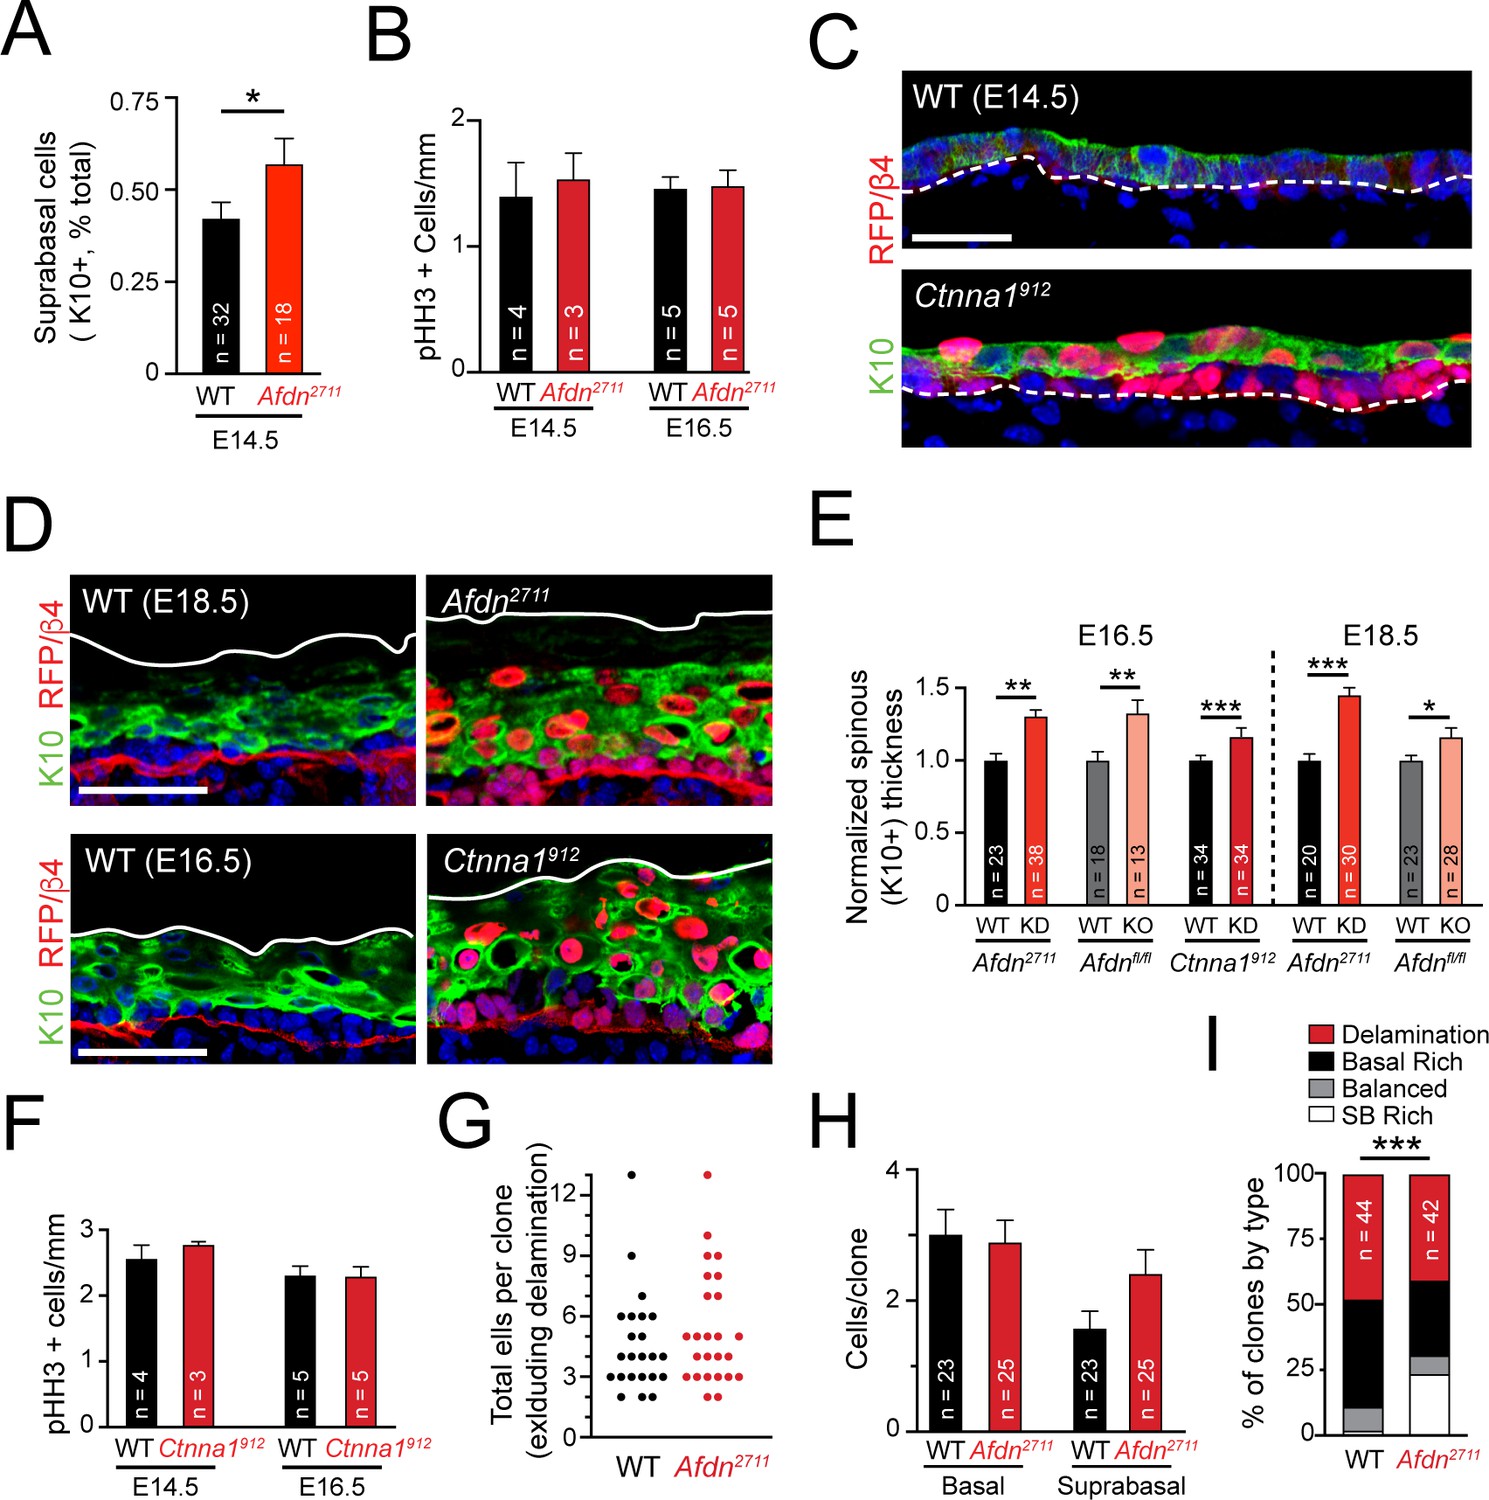
(A) (top) z-projection stills from a movie of an E14.5 mitotic cell, annotated as in Figure 1E. (B) Cumulative frequency distribution of division angles from live imaging experiments of E14.5 embryos at anaphase onset (blue; φ) and 1h later (black; θ); n indicates number of divisions from 3 embryos across two independent sessions. (C) Data from (B) depicting division orientations at telophase and 1h later, sorted based on retention/loss of basal contact throughout cell division. Connecting lines demonstrate that, at E14.5, planar correction occurs in a contact dependent manner, while mitoses that lose contact demonstrate no obvious pattern of correction. (D) Sagittal section of E14.5 epidermis with mosaic Afdn2711 H2B-RFP transduction. Regions of high infection display increased stratification, as demonstrated by K10 (green) positivity. (E-F) Quantification of epidermal differentiation from E14.5 sagittal sections. Afdn (E) or Ctnna1 (F) knockdown increases suprabasal cell density, suggesting precocious differentiation. (G) (top) Graphical depiction of clonal lineage tracing strategy; (bottom) Representative images of E17.5 sagittal sections from lineage tracing experiments stained with GFP (green), K10 (red), and RFP/β4-integrin (gray). Afdn2711 knockdown clones display asymmetric (suprabasal) bias. (H) Clonal density arrays representing all evaluated clones (except delamination events) from experiments outlined in (G). The proportion of total clones for each possible combination of basal/suprabasal cells is coded on a color spectrum correlating to 0–12% of all clones. (I) Quantification of suprabasal (SB):basal cell ratio for individual clones. Knockdown of Afdn results in a higher ratio of SB cells in individual clones compared to wild-type littermates. Scale bars, 5 μm (A), 25 μm (D). *p<0.05, ***p<0.001, determined by Kolmogorov-Smirnov test (B) or student’s t-test (F). See also Figure 8—figure supplement 1.
-
Figure 8—source data 1
Original measurements used to generate panels B, C, F, H , I.
- https://cdn.elifesciences.org/articles/49249/elife-49249-fig8-data1-v2.xlsx
Figure 8—figure supplement 1
Failed telophase correction induces precious, sustained hyperstratification without impacting proliferation or delamination.
(A) Quantification of K10+ suprabasal proportion in E14.5 wild-type and Afdn2711 mutants. (B) Mitotic index quantification at E14.5 and E16.5 in wild-type and Afdn2711 mutants. (C) Immunofluorescence of E14.5 sagittal sections from wild-type and Ctnna1912 backskins stained with the differentiation marker K10 (green). (D) Immunofluorescence of sagittal sections from wild-type, Afdn2711, and Ctnna1912 backskins stained with the differentiation marker K10 (green), RFP and β4-integrin (red). (E) Quantification of spinous (K10+) thickness at E16.5 and E18.5 for Afdn or Ctnna1 mosaic knockdown (red) and lentiviral Cre-RFP mediated Afdn knockout (pink). (F) Mitotic index quantification at E14.5 and E16.5 in wild-type and Ctnna1912 mutants. (G) Comparison of total clone size (basal + SB cells) from lineage tracing experiments in wild-type and Afdn knockdown samples. (H) Comparison of basal cell and SB cell counts per clone from lineage tracing experiments in wild-type2711 and Afdn knockdown samples. (I) Grouped column graph demonstrating rates of delaminated (red), basal rich (black), balanced (gray), and SB rich (white) clones. Afdn knockdown biases clones towards SB-rich (asymmetric) outcomes. Scale bars, 25 μm (C), 50 μm (D). P values determined by student’s t-test/Mann-Whitney test depending on tests of normality (A,E) or by binomial test (I). *p<0.05, **p<0.01, ***p<0.001.
Figure 9
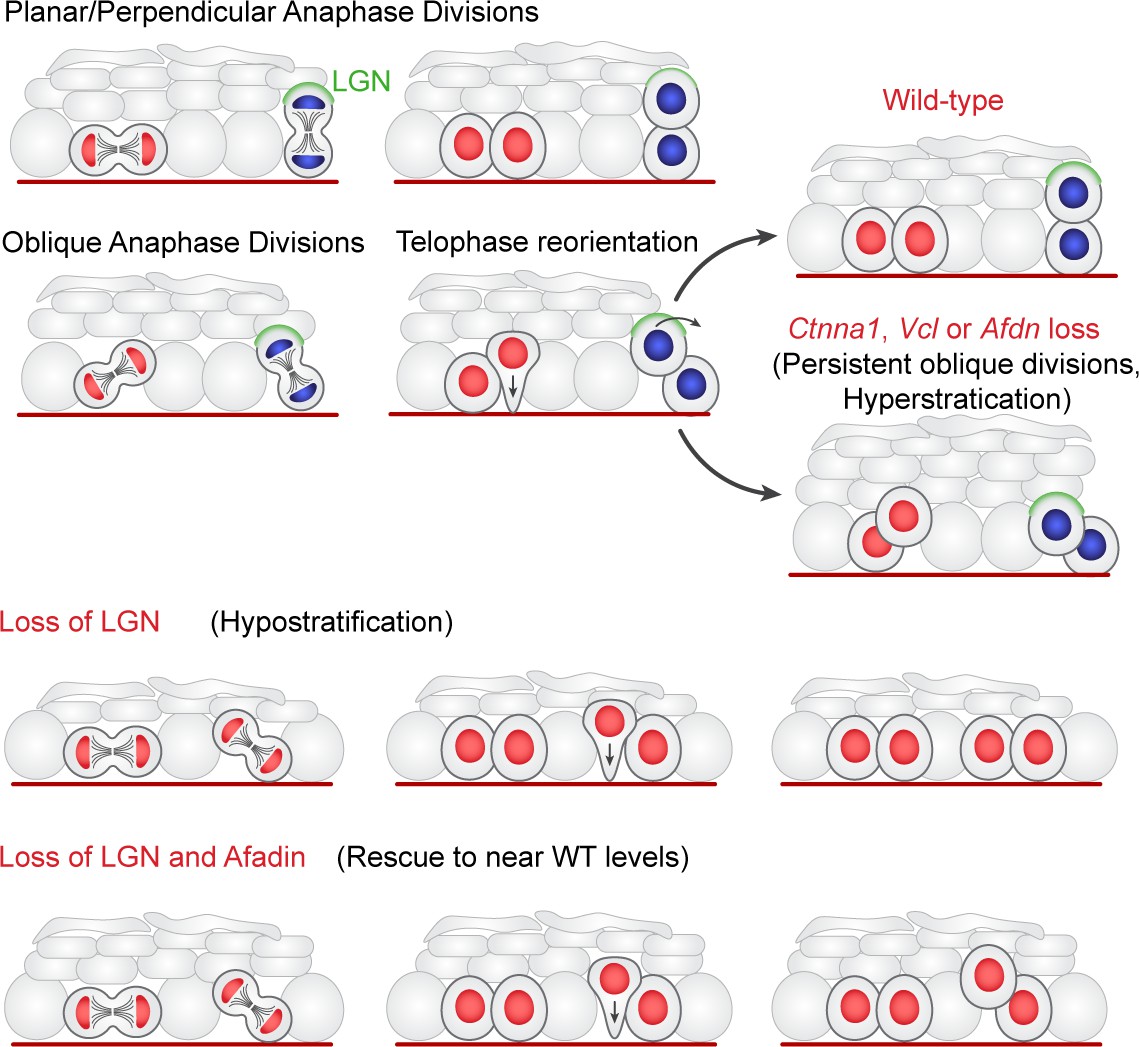
Two-step model of division orientation.
Model of OCD in the embryonic epidermis. During stratification, LGN (green) is recruited to the apical cortex in ~50% of mitoses, promoting perpendicular divisions. For OCDs with perpendicular and planar anaphase orientations, the division angle is fixed at anaphase onset, exhibiting minimal change in radial orientation during telophase. Importantly, the activity of LGN and its binding partners is imprecise, frequently resulting in oblique orientations at anaphase. In these cases, the apical daughter either retains or loses basement membrane contact following cytokinesis (red or blue nuclei, respectively). If contact is maintained, the apical daughter will reorient into a planar position. In contrast, if contact is lost, the apical daughter further stacks above its basal partner. Upon loss of α-E-catenin, vinculin, or afadin, telophase reorientation in either direction fails, resulting in persistent oblique divisions. In comparison, LGN loss reduces perpendicular anaphase orientations, while oblique divisions are properly corrected in a contact dependent manner. Afdn loss on an Gpsm2 mutant background restores oblique divisions and largely rescues the Gpsm2 differentiation defect.
Tables
Key resources table
| Reagent type (species) or resource | Designation | Source or ref. | Identifiers | Additional information |
|---|---|---|---|---|
| Strain, strain background (Mus musculus) | mTmG | Jackson Labs | IMSR Cat# JAX:007576, RRID:IMSR_JAX:007576 | |
| Strain, strain background (Mus musculus) | Krt14Cre | (Dassule et al., 2000) | ||
| Strain, strain background (Mus musculus) | Krt14H2B-GFP | (Tumbar et al., 2004) | ||
| Strain, strain background (Mus musculus) | CD1 | Charles River | IMSR Cat# CRL:022, RRID:IMSR_CRL:022 | New females integrated into colony every ~ 5 years to maintain as outbred strain. |
| Strain, strain background (Mus musculus) | LSL-Confetti | Jackson Labs | IMSR Cat# JAX:013731, RRID:IMSR_JAX:013731 | |
| Strain, strain background (Mus musculus) | Krt14CreER | Jackson Labs | IMSR Cat# JAX:005107, RRID:IMSR_JAX:005107 | |
| Strain, strain background (Mus musculus) | Afdnfl/fl | (Beaudoin et al., 2012) | ||
| Antibody | Guinea-pig polyclonal anti-LGN | (Williams et al., 2011) | (1:500 dilution) | |
| Antibody | Rabbit monoclonal anti-survivin (71G4B7) | Cell Signaling | Cat# 2808, RRID:AB_2063948 | (1:1000 dilution) |
| Antibody | Chicken polyclonal anti-GFP | Abcam | Cat# ab13970, RRID:AB_300798 | (1:2000 dilution) |
| Antibody | Rat monoclonal anti-mCherry (16D7) | Thermo Fisher Scientific | Cat# M11217, RRID:AB_2536611 | (1:2000 dilution) |
| Antibody | Rabbit polyclonal anti-LGN | Millipore | Cat# ABT174 | (1:2000 dilution) |
| Antibody | Rat monoclonal anti-β4 integrin | Thermo-Fisher | BD Biosciences Cat# 553745, RRID:AB_395027 | (1:1000 dilution) |
| Antibody | Rabbit polyclonal anti-Gai3 | EMD Millipore | Millipore Cat# 371726–50 UL, RRID:AB_211897 | (1:500 dilution) |
| Antibody | Goat polyclonal anti-dynactin | Abcam | Abcam Cat# ab11806, RRID:AB_298590 | (1:500 dilution) |
| Antibody | Mouse (IgM) monoclonal anti-NuMA | BD Transduction Labs | BD Biosciences Cat# 610562, RRID:AB_397914 | (1:300 dilution; use Jackson labs Donkey anti-IgM Cy3 conjugated secondary) |
| Antibody | Rabbit polyclonal anti-histone H3, phospho (Ser10) | Millipore | Cat# 06–570, RRID:AB_310177 | (1:1000 dilution) |
| Antibody | Rat monoclonal anti-a-tubulin | EMD Millipore | Millipore Cat# CBL270, RRID:AB_93477 | (1:500 dilution) |
| Antibody | Rabbit polyclonal anti-pericentrin | Covance | Covance Cat# PRB-432C-200, RRID:AB_291635 | (1:500 dilution) |
| Antibody | Rabbit polyclonal anti-cytokeratin 10 (Poly19054) | Bio-Legend | Cat# 905404, RRID:AB_2616955 | (1:1000 dilution) |
| Antibody | Rabbit polyclonal anti-Par3 | EMD Millipore | Millipore Cat# 07–330, RRID:AB_2101325 | (1:500 dilution) |
| Antibody | Rat monoclonal anti-E-cadherin (ECCD-2) | Life Technologies | Thermo Fisher Scientific Cat# 13–1900, RRID:AB_2533005 | (1:1000 dilution) |
| Antibody | Goat polyclonal anti-E-cadherin | R and D systems | R and D Systems Cat# AF748, RRID:AB_355568 | (1:1000 dilution) |
| Antibody | Rabbit polyclonal anti-a-E-catenin | Invitrogen | Thermo Fisher Scientific Cat# 71–1200, RRID:AB_2533974 | (1:300 dilution; tissue sections) |
| Antibody | Rat monoclonal anti-a18 | (Yonemura et al., 2010) | (1:10000 dilution; tissue sections) (1:2000 dilution; wholemounts) | |
| Antibody | Rabbit polyclonal anti-vinculin | Gift from Dr. Keith Burridge | (1:1000 dilution) | |
| Antibody | Mouse monoclonal anti-vinculin | Sigma Aldrich | Sigma-Aldrich Cat# V9131, RRID:AB_477629 | (1:500 dilution) |
| Antibody | Rabbit polyclonal anti-afadin | Sigma Aldrich | Sigma-Aldrich Cat# A0224, RRID:AB_257871 | (1:500 dilution) |
| Antibody | Mouse monoclonal anti-pMLC2 (Ser19) | Cell Signaling | Cell Signaling Technology Cat# 3675, RRID:AB_2250969 | (1:500 dilution) |
| Chemical compound | Phalloidin AF-647 conjugated | Life Technologies | Thermo Fisher Scientific Cat# A22287, RRID:AB_2620155 | (1:500 dilution) |
| Cell line(s) (Mus musculus) | Primary keratinocytes | This publication. | Isolated as described in Materials and methods section. | |
| Chemical compound | Tamoxifen | Sigma-Aldrich | Cat# T5648 | |
| Software | FIJI | Source:https://imagej.net/Fiji Reference: doi:10.1038/nmeth.2019 |
Additional files
Download links
A two-part list of links to download the article, or parts of the article, in various formats.
Downloads (link to download the article as PDF)
Open citations (links to open the citations from this article in various online reference manager services)
Cite this article (links to download the citations from this article in formats compatible with various reference manager tools)
Telophase correction refines division orientation in stratified epithelia
eLife 8:e49249.
https://doi.org/10.7554/eLife.49249


