E. coli TraR allosterically regulates transcription initiation by altering RNA polymerase conformation
- The Rockefeller University, United States
- University of Wisconsin-Madison, United States
Figures
Figure 1 with 4 supplements
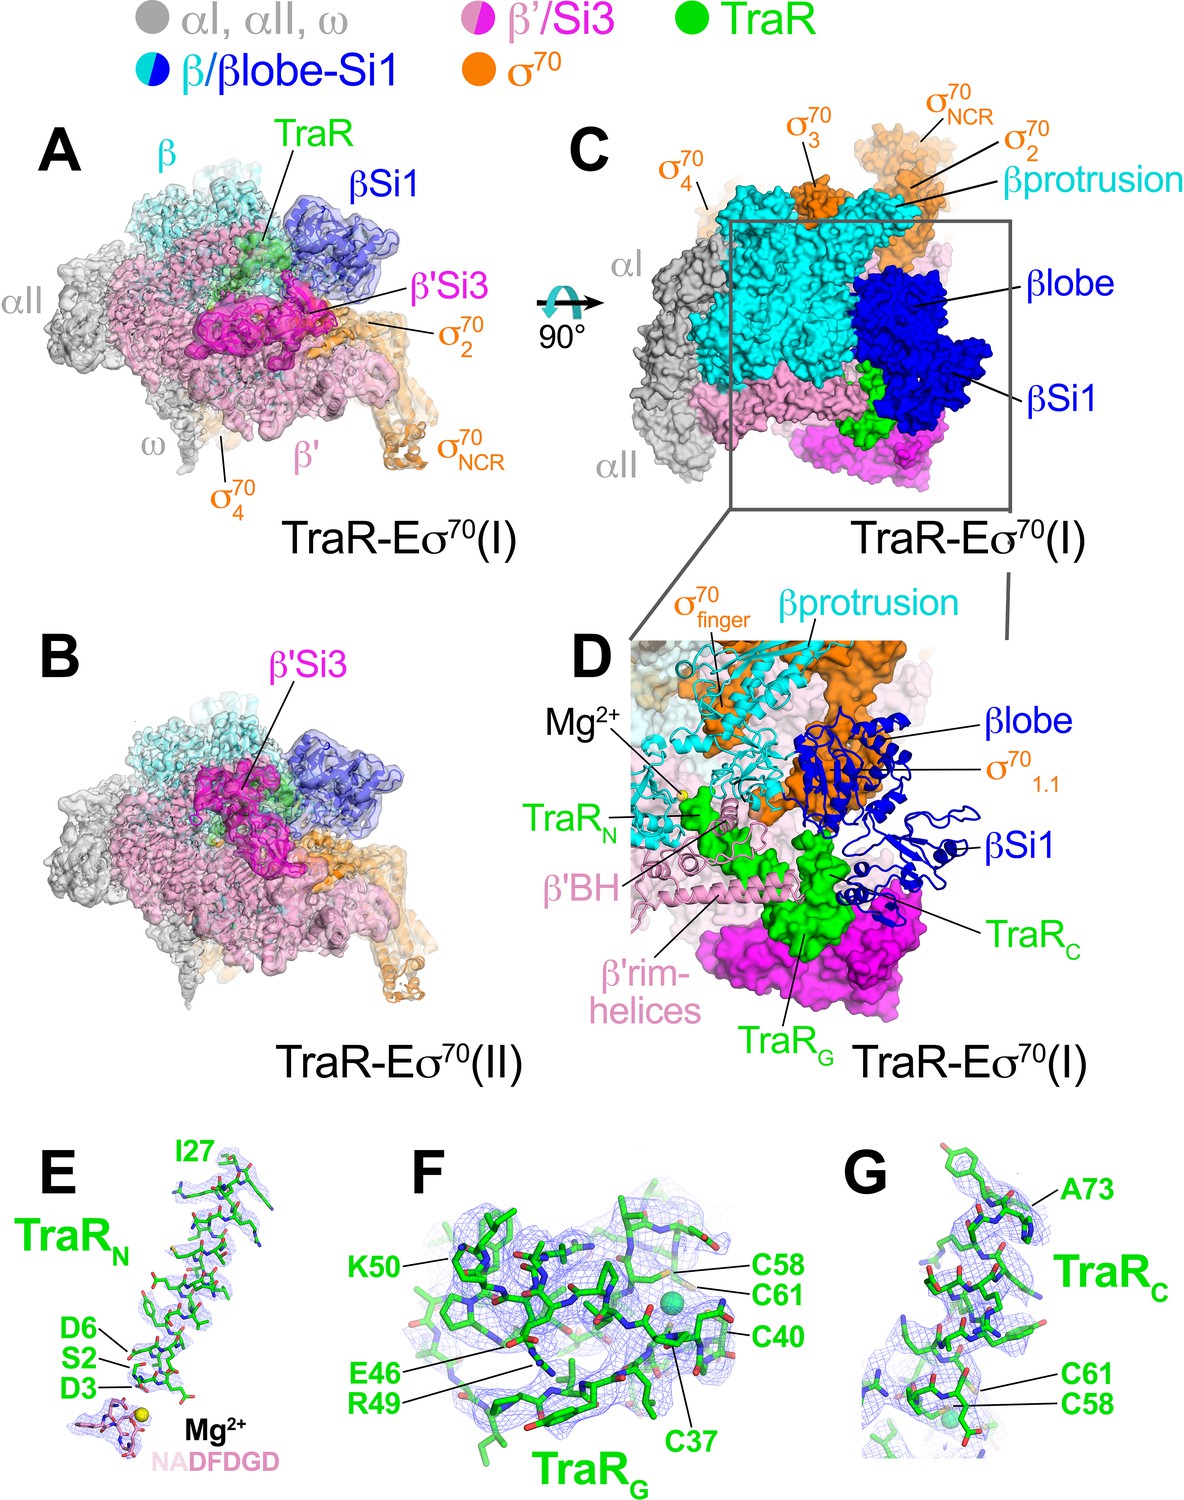
Cryo-EM structure of TraR-Eσ70.
(top) Color-coding key. (A) TraR-Eσ70(I) - cryo-EM density map (3.7 Å nominal resolution, low-pass filtered to the local resolution) is shown as a transparent surface and colored according to the key. The final model is superimposed. (B) TraR-Eσ70(II) - cryo-EM density map (3.8 Å nominal resolution, low-pass filtered to the local resolution) is shown as a transparent surface and colored according to the key. The final model is superimposed. (C) Top view of TraR-Eσ70(I). The boxed area is magnified in (D). (D) Magnified top view of TraR-Eσ70(I) - shows TraRN (starting near RNAP active site Mg2+, extending out secondary channel), TraRG (interacting primarily with β'rim-helices), and TraRC (interacting with βlobe-Si1). (E – G) Cryo-EM density (blue mesh) defining the TraR structure. (E) TraRN and -NADFDGD- motif of RNAP β' (chelating active site Mg2+). (F) TraRG. (G) TraR C.
Figure 1—figure supplement 1
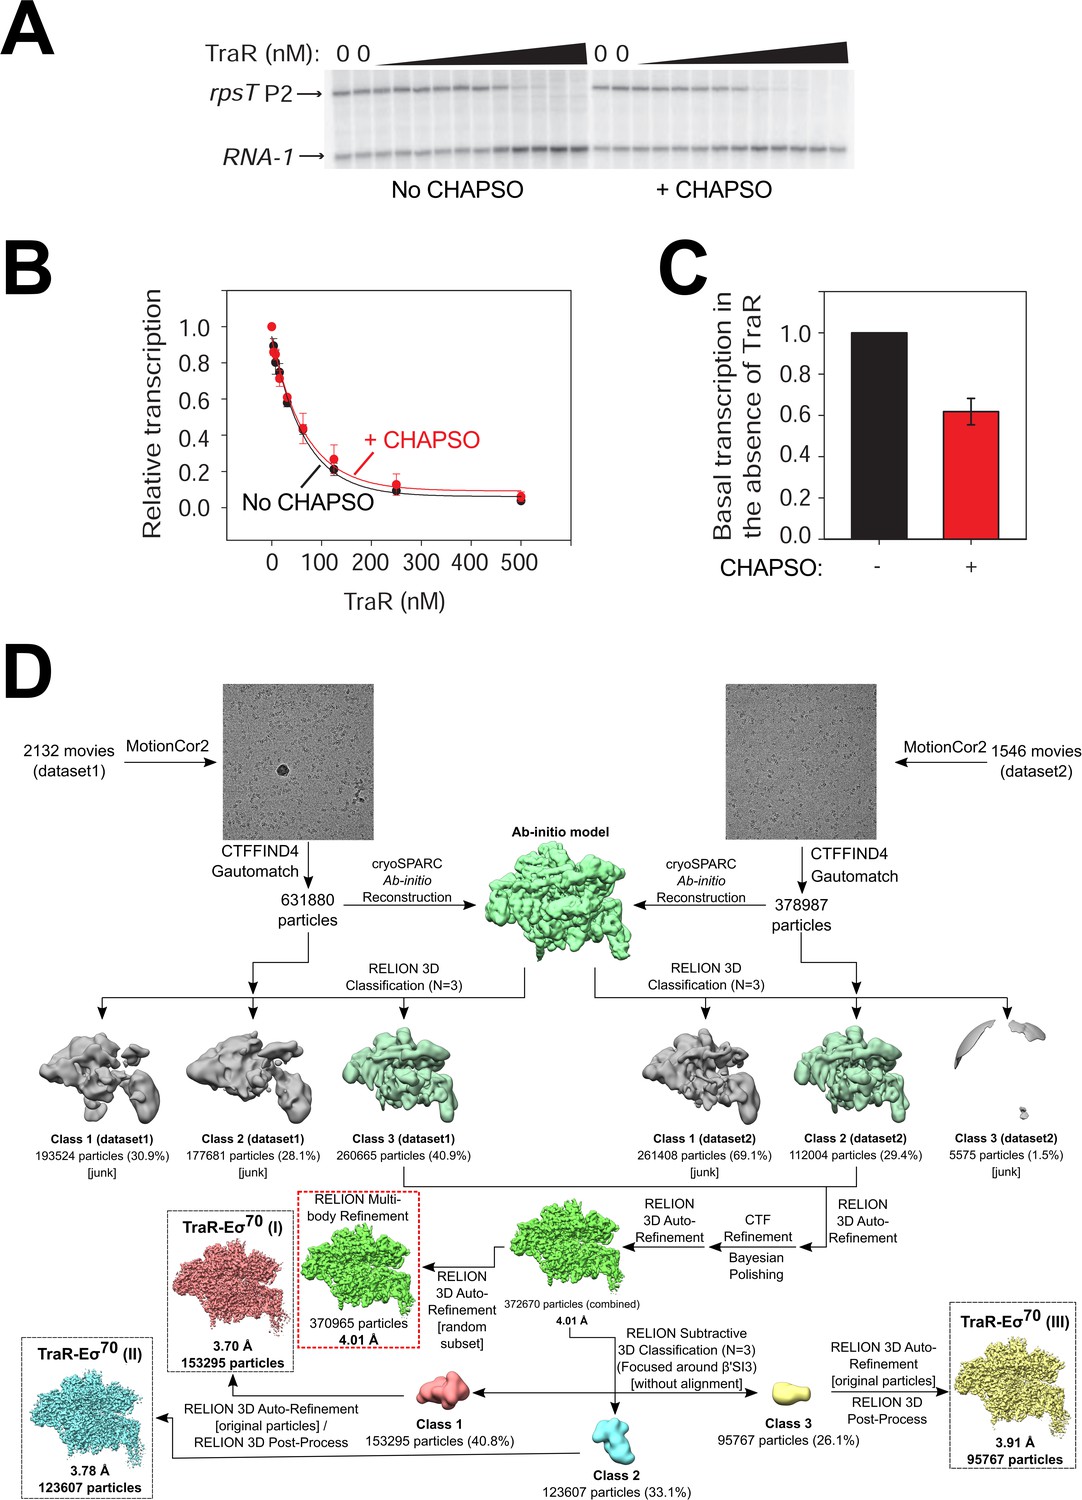
Cryo-EM solution conditions do not affect TraR function and TraR-Eσ70 cryo-EM processing pipeline.
(A) Multi-round in vitro transcription of rpsT P2 by Eσ70 (20 nM) at a range of TraR concentrations (wedge indicates 4 nM - 4 µM) in the absence or presence of 8 mM CHAPSO as indicated. Plasmid templates also contained the RNA-1 promoter. Small effects of TraR on RNA-1 have been reported previously (Gopalkrishnan et al., 2017) but the physiological significance is unclear. (B) Quantification of transcripts from experiments like those in (A) plotted relative to values in the absence of TraR. The IC50 for inhibition by TraR was ~50 nM for both ± CHAPSO data sets. Averages with range from two independent experiments are plotted. (C) Transcription in the absence of TraR is plotted, relative to the same reactions without CHAPSO. Although it had no effect on the concentration of TraR required for half-maximal inhibition (B), CHAPSO reduced transcription slightly. Averages with range from two independent experiments are plotted. (D) TraR-Eσ70 cryo-EM processing pipeline.
Figure 1—figure supplement 2
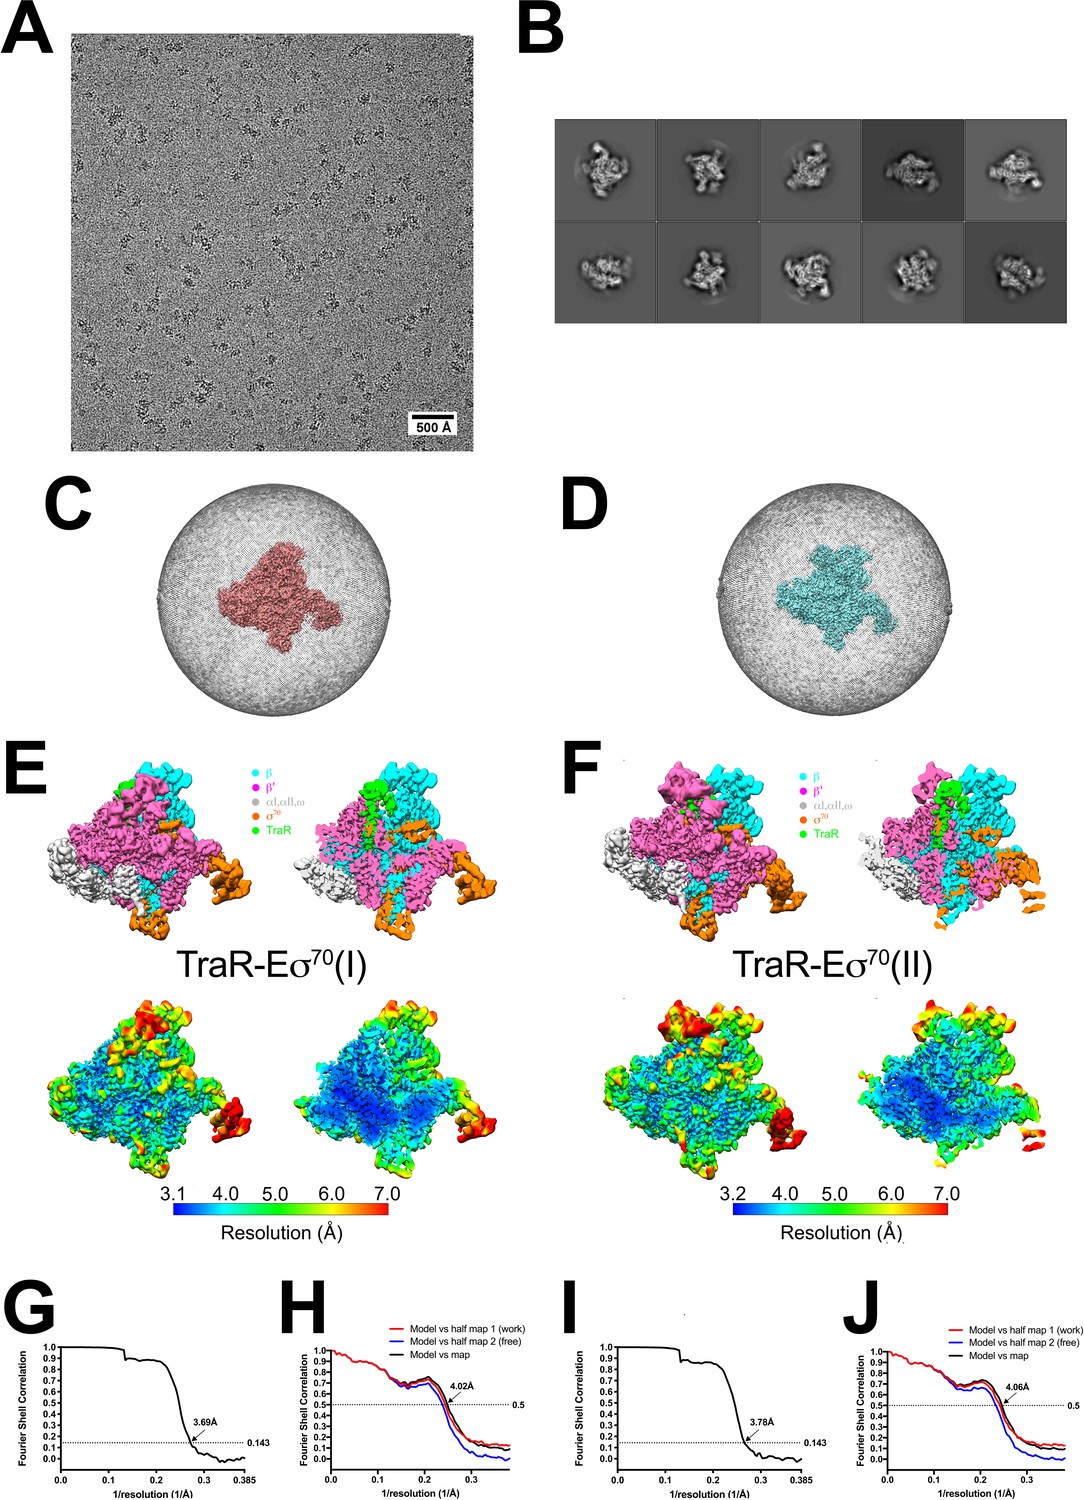
TraR-Eσ70 cryo-EM.
(A) Representative micrograph of TraR-Eσ70 in vitreous ice. (B) The ten most populated classes from 2D classification. (C) Angular distribution for TraR-Eσ70(I) particle projections. (D) Angular distribution for TraR-Eσ70(II) particle projections. (E) (top) The 3.7 Å resolution cryo-EM density map of TraR-Eσ70(I) is colored according to the key. The right view is a cross-section of the left view. (bottom) Same views as (top) but colored by local resolution (Cardone et al., 2013). (F) (top) The 3.8 Å resolution cryo-EM density map of TraR-Eσ70(II) is colored according to the key. The right view is a cross-section of the left view. (bottom) Same views as (top) but colored by local resolution (Cardone et al., 2013). (G) Gold-standard FSC of TraR-Eσ70(I). The gold-standard FSC was calculated by comparing the two independently determined half-maps from RELION. The dotted line represents the 0.143 FSC cutoff, which indicates a nominal resolution of 3.7 Å. (H) FSC calculated between the refined structure and the half map used for refinement (work), the other half map (free), and the full map. (I) Gold-standard FSC of TraR-Eσ70(II). The gold-standard FSC was calculated by comparing the two independently determined half-maps from RELION. The dotted line represents the 0.143 FSC cutoff, which indicates a nominal resolution of 3.8 Å. (J) FSC calculated between the refined structure and the half map used for refinement (work), the other half map (free), and the full map.
Figure 1—figure supplement 3
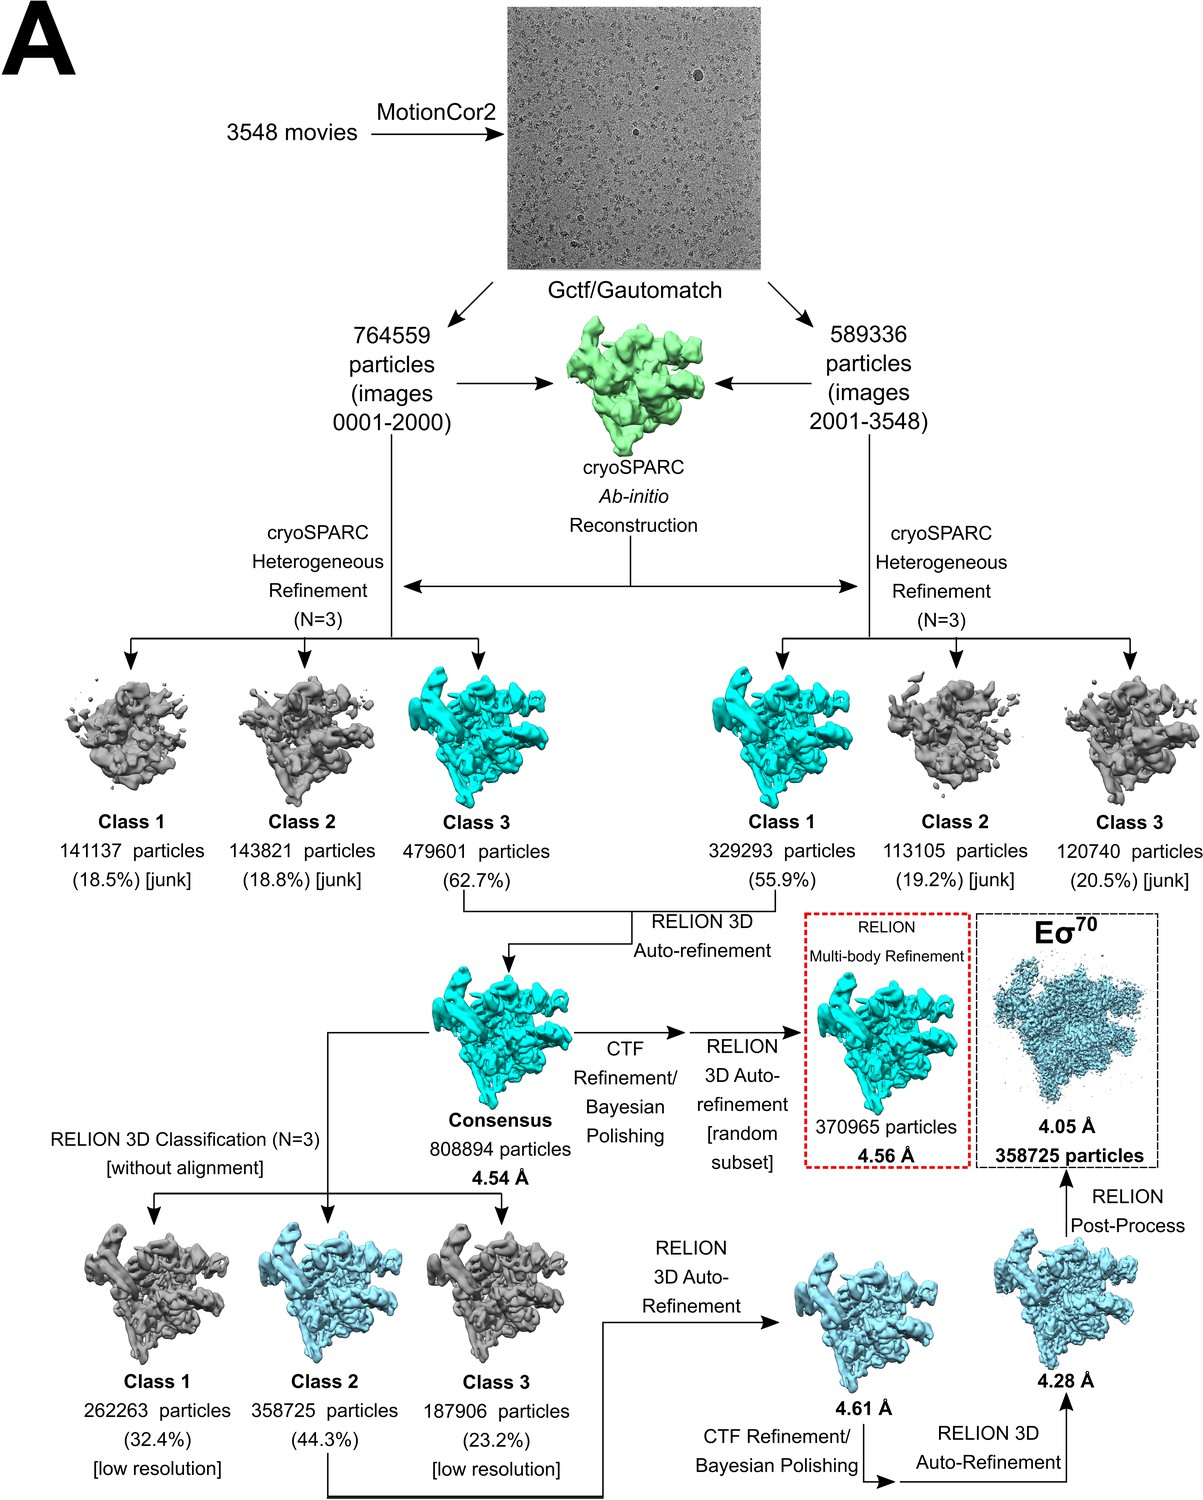
Eσ70 cryo-EM processing pipeline.
Eσ70 cryo-EM processing pipeline.
Figure 1—figure supplement 4
Eσ70 cryo-EM.
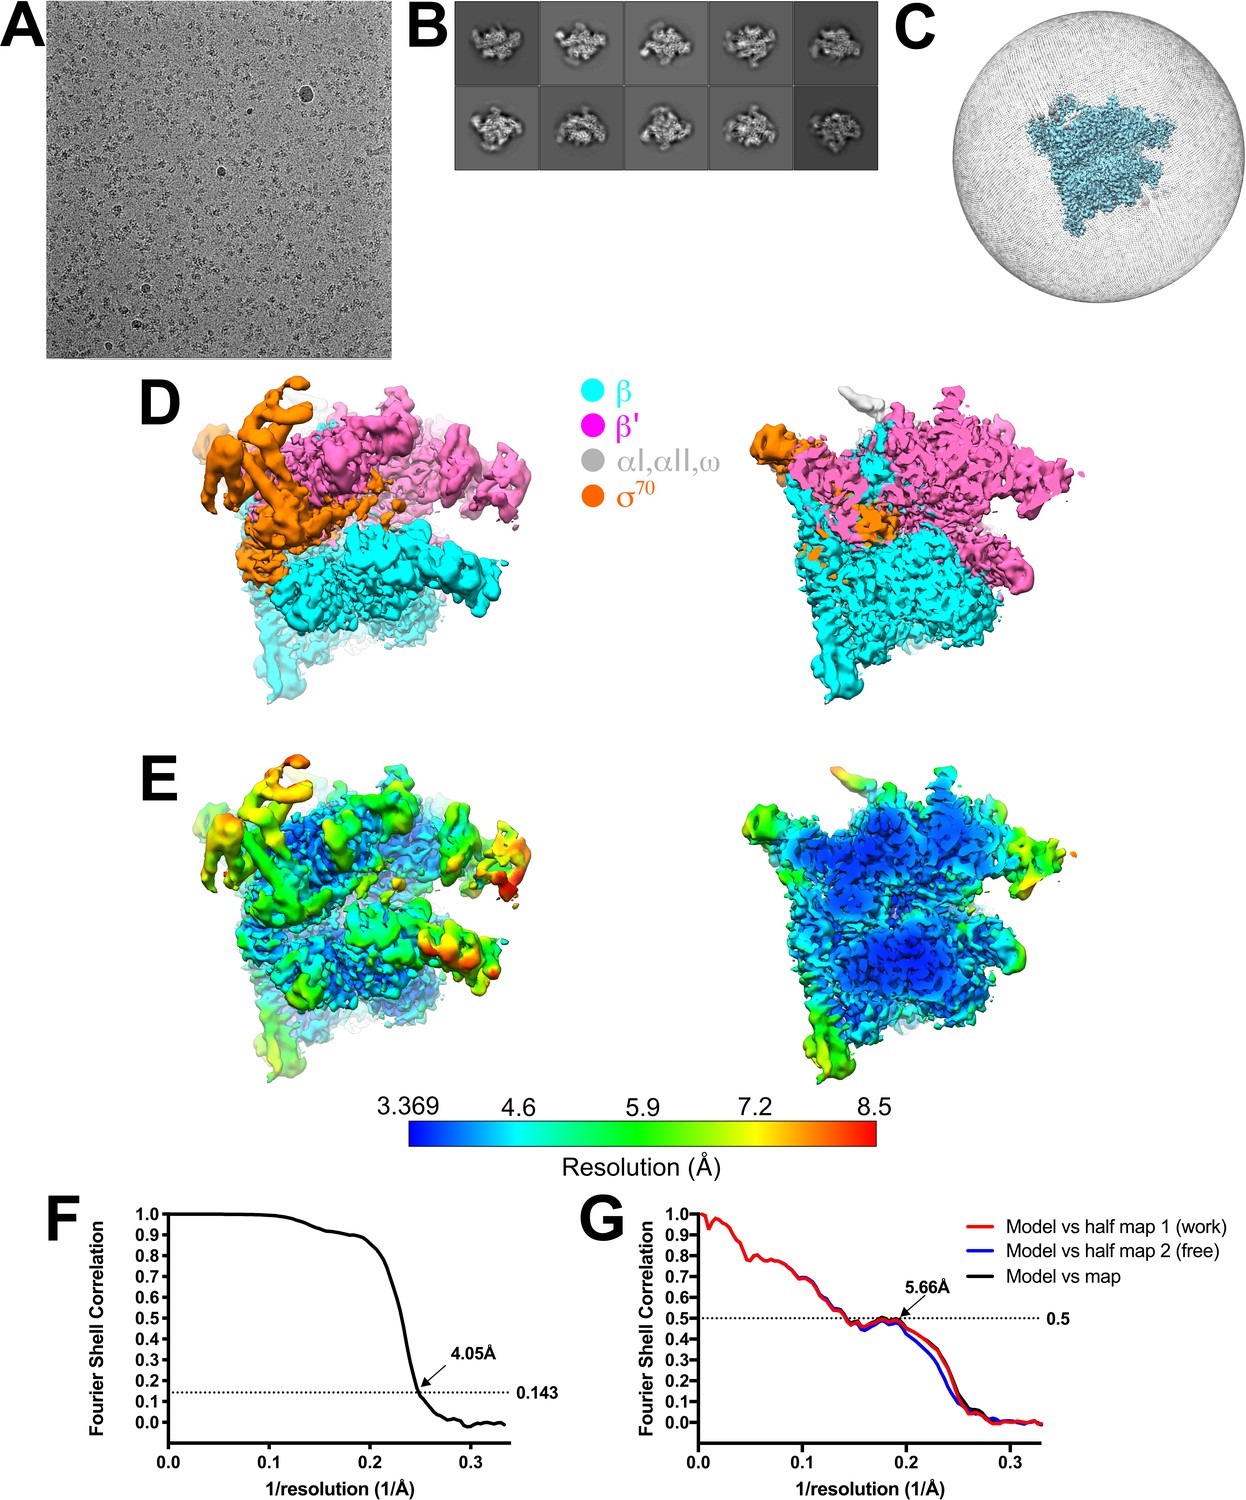
(A) Representative micrograph of Eσ70 in vitreous ice. (B) The ten most populated classes from 2D classification. (C) Angular distribution for Eσ70 particle projections. (D) The 4.1 Å resolution cryo-EM density map of Eσ70 is colored according to the key. The right view is a cross-section of the left view. (E) Same views as (D) but colored by local resolution (Cardone et al., 2013). (F) Gold-standard FSC of Eσ70. The gold-standard FSC was calculated by comparing the two independently determined half-maps from RELION. The dotted line represents the 0.143 FSC cutoff, which indicates a nominal resolution of 4.1 Å. (G) FSC calculated between the refined structure and the half map used for refinement (work), the other half map (free), and the full map.
Figure 2 with 2 supplements
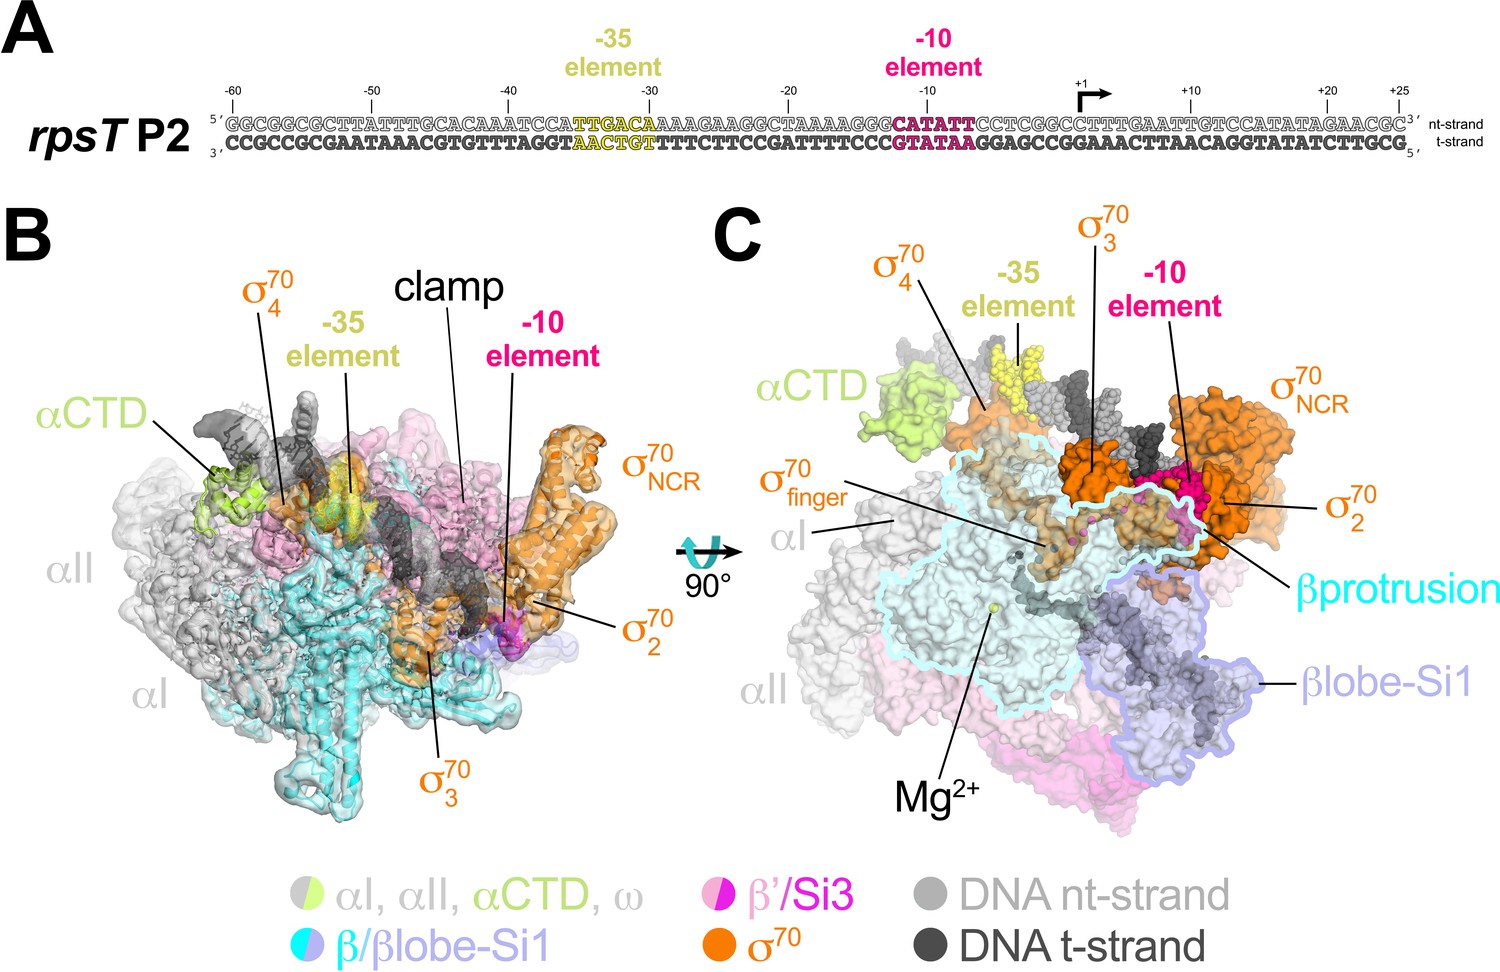
Cryo-EM structure of rpsT P2-RPo.
(A) The Eco rpsT P2 promoter fragment used for cryo-EM. (B) rpsT P2-RPo cryo-EM density map (3.4 Å nominal resolution, low-pass filtered to the local resolution) is shown as a transparent surface and colored according to the key. The final model is superimposed. The DNA was modeled from −45 to +21. The t-strand DNA from −10 to −2, and the nt-strand DNA from −3 to +2 were disordered. (C) Top view of rpsT P2-RPo. DNA is shown as atomic spheres. Proteins are shown as molecular surfaces. Much of the β subunit is transparent to reveal the active site Mg2+ (yellow sphere), σ70finger, and DNA inside the RNAP active site cleft.
Figure 2—figure supplement 1
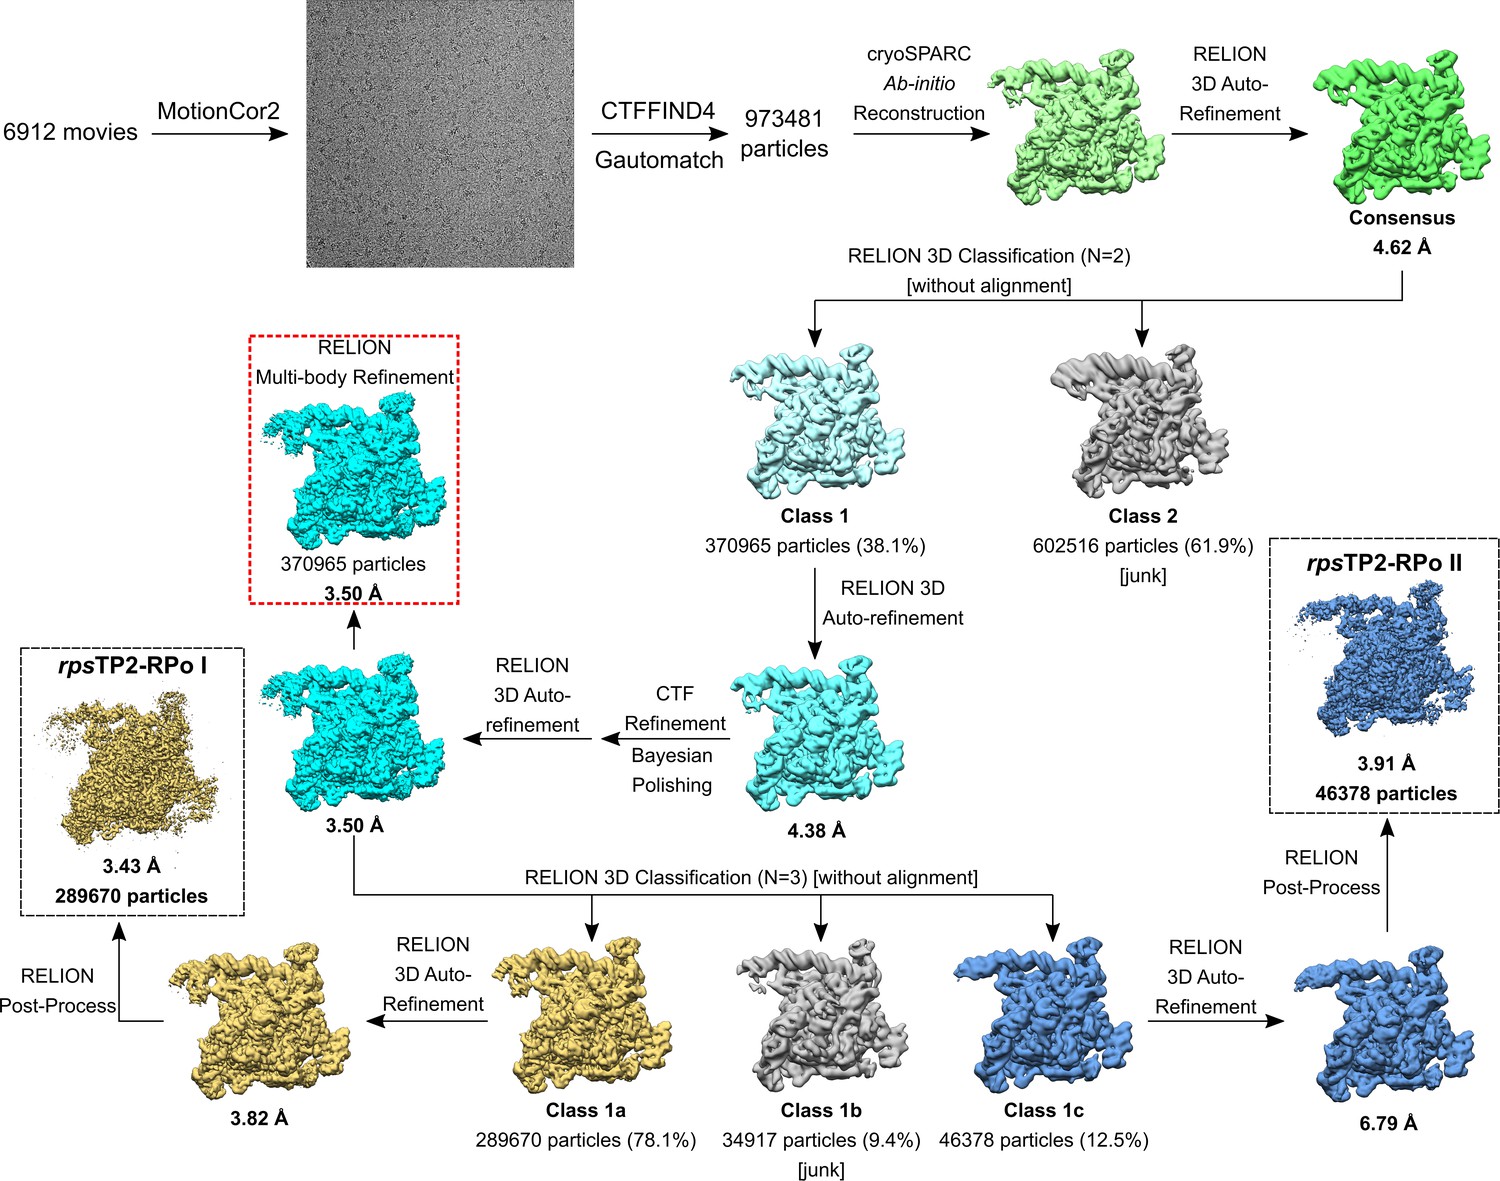
rpsT P2-RPo cryo-EM processing pipeline.
Figure 2—figure supplement 2
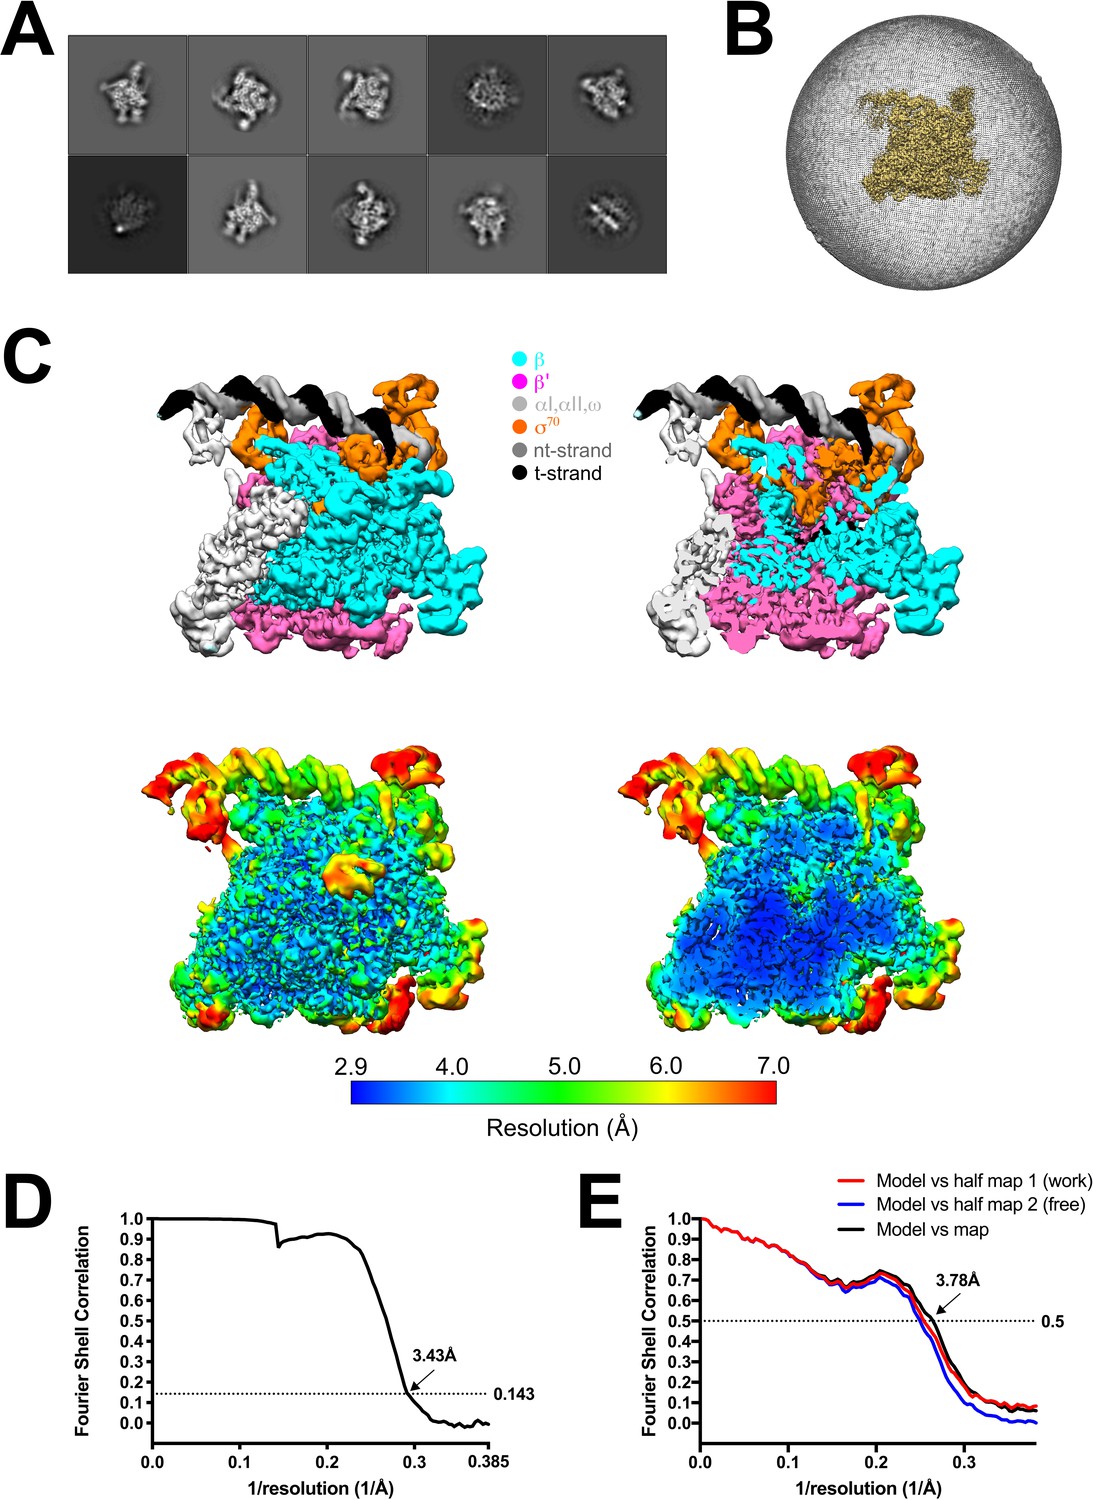
rpsT P2-RPo cryo-EM.
(A) The ten most populated classes from 2D classification. (B) Angular distribution for rpsT P2-RPo particle projections. (C) (top) The 3.4 Å resolution cryo-EM density map of rpsT P2-RPo is colored according to the key. The right view is a cross-section of the left view. (bottom) Same views as (top) but colored by local resolution (Cardone et al., 2013). (D) Gold-standard FSC of rpsT P2-RPo. The gold-standard FSC was calculated by comparing the two independently determined half-maps from RELION. The dotted line represents the 0.143 FSC cutoff, which indicates a nominal resolution of 3.4 Å. (E) FSC calculated between the refined structure and the half map used for refinement (work), the other half map (free), and the full map.
Figure 3 with 1 supplement
Conformational flexibility of β'Si3 in TraR-Eσ70.
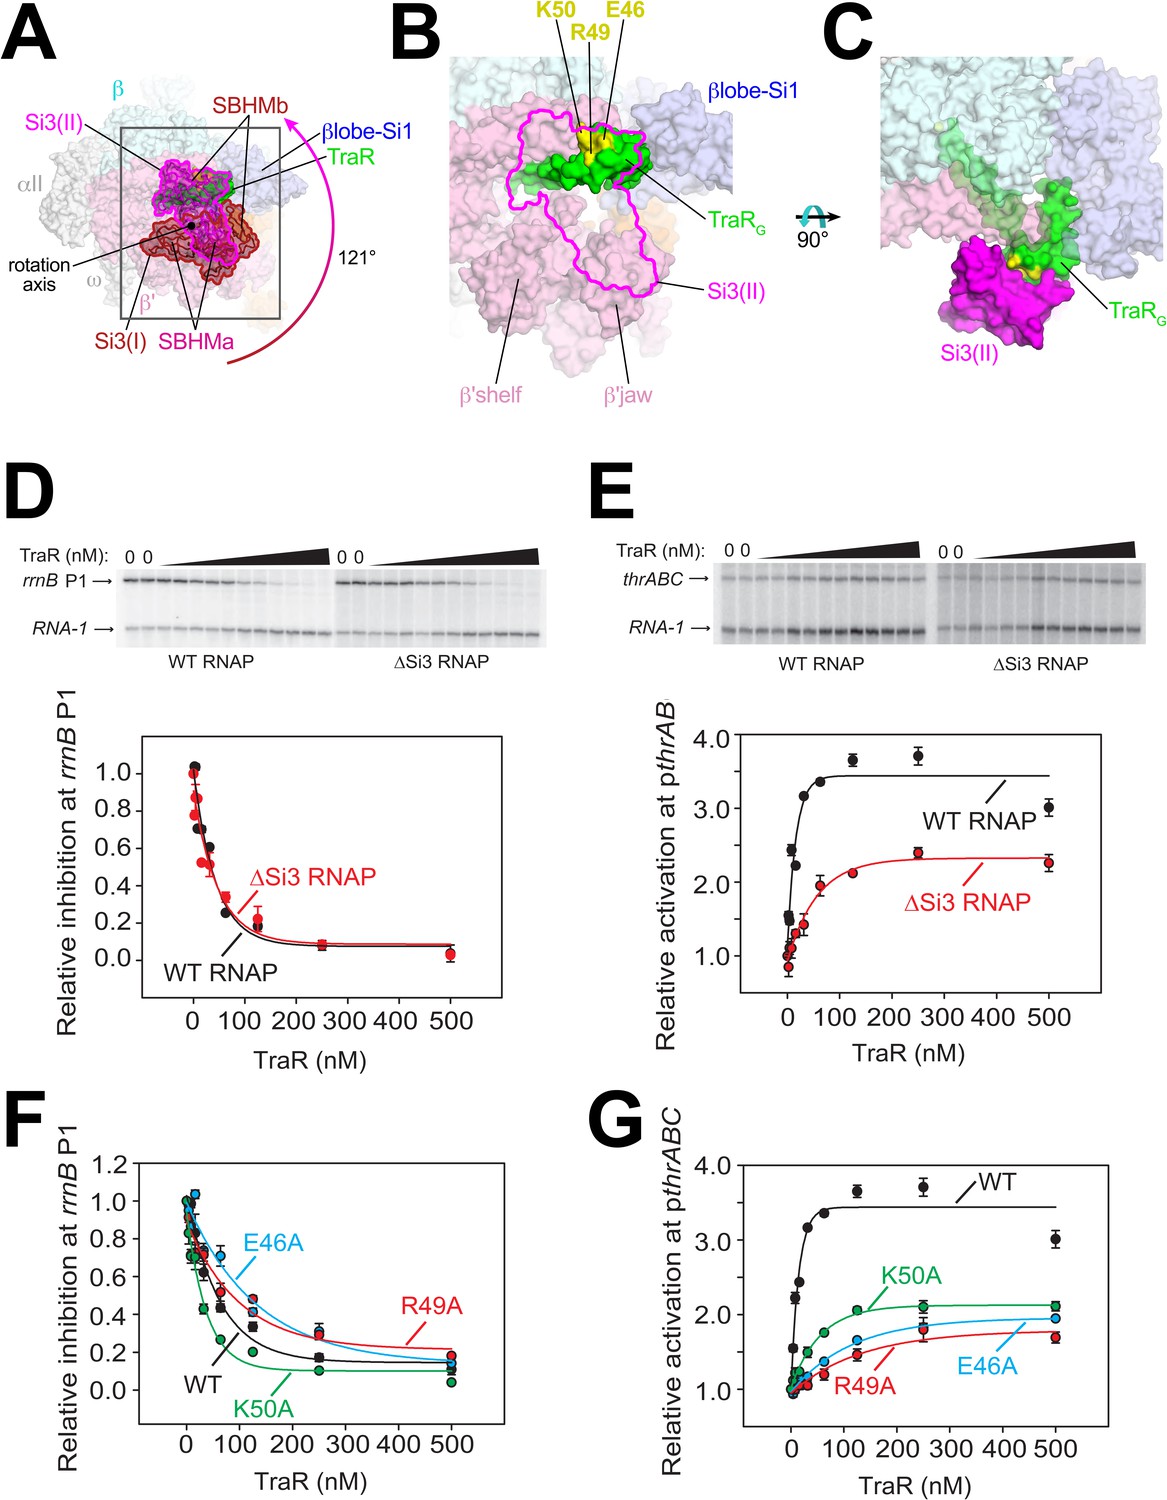
(A) Overall view of TraR-Eσ70 structure with alternative positions of Si3. Si3(I) is shown in brown. A ~ 121° rotation about the rotation axis shown gives rise to the position of Si3(II) shown in magenta. Si3 comprises two SBHM domains (Chlenov et al., 2005; Iyer et al., 2003), denoted SBHMa and SBHMb. The boxed region is magnified in (B). (B) Magnified view of TraR-Eσ70(II) [same view as (A)]. The position of Si3(II) is outlined in magenta but the rest of Si3 is removed, revealing TraR behind. Three residues central to the TraR-Si3(II) interface (TraR-E46, R49, and K50) are colored yellow. (C) Orthogonal view as (B), showing the extensive TraR-Si3(II) interface. (D) – (G) Si3 interaction with TraRG affects activation but not inhibition. Quantifications show averages with range from two independent experiments. (D) (top) Multi round in vitro transcription of rrnB P1 over a range of TraR concentrations (wedge indicates 2 nM - 2 µM) in the presence of WT-RNAP or ∆Si3-RNAP as indicated. Plasmid templates also contained the RNA-1 promoter. (bottom) Quantification of transcripts from experiments like those shown on (top) plotted relative to values in the absence of TraR. The IC50 for inhibition by TraR was ~40 nM for both data sets. (E) (top) Multi round in vitro transcription of thrABC over a range of TraR concentrations (wedge indicates 2 nM - 2 µM) in the presence of 20 nM WT-RNAP or ∆Si3-RNAP as indicated. Plasmid templates also contained the RNA-1 promoter. (bottom) Quantification of transcripts from experiments like those shown on (top) plotted relative to values in the absence of TraR. (F) and (G) Multi round in vitro transcription of rrnB P1 (F) or pthrABC (G) was performed with 20 nM WT-Eσ70 at a range of concentrations of WT or variant TraR (2 nM −2 µM). Transcripts were quantified and plotted relative to values in the absence of any factor (n = 2). For (F) IC50 for inhibition by WT-TraR was ~50 nM, by E46A TraR was ~115 nM, R49A TraR was ~85 nM and by K50A TraR was ~30 nM.
Figure 3—figure supplement 1
RNAP-Si3 interaction with TraRG residues.
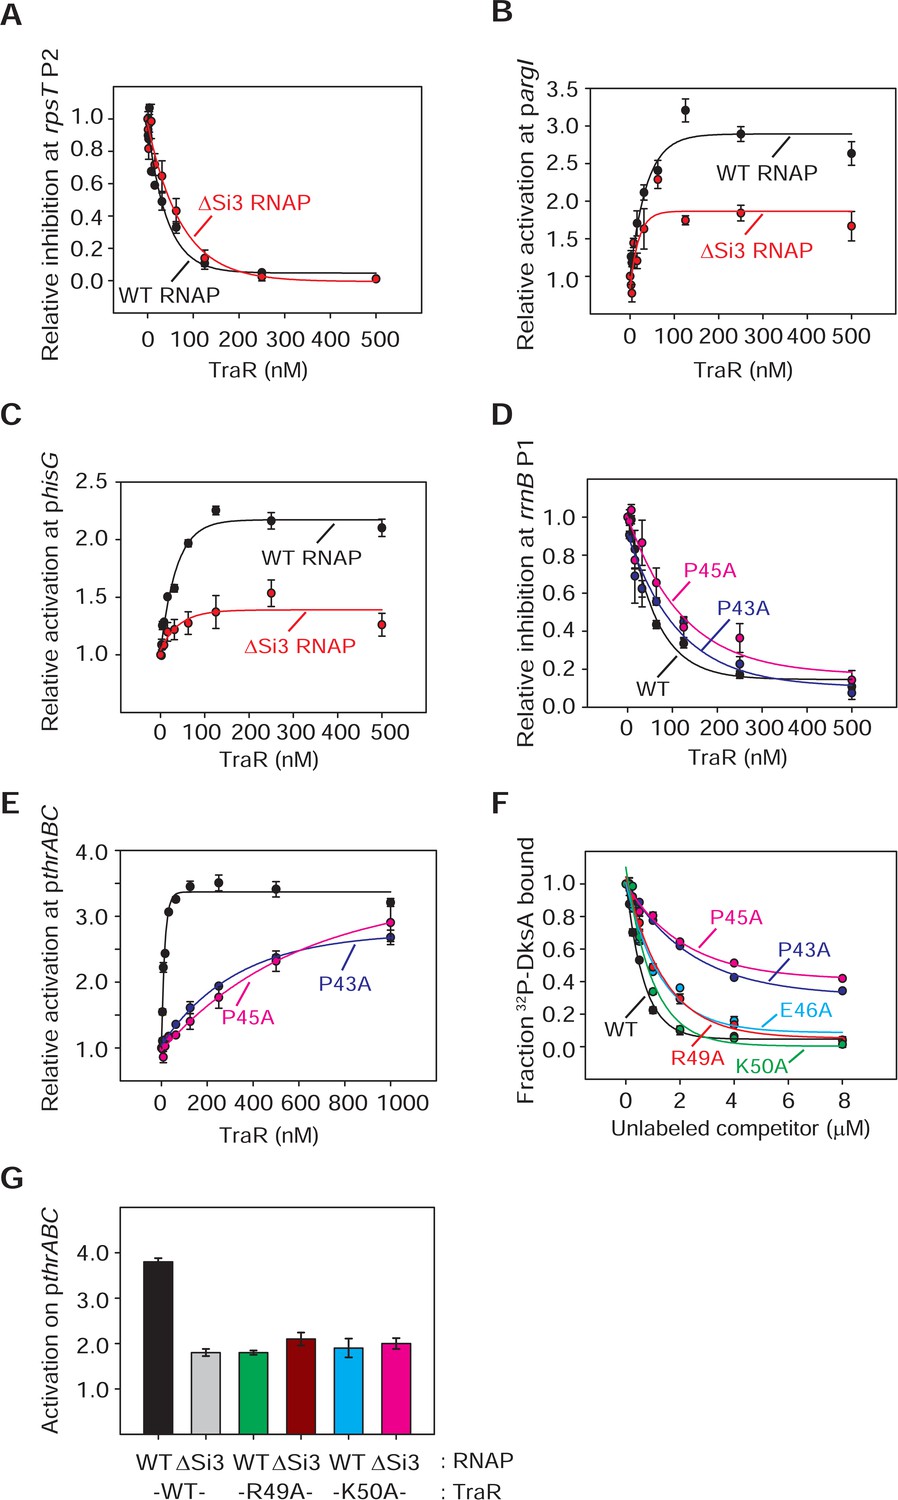
(A) - (G) Quantifications show averages with range from two independent experiments. (A) (B) (C) Multi round in vitro transcription of rpsT P2 (A), pargI (B) or phisG (C) was performed at a range of TraR concentrations (2 nM - 2 µM) in the presence of 20 nM WT- or ∆Si3-RNAP. Transcripts were quantified and plotted relative to values in the absence of TraR. Averages with range from two independent experiments are shown. (A) The IC50 for inhibition by TraR was ~60 nM with WT-RNAP and ~90 nM with ∆Si3-RNAP. (D) (E) Multi round in vitro transcription from rrnB P1 (D) and pthrABC (E) was performed with 20 nM WT-Eσ70 at a range of concentrations of WT- or variant TraR (2 nM - 2 µM). Transcripts were quantified and plotted relative to values in the absence of TraR. Error bars denote the standard deviation of three independent measurements. For (D), the IC50 for inhibition by WT-TraR was ~50 nM, by P43A-TraR was ~80 nM, and by P45A-TraR was ~115 nM. (F) Effect of substitutions in TraRG residues on binding to RNAP was determined by competition with 32P-DksA in an Fe2+-mediated cleavage assay. WT-TraR (~0.6 µM), P43A-TraR (~3 μM), P45A-TraR (~4 μM), E46A-TraR (~1 μM), R49A-TraR (~1 μM) and K50A-TraR (~0.7 μM) reduced cleavage of 1.0 mM 32P-DksA by 50%. Averages with range from two independent experiments are shown. (G) Transcription experiments were carried out with 20 nM WT- or ∆Si3-RNAP with 250 nM WT- or variant TraR as indicated. Values are relative to basal transcription by WT-RNAP without factor (normalized to1.0). Averages with range from two independent experiments are shown.
Figure 4 with 1 supplement
TraR and the βlobe-Si1 domain.
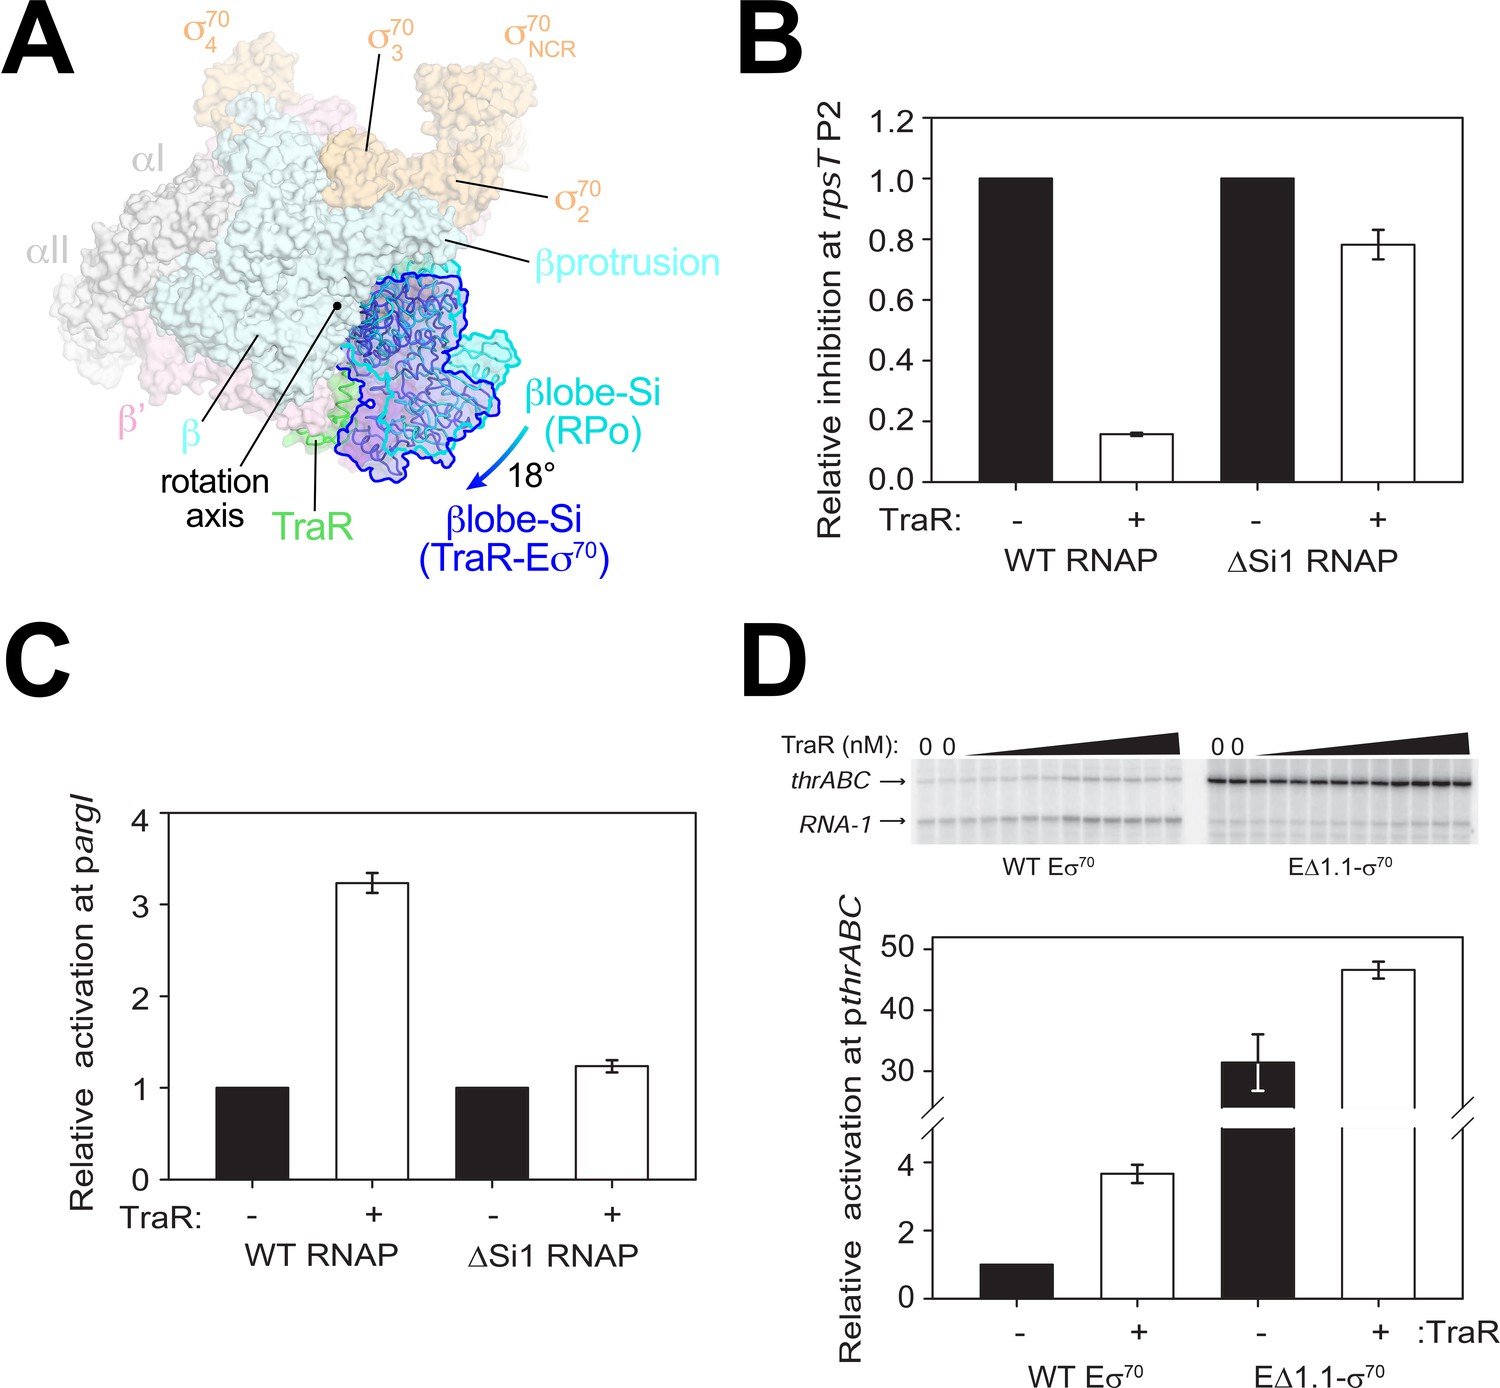
(A) Overall top view of the TraR-Eσ70 structure with the βlobe-Si1 in dark blue. The corresponding position of the βlobe-Si1 in the rpsT P2-RPo structure (Figure 2) is shown in light blue. The βlobe-Si1 of the rpsT P2-RPo structure (light blue) undergoes an ~18° rotation about the rotation axis shown to the βlobe-Si1 position in the TraR-Eσ70 structure (dark blue), generating an extensive TraR-βlobe-Si1 interface. (B) Transcription of inhibited promoter rpsT P2 by 20 nM WT-RNAP or ΔSi1-RNAP with (+) or without (-) 250 nM TraR as indicated. Error bars denote standard deviation of three independent measurements. (C) Transcription of activated promoter pargI by 20 nM WT-RNAP or ΔSi1-RNAP with (+) or without (-) 250 nM TraR as indicated. Error bars denote standard deviation of three independent measurements. (D) (top) Multi-round in vitro transcription was carried out at a range of TraR concentrations (wedge indicates 4 nM - 4 μM) in the presence of 20 nM WT-Eσ70 or EΔ1.1σ70 as indicated. Plasmid template also contained the RNA-1 promoter. (bottom) Transcripts from experiments such as those in (top) were quantified and plotted relative to values in the absence of TraR with WT-Eσ70 or EΔ1.1σ70 with (+) or without (-) 250 nM TraR as indicated. Averages with range from two independent experiments are shown.
Figure 4—figure supplement 1
EΔ1.1σ70 has small defects for inhibition of rrnB P1 by TraR.
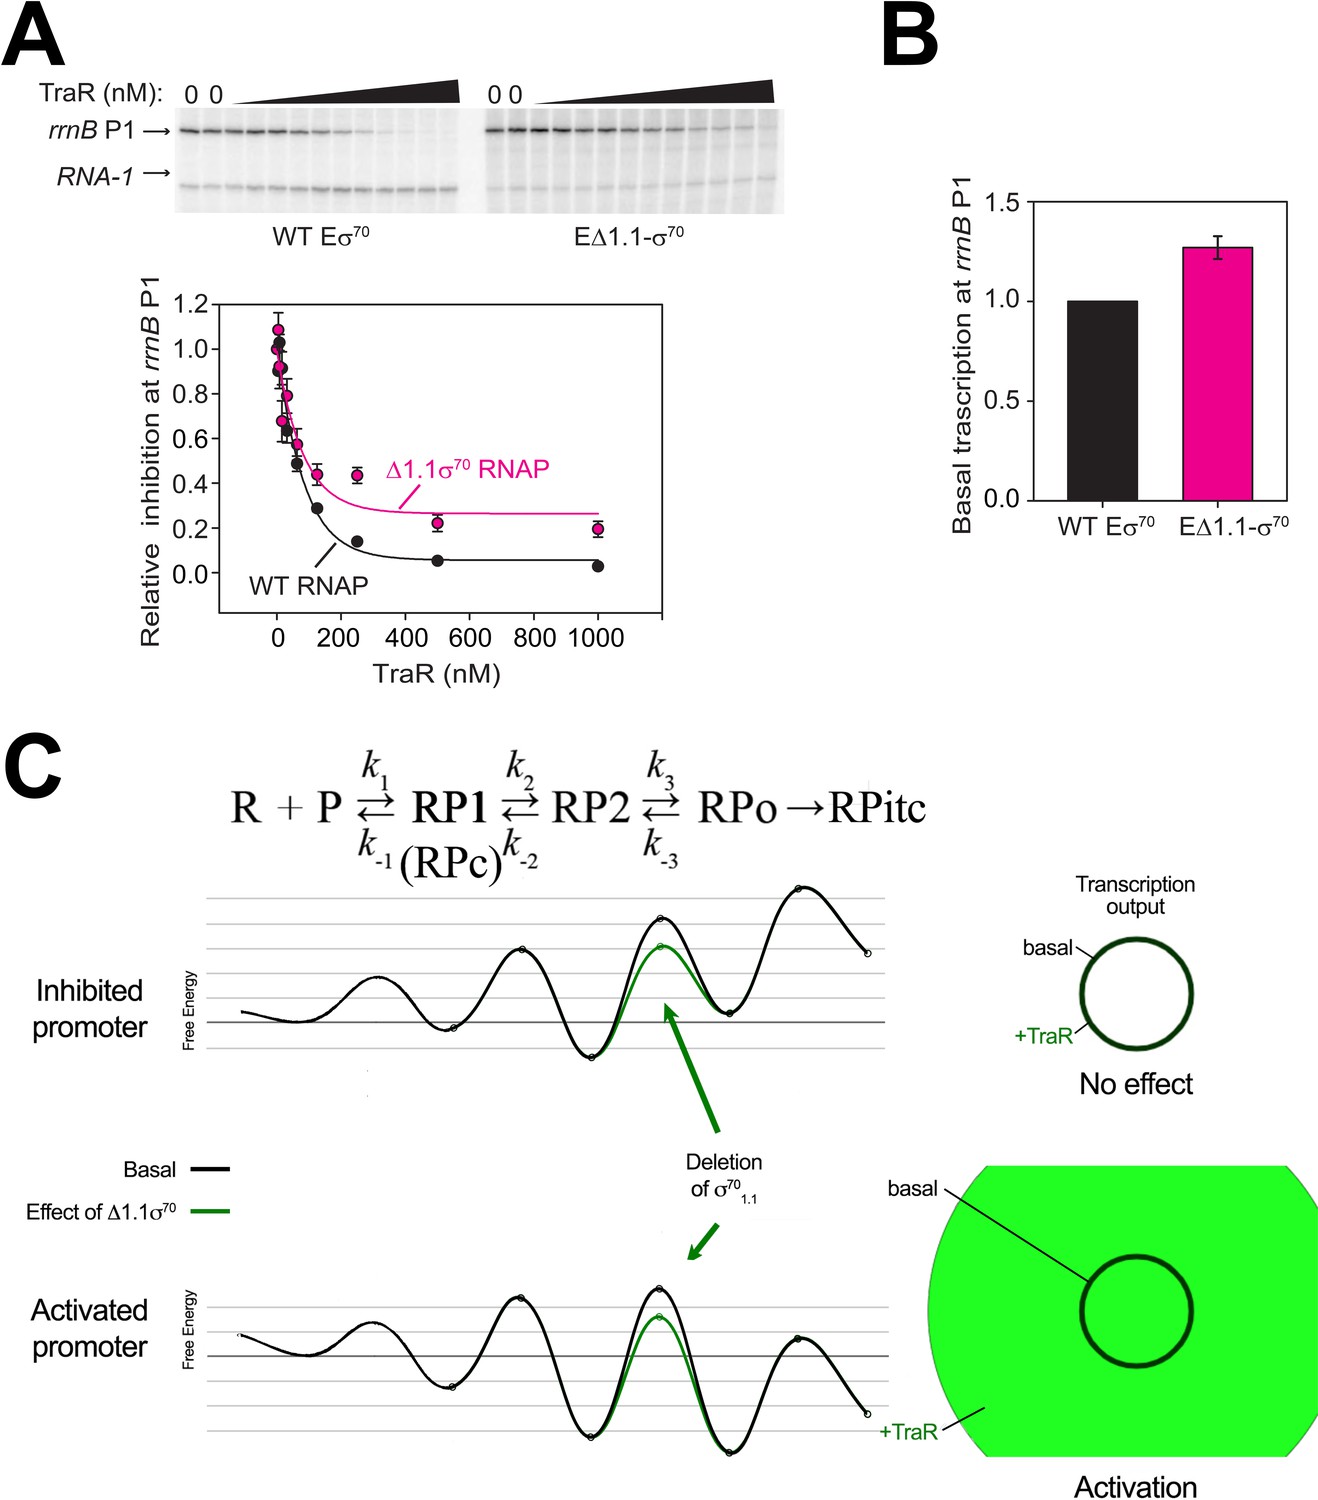
(A) (top) Multi round in vitro transcription at rrnB P1 was carried out at a range of TraR concentrations (wedge indicates 4 nM - 4 µM) in the presence of 20 nM WT-Eσ70 or EΔ1.1σ70 as indicated. Plasmid templates also contained the RNA-1 promoter. (bottom) Transcripts were quantified and plotted relative to values in the absence of TraR. The IC50 for inhibition by TraR was ~50 nM with WT-RNAP and ~90 nM with Δ1.1σ70-RNAP. Averages with range from two independent experiments are shown. (B) Basal level of transcription from rrnB P1 is only slightly affected by Δ1.1σ70. Error bars denote standard deviation of three independent measurements. (C) Shown at the top is a proposed three-step linear kinetic scheme for RPo formation (Hubin et al., 2017a) with an added fourth irreversible step (formation of RPitc) once RNA synthesis begins. The basal (WT-RNAP) free energy diagrams for hypothetical inhibited (top) and activated (bottom) promoters are shown in black (adapted from Galburt, 2018 as described in Materials and methods). The precise values for the input and output of the flux calculator are tabulated in Supplementary file 2. The proposed influence of deleting σ701.1 on the energy diagram (lowering the kinetic barrier for the transition RP2 ⇄ RPo) is shown (green curves). The steady-state transcription output [calculated with the transcription flux calculator (Galburt, 2018) is represented by the circles on the right. The area inside the black circle represents the basal transcription output. Deleting σ701.1 had no effect on transcription output from the inhibited promoter. The green circle (activated promoter) represents the effect of deleting σ701.1 on the transcription output. Strong activation of a positively regulated promoter but little to no effect on a negatively regulated promoter correlates with our experimental results (Figure 4D, Figure 4—figure supplement 1A, B).
Figure 5

TraR rotates the β'shelf and kinks the BH.
(A) Overall view if the TraR-Eσ70(I) structure, shown as a molecular surface. The β'shelf domain is highlighted in hot pink. The β'shelf (which here includes the β'jaw) comprises Eco β' residues 787-931/1135-1150/1216-1317. The boxed region is magnified in (B). (B) Comparison of the rpsT P2-RPo BH-β'shelf (pink) and the TraR-Eσ70 BH-β'shelf (hot pink). Binding of TraR induces an ~4.5° rotation (about the rotation axis shown) of the RPo-β'shelf to the position of the TraR-Eσ70 β'shelf and a kink in the BH (circled region, which is magnified in (C)). (C) Focus on the region of the BH kink, which is centered near β'L788. The kink in the RPo BH is about 25°, while the kink in the TraR-Eσ70 BH is about 29°. (D) View down the axis of the rpsT P2-RPo BH. The t-strand DNA, positioned at the RNAP active site (marked by the Mg2+ ion), closely approaches the BH. (E) View down the axis of the TraR-Eσ70 BH. The BH kink induced by TraR binding sterically clashes with the position of the t-strand DNA (superimposed from the RPo structure).
Figure 6
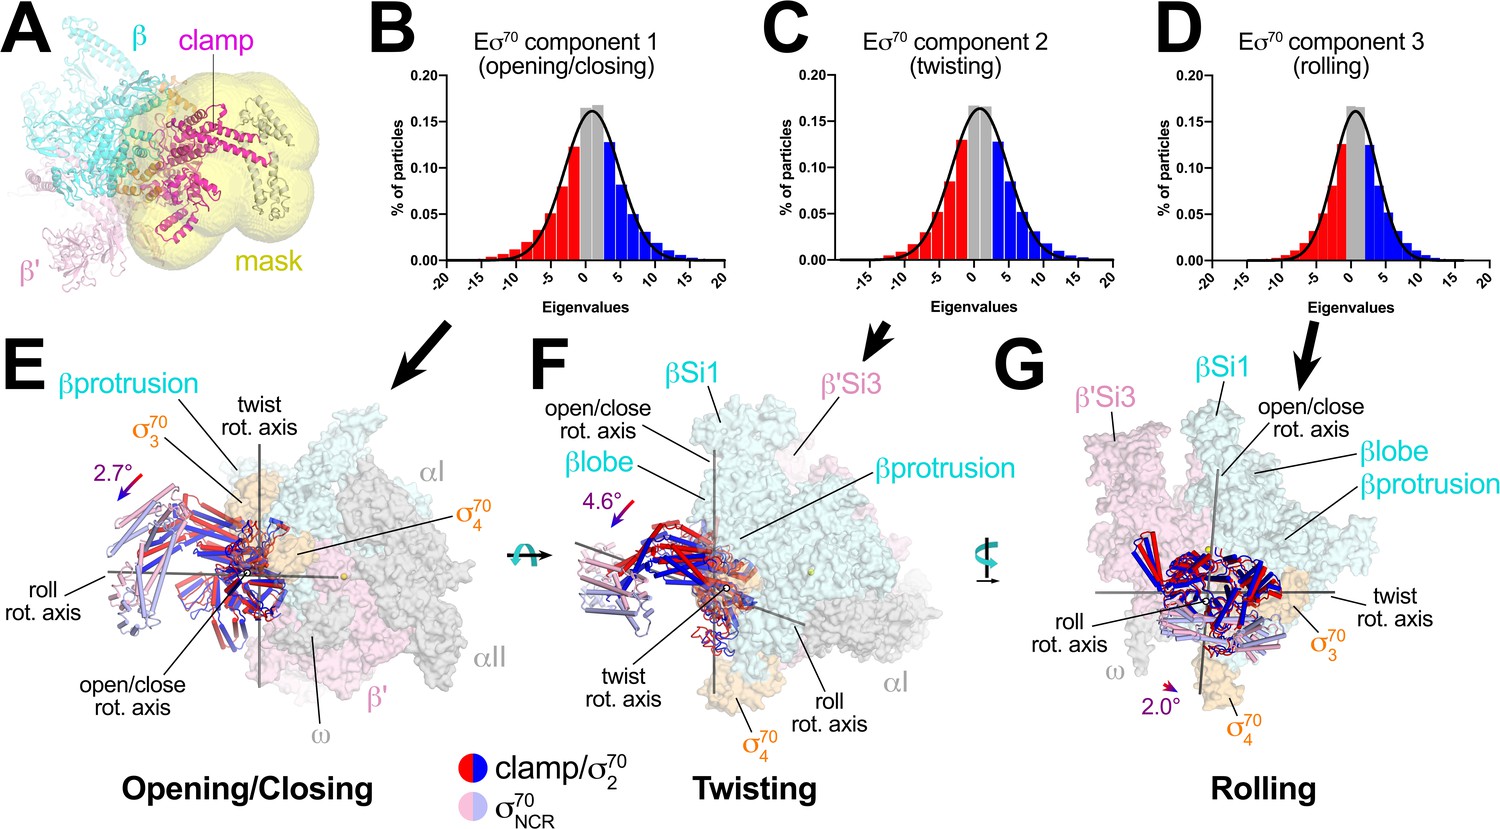
Multi-body analysis of Eσ70 clamp conformational changes.
(A) Model of Eσ70 refined into the consensus cryo-EM map (nominal 4.1 Å resolution). The RNAP clamp is highlighted in magenta. The clamp (which in the context of Eσ70 includes σ702) comprises the following Eco RNAP residues: β 1319–1342; β' 1–342, 1318–1344; σ7092–137, 353–449. The mask used to analyze clamp motions by multi-body refinement (Nakane et al., 2018) is shown as a transparent yellow surface. (B - D) Histograms of Eigenvalue distributions (% of particles assigned each Eigenvalue from the dataset) for each of the three major principle components (Eigenvectors) from the multi-body analysis (Nakane et al., 2018). Each set of particles were divided into three equal-sized bins (red; gray; blue). The solid lines denote Gaussian fits to the histograms. (B) Component 1. (C) Component 2. (D) Component 3. (E - G) Three-dimensional reconstructions were calculated from the red and blue-binned particles for each principal component and models were generated by rigid body refinement. The models were superimposed using α-carbons of the RNAP structural core, revealing the alternate clamp positions shown (red and blue α-carbon ribbons with cylindrical helices). The σ70NCR, attached to the clamp but not included in the clamp motion analyses, is shown in faded colors. For each component, the clamp rotation and the direction of the rotation axis were determined (rotation axes are shown in gray). (E) Component 1 - clamp opening/closing. (F) Component 2 - clamp twisting. (G) Component 3 - clamp rolling.
Figure 7
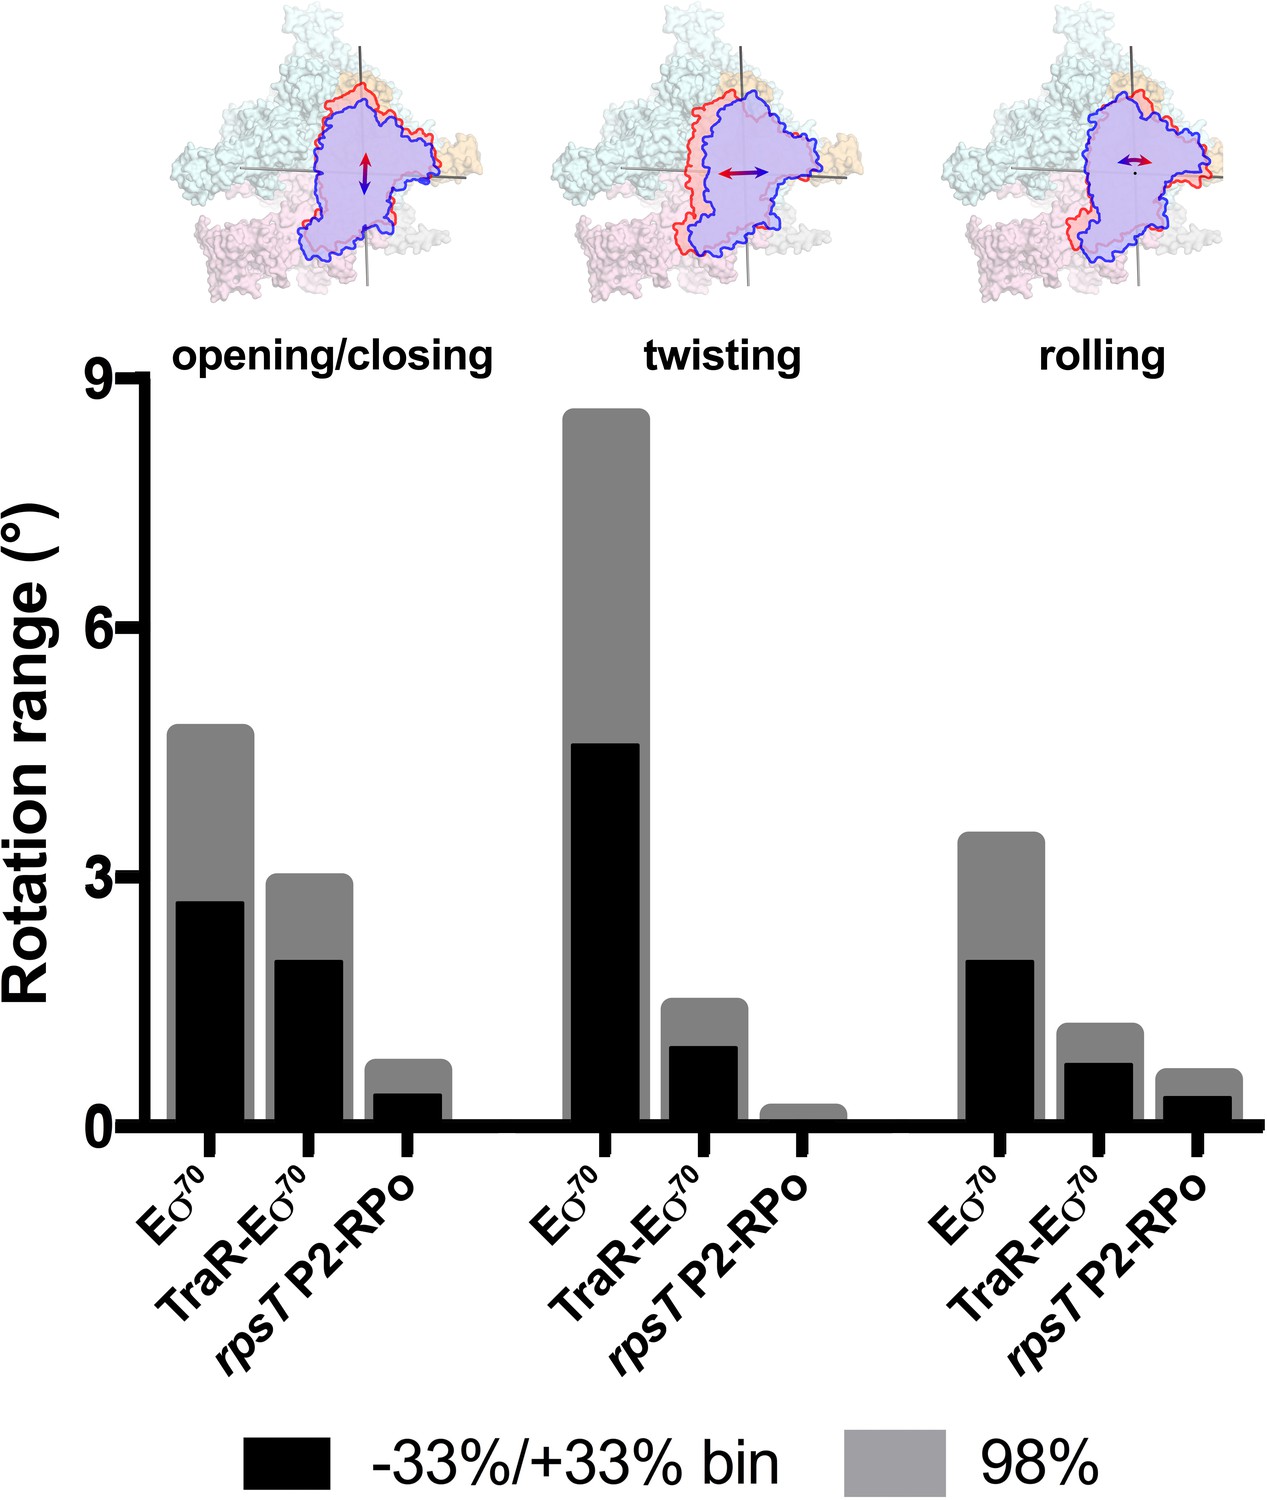
Range of clamp conformations for Eco RNAP complexes.
(top) Eσ70 is shown as a molecular surface (α, ω, light gray; β, light cyan; β', light pink; σ70, light orange) except the clamp/σ702 module is shown schematically as blue or red outlines (the σ70NCR is omitted for clarity) to illustrate the direction and approximate range for the three major components of the clamp conformational changes (left, opening/closing; middle, twisting; left, rolling). (bottom) Histograms denote the range of clamp conformational changes for Eσ70, TraR-Eσ70, and rpsT P2-RPo, as indicated. The black bars denote the rotation range defined by dividing the Eigenvalue histograms into three equal bins and determining the clamp position for the red and blue bins (−33 %/+33% bin; see Figure 6). The gray bars denote the estimated rotation range to include 98% of the particles calculated from the Gaussian fits to the Eigenvalue histograms (1% of the particles excluded from each tail; see Figure 6).
Figure 8
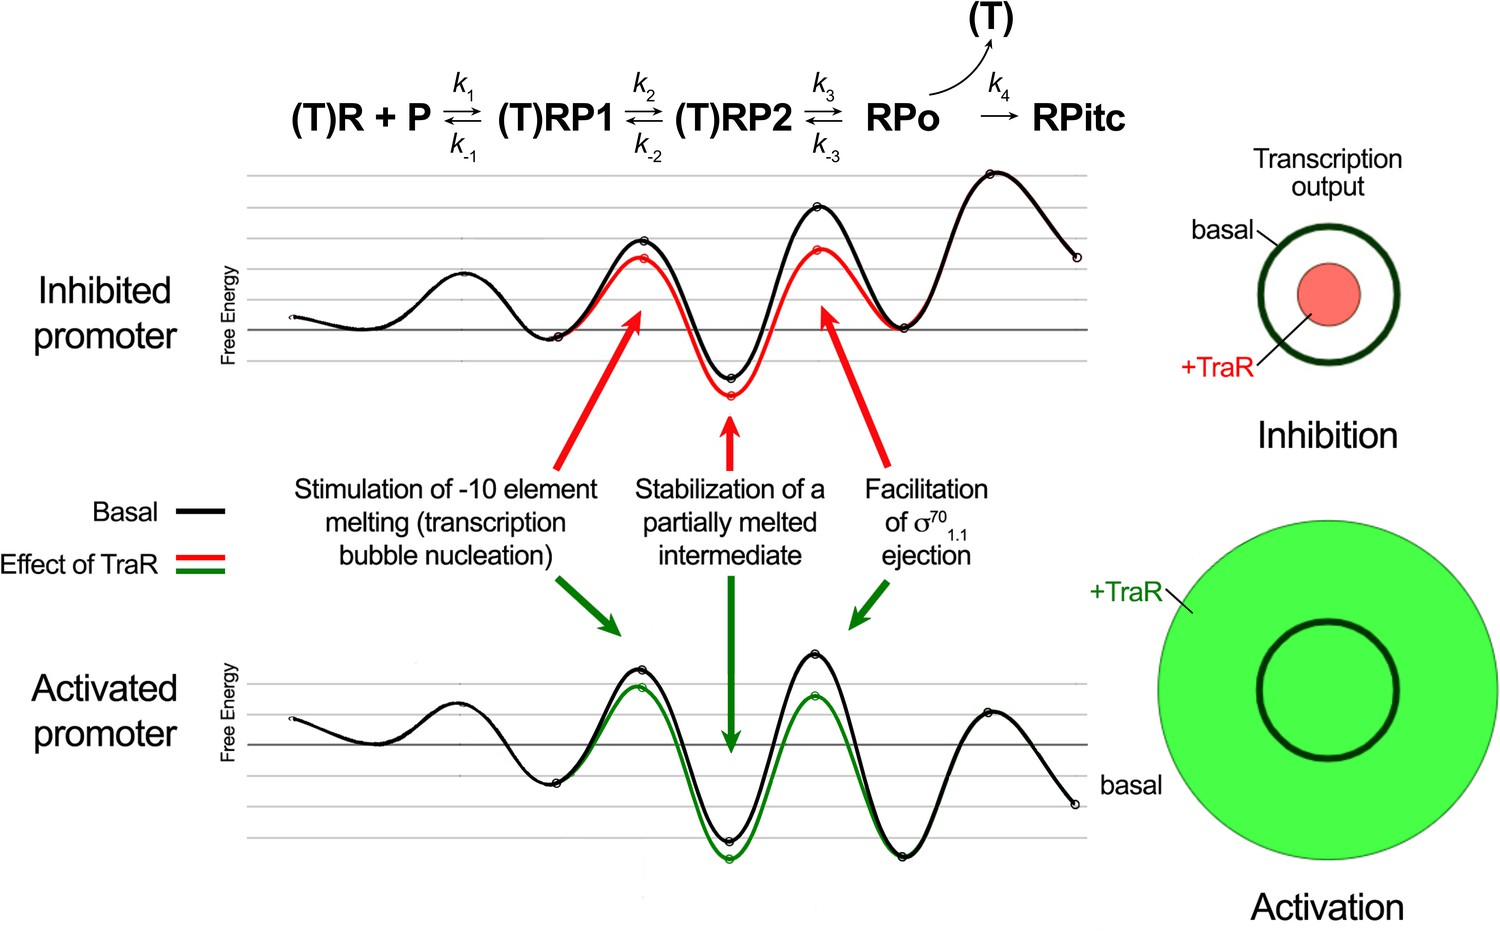
Proposed effects of TraR on the free energy diagram for hypothetical inhibited and activated promoters.
Shown at the top is a proposed three-step linear kinetic scheme for RPo formation (Hubin et al., 2017a) with an added fourth irreversible step (formation of RPitc) once RNA synthesis begins. (T) denotes the presence of TraR, which must dissociate to allow the transition of RPo - > RPitc. The basal (WT-RNAP) free energy diagrams for hypothetical inhibited (top) and activated (bottom) promoters are shown in black (adapted from Galburt, 2018 as described in Materials and methods). The proposed influence of TraR on the energy diagram (lowering the kinetic barrier for the transition RP1 ⇄ RP2; lowering the free energy of RP2 relative to RPo; lowering the kinetic barrier for the transition RP2 ⇄ RPo) is shown (inhibited promoter, red curve; activated promoter, green curve) along with proposed links with the structural effects of TraR binding to RNAP described here. The steady-state transcription output [calculated with the transcription flux calculator (Galburt, 2018) is represented by the circles on the right. The precise values for the inputs and outputs for the flux calculator are tabulated in Supplementary file 2. The area inside the black circle represents the basal transcription output. The red or green circles (inhibited or activated promoters, respectively) represent the effect of TraR on the transcription output.
Videos
Video 1
Video illustrating changes in conformation and conformational dynamics of RNAP induced by TraR binding.
Tables
Key resources table
| Reagent type (species) or resource | Designation | Source or reference | Ident-ifiers | Additional information |
|---|---|---|---|---|
| Strain, strain background (Escherichia coli) | Eco BL21(DE3) | EMD Millipore (Burlington, MA) | ||
| Recombinant DNA reagent | pACYCDuet-1_Ec_rpoZ | PMID: 21416542 | ||
| Recombinant DNA reagent | pEcrpoABC(-XH)Z | PMID: 21416542 | ||
| Recombinant DNA reagent | pET28a | EMD Millipore | ||
| Recombinant DNA reagent | pET28a-His10-SUMO rpoD | PMID: 28988932 | ||
| Recombinant DNA reagent | pET28a-His10-SUMO traR (pRLG15142) | This paper | Encodes Eco TraR with N-terminal His10-SUMO tag (Darst lab) | |
| Recombinant DNA reagent | pRLG770 | PMID: 2209559 | In vitro transcription vector, AmpR | |
| Recombinant DNA reagent | pRLG770-rrnB P1 (pRLG13065) | PMID: 27237053 | rrnB P1 with −88 to +50 endpoints | |
| Recombinant DNA reagent | pRLG770-argI (pRLG13098) | PMID: 11162084 | pargI with −45 to +32 endpoints | |
| Recombinant DNA reagent | pRLG770-hisG (pRLG13099) | PMID: 15899978 | phisG with −60 to +1 endpoints | |
| Recombinant DNA reagent | pRLG770-rpsT P2 (pRLG14658) | PMID: 21402902 | rpsT P2 with −89 to +50 endpoints | |
| Recombinant DNA reagent | pRLG770-thrABC (pRLG15276) | PMID: 11162084 | pthrABC with −72 to +16 endpoints | |
| Recombinant DNA reagent | pT7 αββ'(Δ943–1130) (pIA331) | PMID: 12511572 | ∆Si3 RNAP | |
| Recombinant DNA reagent | pIA900 rpoB Δ225–343ΩGG (pRLG12586) | PMID: 28652326 | ∆Si1 RNAP | |
| Recombinant DNA reagent | pET28a-His10-SUMO P43A traR (pRLG14844) | This paper | Encodes Eco TraR[P43A] with N-terminal His10-SUMO tag (Gourse lab) | |
| Recombinant DNA reagent | pET28a- His10- SUMO P45A traR (pRLG14846) | This paper | Encodes Eco TraR[P45A] with N-terminal His10-SUMO tag (Gourse lab) | |
| Recombinant DNA reagent | pET28a-His10- SUMO E46A traR (pRLG14847) | This paper | Encodes Eco TraR[E46A] with N-terminal His10-SUMO tag (Gourse lab) | |
| Recombinant DNA reagent | pET28a-His10-SUMO R49A traR (pRLG15278) | This paper | Encodes Eco TraR[R49A] with N-terminal His10-SUMO tag (Gourse lab) | |
| Recombinant DNA reagent | pET28a-His10-SUMO K50A traR (pRLG15279) | This paper | Encodes Eco TraR[K50A] with N-terminal His10-SUMO tag (Gourse lab) | |
| Sequence-based reagent | P43A traR | IDT, this paper | 5’ GAAGCATGCGGAAATGCTATTCCGGAAGCC 3’ (Gourse lab) | |
| Sequence-based reagent | P45A traR | IDT, this paper | 5’ GGAAATCCTATTGCGGAAGCCCGGCGG 3’ (Gourse lab) | |
| Sequence-based reagent | E46A traR | IDT, this paper | 5’ GGAAATCCTATTCCGGCAGCCCGGCGGAAAATA 3’ (Gourse lab) | |
| Sequence-based reagent | R49A traR | IDT, this paper | 5’ ATTCCGGAAGCCCGGGCGAAAATATTTCCCGGT 3’ (Gourse lab) | |
| Sequence-based reagent | K50A traR | IDT, this paper | 5’ ATTCCGGAAGCCCGGCGGGCAATATTTCCCGGT 3’ (Gourse lab) | |
| Sequence-based reagent | SumoF | IDT, this paper | 5’ GGGGAATTGTGAGCGGATAACAATTCC 3’ (Gourse lab) | |
| Sequence-based reagent | SumoR | IDT, this paper | 5’ GTCCCATTCGCCAATCCGGATATAG 3’ (Gourse lab) | |
| Sequence-based reagent | TraR_sumo_vector_FOR | IDT, this paper | 5’- AAACATTATGCATAACAAAGCCCGAAAGGAAGCTGAG −3’ (Gourse lab) | |
| Sequence-based reagent | pETsumo_traR_vector_REV | IDT, this paper | 5’- CGGCTTCATCACTTCCACCAATCTGTTCTCTGTGAGCC −3’ (Gourse lab) | |
| Sequence-based reagent | TraR_sumo_fragment_REV | IDT, this paper | 5’- TCGGGCTTTGTTATGCATAATGTTTTCTCTGTCTTTCCTGATACG −3’ (Gourse lab) | |
| Sequence-based reagent | TraR_sumo_fragment_FOR | IDT, this paper | 5’- CAGATTGGTGGAAGTGATGAAGCCGATGAAGCATATTCAG −3’ (Gourse lab) | |
| Sequence-based reagent | rrnBP1(−63 to +20) top | IDT, this paper | 5’- GGTCAGAAAATTATTTTAAATTTCCTCTTGTCA GGCCGGAATAACTCCCTATAATGCGCCACCACTGACACGGAACAACGGCG −3’ (Darst lab) | |
| Sequence-based reagent | rrnBP1(−63 to +20) bot | IDT, this paper | 5’- CGCCGTTGTTCCGTGTCAGTGGTGGCGCATTAT AGGGAGTTATTCCGGCCTGACAAGAGGAAATTTAAAATAATTTTCTGACC −3’ (Darst lab) | |
| Sequence-based reagent | rpsTP2(−60 to +25) top | IDT, this paper | 5’- GGCGGCGCTTATTTGCACAAATCCATTGACAAA AGAAGGCTAAAAGGGCATATTCCTCGGCCTTTG AATTGTCCATATAGAACGC −3’ (Darst lab) | |
| Sequence-based reagent | rpsTP2 (−60 to +25) bot | IDT, this paper | 5’- GCGTTCTATATGGACAATTCAAAGGCCGAGGAA TAT GCCCTTTTAGCCTTCTTTTGTCAATGGATTTGT GCAAATAAGCGCCGCC −3’ (Darst lab) | |
| Chemical compound, drug | 3-[(3-Cholamidopropyl)dimethylammonio]−2-Hydroxy-1-Propanesulfonate (CHAPSO) | Anatrace | Cat# C317 | |
| Software, algorithm | Bayesian Polishing | PMID: 30412051 | ||
| Software, algorithm | Bsoft | PMID: 23954653 | ||
| Software, algorithm | Coot | PMID: 15572765 | ||
| Software, algorithm | cryoSPARC | PMID: 28165473 | ||
| Software, algorithm | CTFFIND4 | PMID: 26278980 | ||
| Software, algorithm | EMAN2 | PMID: 16859925 | ||
| Software, algorithm | Gautomatch | http://www.mrc-lmb.cam.ac.uk/kzhang/Gautomatch | ||
| Software, algorithm | Gctf | PMID: 26592709 | ||
| Software, algorithm | Molprobity | PMID: 20057044 | ||
| Software, algorithm | MotionCor2 | PMID: 28250466 | ||
| Software, algorithm | Multi-body refinement | PMID: 29856314 | ||
| Software, algorithm | PHENIX | PMID: 20124702 | ||
| Software, algorithm | RELION | PMID: 23000701 | ||
| Software, algorithm | SerialEM | PMID: 16182563 | ||
| Software, algorithm | UCSF Chimera | PMID: 15264254 | ||
| Software, algorithm | Unblur | PMID: 26023829 | ||
| Other | C-flat CF-1.2/1.3 400 mesh gold grids | Electron Microscopy Sciences | Cat# CF413-100-Au |
Additional files
-
Supplementary file 1
Cryo-EM data acquisition and refinement parameters (Chen et al., 2010).
- https://cdn.elifesciences.org/articles/49375/elife-49375-supp1-v2.docx
-
Supplementary file 2
Details of flux calculator (Galburt, 2018) calculations.
- https://cdn.elifesciences.org/articles/49375/elife-49375-supp2-v2.docx
-
Supplementary file 3
RNAP conformational changes.
- https://cdn.elifesciences.org/articles/49375/elife-49375-supp3-v2.docx
-
Supplementary file 4
Plasmids.
- https://cdn.elifesciences.org/articles/49375/elife-49375-supp4-v2.docx
-
Supplementary file 5
Oligonucleotides and Geneblock sequences.
- https://cdn.elifesciences.org/articles/49375/elife-49375-supp5-v2.docx
-
Transparent reporting form
- https://cdn.elifesciences.org/articles/49375/elife-49375-transrepform-v2.pdf
Download links
A two-part list of links to download the article, or parts of the article, in various formats.
Downloads (link to download the article as PDF)
Open citations (links to open the citations from this article in various online reference manager services)
Cite this article (links to download the citations from this article in formats compatible with various reference manager tools)
E. coli TraR allosterically regulates transcription initiation by altering RNA polymerase conformation
eLife 8:e49375.
https://doi.org/10.7554/eLife.49375


