Risk factors for asthma among schoolchildren who participated in a case-control study in urban Uganda
- Medical Research Council/Uganda Virus Research Institute and London School of Hygiene and Tropical Medicine Uganda Research Unit, Uganda
- London School of Hygiene and Tropical Medicine, United Kingdom
Figures
Figure 1
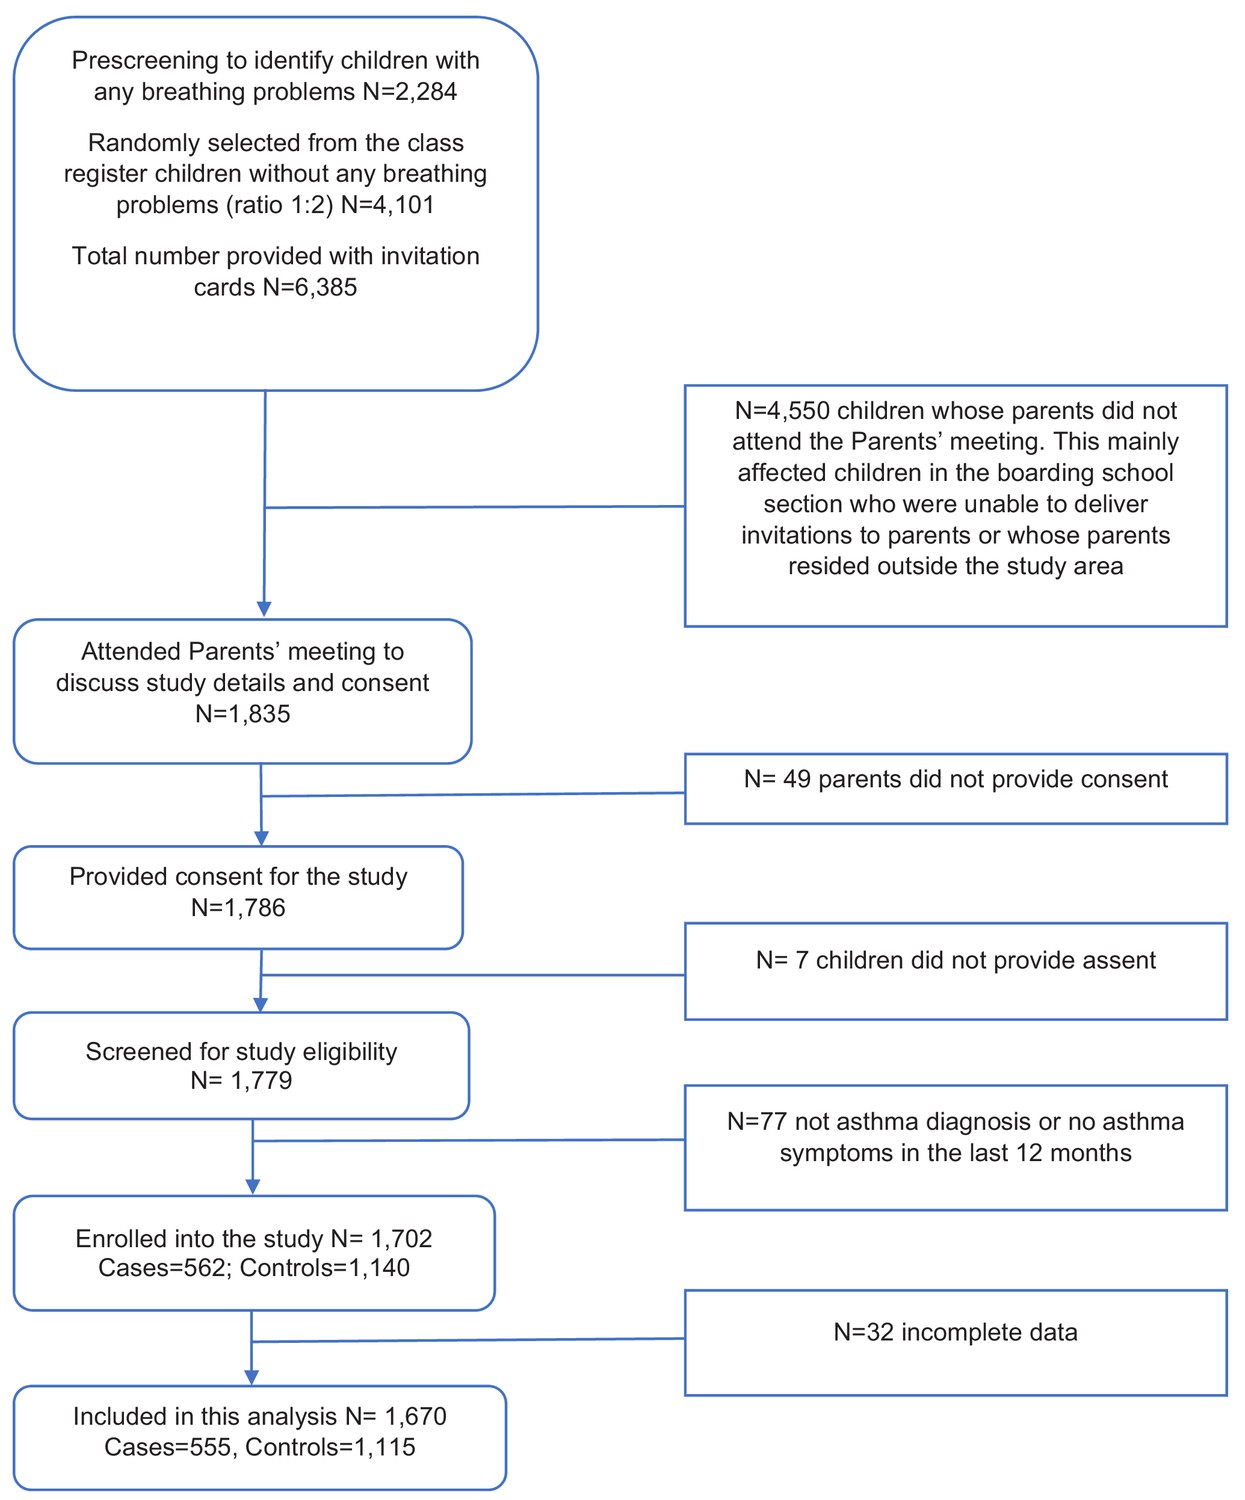
Participant flow diagram for an asthma case-control study, conducted among 1670 schoolchildren aged 5–17 years, between 2015 and 2017 in Uganda.
Tables
Table 1
Early life risk factors for asthma among schoolchildren enrolled in a case-control study between 2015–17 (N = 1,670)
| Risk factors | Asthma cases N = 555 | Non-asthma controls N = 1115 | Adj. OR (95% CI)* |
|---|---|---|---|
| Age, years, Mean (Range) | 11.42 (3.26) | 10.98 (3.05) | 1.07 (1.03–1.11) |
| Sex: Girls (933) | 294 (53.0) | 639 (57.3) | 0.79 (0.63–0.99) |
| Mother’s history of asthma [m = 164] | |||
| Yes (102) | 61 (12.0) | 41 (4.1) | 3.05 (1.97–4.71) |
| Father’s history of asthma [m = 175] | |||
| Yes (85) | 65 (12.8) | 20 (2.0) | 6.64 (3.90–11.30) |
| Fathers’ highest education level | |||
| None/Primary (437) | 99 (17.8) | 338 (30.3) | 1 |
| Secondary (594) | 193 (34.8) | 401 (36.0) | 1.61 (1.20–2.16) |
| Tertiary (639) | 263 (47.4) | 376 (33.7) | 2.32 (1.71–3.16)† |
| Mothers’ highest education attained [m = 4] | |||
| None/Primary (577) | 158 (28.6) | 419 (37.6) | 1 |
| Secondary (601) | 185 (33.4) | 416 (37.4) | 1.11 (0.85–1.44) |
| Tertiary (488) | 210 (38.0) | 278 (25.0) | 1.85 (1.38–2.48)† |
| Child’s residence at birth | |||
| Rural (352) | 74 (13.3) | 278 (24.9) | 1 |
| Town (1,169) | 412 (74.2) | 757 (67.9) | 2.16 (1.60–2.92) |
| City (149) | 69 (12.5) | 80 (7.2) | 2.79 (1.79–4.35)† |
| Child’s residence for most of 0–5 years | |||
| Rural (337) | 72 (13.0) | 265 (23.8) | 1 |
| Town (1,247) | 434 (78.2) | 813 (72.9) | 1.96 (1.44–2.66) |
| City (86) | 49 (8.8) | 37 (3.3) | 3.74 (2.19–6.39)† |
| Maternal regular contact with farm animals during pregnancy [m = 252] | |||
| Yes (500) | 152 (30.2) | 348 (38.0) | 0.82 (0.64–1.06) |
| Maternal cigarette smoking during pregnancy [m = 302] | |||
| Yes (36) | 13 (2.7) | 23 (2.6) | 1.07 (0.51–2.22) |
| Breast feeding duration [m = 402] | |||
| <1 year (328) | 114 (25.3) | 214 (26.2) | 1 |
| >1 year (940) | 337 (74.7) | 603 (73.8) | 1.12 (0.85–1.49) |
| Allergic rhinitis ever | |||
| Yes (862) | 429 (77.3) | 433 (38.8) | 5.53 (4.31–7.09) |
| Allergic conjunctivitis ever | |||
| Yes (766) | 361 (65.0) | 405 (36.3) | 3.12 (2.50–3.90) |
| Eczema ever | |||
| Yes (264) | 126 (22.7) | 138 (12.4) | 2.08 (1.56–2.77) |
| Urticarial rash ever | |||
| Yes (569) | 222 (40.0) | 347 (31.1) | 1.42 (1.13–1.79) |
| Presence of a BCG scar on child’s arm at enrolment [m = 83] | |||
| Yes (1,315) | 413 (78.4) | 902 (85.1) | 0.67 (0.51–0.89) |
-
Adj. OR = adjusted odds ratio; CI = confidence interval; N = number; m = missing; number (%) in 2nd and 3rd column unless indicated otherwise.
*adjusted for child’s age, sex, residence at birth and father’s education level.
-
†Test for trend p-value<0.0001. For parental history of allergy, 6.6% mothers and 3.4% fathers responded by telephone.
Table 2
Current risk factors and features of schoolchildren enrolled in an asthma case-control study between 2015–17 (N = 1,670).
| Current features | Asthma cases N = 555 | Non-asthma controls N = 1115 | Adj. OR (95% CI)* |
|---|---|---|---|
| Frequency of ‘Trucks’ passing on street near child’s home | |||
| Rarely (931) | 264 (47.6) | 667 (59.8) | 1 |
| Frequently (618) | 232 (41.8) | 386 (34.6) | 1.60 (1.27–2.01) |
| Almost all the time (121) | 59 (10.6) | 62 (5.6) | 2.28 (1.52–3.43)† |
| Cooking fuel most frequently used indoor | |||
| No indoor cooking (390) | 120 (21.6) | 270 (24.2) | 1 |
| Charcoal stove (890) | 262 (47.2) | 628 (56.3) | 1.04 (0.79–1.37) |
| Gas/Electricity (390) | 173 (31.2) | 217 (19.5) | 1.58 (1.16–2.17) |
| Child’s reported regular physical activity levels as recommended by WHO [m = 1] | |||
| Yes (999) | 300 (54.0) | 699 (62.7) | 0.71 (0.56–0.90) |
| Current exposure to cigarette smoke by a household member§ | |||
| Yes (187) | 68 (12.2) | 119 (10.7) | 1.26 (0.90–1.76) |
| Use of de-worming medication in last 12 months [m = 1] | |||
| None (570) | 151 (27.2) | 419 (37.6) | 1 |
| Once (724) | 231 (41.6) | 493 (44.3) | 1.37 (1.06–1.77) |
| >Twice (375) | 173 (31.2) | 202 (18.1) | 2.18 (1.62–2.93)† |
| Used albendazole in last 12 months [m = 18] | |||
| Yes (892) | 352 (63.9) | 540 (49.0) | 1.76 (1.40–2.22) |
| Used praziquantel in last 12 months [m = 55] | |||
| Yes (393) | 113 (21.0) | 280 (26.0) | 0.84 (0.63–1.11) |
| Infection with any helminths at enrolment‡ [m = 127] | |||
| Yes (206) | 53 (10.3) | 153 (14.9) | 0.75 (0.53–1.07) |
| Allergic rhinitis in last 12 months [m = 1] | |||
| Yes (215) | 119 (21.4) | 96 (8.6) | 2.91 (2.13–3.97) |
| Allergic conjunctivitis in last 12 months | |||
| Yes (177) | 86 (15.5) | 91 (8.2) | 2.10 (1.51–2.92) |
| Eczema in last 12 months | |||
| Yes (60) | 41 (7.4) | 19 (1.7) | 4.52 (2.54–8.06) |
| Urticarial rash in last 12 months | |||
| Yes (36) | 18 (3.2) | 18 (1.6) | 1.92 (0.96–3.84) |
-
Adj. OR = adjusted odds ratio; CI = confidence interval; N = number; m = missing; WHO = World Health Organisation. Number (%) in 2nd and 3rd column. *adjusted for child’s age, sex, residence at birth and father’s education level. †Test for trend p-value<0.0001. ‡Helminths infections included mainly Schistosoma mansoni, Trichuris trichuria, Hookworm, and Ascaris lumbricoides; this variable was additionally adjusted for reported worm treatment in the last 12 months. §This included the adolescents’ own smoking history.
Table 3
Atopy among schoolchildren enrolled in an asthma case-control between 2015–17 (N = 1,635).
| Atopy characteristics | Asthma cases N = 546 | Non-asthma controls N = 1089 | Adj. OR (95% CI)‡ |
|---|---|---|---|
| Any positive skin prick test to any of 7 allergens | |||
| Yes (653) | 302 (55.3) | 351 (32.2) | 2.40 (1.92–3.00) |
| Blomia tropicalis (dust mite) SPT | |||
| Positive (478) | 241 (44.1) | 237 (21.8) | 2.51 (1.98–3.19) |
| Dermatophagoides mix (dust mite) SPT | |||
| Positive (535) | 262 (48.0) | 273 (25.1) | 2.46 (1.95–3.10) |
| German cockroach SPT | |||
| Positive (354) | 150 (27.5) | 204 (18.7) | 1.59 (1.23–2.06) |
| Peanut SPT [m = 4] | |||
| Positive (57) | 27 (5.0) | 30 (2.8) | 1.73 (0.99–3.05) |
| Cat SPT | |||
| Positive (22) | 22 (4.0) | 23 (2.1) | 1.94 (1.02–3.69) |
| Pollen mix (weeds) SPT [m = 2] | |||
| Positive (43) | 22 (4.0) | 21 (1.9) | 2.14 (1.11–4.11) |
| Mould mix SPT | |||
| Positive (19) | 8 (1.5) | 11 (1.0) | 1.40 (0.52–3.76) |
| Fractional exhaled nitric oxide (FENO) [m = 42] | |||
| Elevated (>35 ppb) (378) | 199 (36.7) | 179 (17.0) | 2.57 (2.01–3.29) |
| Any positive allergen-specific IgE¥ (of 3 allergens, N = 392) | |||
| Atopic level (249) | 143 (72.6) | 106 (54.4) | 2.45 (1.53–3.91) |
| Dermatophagoides-IgE | |||
| Atopic level (186) | 116 (58.6) | 70 (35.9) | 2.32 (1.49–3.63) |
| Cockroach IgE | |||
| Atopic level (198) | 110 (55.8) | 88 (45.1) | 1.69 (1.08–2.63) |
| Peanut IgE | |||
| Atopic level (63) | 39 (19.7) | 24 (12.3) | 1.92 (1.05–3.50) |
| Total IgE: Mean (SD) kU/L | 930.25 (1246.60) | 640.88 (1146.61) | 1.00024 (1.00005–1.00043) |
-
N = number; Adj. OR = adjusted odds ratio; CI = confidence interval; SD = standard deviation; m = missing; ppb = parts per billion; number (%) shown in 2nd and 3rd column unless indicated otherwise.
*adjusted for child’s age, sex, residence at birth and father’s education level. Skin prick test using whole allergen extracts.
-
¥allergen-specific IgE levels were obtained using ImmunoCAP, on a random sample of 200 cases and 200 controls; standard cut-off for allergic sensitisation (>0.35 allergen-specific kilo units per litre (kUA/L)).
Table 4
Residence in early life as a risk factor for asthma among schoolchildren enrolled in a case-control study between 2015–17 (N = 1,670)
| Child’s residence in early life | Asthma cases N = 555 | Non-asthma controls N = 1115 | Adj. OR (95% CI)* |
|---|---|---|---|
| Born and spent first 5 years in rural (265) | 50 (9.0) | 215 (19.3) | 1 |
| Born in rural, spent first 5 years in urban (87) | 24 (4.3) | 63 (5.6) | 1.54 (0.86–2.75) |
| Born in urban, spent first 5 years in rural (72) | 22 (4.0) | 50 (4.5) | 2.11 (1.14–3.91) |
| Born and spent first 5 years in urban (1,246) | 459 (82.7) | 787 (70.6) | 2.55 (1.80–3.61) |
-
N = number; Adj. OR = adjusted odds ratio; CI = confidence interval; number (%) shown in 2nd and 3rd column.
*Adjusted for age, sex, and father’s education level.
Table 5
Combined effects of residence at birth and parental history of allergic disease as risk factors for asthma among schoolchildren in a case-control study from 2015 to 17 (N = 1,532).
| Child’s residence at birth | Parental history of allergy | Asthma cases N = 526 | Non-asthmatic controls N = 1006 | Adj. OR (95% CI)* |
|---|---|---|---|---|
| Rural | − | 27 (5.1) | 158 (15.7) | 1 |
| Town | − | 137 (26.1) | 383 (38.1) | 2.15 (1.35–3.44) |
| City | − | 20 (3.8) | 31 (3.1) | 3.33 (1.61–6.90) |
| Rural | + | 42 (8.0) | 85 (8.4) | 2.78 (1.58–4.89) |
| Town | + | 253 (48.1) | 306 (30.4) | 5.16 (3.25–8.17) |
| City | + | 47 (8.9) | 43 (4.3) | 5.54 (2.99–10.26) |
-
Adj. OR = adjusted odds ratio; CI = confidence interval; N = number; ‘−' refers to no history of parental allergy, ‘+' refers to positive history of parental allergy. number (%) in 3rd and 4th column. *Adjusted for child’s age, sex, and father’s education level. Parental history of allergic disease included a history of asthma, eczema, allergic rhinitis, allergic conjunctivitis and any other allergies.
Table 6
Combined effects of residence at birth and atopy as asthma risk factors among schoolchildren in a case-control study between 2015–17 (N = 1,635).
| Child’s residence at birth | Atopy (SPT to any of 7 allergens) | Asthma cases N = 546 | Non-asthmatic controls N = 1089 | Adj. OR (95% CI)* |
|---|---|---|---|---|
| Rural | - | 42 (7.7) | 191 (17.5) | 1 |
| Town | - | 177 (32.4) | 504 (46.3) | 1.72 (1.16–2.55) |
| City | - | 25 (4.6) | 43 (4.0) | 2.63 (1.41–4.91) |
| Rural | + | 31 (5.7) | 81 (7.4) | 1.77 (1.02–3.05) |
| Town | + | 228 (41.7) | 236 (21.7) | 4.61 (3.07–6.90) |
| City | + | 43 (7.9) | 34 (3.1) | 4.67 (2.56–8.52) |
-
Adj. OR = adjusted odds ratio; CI = confidence interval; N = number; SPT = skin prick test; ‘-' refers to SPT negative, ‘+' refers to SPT positive to any of seven crude extracts of Blomia tropicalis, Dermatophagoides mix, cockroach, peanut, cat, weeds pollen mix, and mould mix. number (%) in 3rd and 4th column. *Adjusted for child’s age, sex and father’s education level.
Table 7
Combined effects of father’s education and residence at birth as asthma risk factors among schoolchildren in a case-control study from 2015 to 17 (N = 1,670).
| Father’s education level | Child’s residence at birth | Asthma cases N = 555 | Non-asthma controls N = 1115 | Adj. OR (95% CI)* |
|---|---|---|---|---|
| Primary | Rural | 20 (3.6) | 115 (10.3) | 1 |
| Primary | Town | 67 (12.1) | 206 (18.5) | 2.13 (1.22–3.74) |
| Primary | City | 12 (2.2) | 17 (1.5) | 4.98 (2.02–12.31) |
| Secondary | Rural | 26 (4.7) | 109 (9.8) | 1.39 (0.72–2.66) |
| Secondary | Town | 156 (28.1) | 268 (24.0) | 3.97 (2.34–6.76) |
| Secondary | City | 11 (1.9) | 24 (2.2) | 2.80 (1.16–6.76) |
| Tertiary | Rural | 28 (5.0) | 54 (4.8) | 3.22 (1.64–6.33) |
| Tertiary | Town | 189 (34.1) | 283 (25.4) | 4.96 (2.89–8.53) |
| Tertiary | City | 46 (8.3) | 39 (3.5) | 6.95 (3.52–13.71) |
-
N = number; CI = confidence interval; Adj. OR = adjusted odds ratio; 3rd and 4th column contain n (%); *Adjusted for child’s age and sex. Similar pattern was observed for mother’s education level and child’s residence at birth.
Key resources table
| Reagent type (species) or resource | Designation | Source or reference | Identifiers | Additional information |
|---|---|---|---|---|
| Commercial assay or kit | ImmunoCAPspecific IgE test | Thermo Fisher Scientific, Uppsala, Sweden | http://www.phadia.com/en/Products/ Allergy-testing-products/ImmunoCAP-Assays/sIgE/ |
Additional files
-
Supplementary file 1
Tables of results for risk factors for asthma among schoolchildren involved in an asthma case-control study in Uganda, between 2015–17.
Supplementary file 1a The association between infection with different species of helminths and asthma among 1543 schoolchildren. Three fresh stool samples per child were examined for helminths using the Kato Katz method. We used multiple logistic regression method, adjusted for child’s age, sex, residence at birth, father’s education level and reported worm treatment in the last 12 months. ¤Other helminth infections included Hymenolepis nana and Enterobius vermicularis. N = number; Adj. OR = adjusted odds ratio; CI = confidence interval; number (%) in 2nd and 3rd column. Supplementary file 1b The association between individual and combined effects of child’s atopy and parental history of allergic disease, and asthma risk among 1501 schoolchildren. Skin prick test (SPT) performed using standard procedures and seven crude extracts of Blomia tropicalis, Dermatophagoides mix, cockroach, peanut, cat, weeds pollen mix, and mould mix. Parental history of allergic disease included a history of asthma, eczema, allergic rhinitis, allergic conjunctivitis and any other allergies. We used multiple logistic regression analysis, and adjusted for child’s age, sex, residence at birth and father’s education level. N = number; Adj. OR = adjusted odds ratio; CI = confidence interval; ‘-' refers to none, ‘+' refers to present. Number (%) in 3rd and 4th column. Supplementary file 1c The individual and combined effects of mother’s and father’s history of allergic disease, and asthma risk among 1498 schoolchildren. Parental history of allergic disease included a history of asthma, eczema, allergic rhinitis, allergic conjunctivitis and any other allergies. We conducted multiple logistic regression analysis, and adjusted for child’s age, sex, residence at birth and father’s education level. N = number; Adj. OR = adjusted odds ratio; CI = confidence interval; number (%) shown in 2nd and 3rdcolumn.
- https://cdn.elifesciences.org/articles/49496/elife-49496-supp1-v2.docx
-
Reporting standard 1
STROBE Statement: Risk factors for asthma among schoolchildren who participated in a case-control study in urban Uganda.
- https://cdn.elifesciences.org/articles/49496/elife-49496-repstand1-v2.doc
-
Transparent reporting form
- https://cdn.elifesciences.org/articles/49496/elife-49496-transrepform-v2.docx
Download links
A two-part list of links to download the article, or parts of the article, in various formats.
Downloads (link to download the article as PDF)
Open citations (links to open the citations from this article in various online reference manager services)
Cite this article (links to download the citations from this article in formats compatible with various reference manager tools)
Risk factors for asthma among schoolchildren who participated in a case-control study in urban Uganda
eLife 8:e49496.
https://doi.org/10.7554/eLife.49496


