The Mars1 kinase confers photoprotection through signaling in the chloroplast unfolded protein response
- Howard Hughes Medical Institute, University of California, San Francisco, United States
- University of California, San Francisco, United States
- Lawrence Berkeley National Laboratory, United States
- Princeton University, United States
Figures
Figure 1 with 1 supplement
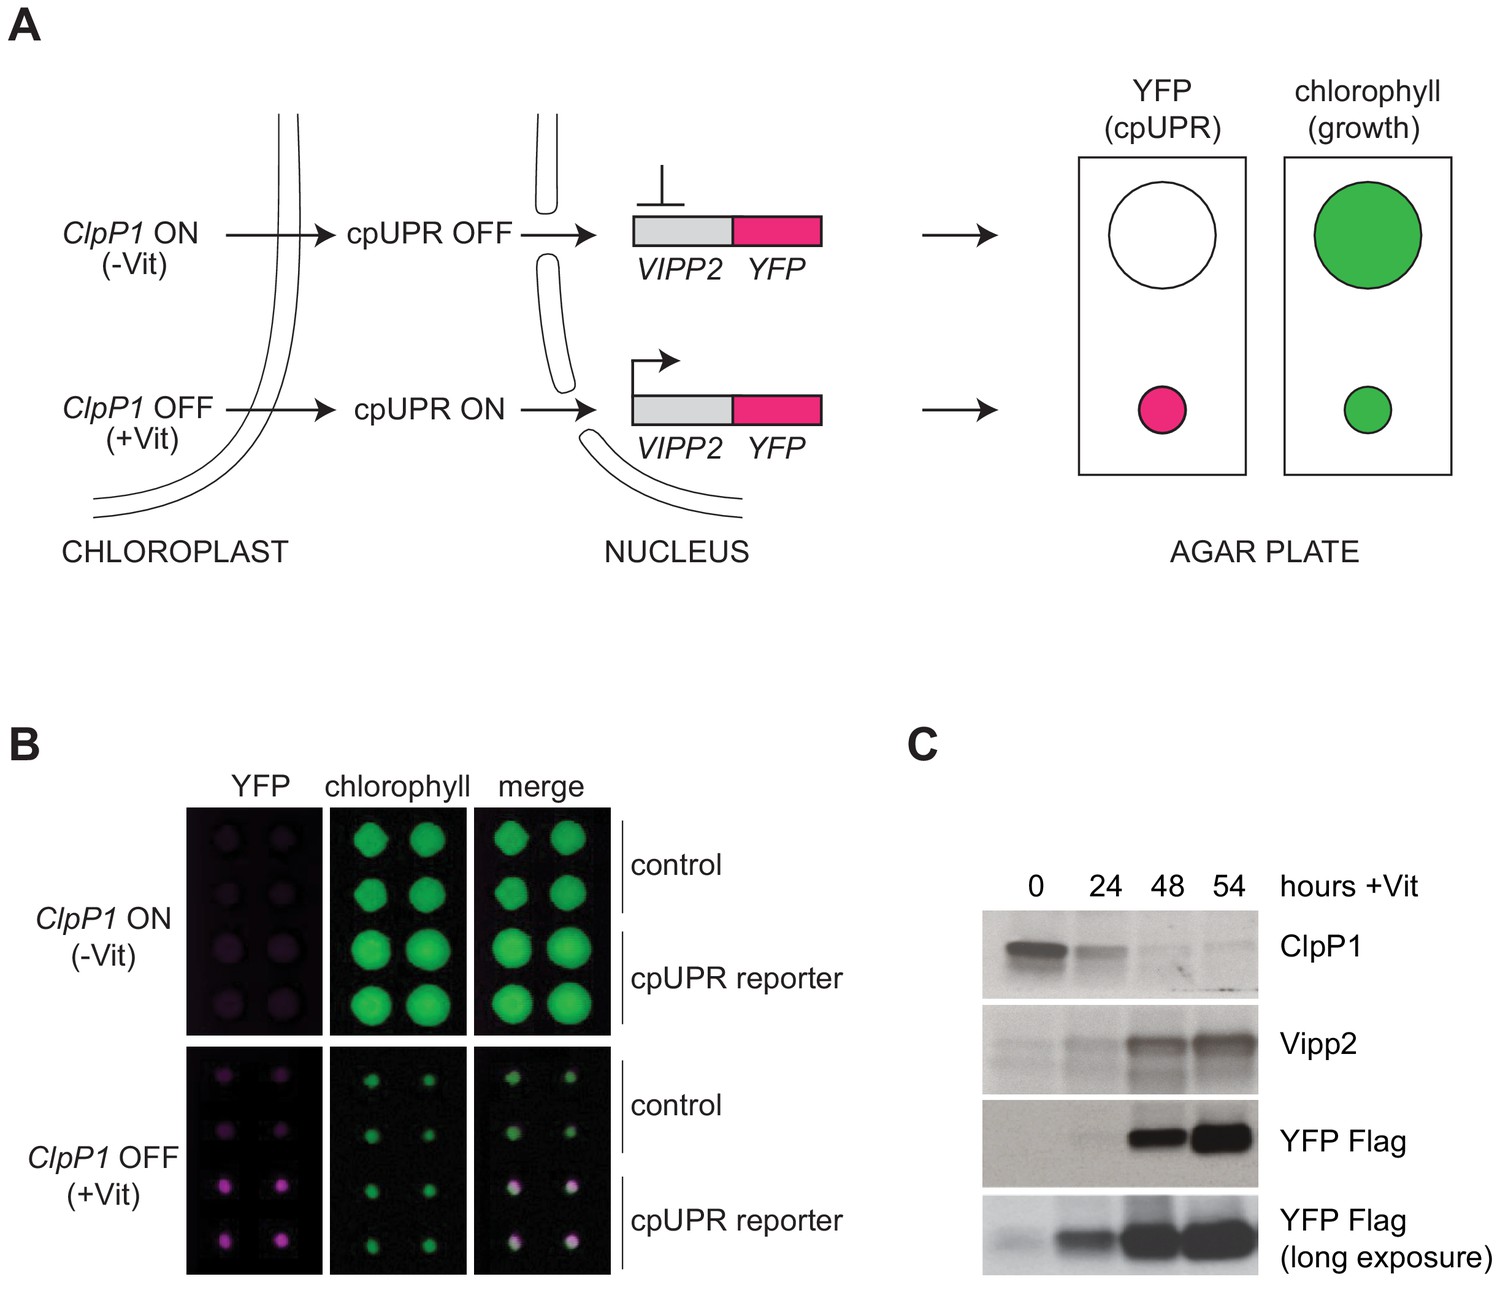
Reporter strain for high-throughput screening for cpUPR mutants.
(A) Schematic of cpUPR regulation in the reporter strain. Under homeostatic conditions (-Vit), chloroplast ClpP1 is expressed and the cpUPR pathway is OFF, as indicated by the lack of VIPP2 expression; upon ClpP1 depletion (+Vit), the cpUPR is induced leading to VIPP2 expression. The cells contain an inducible reporter gene consisting of the VIPP2 promoter fused to the coding sequence of YFP tagged with a 3x-Flag epitope at its C-terminus. When the reporter gene is activated, YFP fluorescence is induced (magenta circles), and the reporter strain’s growth is inhibited, as indicated by the smaller colony size (green circles) measured in the chlorophyll-imaging channel. (B) Plate-based real-time imaging assay to detect cpUPR activation. Four technical replicates of control cells (containing only the ClpP1-repressible system) and of cpUPR reporter cells (additionally containing the YFP reporter gene) were imaged after 6 days of growth on agar plates under ClpP1-permissive or ClpP1-nonpermissive conditions (-/+Vit, respectively). Induction of the YFP fluorescence is observed exclusively in the reporter strain replicates, while growth inhibition is observed in both control and cpUPR reporter strains in ClpP1-nonpermissive conditions. (C) Immunoblots of reporter cell extracts upon ClpP1 repression (+Vit) for 0, 24, 48, and 54 hr were probed with anti-ClpP1, anti-Vipp2, and anti-Flag antibodies.
Figure 1—figure supplement 1
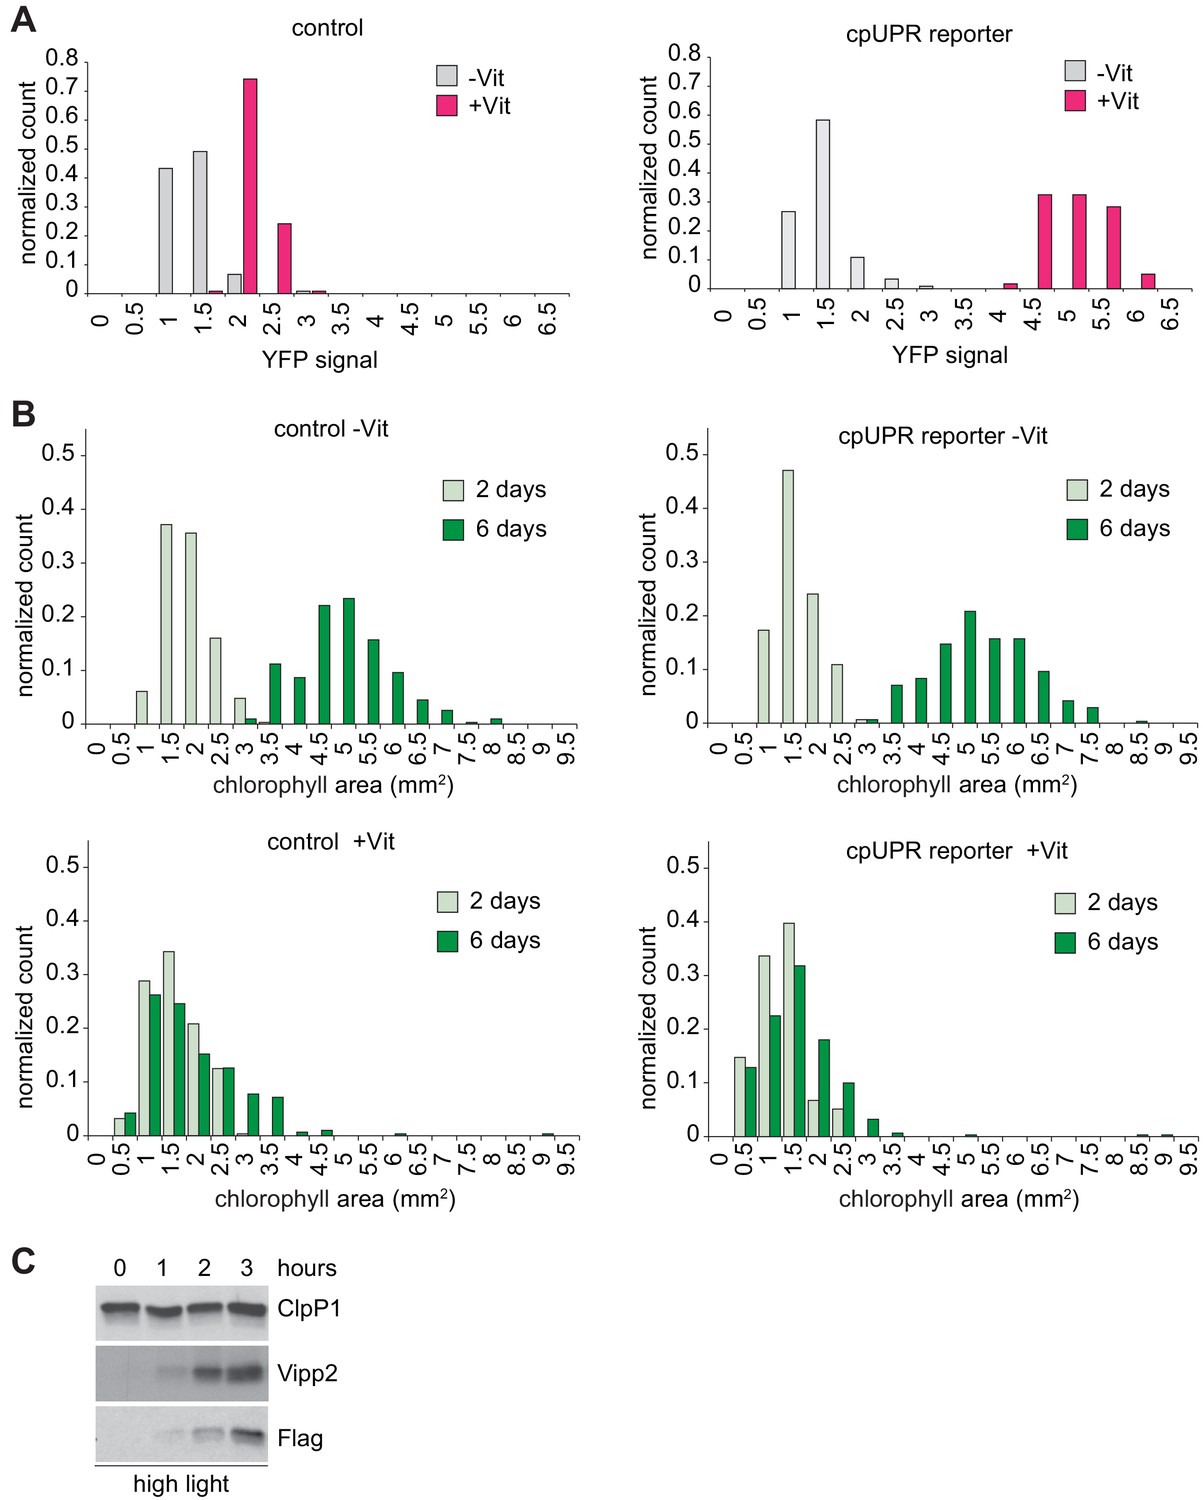
Design of a reporter strain for high-throughput detection of the cpUPR signaling in C. reinhardtii.
(A) Histograms of the normalized Yellow Fluorescent Protein (YFP) maximum intensity signal after 2 days in ClpP1-permissive (-Vit) or ClpP1-nonpermissive media (+Vit) for control and cpUPR reporter cell colonies (N = 120 for each strain). The control strains contain only the ClpP1 repressible system, while the cpUPR reporter strain also harbors the reporter construct described in Figure 1B. (B) Histograms of colony area measurements (in mm2) for control and for the cpUPR reporter cell colonies described in Figure 1—figure supplement 1A after 2 or 6 days in ClpP1-permissive (-Vit) or ClpP1-nonpermissive media (+Vit). (C) Immunoblot analysis of samples prepared from the reporter strain exposed to high light for 1, 2, and 3 hr using antibodies against Vipp2, Flag for YFP detection and ClpP1 as loading control.
Figure 2 with 4 supplements
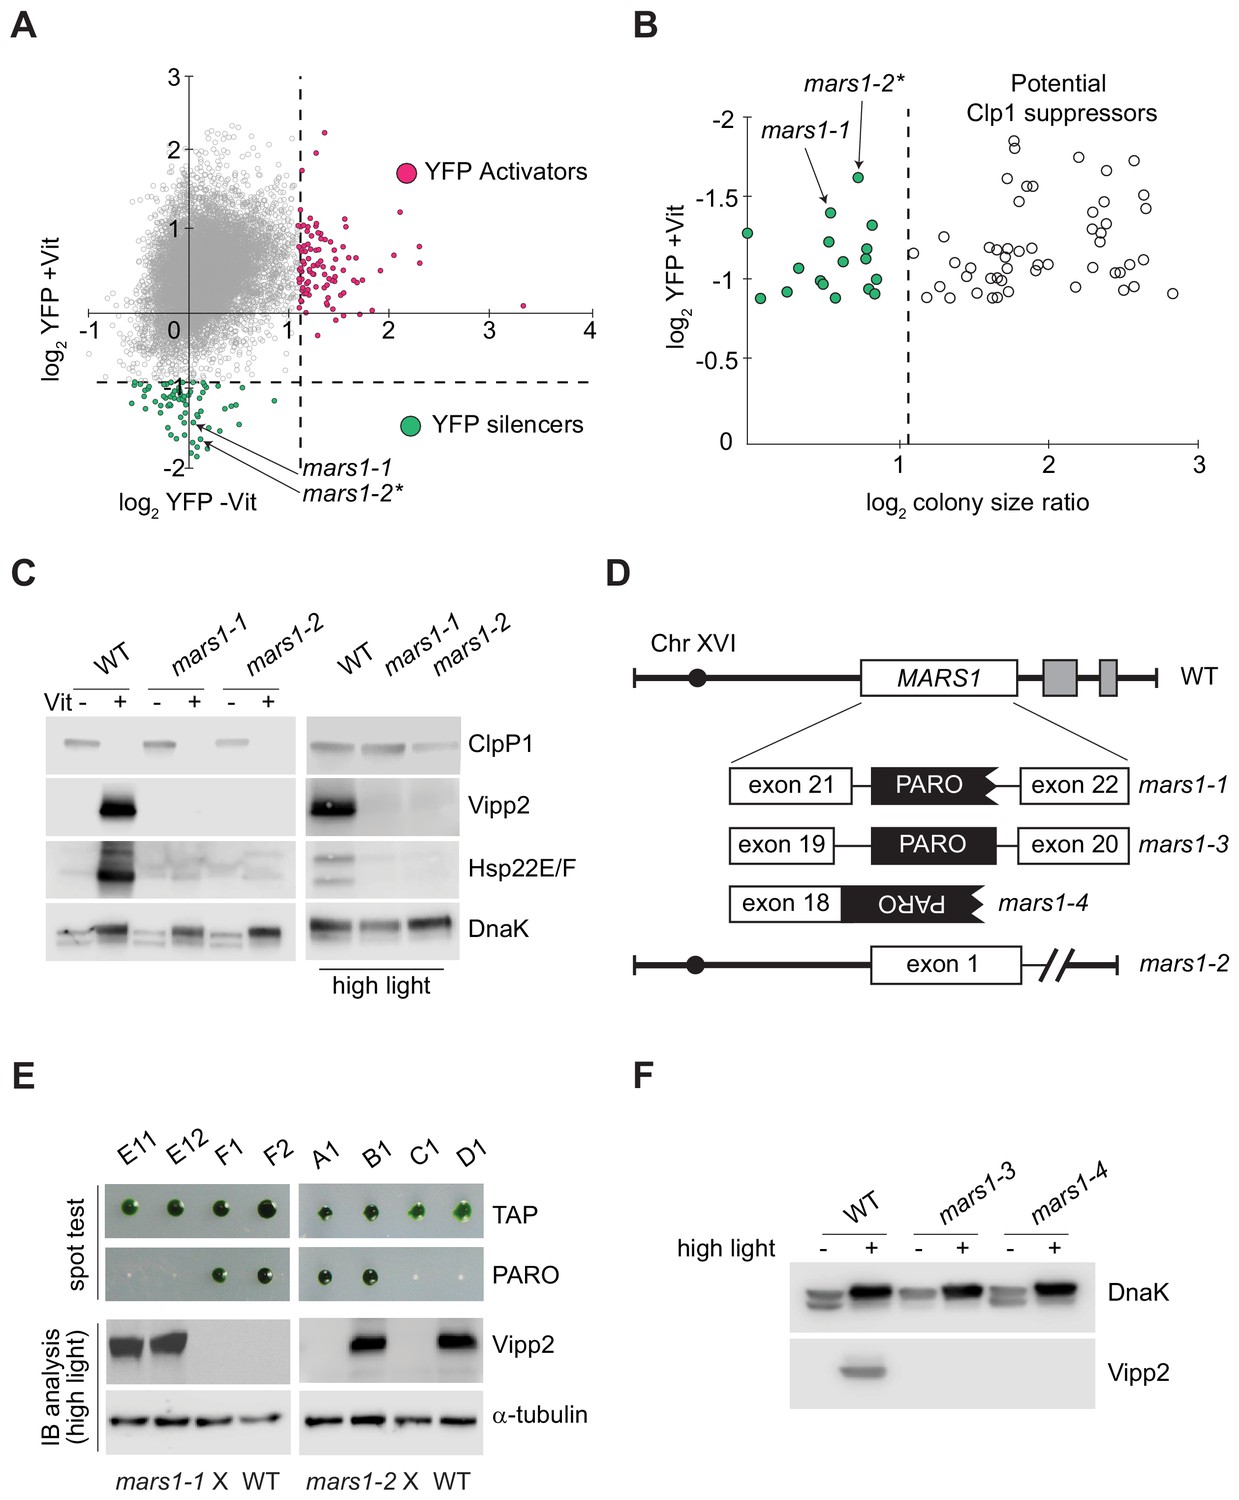
Genetic screen identifying mars1-1 and mars1-2.
(A) Scatter plot of changes in YFP fluorescence for each mutant relative to reporter cells in ClpP1-permissive (–Vit) and ClpP1-nonpermissive (+Vit) conditions. Mutants exhibiting YFP fluorescence at least three standard deviations lower or higher than the mean (dotted lines) were categorized as YFP silencers and activators. Positions of the cpUPR silencers mars1-1 and mars1-2* are indicated (for details on mars1-2* refer to the note in Supplementary Materials). (B) Scatter plot of colony size ratio over fold-changes in YFP fluorescence for each mutant relative to reporter cells under ClpP1-nonpermissive conditions (+Vit). Colony size ratio was calculated as a fold-change of the colony area between 2 and 6 days after plating. The average colony size increase is indicated by the dashed line. Colonies that increased in size more than average represent potential suppressors of ClpP1 repression. (C) Immunoblot analysis of cpUPR reporter cell (WT) extracts, mars1-1 and mars1-2 cells grown in ClpP1-permissive or ClpP1-nonpermissive conditions (-/+Vit, respectively) or exposed to high light, using antibodies against ClpP1, Vipp2, Hsp22E/F and DnaK (loading/stress control). (D) Diagram of MARS1 indicating the insertion site of the mutagenic cassette (PARO) in each respective MARS1 mutant allele. Gray boxes indicate neighboring genes and the interrupted line a deletion. (E) Analysis of representative meiotic tetrads from backcrosses of mars1-1 and mars1-2 to WT (CC-124) (E11-F2 and A1-D1 correspond to the plate coordinates in Figure 2—figure supplement 2B, Figure 2—figure supplement 3B). Tetrads were spotted on acetate agar (TAP) and on acetate agar supplemented with paromomycin (PARO). Samples prepared from the strains grown under HL were immunoblotted with antibodies against Vipp2 and α-tubulin (loading control). (F) Immunoblot samples prepared from WT, mars1-3 and mars1-4 cells grown under control or HL conditions were probed with antibodies against Vipp2 and DnaK as a loading/stress control.
-
Figure 2—source data 1
Scoring mutants via YFP and area measurements.
- https://cdn.elifesciences.org/articles/49577/elife-49577-fig2-data1-v2.xlsx
Figure 2—figure supplement 1
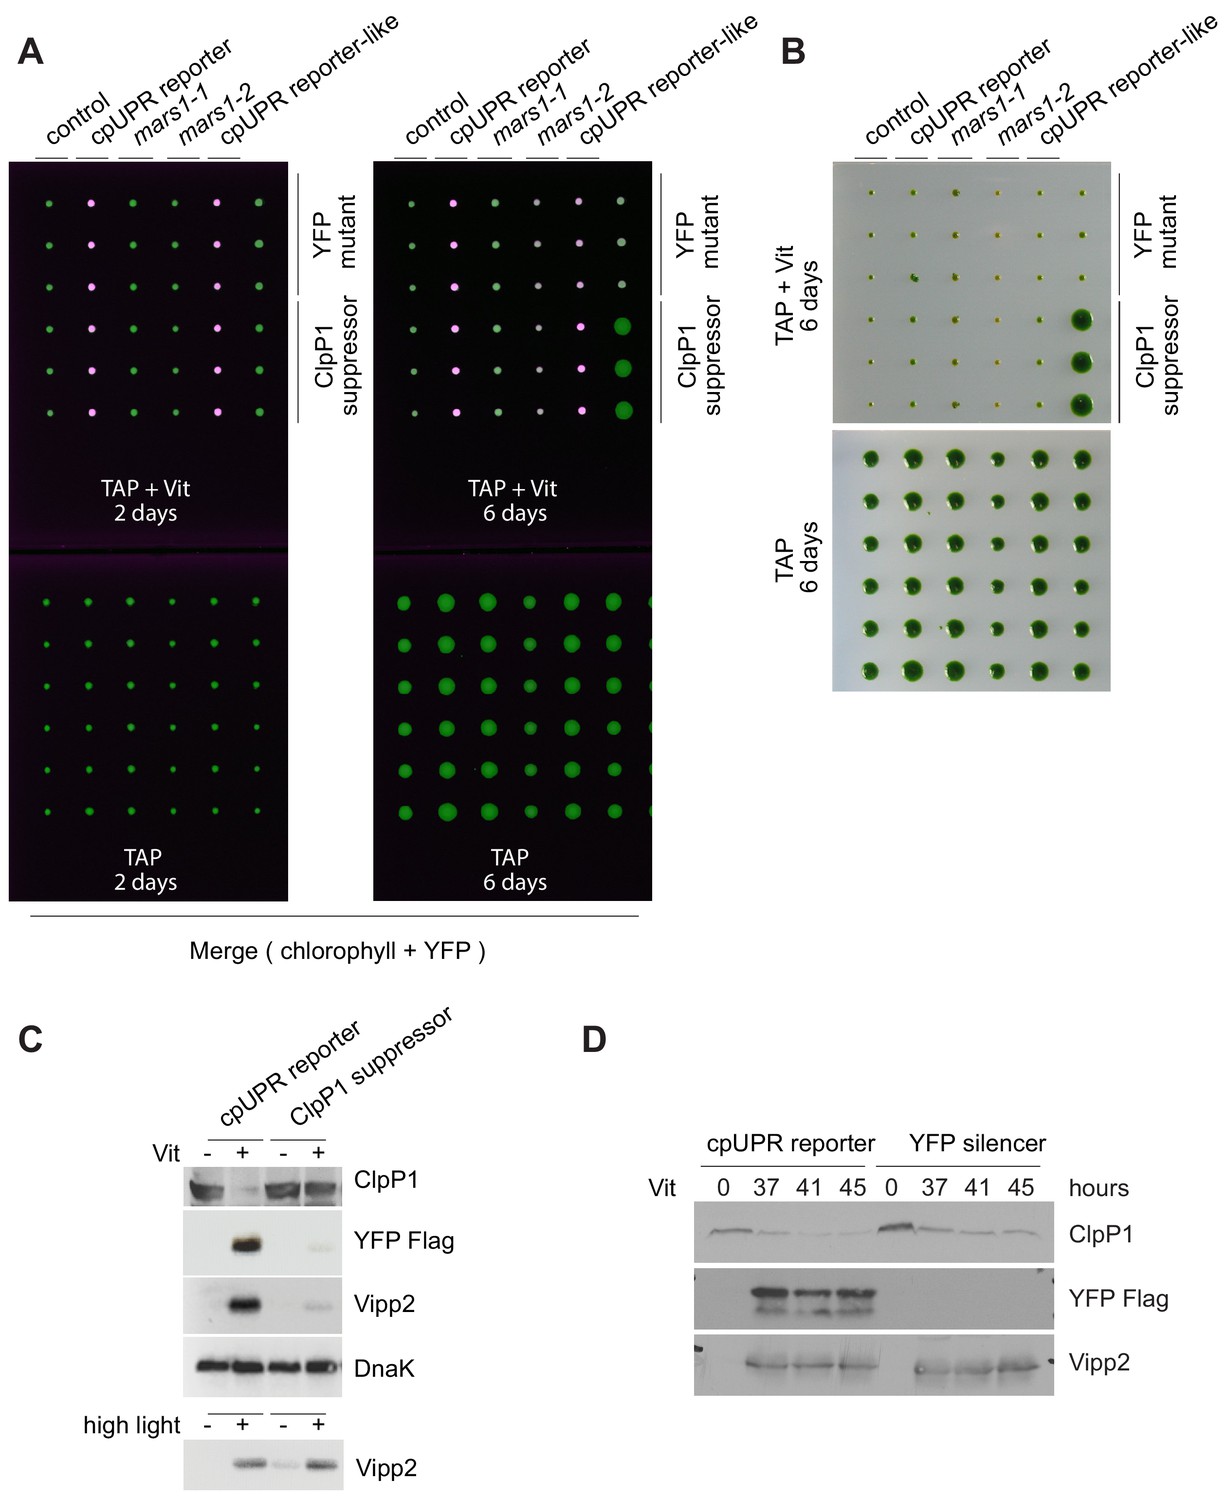
The genetic screen yields two cpUPR silencing mutants, mars1-1 and mars1-2.
(A) A merge of the chlorophyll (green) and YFP (magenta) channel for each of the following cell colonies: control cells (containing only the ClpP1 repressible system), cpUPR reporter cells (containing both the ClpP1 repressible system and the YFP reporter construct described in Figure 1B), mars1-1, mars1-2 (described in Figure 2A–C), a cpUPR reporter-like strain (mutant strain performing like the parental cpUPR reporter used as a positive control) (technical replicates N = 6), a YFP mutant and a ClpP1 suppressor cell colony (technical replicates N = 3). Colonies were grown in acetate media (TAP) in ClpP1-permissive (-Vit) or ClpP1-nonpermissive conditions (+Vit) for 2 and 6 days. In +Vit, the ClpP1 suppressor exhibits a YFP-silencing phenotype, but its colony size is comparable to that in -Vit. (B) Photographs of the same cell colonies shown in Figure 2—figure supplement 1A, grown in ClpP1-permissive (-Vit) or ClpP1-nonpermissive conditions (+Vit) for 6 days. (C) Immunoblot analysis of samples prepared from the cpUPR reporter strain and the ClpP1 suppressor mutant grown in ClpP1-permissive (-Vit) and ClpP1-nonpermissive (+Vit, 2 days) conditions or upon exposure to HL (3 hr) using antibodies against ClpP1, Vipp2, Flag for YFP detection and DnaK for loading control. As expected, the ClpP1 suppressor mutant expresses ClpP1 in +Vit. (D) Immunoblot analysis of samples prepared from the cpUPR reporter strain and the YFP mutant grown in ClpP1-permissive and ClpP1-nonpermissive conditions (-/+Vit, respectively), using antibodies against ClpP1, Vipp2 and Flag for YFP detection.
Figure 2—figure supplement 2
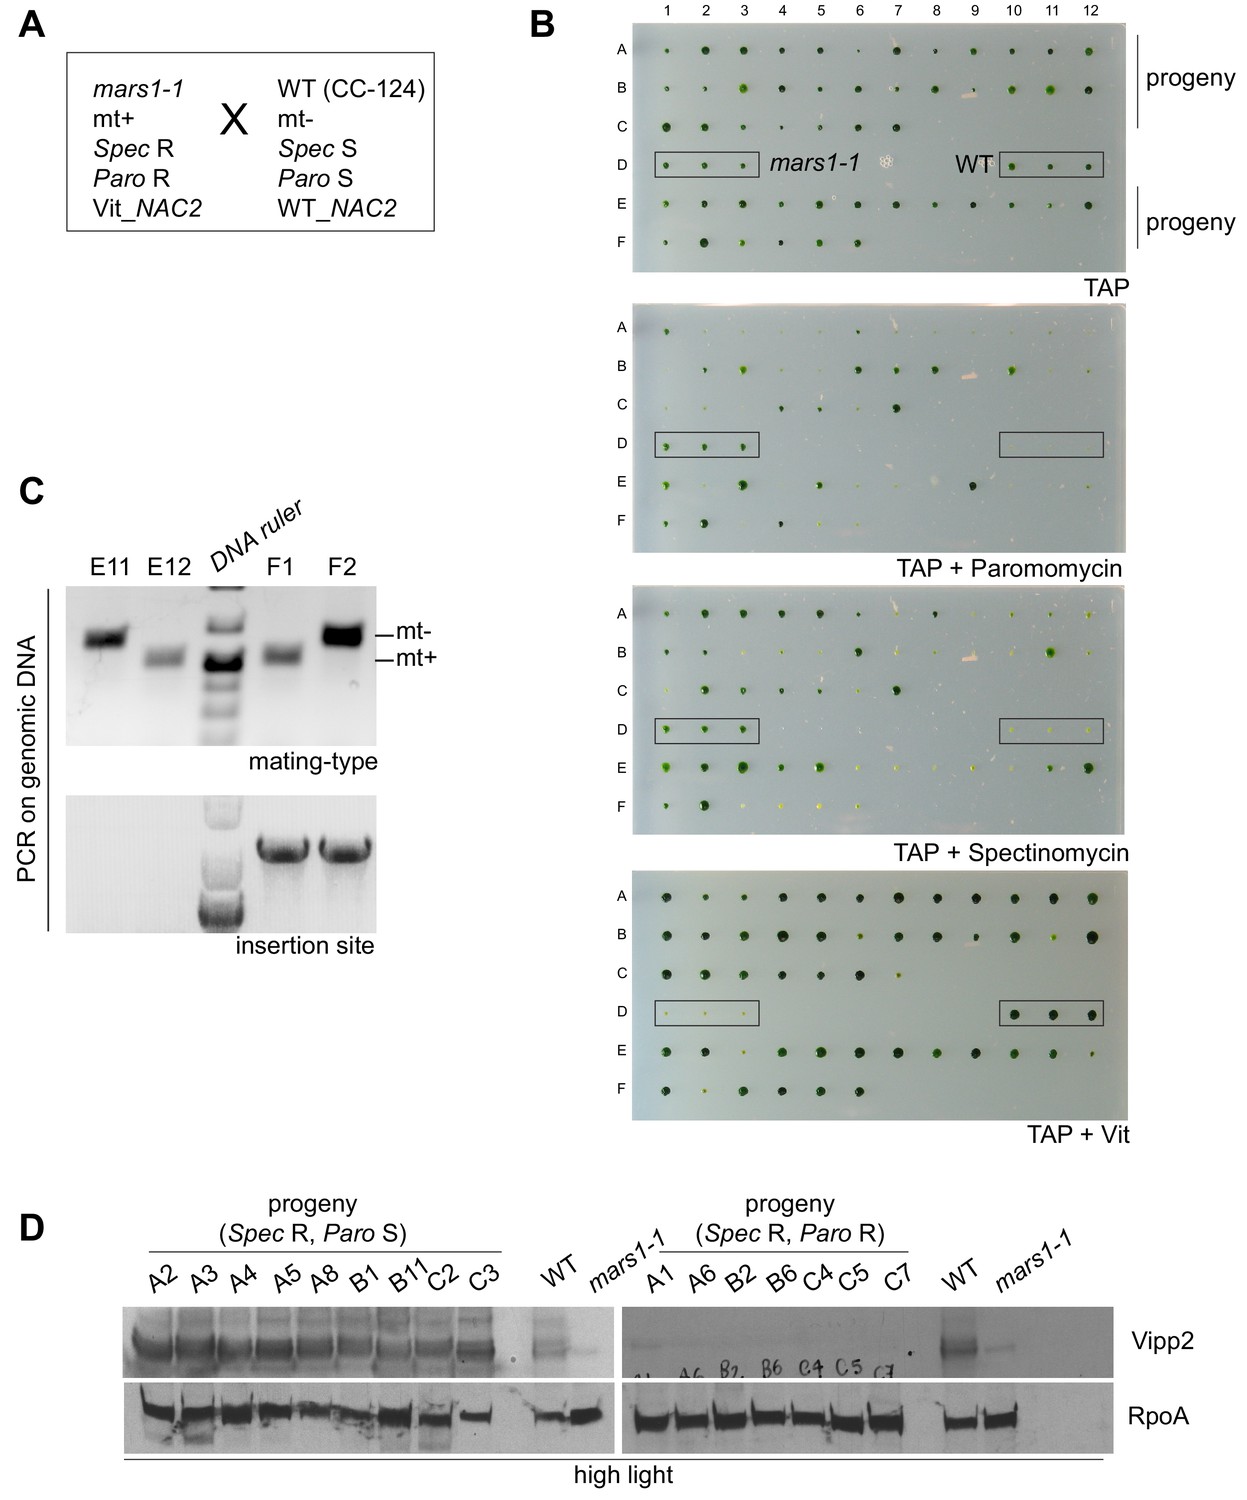
Genetic analysis of mars1-1.
(A) Diagram showing the backcross of mars1-1 to CC-124 (WT) and indicating the mating-type and other genetic markers of these two strains. The spectinomycin resistance (Spec R) and the Vit-driven NAC2 transgene (Vit-NAC2) are linked to the genetic modifications introduced into the chloroplast and in the nuclear genome, respectively, to generate a Vit-driven ClpP1 repressible strain (Ramundo et al., 2014; Ramundo et al., 2013). The paromomycin resistance (Paro R) is linked to the insertion of the mutagenic cassette into the nuclear genome. (B) Photographs of offspring from the mars1-1 x CC-124 (WT) backcross along with the parental controls, mars1-1 and CC-124, re-arrayed in a 96-well format and replicated on TAP agar or on TAP agar supplemented with Vit, with paromomycin or with spectinomycin. Due to difficulties in the cross, most isolated tetrads were incomplete. However, among the spectinomycin resistant offspring, about 50% of the cells were found to be paromomycin resistant as expected in the case of Mendelian inheritance of a single nuclear locus. (C) Mating type and insertion site PCR products from genomic DNA samples prepared from a full tetrad progeny obtained from the backcross of mars1-1 to CC-124 (WT) (Werner and Mergenhagen, 1998). The phenotypes of the progeny are shown in Figure 2E. Both the mating-type and the mutagenic cassette, disrupting the MARS1 gene locus, segregated 2:2. (D) Immunoblot analysis of samples prepared from the indicated progeny and exposed to HL, using antibodies against Vipp2 and RpoA as a loading control. Only spectinomycin-resistant progeny were selected, and they were named after their coordinates in the 96-well plates shown in Figure 2—figure supplement 2B.
Figure 2—figure supplement 3
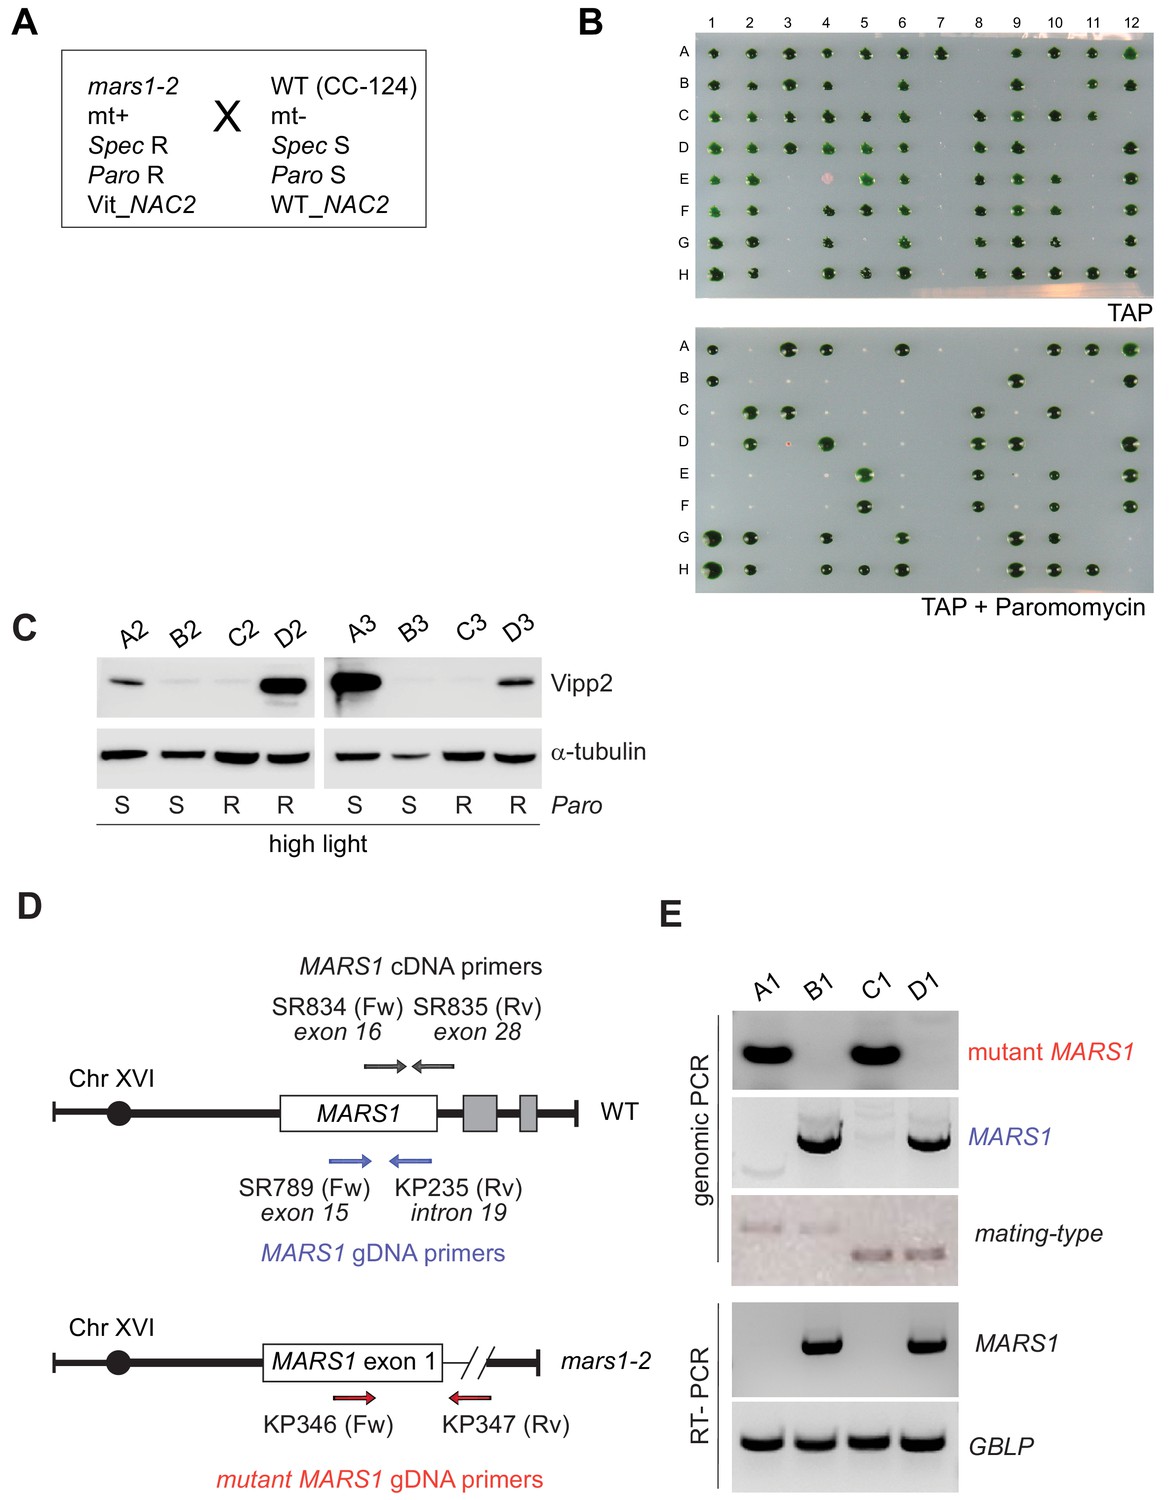
Genetic analysis of mars1-2.
(A) Diagram showing the backcross of mars1-2 to CC-124 (WT) and indicating the mating-type and other genetic markers of these two strains. (B) Photographs of offspring from the mars1-2 to CC-124 (WT) backcross along with the parental controls, mars1-2 and CC-124, re-arrayed in a 96-well format and replicated on TAP agar or on TAP agar supplemented with paromomycin. (C) Immunoblot analysis of samples prepared from tetrads obtained from the mars1-2 to CC-124 backcross and exposed to HL, using antibodies against Vipp2 and α-tubulin as a loading control. Sensitivity (S) or resistance (R) to Paromomycin (Paro) is also indicated. (D) Cartoon indicating the deletion of the MARS1 gene locus in mars1-2 and the annealing position of the primers at different regions of the MARS1 gene locus and chromosome 16. These primers were used for PCR amplification on cDNA and/or genomic DNA prepared from WT and mars1-2 (in Figure 2—figure supplement 3E), mars1-1, mars1-3 and mars1-4 (in Figure 2—figure supplement 4E). (E) Detection of MARS1 gene deletion and abrogation of MARS1 transcript in mars1-2. Genomic DNA and cDNA samples obtained from the meiotic tetrad shown in Figure 2E were analyzed by PCR and RT-PCR, respectively, using the primers indicated in Figure 2—figure supplement 3D. GBLP was used as a loading control for cDNA amplification. Progeny containing the MARS1 deletion correlated with having no MARS1 transcript.
Figure 2—figure supplement 4
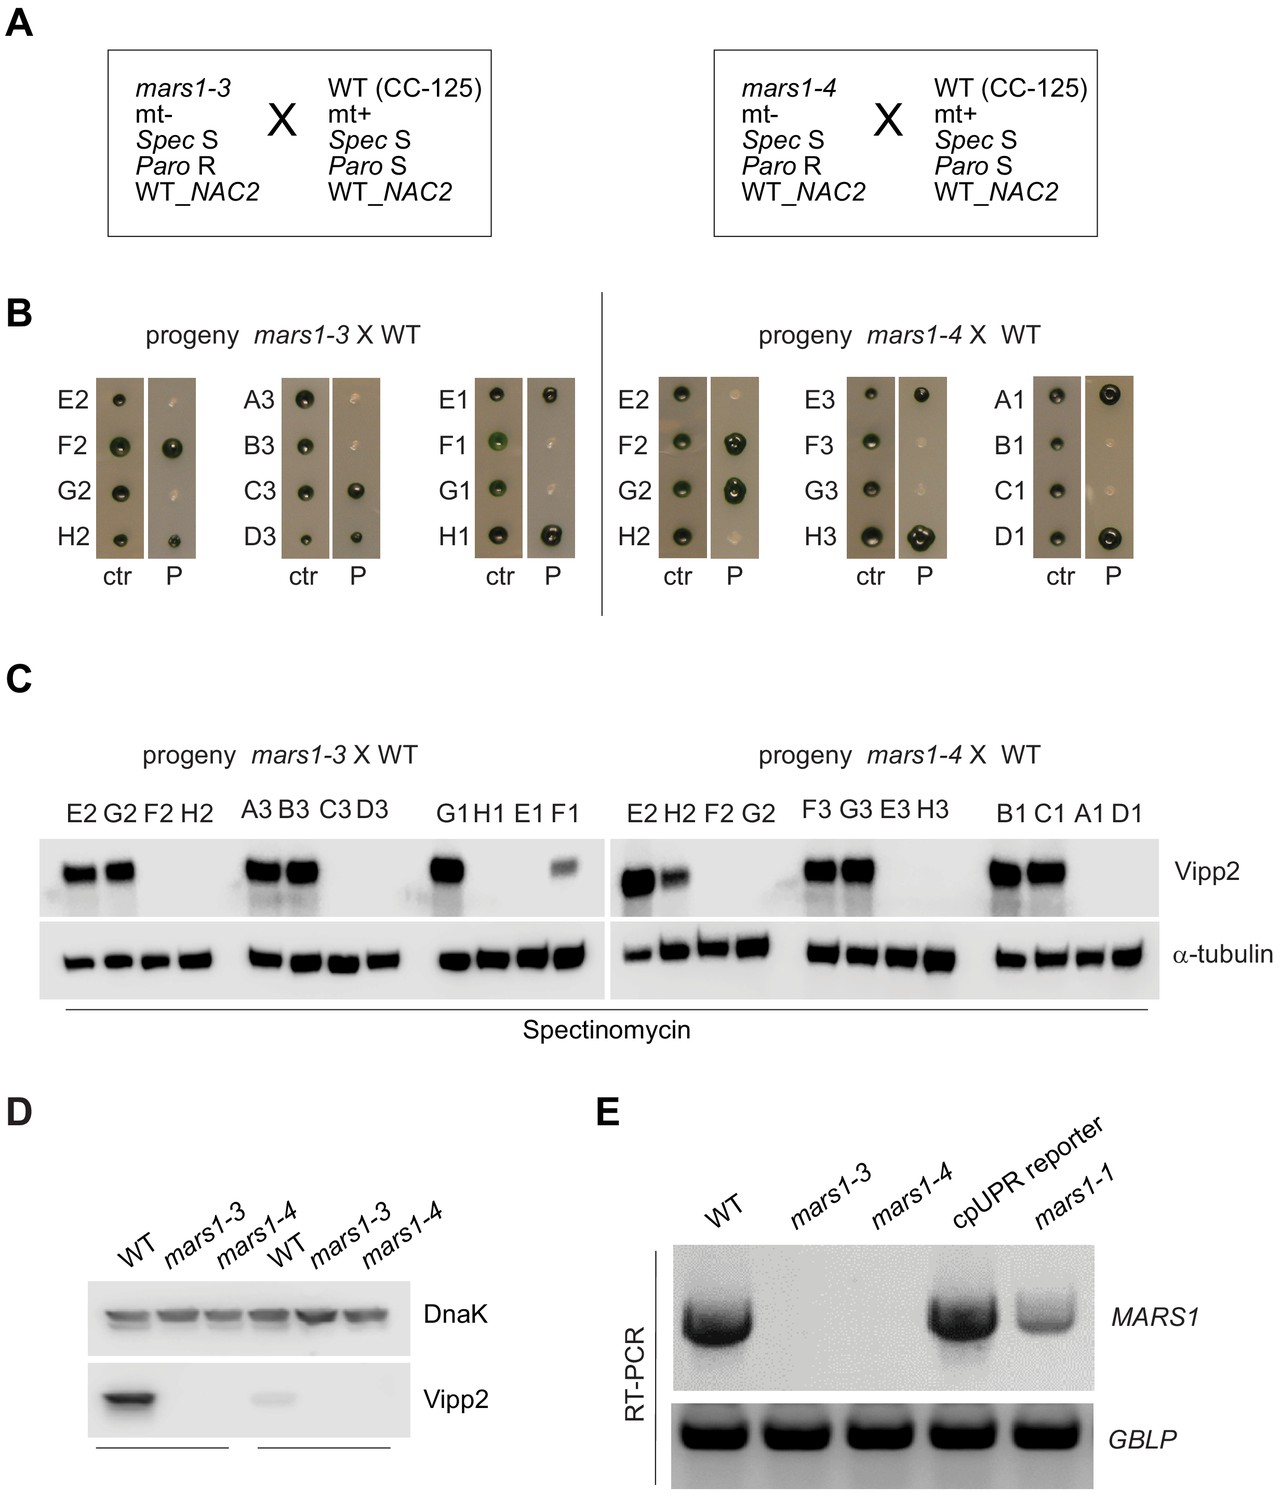
Genetic analysis of mars1-3 and mars1-4.
(A) Diagram showing the backcross of mars1-3 or mars1-4 to CC-125 (WT) and indicating the mating-type and other genetic markers of these strains. (B) Photographs of offspring from the backcross of mars1-3 or mars1-4 to CC-125 (WT), re-arrayed in a 96-well format and replicated on TAP agar (‘ctr’, control) or on TAP agar supplemented with paromomycin (‘P’). Three representative tetrads are shown for each mutant. (C) Immunoblot analysis of samples prepared from tetrads obtained from the backcross of mars1-3 or mars1-4 to CC-125 (WT) (shown in Figure 2—figure supplement 4B) and treated with spectinomycin, using antibodies against Vipp2 and α-tubulin for loading control. Since these strains do not harbor a spectinomycin resistance cassette, this antibiotic was used as a chloroplast translation inhibitor to trigger the activation of the chloroplast unfolded protein response. (D) Immunoblot analysis of samples prepared from wild-type cells and mars1-3 and mars1-4 cells, upon treatment with either spectinomycin or hydrogen peroxide, using antibodies against Vipp2 and DnaK as a loading control. (E) MARS1 RT-PCRs performed on cDNA extracted from wild-type cells (CC-4533, the parental line used to generate the mars1-3 and mars1-4 mutants), mars1-3 and mars1-4 cells, cpUPR reporter cells (the parental line used to generate mars1-1) and mars1-1 cells using primers indicated in Figure 2—figure supplement 3D. RT-PCRs of the housekeeping gene GBLP served as loading controls. The insertion of the mutagenic cassette in different regions of the MARS1 gene (as indicated in Figure 2D) impairs expression of MARS1 transcript to different degrees in each mutant (completely in mars1-4, almost completely in mars1-3 and partially in mars1-1).
Figure 3 with 2 supplements
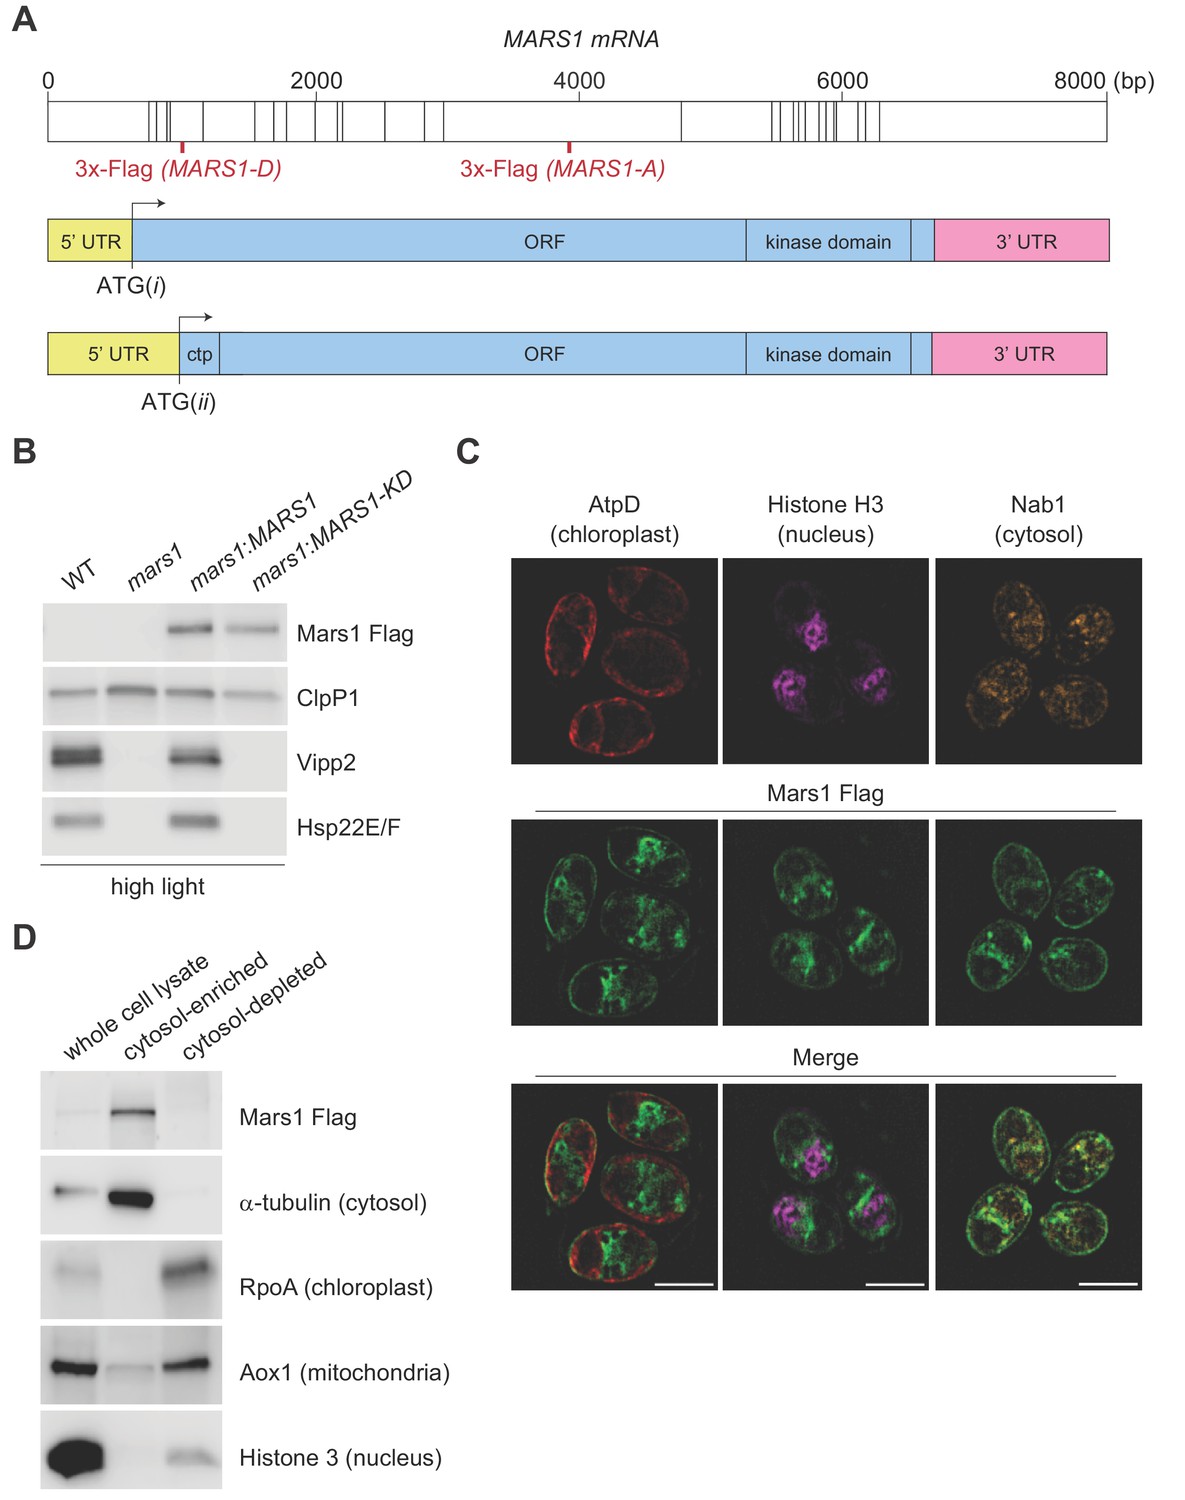
Characterization of Mars1.
(A) In the upper diagram, the length of MARS1 transcript is shown, the position of exon-exon boundaries is indicated with vertical lines while the different locations of the triple Flag epitope engineered in MARS1-A and MARS1-D transgenes are highlighted in red. In the lower diagrams, alternative models for the 5’ untranslated region (5' UTR) (yellow) and open reading frame (ORF) (light blue) in MARS1 transcript are shown as predicted for translation starts ATG(i) and ATG(ii). The N-terminal chloroplast transit peptide (ctp) is predicted by ChloroP (Emanuelsson et al., 1999) only if ATG(ii) is used as the translation start site. In both models, the position of the 3’ UTR (pink) and the kinase domain is the same. (B) Immunoblot analysis of samples prepared after HL treatment using antibodies against Flag for Mars1 detection, Vipp2, Hsp22E/F, and ClpP1 (loading control). Strains analyzed: mars1 = mars1-3; mars1:MARS1-A = mars1-3 transformed with a MARS1-A transgene containing a 3x-Flag epitope after Arg1167 of Mars1 (as shown in Figure 3A); mars1:MARS1-A KD = mars1-3 transformed with a catalytically-inactive MARS1-A transgene bearing the kinase active site D1871A mutation. (C) Representative dual immunofluorescence images obtained by structured illumination microscopy of mars1-3:MARS1-A cells. Mars1 was detected with anti-Flag. Anti-AtpD, anti-Histone H3 and anti-Nab1 staining served as controls for the localization of the chloroplast, nucleus and cytosol, respectively. Scale bar: 5 µm. For imaging conditions and negative controls, see Supplementary Materials and Figure 3—figure supplement 2. (D) Immunoblot analysis of lysates fractionated by differential centrifugation from mars1-3:MARS1-A cells probed with the indicated antibodies against known markers of the cytosol (α-tubulin), chloroplast (RpoA, α-subunit of chloroplast RNA polymerase), nucleus (Histone H3) and mitochondria (Aox1, alternative oxidase 1).
Figure 3—figure supplement 1
A catalytic active Mars1 kinase is required for signaling during the cpUPR.
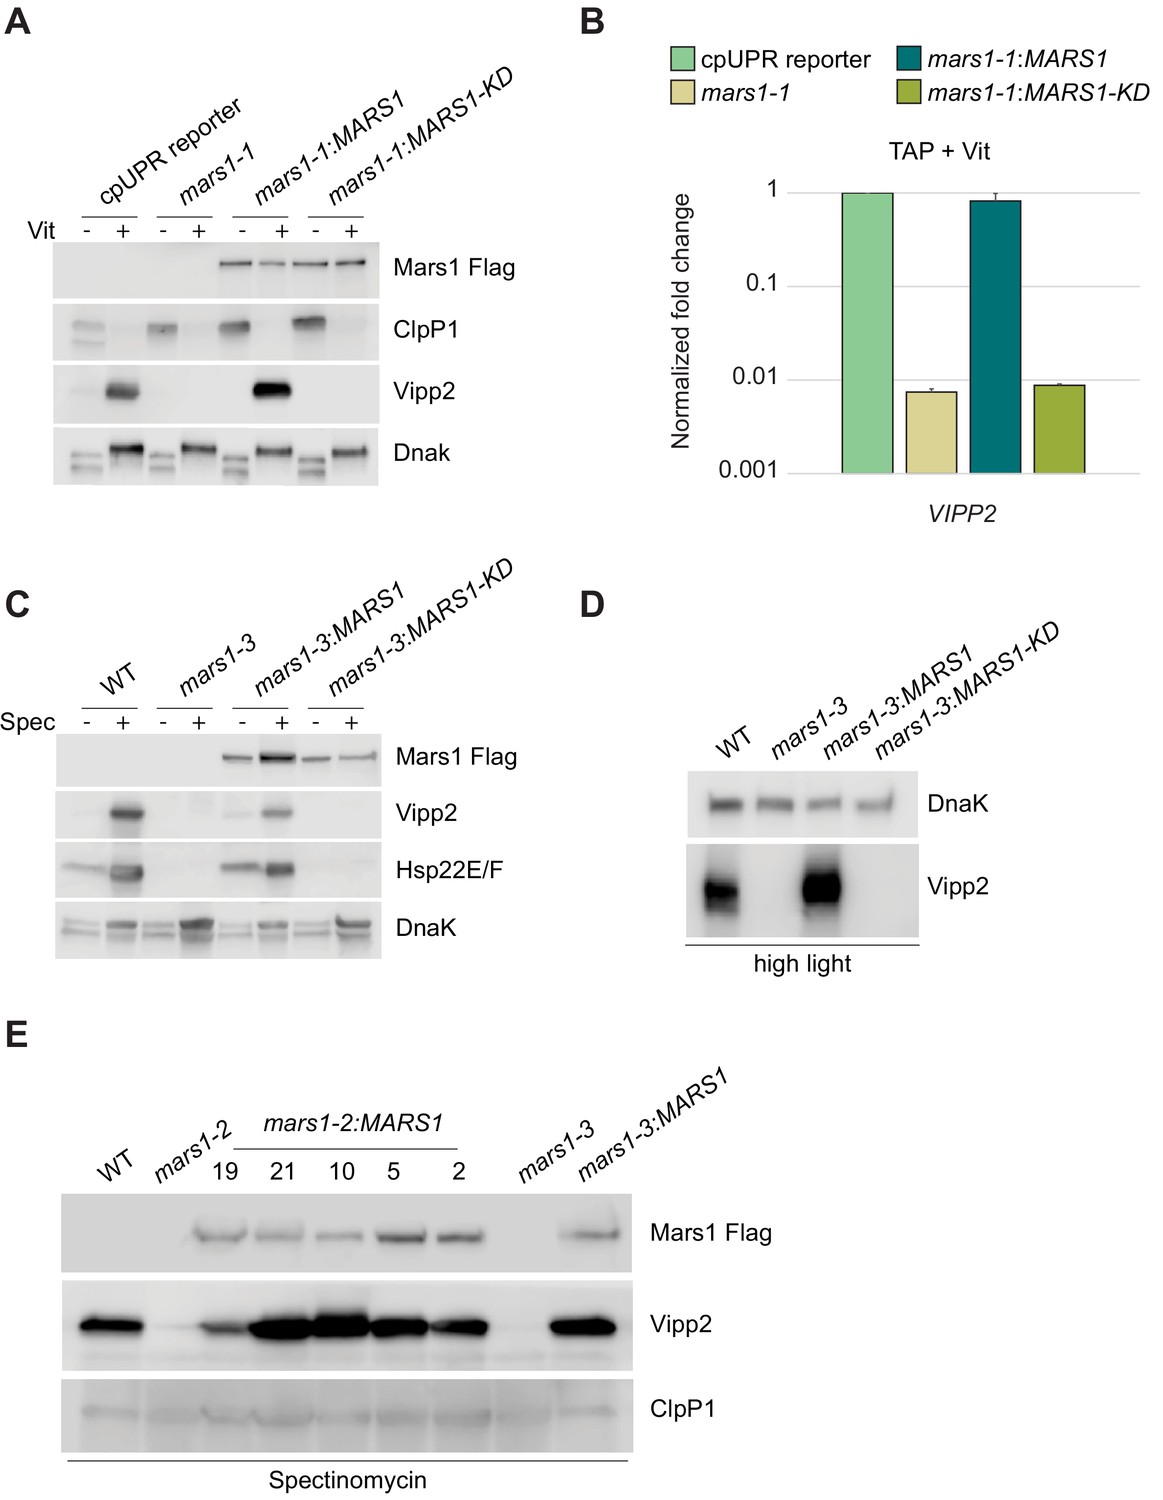
(A) Immunoblot analysis of samples prepared from strains described below grown in ClpP1-permissive (-Vit) and ClpP1-nonpermissive conditions (+Vit) using antibodies against Flag for Mars1 detection, Vipp2, Hsp22E/F, ClpP1, and DnaK for loading control; WT = backcrossed wild-type (E12 offspring from tetrad shown in Figure 2E); mars1−1 = backcrossed mars1-1 (F2 offspring from tetrad shown in Figure 2E); mars1-1:MARS1 = backcrossed mars1-1 transformed with a MARS1-A transgene containing a 3x-Flag epitope after Arg1167 of Mars1; mars1:MARS1-KD = backcrossed mars1- transformed with a catalytically-inactive MARS1-A transgene (bearing the D1871A mutation) (for more details about MARS1 tagging, see diagrams in Figure 3A and Supplementary Materials). (B) The same strains described in Figure 3—figure supplement 1A were subjected to quantitative PCR analysis and the level of expression of the VIPP2 transcripts was measured in ClpP1-nonpermissive conditions (TAP +Vit). GBLP was chosen as a reference gene during normalization. (C) Immunoblot analysis of samples prepared from strains described in Figure 3B treated in - /+ spectinomycin using antibodies against Flag for Mars1 detection, Vipp2, Hsp22E/F and DnaK for loading/stress control. (D) Immunoblot analysis of samples prepared from strains described in Figure 3E exposed to HL using antibodies against Vipp2 and DnaK for loading control. (E) Immunoblot analysis of WT, mars1-2 and several mars1-2:MARS1 samples treated with spectinomycin, using antibodies against Flag for Mars1 detection, Vipp2, and ClpP1 for loading control. Both WT (CrPW10) and mars1-2 (CrPW11), indicated in the figure, were obtained upon 3 backcrosses of mars1-2 to CC-124. mars1-2:MARS1 (19, 21, 10, 5, 2) are independently complemented strains obtained upon genomic integration of a wild-type MARS1-A transgene in mars1-2 (CrPW11). mars1-3 and mars1-3:MARS1 from Figure 3B were used as control strains.
Figure 3—figure supplement 2
Specific immunodetection of the Mars1 Flag protein.
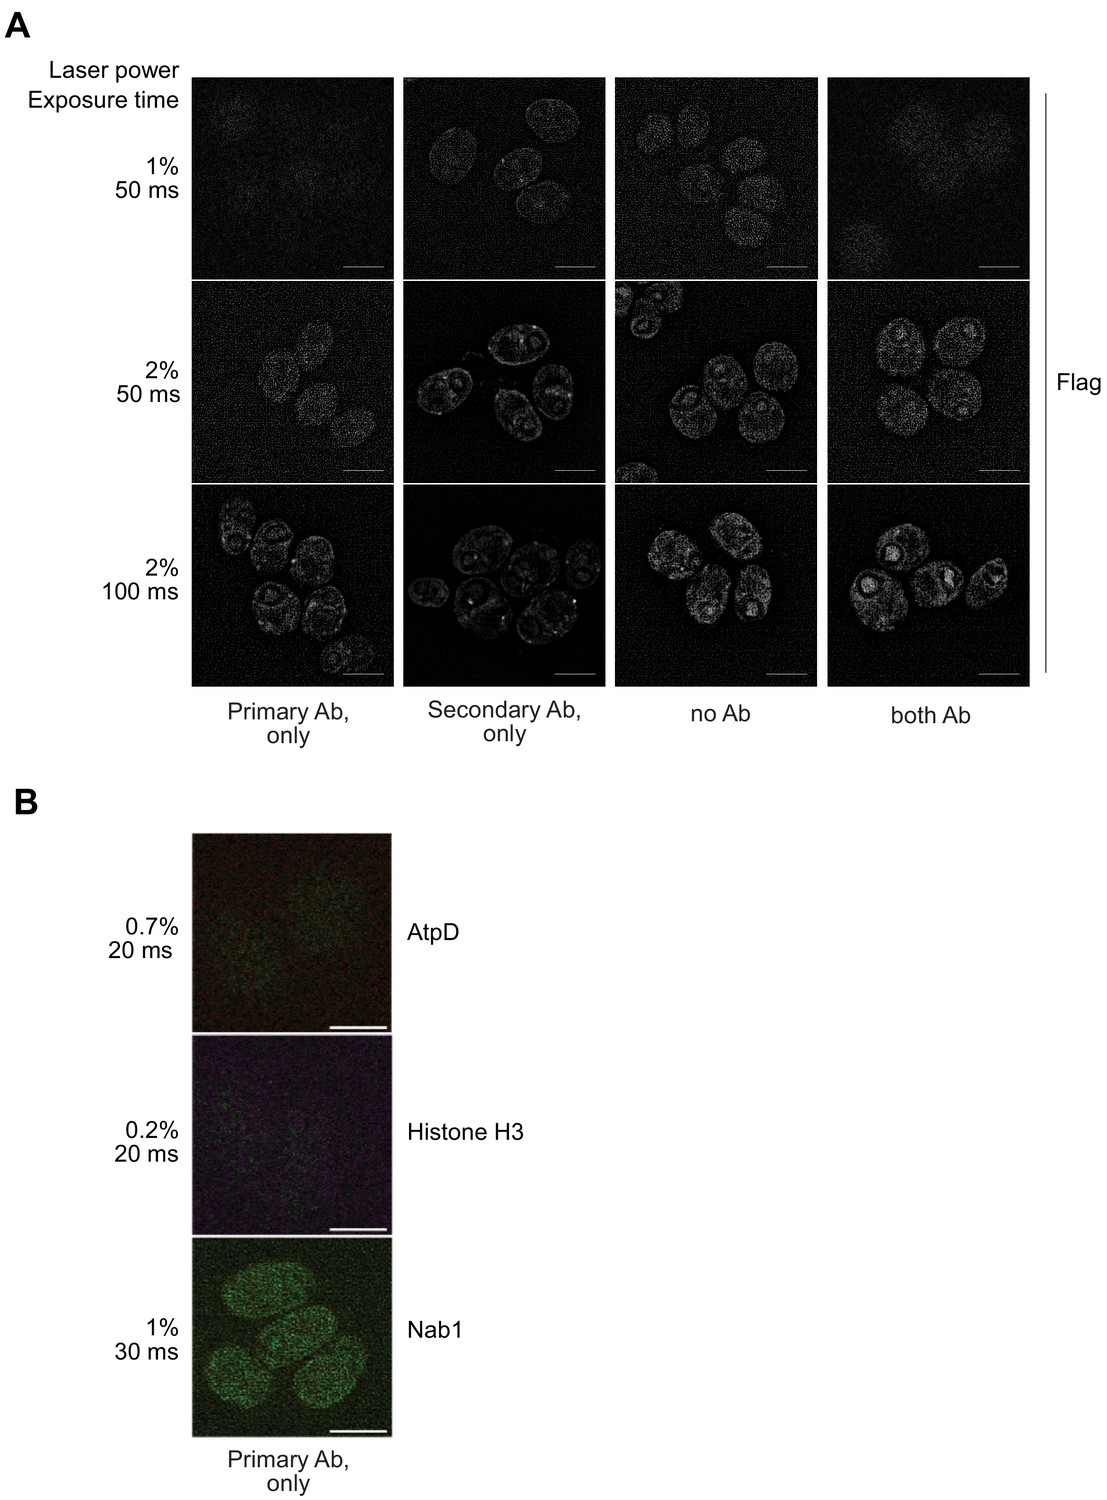
(A) WT cells (CC-4533) were grown in TAP medium, fixed for immunofluorescence (IF) staining with the indicated antibodies and imaged by structured illumination microscopy with the indicated laser intensity and exposure time. Scale bar: 5 µm. No specific signal was detected in any of the tested conditions, thus supporting the specificity of the Flag IF signal observed for Mars1, shown in Figure 3C. (B) mars1-3:MARS1-A cells were grown in TAP medium, fixed for immunofluorescence (IF) staining with the indicated antibodies and imaged by structured illumination microscopy with the indicated laser intensity and exposure time. Scale bar: 5 µm. No specific signal was detected in the absence of the secondary antibody, thus supporting the specificity of the IF signal observed for AtpD, Histone H3 and Nab1 shown in Figure 3C.
Figure 4 with 2 supplements
mars1 cells are hypersensitive to photooxidative stress.
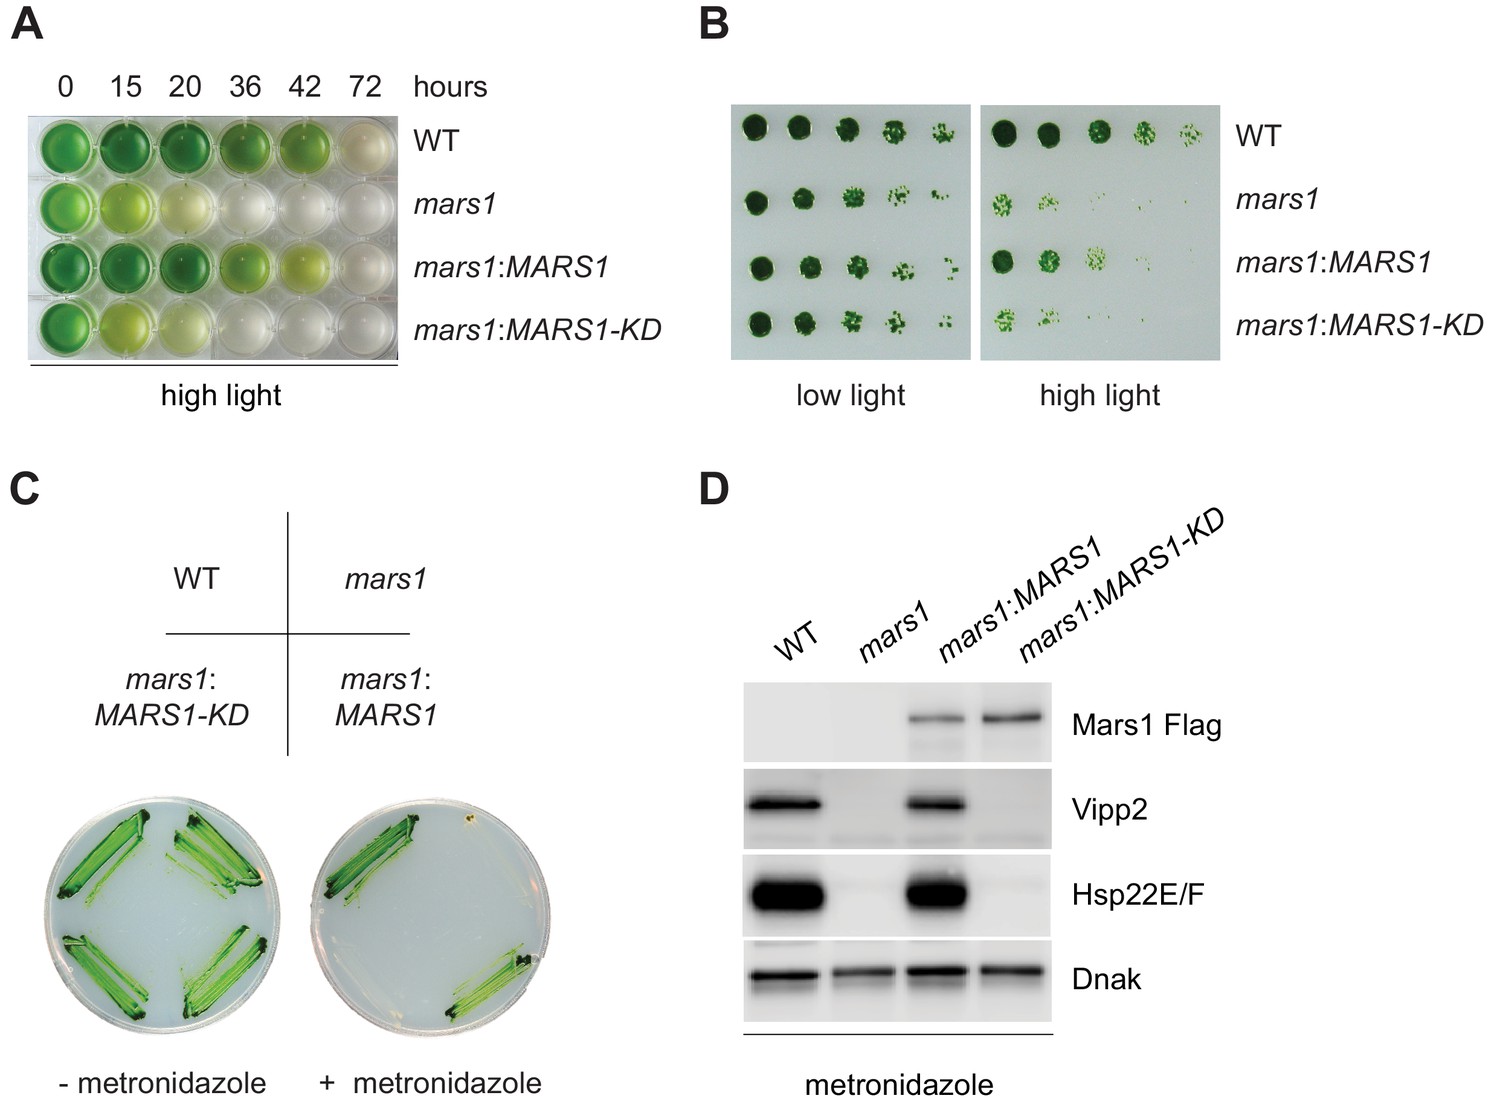
(A) Liquid TAP cultures of WT, mars1, mars1:MARS1-D and mars1:MARS1-D KD at different time points upon HL exposure. Alleles used: mars1 = mars1-3; mars1:MARS1-D = mars1-3 transformed with the MARS1-D transgene containing a 3x-Flag epitope after Met139; mars1:MARS1-D KD = mars1-3 transformed with a catalytically-inactive MARS1-D bearing the kinase active site D1871A mutation. (B) Strains described in Figure 4A were spotted onto TAP agar plate in 4-fold serial dilutions before and after exposure to high light for 27 hr. Photographs of untreated and treated cells were taken after 6 and 7 days, respectively, of growth in low light. (C) Strains described in Figure 4A were streaked on -/+ 1.5 mM metronidazole TAP agar plates. Photographs were taken after 4 days of growth in normal light. (D) Immunoblot analysis of samples prepared from strains described in Figure 4A treated with 1.1 mM metronidazole for 15 hours. Detection with antibodies against Flag (Mars1), Vipp2, Hsp22E/F, and ClpP1 (loading control).
Figure 4—figure supplement 1
Mars1 confers protection against photooxidative stress.
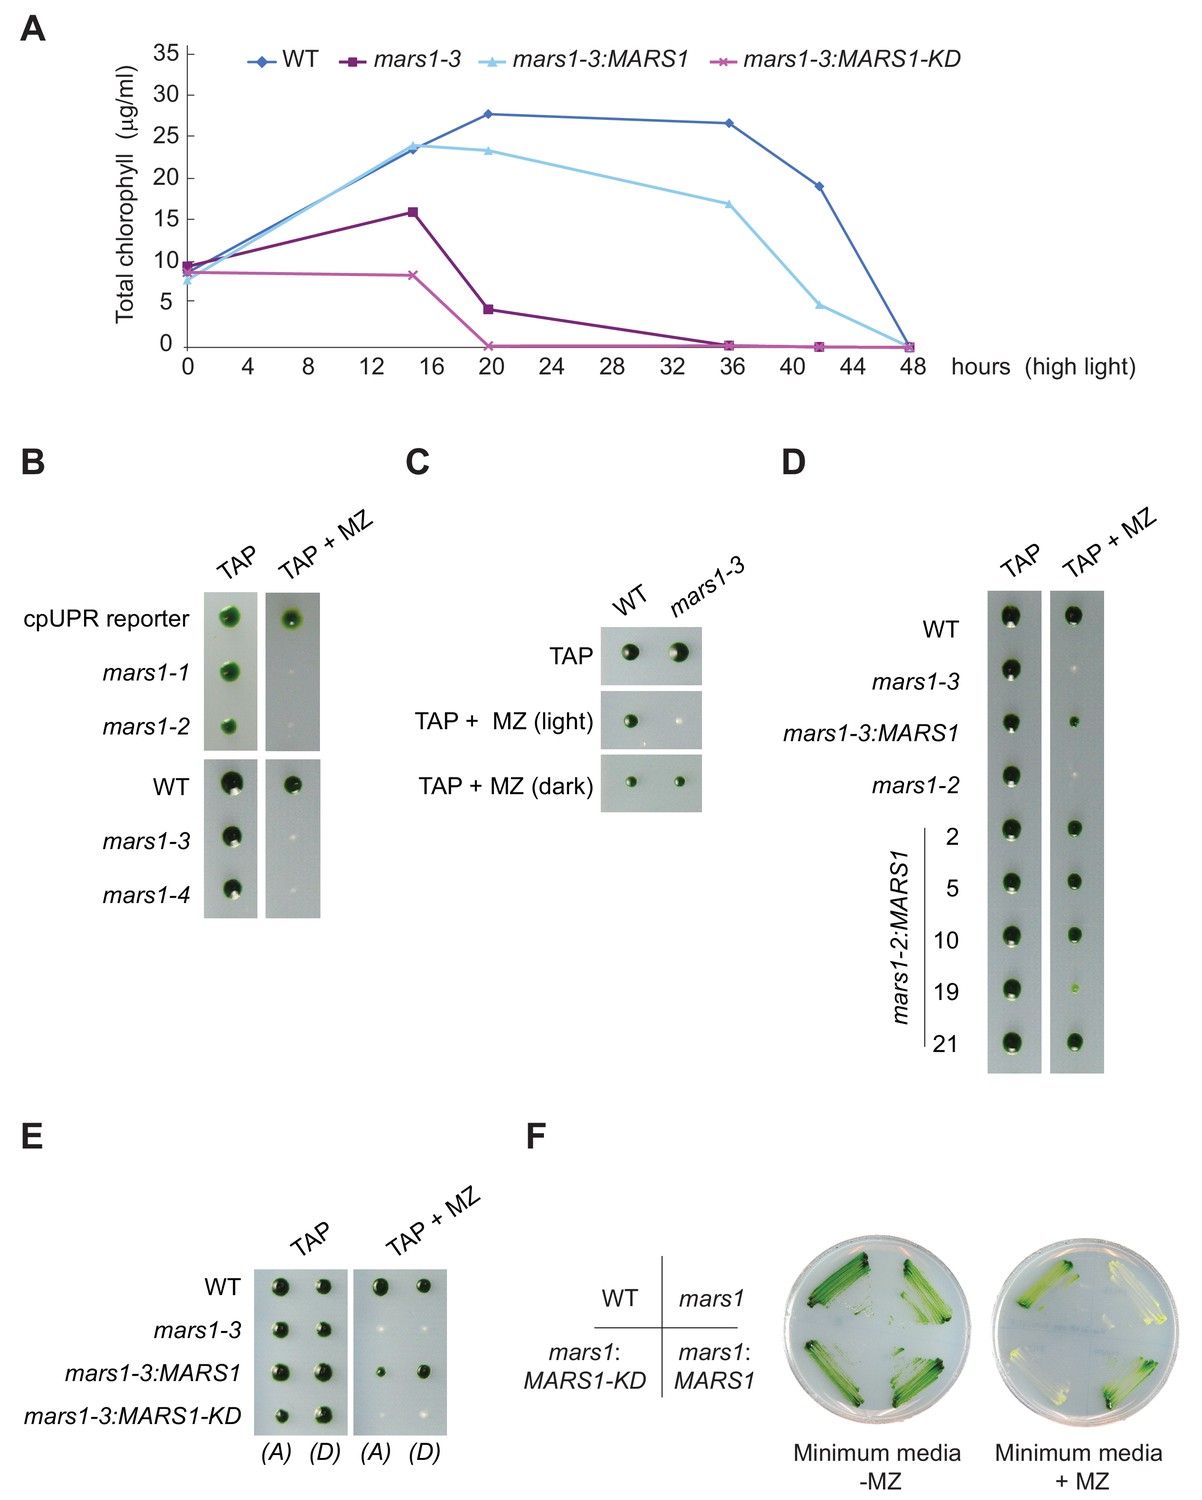
(A) Line charts of total chlorophyll concentrations measured from liquid TAP cultures of strains described in Figure 4A during high light treatment, at the indicated time points. (B) The following strains: cpUPR reporter (CrPW1), mars1-1, mars1-2, WT (WT CC-4533), mars1-3 and mars1-4 were replica plated in -/+ 1.5 mM metronidazole (MZ) TAP agar. Photographs were taken after 9 days of growth in normal light. (C) Metronidazole assay with WT (CC-4533) and mars1-3. The strains were replica plated on TAP agar with or without 1.5 mM metronidazole (MZ), in the presence or absence of light (i.e. photoheterotrophic or heterotrophic conditions). Photographs were taken after 7 days. (D) Metronidazole assay with cells strains shown in Figure 3—figure supplement 1E. The strains were replica plated on TAP agar with or without 1.5 mM metronidazole (MZ). Photographs were taken after 9 days of growth in normal light. The insertion of a 3x-Flag-tagged MARS1 transgene (MARS1-A) rescues the metronidazole-sensitivity of the mars1-2 mutant as seen in several independently complemented lines ( 2, 5, 10, 19, 21). (E) Side-by-side comparison of metronidazole-sensitivity of mars1:3 transformed with wild-type or kinase-dead versions of MARS1-A or MARS1-D transgenes. WT (CC-4533) and mars1-3 are used as negative and positive controls, respectively. Both wild-type MARS1 transgenes can rescue the metronidazole-sensitivity of the mars1-3 mutant, although at different levels. In both cases, the rescue is dependent on the kinase activity. Since the best rescue was observed with MARS1-D transgene, this strain was chosen for the high light and metronidazole assays shown in Figure 4A–D. (F) Metronidazole assay with strains used in Figure 4A–D, using minimal media where cells can only grow if they are photosynthetic-competent (i.e. phototrophic conditions). In the absence of metronidazole, all strains grew equally well. However, in the presence of metronidazole, only WT cells (CC-4533) and mars1-3 strains complemented with a MARS1-D transgene survived.
-
Figure 4—figure supplement 1—source data 1
Chlorophyll measurements during high light stress.
- https://cdn.elifesciences.org/articles/49577/elife-49577-fig4-figsupp1-data1-v2.xlsx
Figure 4—figure supplement 2
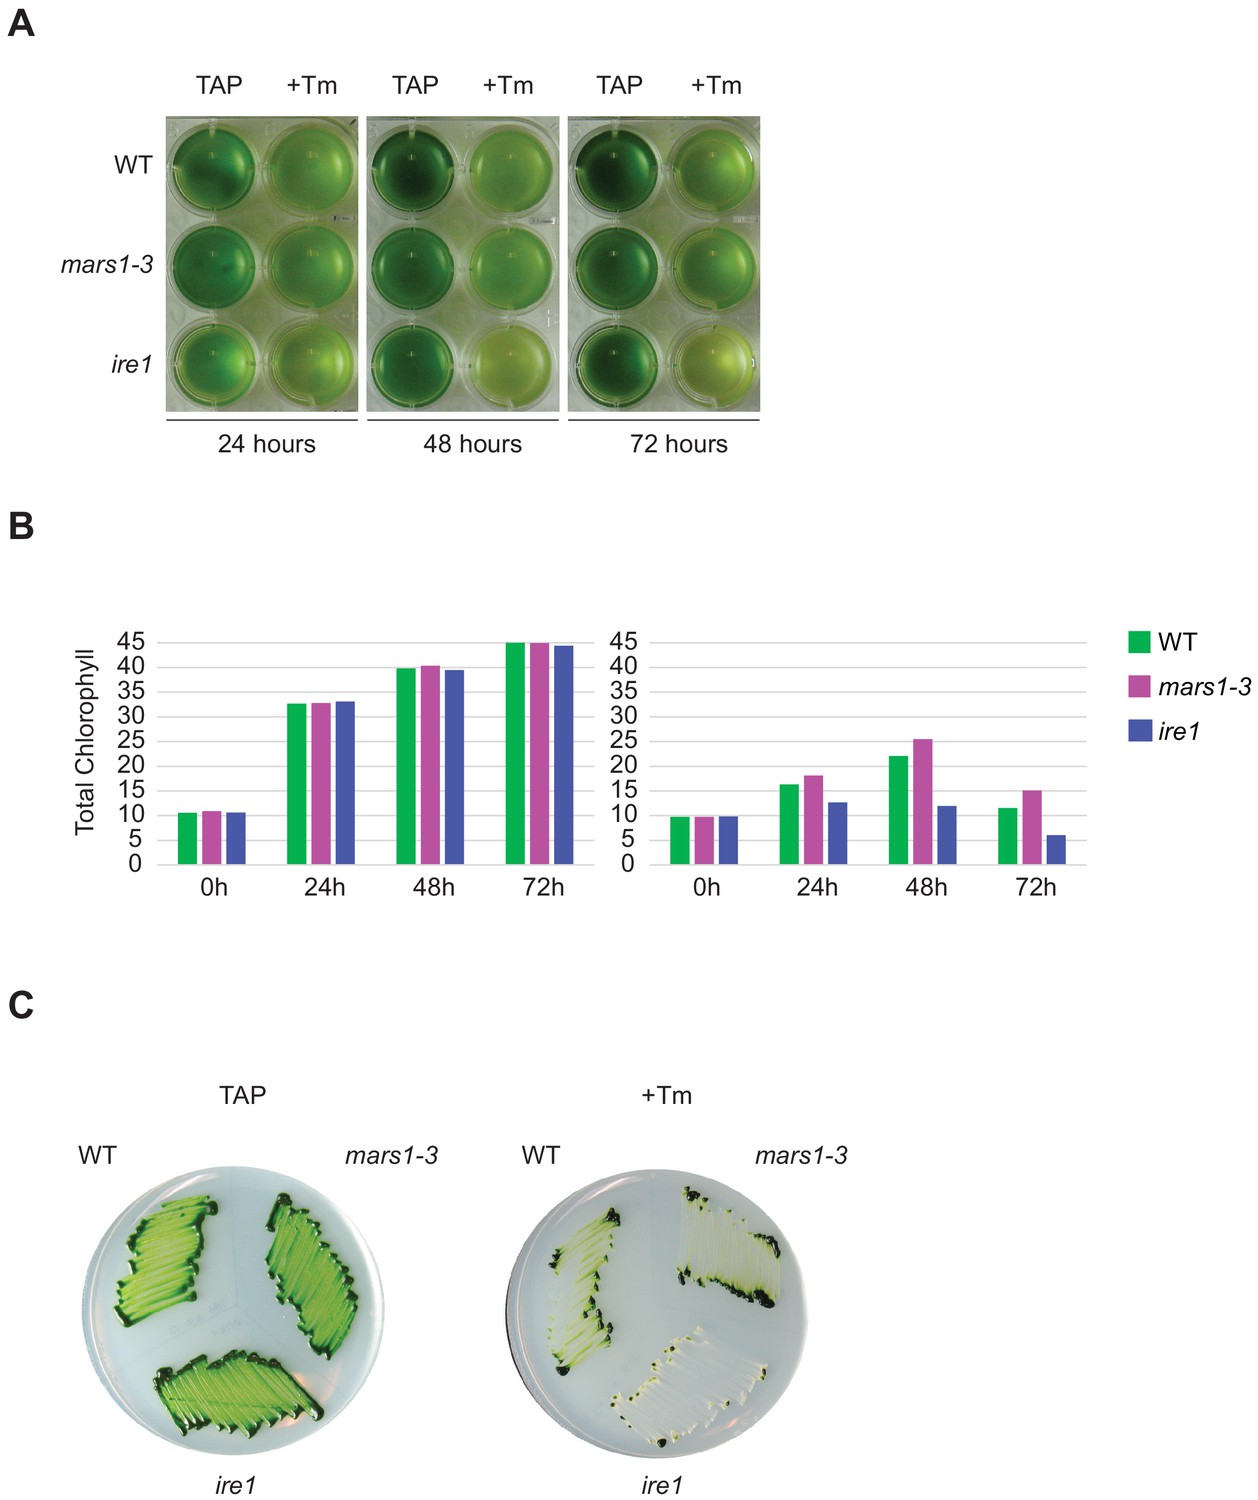
mars1 cells can cope with ER stress.
(A) WT, mars1-3 and ire1 cells grown till log phase were harvested and resuspended to a final chlorophyll concentration of ~10 µg/ml in liquid TAP with or without 5 µg/ml of tunicamycin (Tm), a chemical ER stressor. Cultures were sampled at 24, 48 and 72 hr to take photographs and measure total chlorophyll concentration. ire1 cells were used as a positive control given the essential role of the Ire1 kinase in the activation of the erUPR (Yamaoka et al., 2018). (B) Histograms of total chlorophyll concentrations (µg/ml) measured from TAP liquid cultures collected during the experiment described in Figure 4—figure supplement 2A. (C) WT, mars1-3 and ire1 cells were streaked on TAP agar plates with or without 0.2 µg/ml of tunicamycin. Photographs were taken after 5 days of growth in normal light.
Figure 5 with 5 supplements
mars1 cells do not activate the cpUPR transcriptional program.
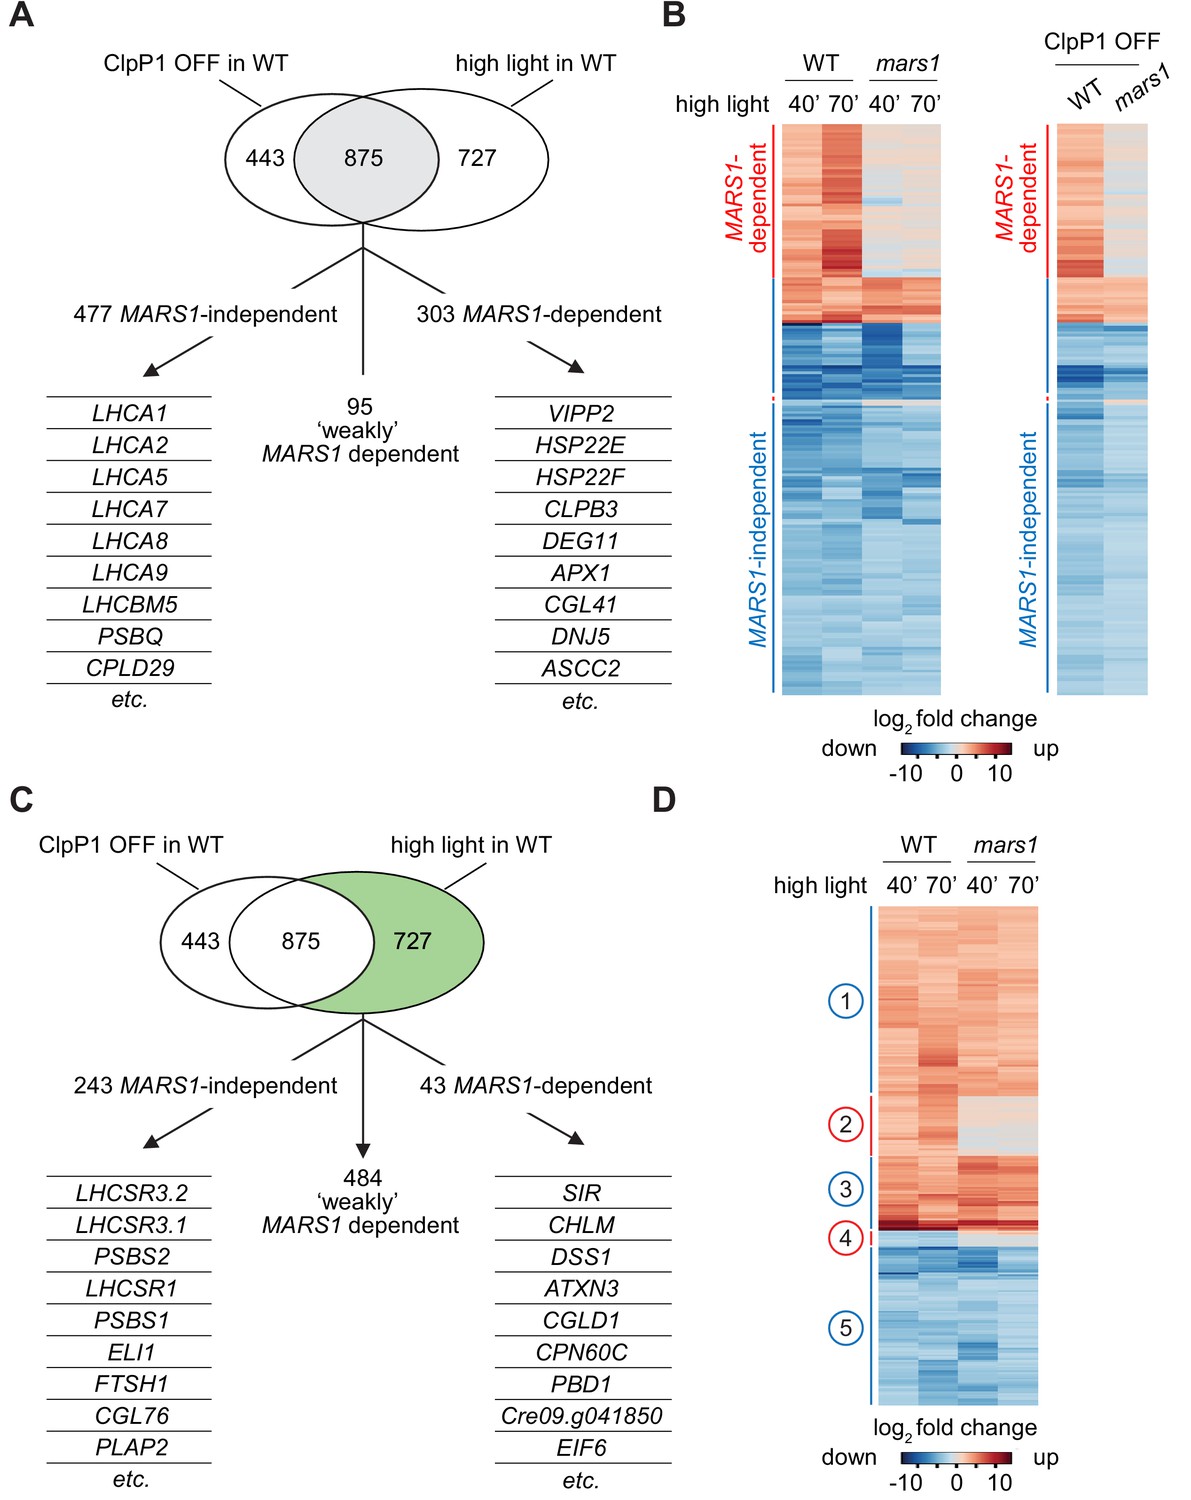
(A) Venn diagram highlighting the transcriptional changes elicited genetically (ClpP1 repression) or physiologically (HL exposure) in Chlamydomonas cells , as determined by RNA sequencing (overlap in gray). The 875 common stress-responsive genes are defined as genes whose expression showed at least a 4-fold change upon stress (p<0.001) and were consistently up- or down-regulated in both high light and ClpP1 repression. These genes are further subdivided in three groups: 1) MARS1-dependent, being unresponsive (<2-fold change) when MARS1 was disrupted; 2) ‘weakly’ MARS1 dependent, being only mildly induced or inhibited (<4-fold but >2-fold) upon stress in the mars1 background; and 3) MARS1-independent, being still responsive (<2-fold change) in absence of MARS1 expression. A short list of genes belonging to each category (MARS1-dependent and MARS1-independent) is provided. Full lists of MARS1-dependent and MARS1-independent genes are available through Figshare (https://figshare.com/s/992706a610ce6b71f03c and https://figshare.com/s/66417c2b28f3110b8077). (B) Heat-map comparing gene expression patterns of the 875 common stress-responsive genes (as defined in Figure 5A) in WT and mars1 cells upon exposure to HL (for 40 or 70 min) or in ClpP1-nonpermissive conditions (+Vit). (C) The same Venn diagram shown in Figure 5A highlighting (in green) genes that are preferentially responsive to HL exposure (>4-fold change only upon HL stress, p<0.001, and consistently up- or down-regulated in both time points during HL stress). These 727 genes are further categorized based on their gene expression dependency on MARS1. A short list of genes belonging to each category (MARS1-dependent and MARS1-independent) is provided. MARS1-dependent genes are related to chloroplast protein folding and degradation, protein translation or are poorly characterized. By contrast, the list of MARS1-independent genes includes key regulators of nonphotochemical quenching such as LHCSR and PSBS genes. HL = high light; ClpP1 OFF = ClpP1 repression. (D) Heatmap showing genes that are preferentially responsive to HL exposure. Five clusters of genes are highlighted on the side. Numbers circled in blue and red indicate gene clusters not affected and affected by MARS1 disruption, respectively.
Figure 5—figure supplement 1
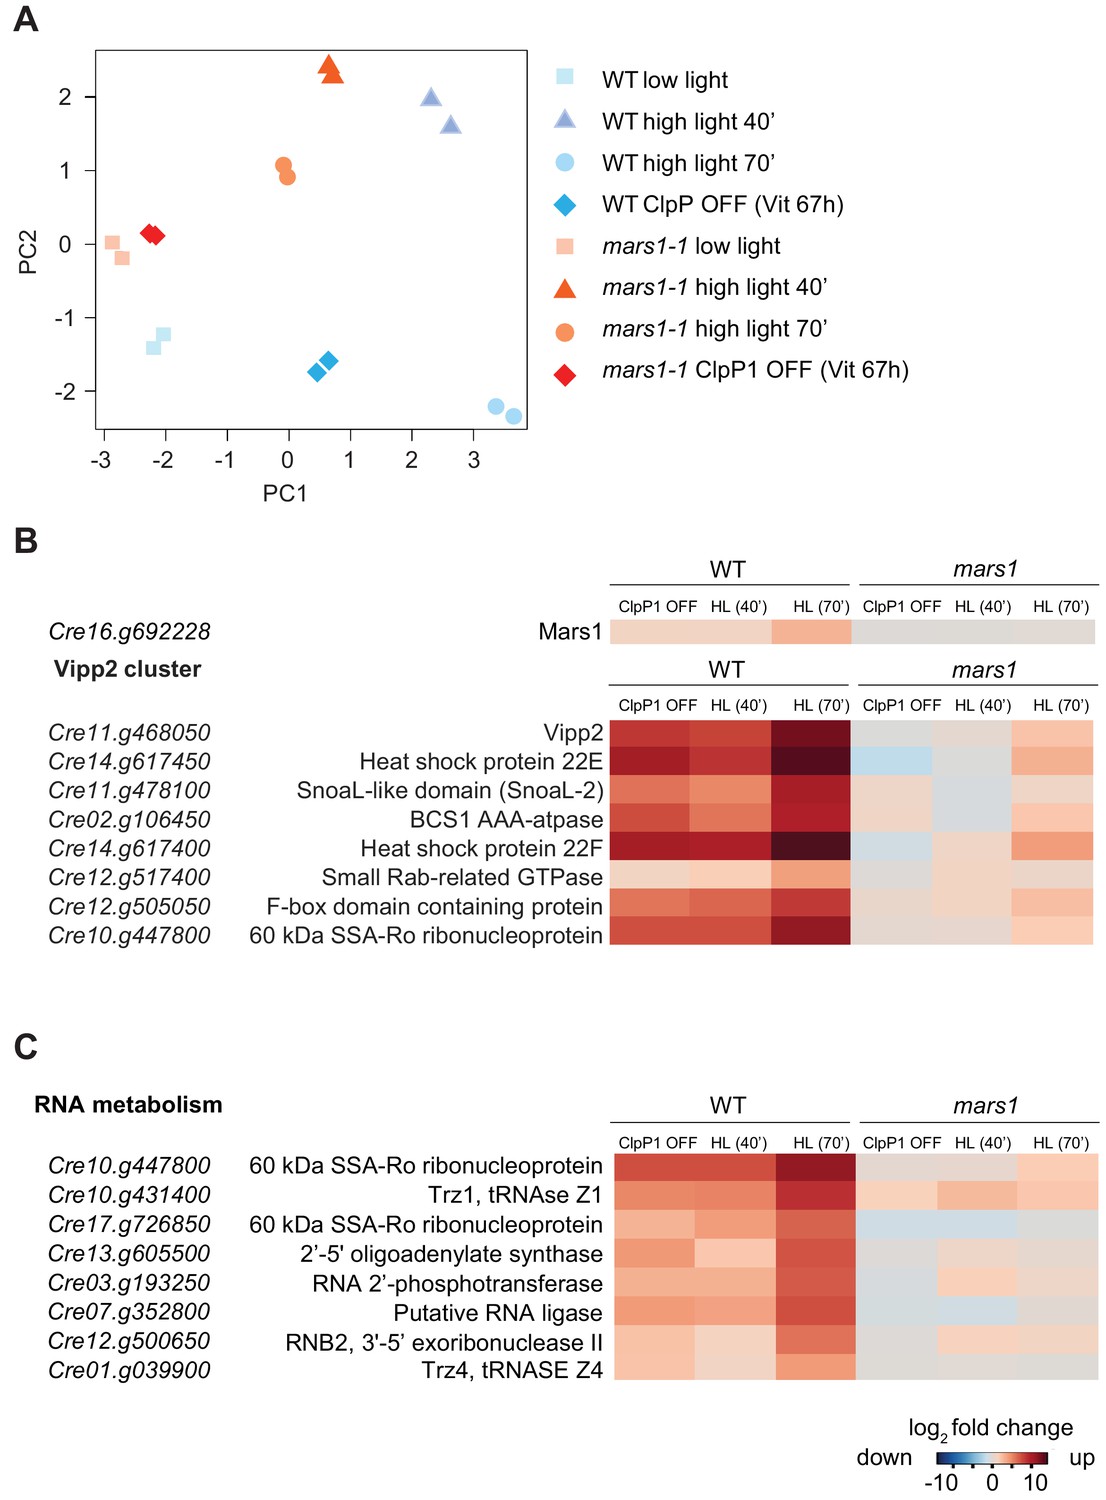
mars1 cells do not induce the cpUPR transcriptional program.
(A) The multidimensional scaling plot illustrates the distance between RNA-seq samples, calculated as leading biological coefficient of variation between samples, based on the log2-fold change of top genes. WT, stressed and unstressed cells are more dispersed than those in the mars1-1 background, indicating that the MARS1 gene deletion affects both high light and ClpP1 repression responses. High light 40’=exposed to high light for 40 min; high light 70’=exposed to high light for 70 min; ClpP OFF = ClpP repression. PC1 = dimension 1; PC2 = dimension 2. (B) Heatmap comparing the VIPP2 cluster gene expression patterns in WT and mars1-1 upon HL exposure (40 and 70 min) and ClpP1 repression. MARS1 disruption abrogates the induction of almost every gene in the VIPP2 cluster. HL = high light; ClpP1 OFF = ClpP1 repression. (C) Heatmap comparing expression pattern of manually-selected genes involved in RNA metabolism in WT and mars1-1 upon HL exposure (40 and 70 min) and ClpP1 repression. MARS1 disruption impairs the induction of these genes. HL = high light.
Figure 5—figure supplement 2
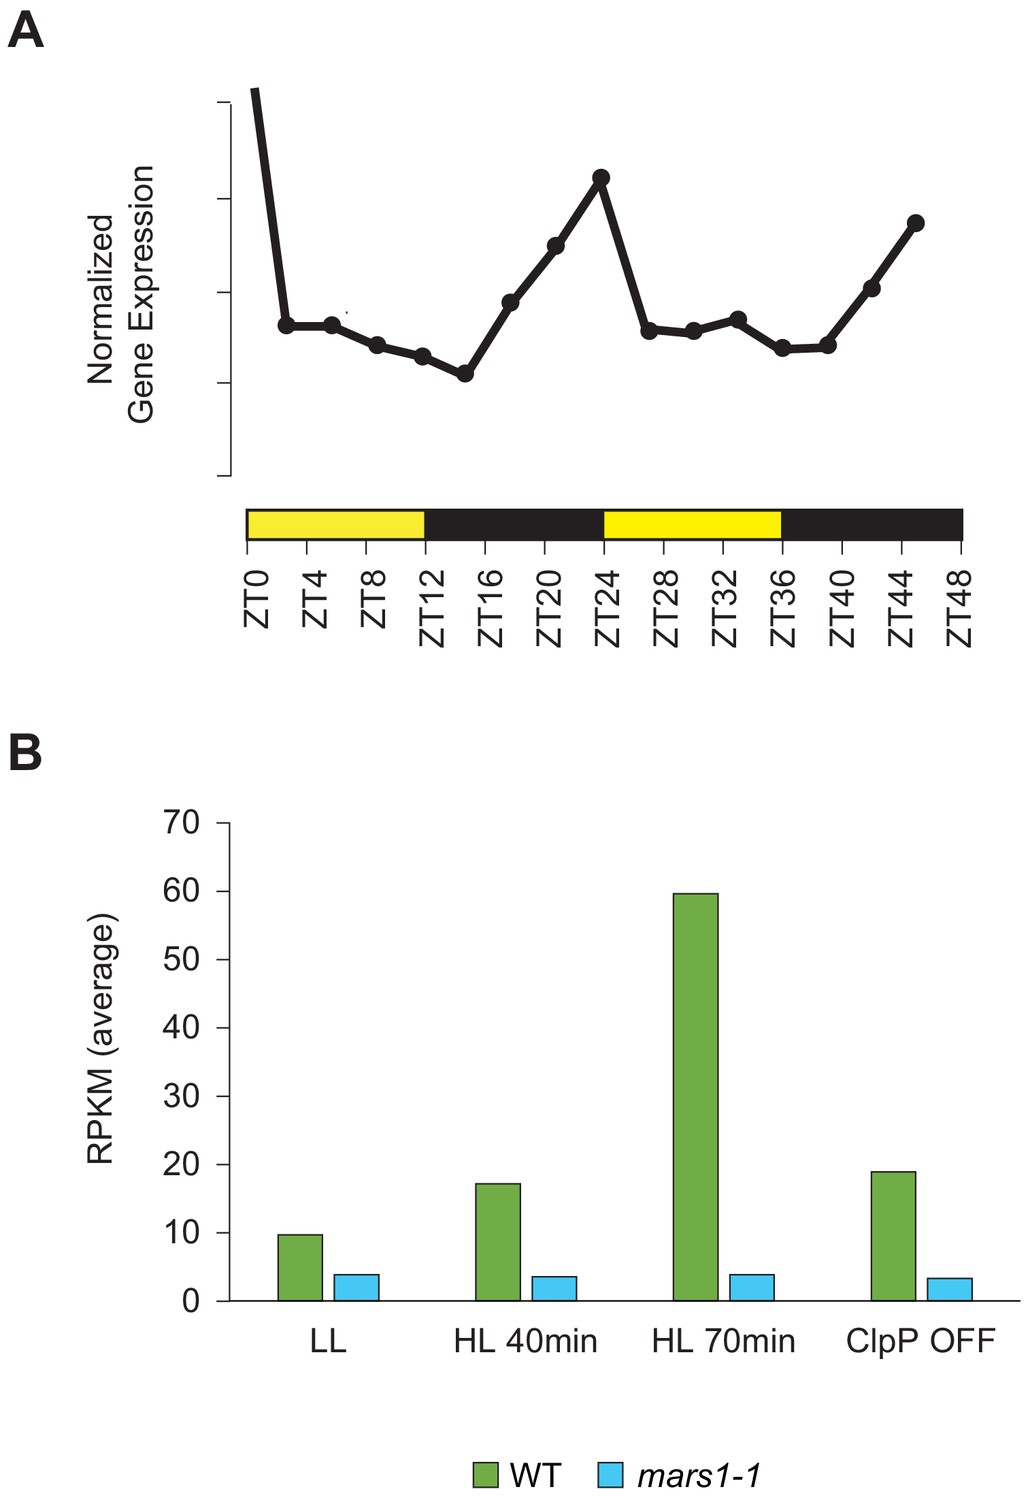
MARS1 gene expression pattern.
(A) MARS1 mRNA expression profile according to CircadiaNET, a web-based developed tool integrating RNA-Seq data generated over 24 hr periods in neutral day conditions (12 hr light/12 hr dark) from the eudicot Arabidopsis thaliana and the microalgae Chlamydomonas reinhardtii and Ostreococcus tauri. (http://viridiplantae.ibvf.csic.es/circadiaNet/index.html). MARS1 gene shows a circadian expression pattern (p-value of 1.53 e-11) and clusters with a group of 1212 genes exhibiting their expression peaks at dawn and their expression troughs at night (http://viridiplantae.ibvf.csic.es/circadiaNet/clusters/cre/cre_trough_dark_peak_dark_light.html). (B) MARS1 mRNA expression level (average Reads Per Kilobase Million –RPKM-) in WT and mars1-1 mutant subjected to high light treatment for 40 or 70 min or to ClpP1 down-regulation for 68 hr. (Raw values are available in Figure 5—figure supplement 2—source data 1 and Supplementary file 2).
-
Figure 5—figure supplement 2—source data 1
MARS1 transcript levels (RPKM values).
- https://cdn.elifesciences.org/articles/49577/elife-49577-fig5-figsupp2-data1-v2.xlsx
Figure 5—figure supplement 3
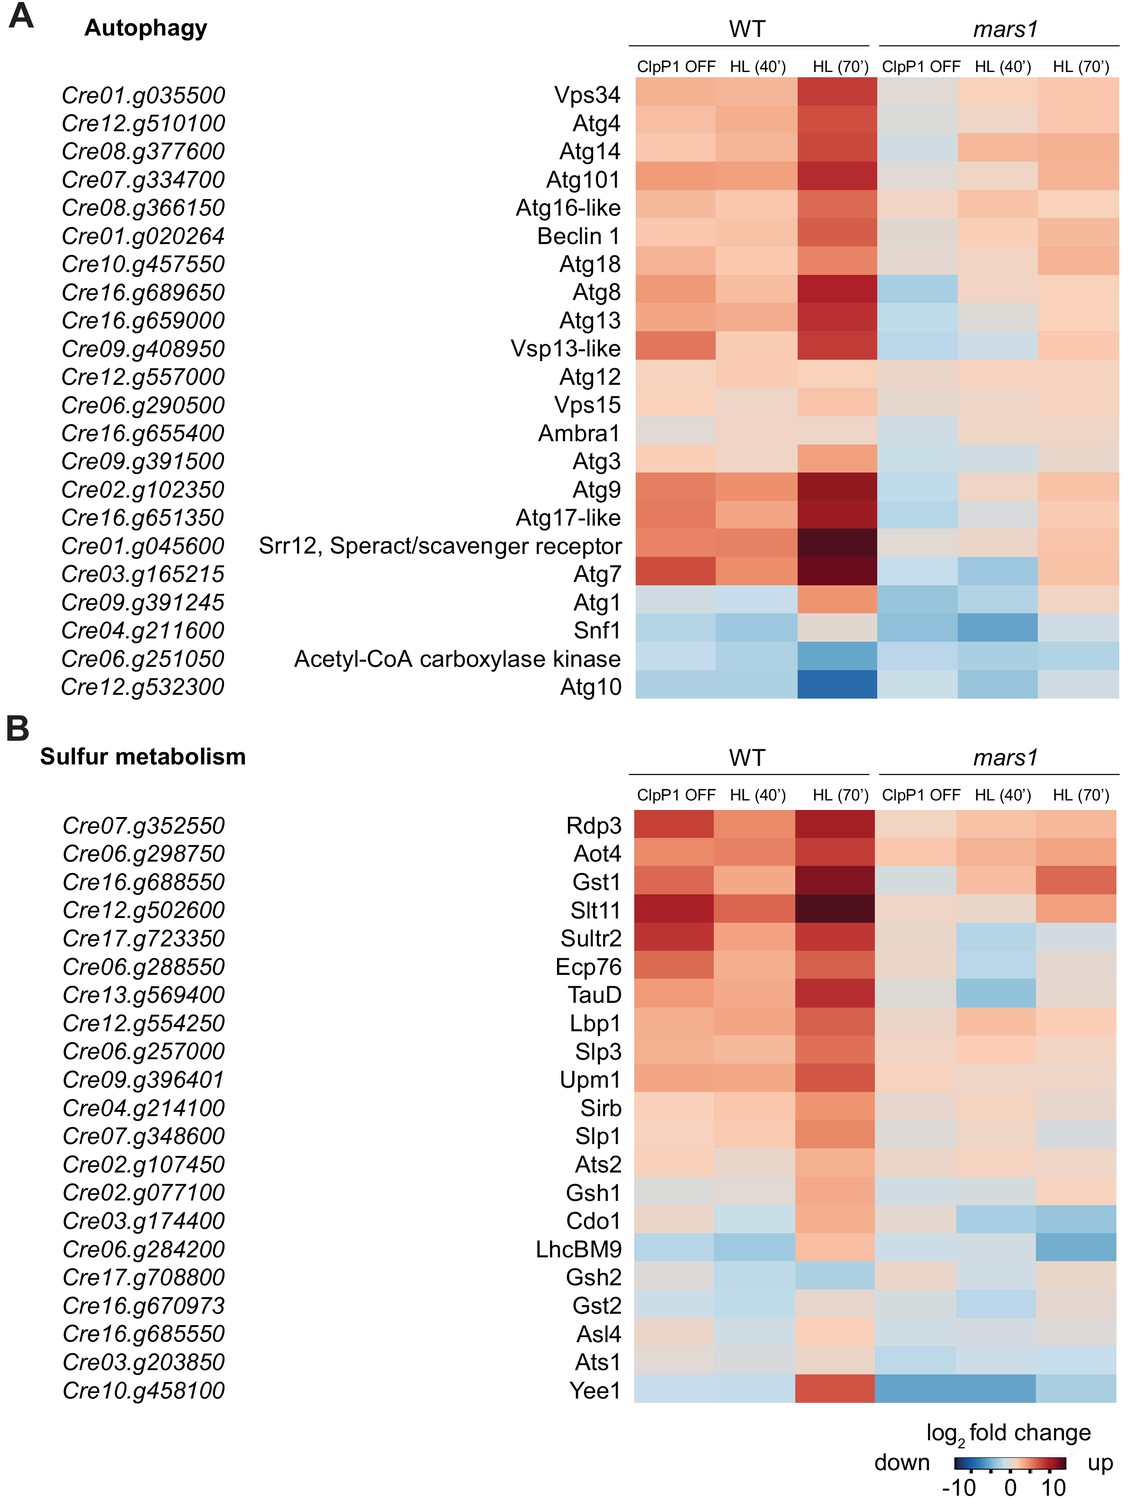
mars1 cells do not activate autophagy and sulfur starvation genes during cpUPR inducing conditions.
(A) Heatmap comparing expression pattern of manually-selected genes involved autophagy in WT and mars1-1 mutant upon HL exposure (40 and 70 min) and ClpP1 repression. MARS1 disruption impairs the induction of a small subset of autophagy genes. HL = high light; ClpP1 OFF = ClpP1 repression. (B) Heatmap comparing expression pattern of manually-selected genes involved sulfur assimilation and metabolism in WT and mars1-1 mutant upon high light exposure (40 and 70 min) and ClpP1 repression. Surprisingly, both chloroplast stresses induce many of these genes and MARS1 disruption impairs induction of a subset of them. HL = high light; ClpP1 OFF = ClpP1 repression.
Figure 5—figure supplement 4
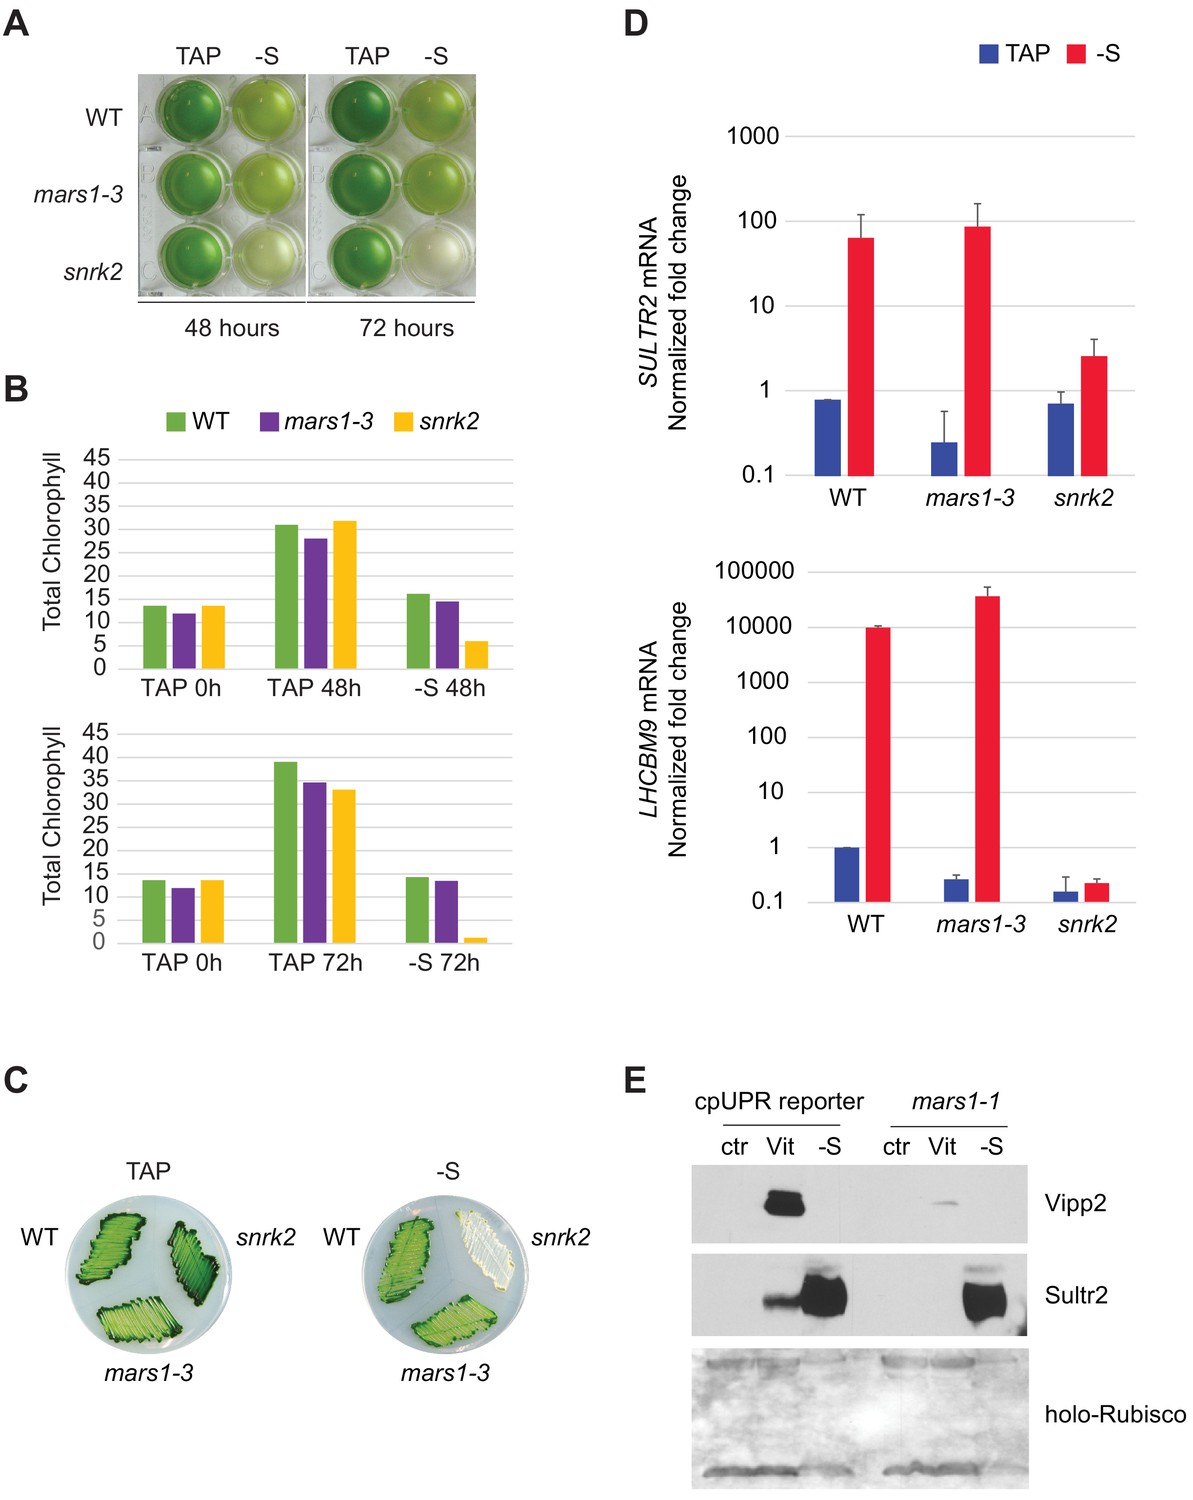
mars1 cells activate sulfur starvation genes and survive in sulfur-limiting conditions.
(A) WT, mars1-3 and snrk2 cells grown till saturation were harvested, washed twice in sulfur-depleted TAP (-S) and resuspended in TAP or sulfur-depleted TAP to a final chlorophyll concentration of ~13 µg/ml. Cultures were sampled at 48 and 72 hr to take photographs and measure total chlorophyll concentration. snrk2 cells were used as a positive control given the essential role of the Snrk2/Stpk12 kinase in the activation of the sulfur starvation response (González-Ballester et al., 2010; Gonzalez-Ballester et al., 2008). (B) Histograms of total chlorophyll concentrations (µg/ml) measured from TAP liquid cultures collected during the experiment described in Figure 5—figure supplement 4A. (C) WT, mars1-3 and snrk2 cells were streaked on TAP or sulfur-depleted TAP (-S) agar plates. Photographs were taken after 12 days of growth in normal light. (D) The same strains described in Figure 5—figure supplement 4A were subjected to quantitative PCR analysis and the level of expression of SULTR2 and LHCBM9 transcripts, encoding two sulfur starvation-responsive proteins (González-Ballester et al., 2010; Pootakham et al., 2010), was measured after 24 hours of growth in TAP or sulfur-depleted TAP (-S). GBLP was chosen as reference gene during normalization. (E) Immunoblot analysis of samples prepared from the cpUPR reporter and mars1 cells grown in ClpP1-permissive (ctr) and ClpP1-nonpermissive (Vit) conditions or subjected to sulfur starvation (-S) for 2 days using antibodies against Vipp2, SultR2 and holo-Rubisco (as loading control).
Figure 5—figure supplement 5
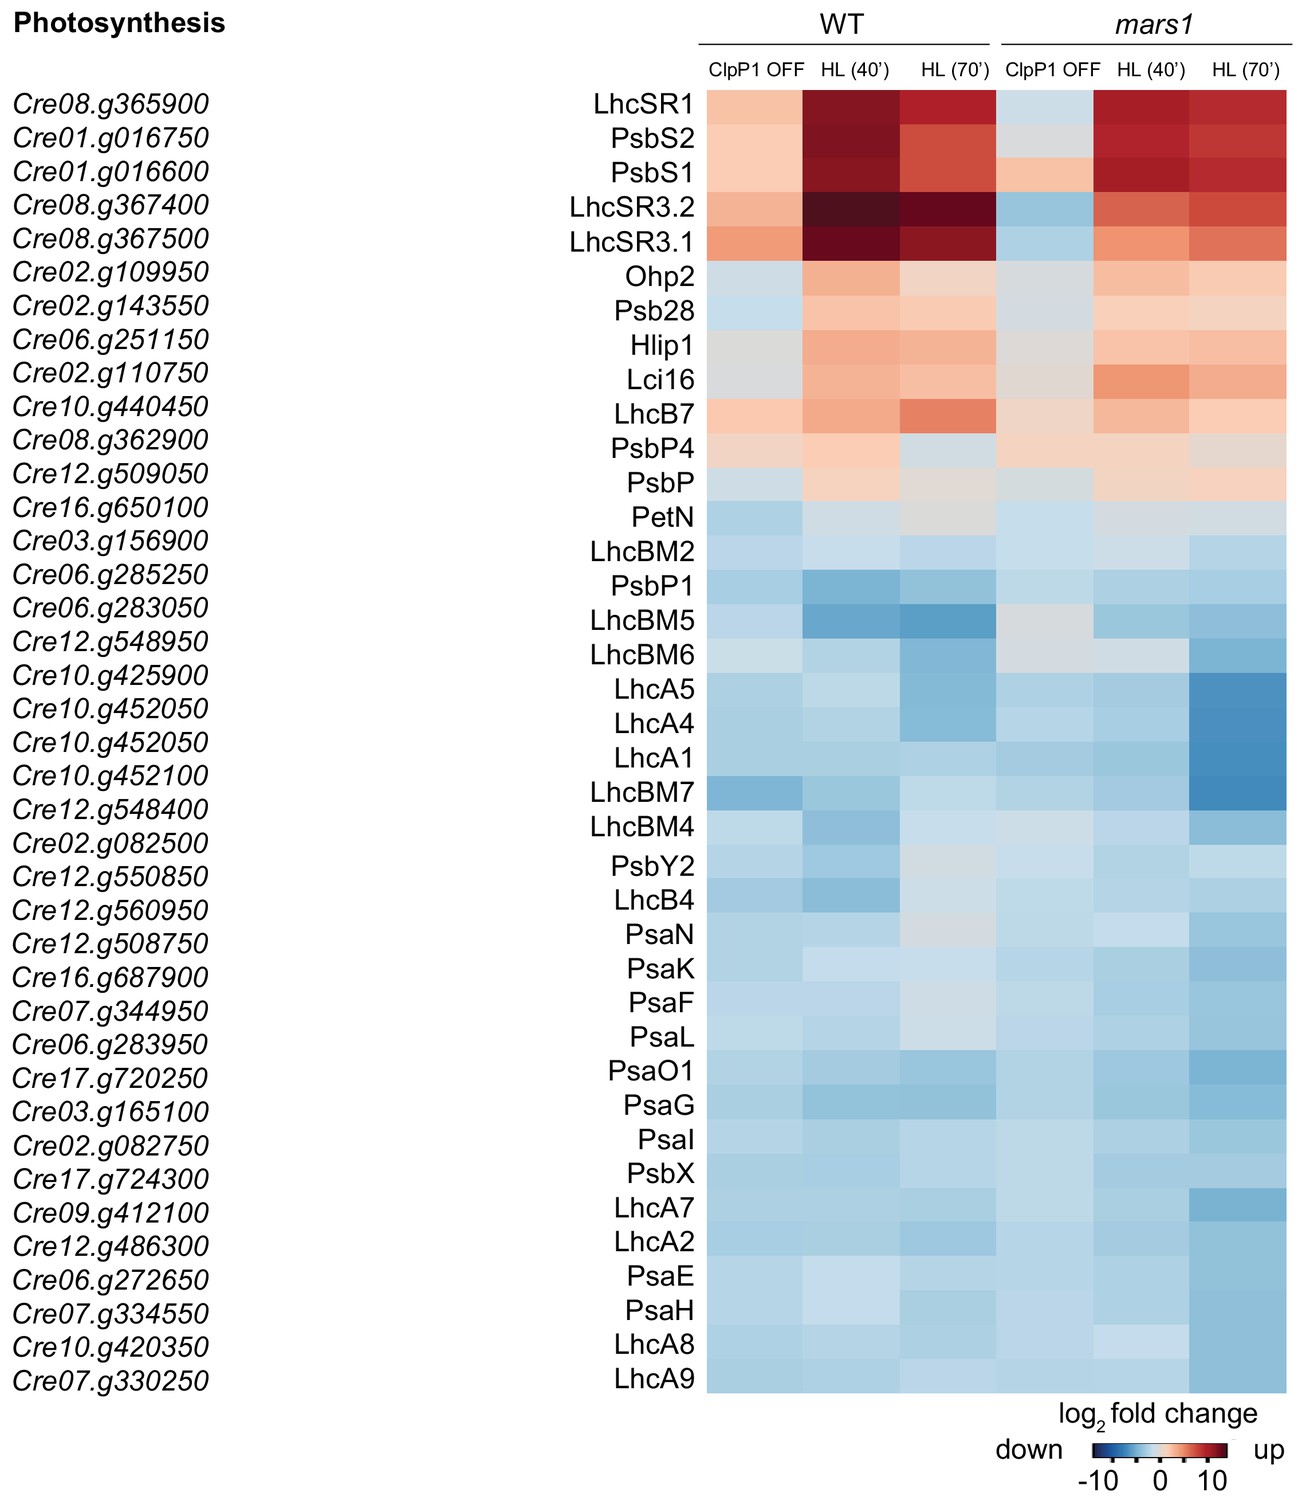
Regulation of photosynthesis-associated genes is not affected in mars1 cells.
Heatmap comparing expression patterns of manually-selected genes involved in photosynthesis in WT and mars1-1 mutant upon high light exposure (40 and 70 min) and ClpP1 repression. HL = high light; ClpP1 OFF = ClpP1 repression.
Figure 6 with 1 supplement
Basal induction of the cpUPR renders cells more resistant to chloroplast stress.
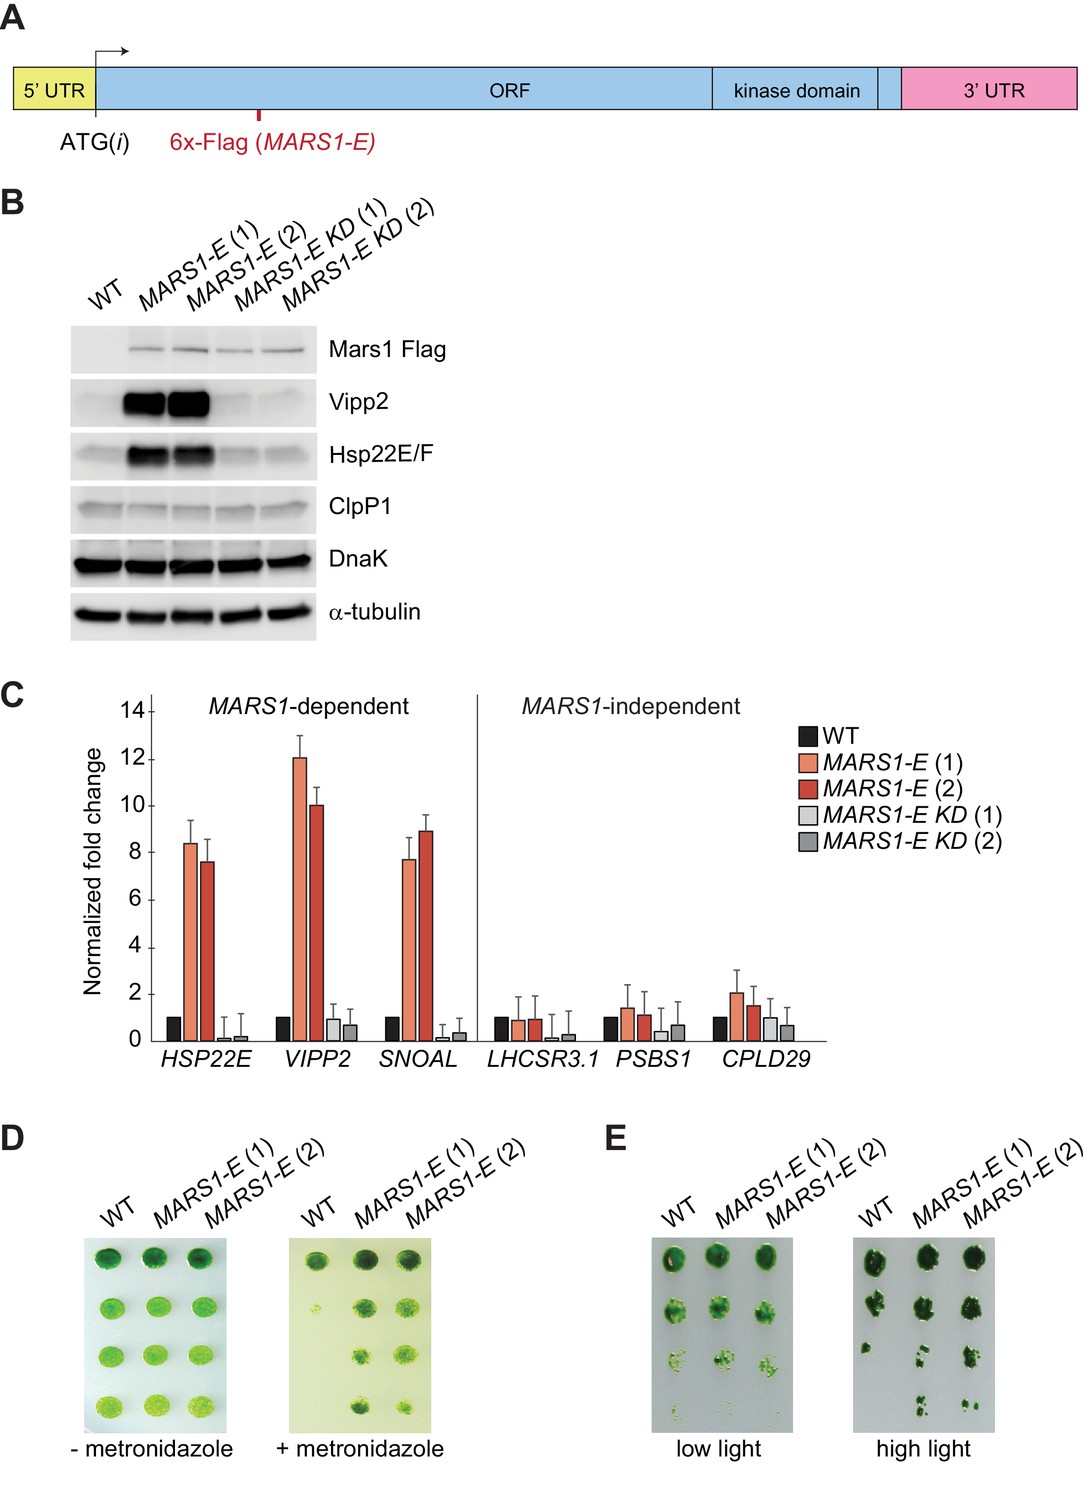
(A) A diagram of MARS1-E transcript showing the position of the 6x-Flag epitope inserted after Leu402 of Mars1. (B) Immunoblot analysis of samples prepared from cells grown under normal conditions, using antibodies described in Figure 3. Strains used: MARS1-E (1) and (2) = WT cells expressing a MARS1-E transgene; MARS1-E KD (1) and (2) = WT cells expressing a catalytically-inactive MARS1-E transgene bearing the D1871A mutation. (C) Expression level of MARS1-dependent or MARS1-independent transcripts determined by quantitative PCR under normal growth conditions in cpUPR constitutive-active cells described in Figure 6B. Reference gene for normalization: GBLP. (D) cpUPR constitutive-active cells (described in Figure 6B) were grown in liquid TAP until logarithmic phase, diluted to the same cell count and spotted onto +/- 2.2 mM metronidazole agar plates using 1.5-fold dilutions between spots. Photographs of untreated and treated cells were taken after 3 and 6 days, respectively, of growth in normal light. (E) Cells as in Figure 6D spotted onto TAP agar using 4-fold serial dilutions before or after exposure to HL. Photographs were taken after 7 days of growth in normal light.
Figure 6—figure supplement 1
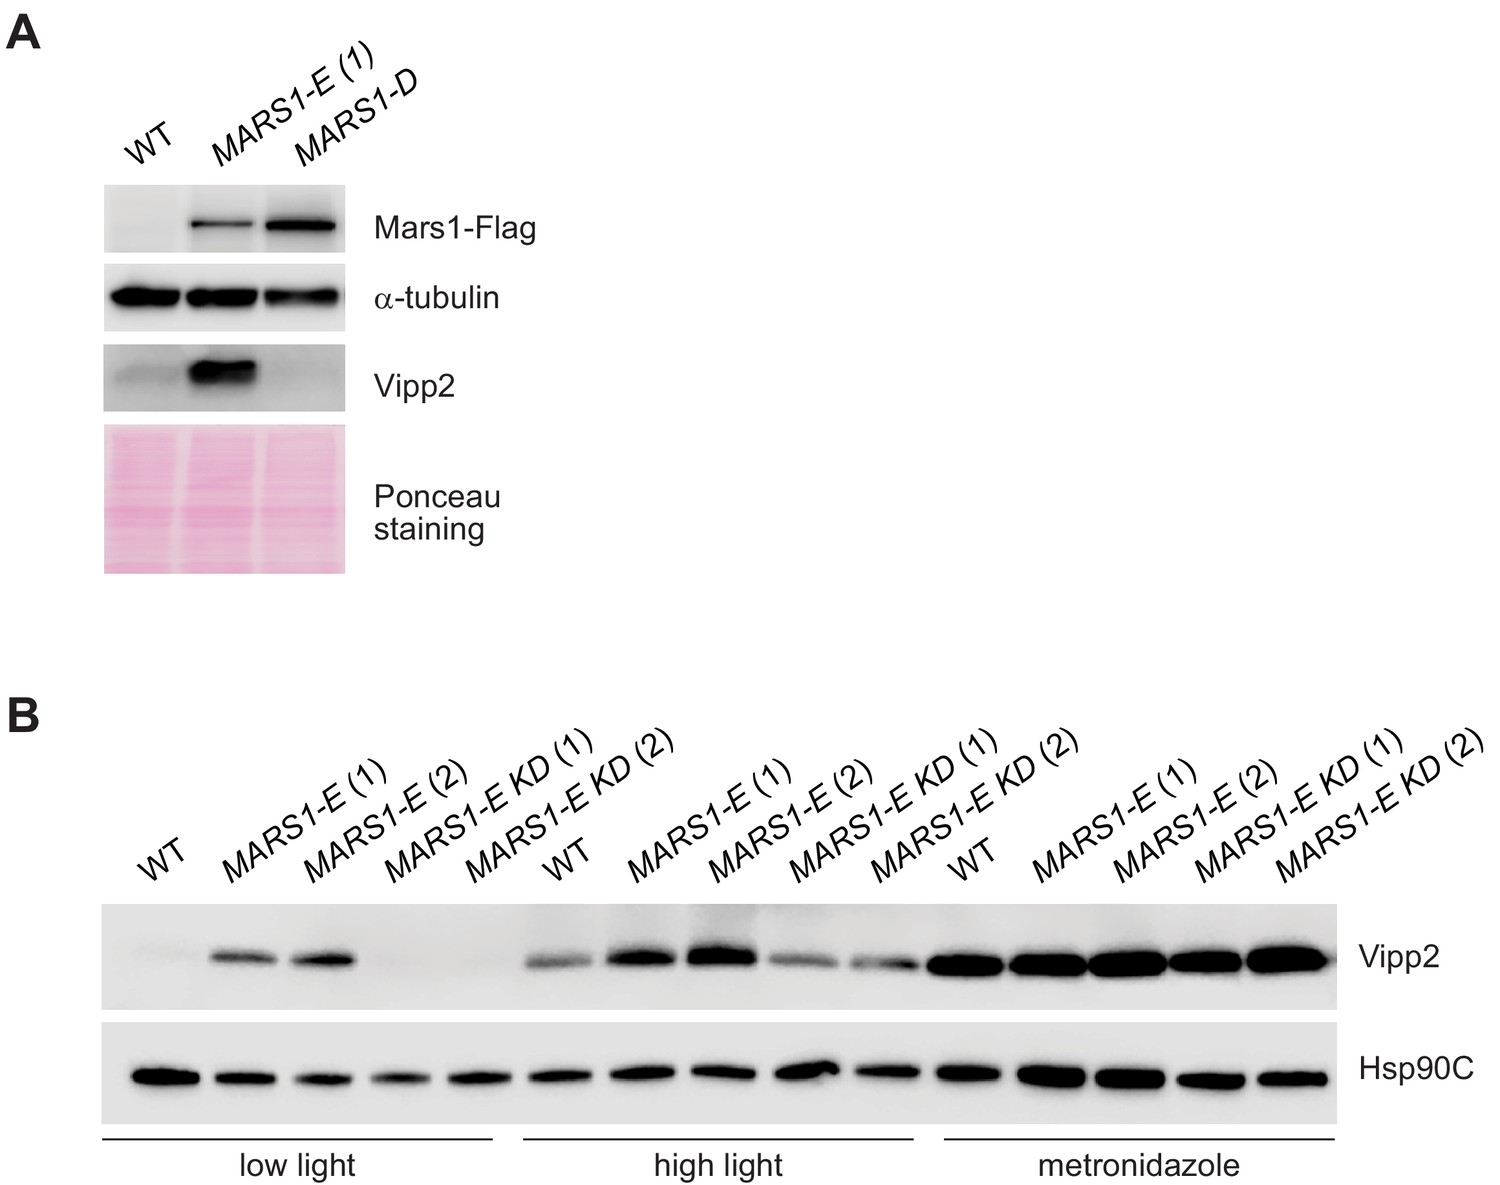
The MARS1-E transgene causes mild induction of cpUPR signaling.
(A) Immunoblot analysis of samples prepared from WT cells (CC-4533) and WT cells expressing MARS1-E, MARS1-A or MARS1-D transgene, using antibodies against Flag for Mars1 detection, Vipp2, and α-tubulin for loading control. (B) Immunoblot analysis of samples prepared from strains shown in Figure 6B–C in basal conditions (low light), upon high light or metronidazole treatment, using antibodies against Vipp2 and Hsp90C for loading control.
Author response image 1
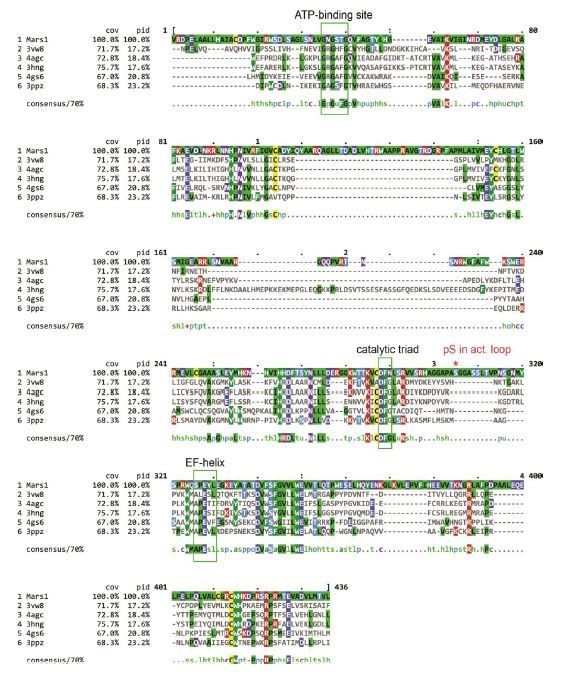
Multiple sequence alignment of Mars1 kinase domain (1638-2019 aa) and the five proteins selected by RaptorX as PDB templates to predict Mars1 tertiary structure.
The canonical ATP-binding loop, catalytic triad and EF-helix regions are highlighted by green rectangular frames. The red asterisk indicated the phosphoserine (pS) residue identified in Mars1 activation loop by Mass-Spec analysis. This multiple sequence alignment was generated by ClustalW (Thompson et al., 1994) and its results were visualized using MView (Brown et al., 1998).
Author response image 2
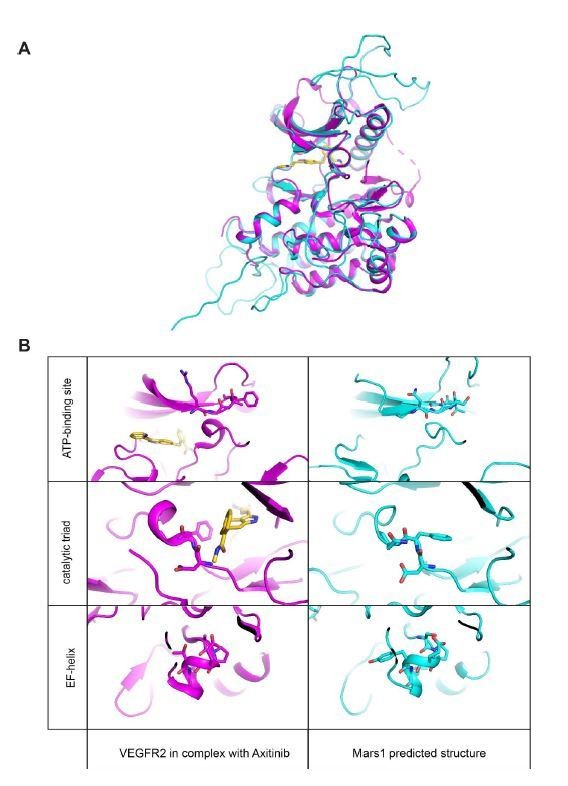
Mars1 tertiary structure prediction.
(A) Tertiary structural alignment of Mars1 (light blue) and human VEGFR2 kinase (magenta) in complex with a small molecule inhibitor, Axitinib (gold) (PDB ID: 4agc). 4agc was selected by the RaptorX web server (Kallberg et al., 2012) as best PDB template (p-value 5.45e-10) to model Mars1 tertiary structure. (B) Side-by-side comparison of ATP-binding loop, catalytic triad and EF-helix regions in Mars1 (light blue) and human VEGFR2 (magenta). The different conformation of the phenylalanine in the DFG region of VEGFR2 is due to the presence of a type I kinase inhibitor (Axitinib) (gold), which occupies the front pocket region, the adenine-binding area and the DFG-motif of this enzyme.
Tables
Key resources table
| Reagent type (species) or resource | Designation | Source or reference | Identifiers | Additional information |
|---|---|---|---|---|
| Gene (C. reinhardtii) | clpP1 | GenBank | L28803.1 | |
| Gene (C. reinhardtii) | VIPP2 | Phytozome | Cre11.g468050 | |
| Gene (C. reinhardtii) | MARS1 | Phytozome | Cre16.g692228 | |
| Recombinant DNA reagent | YFP 3x-FLAG | GenBank | ANF29833.1 | |
| Recombinant DNA reagent | pMJ016c | GenBank | KX077951.1 | |
| Antibody | anti-ClpP1 | gift from Francis-André Wollman and Olivier Vallon | 1:5000 | |
| Antibody | anti-Vipp2 (rabbit, polyclonal) | developed during this study | (1:3000) | |
| Antibody | anti-FLAG (mouse, monoclonal) | Sigma | F1804 | (1:3000 for IB; 1:500 for IF) |
| Antibody | anti-Hsp22E/F (rabbit, polyclonal) | gift from Michael Schroda | (1:10000) | |
| Antibody | anti-DnaK (rabbit, polyclonal) | gift from Jean David Rochaix | (1:10000) | |
| Antibody | anti-α tubulin (rabbit, polyclonal) | Sigma | T5168 | (1:10000) |
| Antibody | anti-Histone H3 (rabbit, polyclonal) | Agrisera | AS10 710 | (1:10000 for IB; 1:500 for IF) |
| Antibody | anti-AtpD (rabbit, polyclonal) | Agrisera | AS10 1590 | (1:500) |
| Antibody | anti-Nab1 (rabbit, polyclonal) | Agrisera | AS08 333 | (1:500) |
| Antibody | anti-AtpD (rabbit, polyclonal) | Agrisera | AS10 1590 | (1:500) |
| Antibody | anti-RpoA (rabbit, polyclonal) | gift from Jean David Rochaix | (1:10000) | |
| Antibody | anti-holo Rubisco (rabbit, polyclonal) | gift from Jean David Rochaix | (1:10000) | |
| Antibody | anti-Aox1 (rabbit, polyclonal) | Agrisera | AS06 152 | (1:2000) |
| Antibody | anti-Sultr2 (rabbit, polyclonal) | gift from Arthur Grossman | (1:3000) | |
| Antibody | anti-Hsp90 (rabbit, polyclonal) | Agrisera | AS06 174 | (1:10000) |
| Commercial assay or kit | KOD Hot Start DNA Polymerase | ThermoFisher Scientific | 71086–3 | |
| Commercial assay or kit | Phusion High-Fidelity DNA Polymerase | ThermoFisher Scientific | F530L | |
| Commercial assay or kit | PureYield Plasmid Miniprep System | Promega | A1222 | |
| Commercial assay or kit | NucleoSpin Gel and PCR Clean-up | Clontech | 740609 | |
| Commercial assay or kit | Direct-zol RNA Miniprep Plus | Zymo Research | R2070 | |
| Commercial assay or kit | Alexa Fluor 488 Tyramide SuperBoost Kit, goat anti-mouse IgG | ThermoFisher Scientific | B40941 | |
| Commercial assay or kit | In-Fusion HD cloning plus | Takara | 638910 | |
| Commercial assay or kit | CircLigase II ssDNA | Epicentre | CL9025K | |
| Commercial assay or kit | PrimeScript 1 st strand cDNA Synthesis Kit | Takara | 6110A | |
| Commercial assay or kit | iQ SYBR Green Supermix - Bio-Rad | Bio-Rad | 170–8880 | |
| Commercial assay or kit | Dynabeads kilobase Binder Kit | Invitrogen | 60101 | |
| Commercial assay or kit | Kapa mRNA HyperPrep kit | Roche | KK8540 | |
| Commercial assay or kit | PrepX DNA Library Kit (400075) | Takara | 640101 | |
| Commercial assay or kit | SuperSignal West Femto | ThermoFisher Scientific | 34095 | |
| Commercial assay or kit | SuperSignal West Dura | ThermoFisher Scientific | 34075 | |
| Chemical compound, drug | N6,2′-O-Dibutyryladenosine 3′,5′-cyclic monophosphate sodium salt | Sigma | D0627 | |
| Chemical compound, drug | Thiamine hydrochloride | Sigma | T4625 | |
| Chemical compound, drug | Vitamin B12 | Sigma | V6629 | |
| Chemical compound, drug | digitonin, high purity | Calbiochem | 300410 | |
| Chemical compound, drug | Metronidazole | Sigma | M3761 | |
| Software, algorithm | Sequence Data Analysis | Geneious | ||
| Software, algorithm | Sequence Data Analysis | Snapgene | ||
| Software, algorithm | Microscopy imaging interface | Zeiss | ZEN | |
| Software, algorithm | Image processing | NIH | ImageJ | |
| Other | electroporation system | Biorad | Gene Pulser II | |
| Other | electroporation system | Nepagene | Nepa21 | |
| Other | colony picker | Norgren Systems | CP7200 | |
| Other | colony manipulation robot | Singer | Rotor HAD | |
| Other | Fluorescence scanner | GE Healthcare | Typhoon Trio | |
| Other | Protran NitrocelluloseHybridization Transfer Membrane | Perkin Elmer | NBA083C001EA | |
| Other | Imaging system | LI-COR Biosciences | Odyssey CLx | |
| Other | Plant LED Grow Light | Phlizon 2017 | 2000W | |
| Other | Smart Sensor | Wifi Gateway | G1 | |
| Other | Smart Sensor | Sensor Push | HT1 |
Table 1
Strains table.
| CrPW number | Strain name | Short description | Reference |
|---|---|---|---|
| CC-4533 | parental strains used to generate mars1-3 and mars1-4 | (Li et al., 2016) | |
| CC-124 | wild-type used for mars1-1 and mars1-2 genetic backcrosses | (available at the Chlamydomonas Resource Center) | |
| A31 | parental strain of DCH16 | (Ramundo et al., 2013) | |
| DCH16 | ClpP1 repressible strain | (Ramundo et al., 2013) | |
| CrPW1 | A1N5 | cpUPR reporter strain | (generated during this study) |
| CrPW2 | ACT C6 | YFP positive strain | (generated during this study) |
| CrPW3 | DRB1 | YFP positive strain | (generated during this study) |
| CrPW4 | mars1-1 | Cre16.g692228 mutant allele | (generated during this study) |
| CrPW5 | mars1-2 | Cre16.g692228 mutant allele*-Full genotype described below | (generated during this study) |
| CrPW6 | mars1-3 | (available at the Chlamydomonas Resource Center) | Cre16.g692228 mutant allele Clip ID: LMJ.RY0402.195536 |
| CrPW7 | mars1-4 | (available at the Chlamydomonas Resource Center) | Cre16.g692228 mutant allele Clip ID: LMJ.RY0402.189144 |
| CrPW8 | E12 | wild-type like progeny from backcross of mars1-1 to CC124 (used for RNA-seq analysis) | (generated during this study) |
| CrPW9 | F2 | MARS1 mutant progeny from backcross of mars1-1 to CC124 (used for RNA-seq analysis) | (generated during this study) |
| CrPW10 | D2C4 | wild-type like progeny from backcross of mars1-2 to CC124 (used for complementation analysis)† | (generated during this study) |
| CrPW11 | D2C3 | MARS1 mutant progeny from backcross of mars1-2 to CC124 (used for complementation analysis)† | (generated during this study) |
| CrPW12 | M22 | mars1-3:MARS1-A strain | (generated during this study) |
| CrPW15 | FMW14 | mars1-3:MARS1-D strain | (generated during this study) |
| CrPW16 | KDM14 | mars1-3:MARS1-A KD strain | (generated during this study) |
| CrPW17 | FMD17 | mars1-3:MARS1-D KD strain | (generated during this study) |
| CrPW18 | 189 N25 | mars1-1:MARS1-A strain | (generated during this study) |
| CrPW19 | FKD7 | mars1-1:MARS1-D strain | (generated during this study) |
| CrPW20 | pKP29 B30 | mars1-1:MARS1-D KD strain | (generated during this study) |
| CrPW21 | pKP30 D7 | mars1-1:MARS1-D KD strain | (generated during this study) |
| CrPW22 | DCM2 | mars1-2:MARS1-A strain | (generated during this study) |
| CrPW23 | DCM5 | mars1-2:MARS1-A strain | (generated during this study) |
| CrPW24 | DCM10 | mars1-2:MARS1-A strain | (generated during this study) |
| CrPW25 | DCM19 | mars1-2:MARS1-A strain | (generated during this study) |
| CrPW26 | DCM21 | mars1-2:MARS1-A strain | (generated during this study) |
| CrPW27 | W153 | CC-4533 transformed withMARS1-E transgene, strain (a) | (generated during this study) |
| CrPW28 | W155 | CC-4533 transformed withMARS1-E transgene, strain (b) | (generated during this study) |
| CrPW29 | WKD4 | CC-4533 transformed withMARS1-E KD transgene, strain (a) | (generated during this study) |
| CrPW30 | WKD16 | CC-4533 transformed with MARS1-E KD transgene, strain (a) | (generated during this study) |
| CrPW31 | WFM2 | CC-4533 transformed withMARS1-D transgene, strain (a) | (generated during this study) |
| CrPW43 | ire1 | Cre08.g371052 mutant allele Clip ID: LMJ.RY0402.122895 | (available at the Chlamydomonas Resource Center) |
| CrPW44 | snrk2 | Cre02.g075850 mutant allele Clip ID: LMJ.RY0402.187019 | (available at the Chlamydomonas Resource Center) |
-
*mars1-2 has a total of three mapped genomic disruptions.
1The chromosome 16 deletion which encompasses Cre16.g692228 (MARS1), Cre16.g692340, and Cre16.g692452.
-
2The full Paromomycin cassette was found in an intergenic region on chromosome 7, 958 bp downstream of gene Cre07.g336300. A portion of a gene- Cre02.g108450 (5’UTR-intron 4) was found directly upstream of this Paromomycin cassette (in intergenic region of Chromosome 7).
3The locus for the Cre02.g108450 gene itself has a deletion spanning the 5’UTR-intron 4.
-
†D2C3 and D2C4 were offspring isolated upon backcrossing mars1-2 to CC-124 three times. D2C4 contains the wild-type MARS1 gene whereas D2C3 contains the MARS1 deletion. In both strains, all other markers (Hygromycin,Paromomycin, and Spectinomycin) as well as the abovementioned Cre02.g108450 deletion were crossed out.
Table 2
Plasmids Table.
| Plasmid name (nickname/official name) | Used for | Reference |
|---|---|---|
| pLM005 | for amplification of theYFP coding sequence | (Mackinder et al., 2016) |
| pHyg3 | for amplification of the RBCS2 3'UTR sequence and cloning of the Hygromycin resistance cassette | (Berthold et al., 2002) |
| pMJ016c | for insertional mutagenesis | (Li et al., 2016) |
| pRAM118/pPW3216 | for gene tagging and subcloning | (Li et al., 2019) |
| pRAM103.5/pPW3217 | For generation of the cpUPR reporter strain | (generated during this study) |
| pRAM185.2/pPW3218 | For MARS1 cloning (untagged MARS1 transgene) | (generated during this study) |
| pRAM189 M2/pPW3219 | For MARS1 cloning (MARS1-A transgene) | (generated during this study) |
| pKP29 /pPW3222 | For MARS1 cloning (MARS1-D transgene) | (generated during this study) |
| pRAM184.1 /pPW3223 | For MARS1 cloning (MARS1-E transgene) | (generated during this study) |
| pHT20.1/pPW3224 | For MARS1 cloning (catalytically-dead MARS1-A transgene) | (generated during this study) |
| pKP30/pPW3225 | For MARS1 cloning (catalytically-dead MARS1-D transgene) | (generated during this study) |
| pHT6/pPW3226 | For MARS1 cloning (catalytically-dead MARS1-E transgene) | (generated during this study) |
Table 3
Primers Table.
| Primer name | 5'-->3' sequence |
|---|---|
| oMJ598 | b-CAGGCCATGTGAGAGTTTGC (b = biotinylated) |
| oMJ619 | /5Phos/AGATCGGAAGAGCGTCGTGTAGGGAAAGAGTGTAGATCTCGGTGGTCGCCGTATCATTACTCAGTAGTTGTGCGATGGATTGATG/3ddc/ (/5Phos/=phosphorylated;/3ddc/=dideoxycytidine (to prevent self-ligation) |
| oMJ621 | AATGATACGGCGACCACCGAGATCTACACTCTTTCCCTACACGACGCTCTTCCGATCT |
| oMJ1234 | b-GCAGCCAAACCAGGATGATG (b = biotinylated) |
| oMJ1239 | aattaaccctcactaaagCAATCATGTCAAGCCTCAGC |
| T3_3'_oMJ016c 11/23 | aattaaccctcactaaagGGTCGAGCCTTCTGGCAGA |
| T3_5'_oMJ016c 11/24 | aattaaccctcactaaaggGCGGAGACGTGTTTCTGAC |
| SR502 | tgctcaccatACTAGTGAGCACGCTGCGA |
| SR503 | gctcactagtATGGTGAGCAAGGGCGAG |
| SR504 | gggatccttaagatctTTACTTGTCGTCATCGTCCTT |
| SR505 | cgacaagtaaagatctTAAGGATCCCCGCTCCGTG |
| SR506 | gcgcaagaaagaagcttgatatcCGCTTCAAATACGCCCAGC |
| SR510 | atgtggcggccgcTGGAAAAGCGTTTCGGAAGG |
| SR773 | CGCCTTTAAAGCTGAAGTGG |
| SR789 | CAGCTGCGTCTCCGTTTGC |
| SR793 | CCTTCACCATTTAAGACGGAGCAGTAAACAGTTGCTG |
| SR797 | CTGCTCCGTCTTAAATGGTG |
| SR818 | CGGCATGCCGCTACCCGC |
| SR819 | GGGTAGCGGCATGCCGCC |
| SR828 | tttgctcacatgtggcggccgcCAGCCCTGTACACCAGCTC |
| SR829 | gcgcaagaaagaagcttgatATCTCGGCGCCAGGTTTAC |
| SR834 | ccatatcgaaggtcgtcatatgATGGCAATCGCAGACGCTG |
| SR835 | gctttgttagcagccggatctcaGCCGAGGACGGTCATCAG |
| SR836 | GACGTCATCCACTGCCTGTG |
| SR837 | CGACGCATCCTCAACACACC |
| SR851 | TGTGCGCCTTCAATTTGAGC |
| SR852 | GCTCAAATTGAAGGCGCACA |
| SR853 | TAGCCCTTCGTTACCATCGTC |
| HT7 | GCAAACGGAGACGCAGCTG |
| KP235 | CTCCATCACAATTGCCTGCA |
| KP337 | GTGTGGTCGGGCCGTCTAGAA |
| KP342 | TGGTCCGCCGGAACAGATCTTCC |
| KP344 | CTTGTCGTCATCGTCCTTGTAGTCGATGTCGTGATCCTTATAGTCACCGTCATGGTCCTTGTAGTCCATGCCGCTACCCGCCCCA |
| KP345 | GGACGATGACGACAAGGGCAGCAGCCCGCCCAGCCCTTGTAGCAGCAG |
| KP346 | GTCAGCCCTGTTCTGCCC |
| KP347 | AACCCTAAACCCGCTGG |
| qRT_SULTR2_Fw | ACGTGGCATGCAGCTCAT |
| qRT_SULTR2_Rv | CTTGCCACTTTGCCAGGT |
| qRT_LHCBM9_Fw | TGGTGGTGCTTTCCCTTCAGAC |
| qRT_LHCBM9_Rv | TGGACACAACTGCAGGCTTTGC |
| qRT_HSP22F_Fw | TGCGCACGCGACATTATCAAAG |
| qRT_HSP22F_Rv | GTACAAACCAGCATGCGCTCAG |
| qRT_VIPP2_Fw | CATCATGCATTTGGCAGGCTCTC |
| qRT_VIPP2_Rv | AATGAGAGGTGCGACGACCAAC |
| qRT_SNOAL_Fw | TGCTGTGGGCAACTGTGCATAC |
| qRT_SNOAL_Rv | TCCGTGCTTGACGCTACCATTC |
| qRT_LHCSR3.1_Fw | CACAACACCTTGATGCGAGATG |
| qRT_LHCSR3.1_Rv | CCGTGTCTTGTCAGTCCCTG |
| qRT_PSBS1_Fw | TAAACCGTGTATTGGAACTCCG |
| qRT_PSBS1_Rv | CTCTGCACGCGGCGTGTT |
| qRT_CPLD29_Fw | AACCGGGTCTTCTTCGCCTTTG |
| qRT_CPLD29_Rv | GTGTGCCGCCATTCCAAAGAAC |
| qRT_GBLP_Fw | CAAGTACACCATTGGCGAGC |
| qRT_GBLP_Rv | CTTGCAGTTGGTCAGGTTCC |
Additional files
-
Source code 1
ImageJ macroscripts used to process and quantify YFP fluorescence and growth area of candidate mutant colonies on 384-well arrays.
- https://cdn.elifesciences.org/articles/49577/elife-49577-code1-v2.docx
-
Supplementary file 1
Detailed information about peptide spectra sequences and post-translation modifications detected in Mars1 protein upon metronidazole treatment.
- https://cdn.elifesciences.org/articles/49577/elife-49577-supp1-v2.xlsx
-
Supplementary file 2
Average RPKM values for all Chlamydomonas transcripts in WT and mars1-1 mutant upon high light exposure (for 40 min or 70 min) or ClpP1 down-regulation for 68 hr.
- https://cdn.elifesciences.org/articles/49577/elife-49577-supp2-v2.xlsx
-
Transparent reporting form
- https://cdn.elifesciences.org/articles/49577/elife-49577-transrepform-v2.pdf
Download links
A two-part list of links to download the article, or parts of the article, in various formats.
Downloads (link to download the article as PDF)
Open citations (links to open the citations from this article in various online reference manager services)
Cite this article (links to download the citations from this article in formats compatible with various reference manager tools)
The Mars1 kinase confers photoprotection through signaling in the chloroplast unfolded protein response
eLife 8:e49577.
https://doi.org/10.7554/eLife.49577


