Rbfox1 up-regulation impairs BDNF-dependent hippocampal LTP by dysregulating TrkB isoform expression levels
- Center for Cancer Research, National Cancer Institute, National Institutes of Health, United States
- Frederick National Laboratory for Cancer Research sponsored by the National Cancer Institute, United States
Figures
Figure 1 with 3 supplements
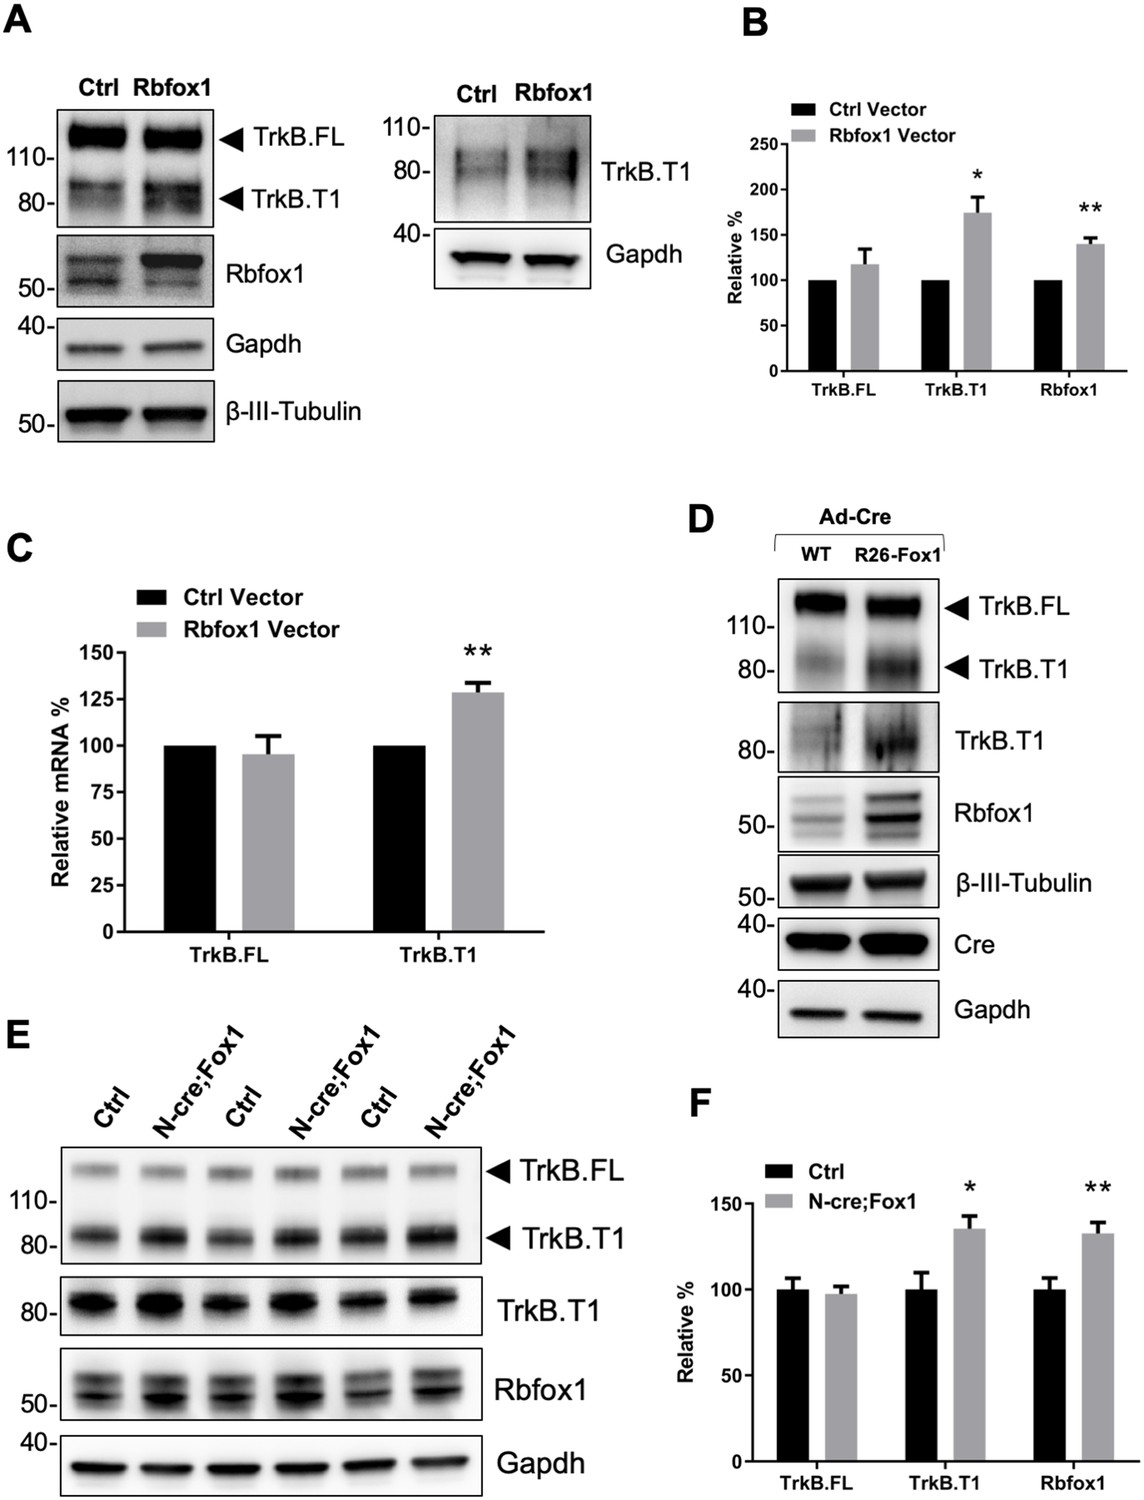
Rbfox1 upregulation increases truncated TrkB.
T1 receptor levels in vitro and in vivo. (A) Overexpression of Rbfox1 in mouse primary hippocampal neurons leads to a specific up-regulation of TrkB.T1. Western blot analysis of wild-type mouse primary hippocampal neurons transfected with a lentiviral vector expressing Rbfox1 (Rbfox1) or eGFP (Ctrl) as a control. Neurons were transfected after 4 days in vitro and analyzed 72 hr after transfection. Ntrk2 (TrkB) protein levels were tested with an antibody against the TrkB extracellular domain to detect all TrkB isoforms (left panel) or an antibody specifically recognizing TrkB.T1 (right panel). Antibodies against Rbfox1 were used to verify Rbfox1 overexpression; Gapdh and β-III-Tubulin were used as control of loading and as a neuronal marker respectively. (B) Quantification of TrkB full-length (TrkB.FL) and TrkB.T1 protein from experiments as in A; n = 3 ± SEM. * = p ≤ 0.05, ** = p ≤ 0.01 (Student’s t-test). (C) Quantitative PCR analysis of TrkB.FL and TrkB.T1 expression from mouse primary hippocampal neurons as in (A); n = 3 ± SEM; ** = p ≤ 0.01 (Student’s t-test). (D) Immunoblot analysis of littermates wild-type R26-Rbfox1+/+ (WT) and transgenic R26-Rbfox1+/flox (R26-Fox1) primary hippocampal neurons transfected with a Cre-expressing adenovirus (Ad-Cre) and analyzed as in (A). (E) Immunoblot of hippocampi derived from control Nes-Cre animals (Ctrl) and transgenic Nes-Cre;R26-Rbfox1+/flox animals (N-cre;Fox1) analyzed with antibodies as in (A). (F) Immunoblot quantification analysis of TrkB.FL, TrkB.T1 and Rbfox1 protein levels of N-cre;Fox1 relative to Ctrl as in (E); n = 6 ± SEM; * = p ≤ 0.05; ** = p ≤ 0.01 (Student’s t-test).
Figure 1—figure supplement 1
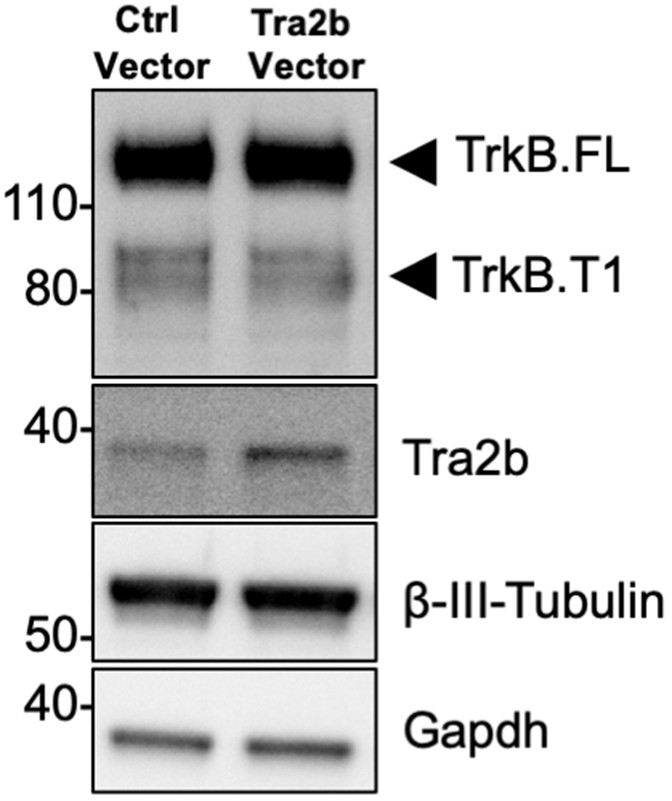
Overexpression of Tra2b does not change TrkB receptor expression.
Western blot analysis of wild-type mouse primary hippocampal neurons transfected with a lentiviral vector expressing Tra2b or eGFP (Ctrl) as a control. Neurons were transfected after 4 days in vitro and analyzed 72 hr after transfection. TrkB protein levels were tested with an antibody against the TrkB extracellular domain to detect all TrkB isoforms. Antibodies against Gapdh and β-III Tubulin were used as control of loading and as a neuronal marker respectively.
Figure 1—figure supplement 2
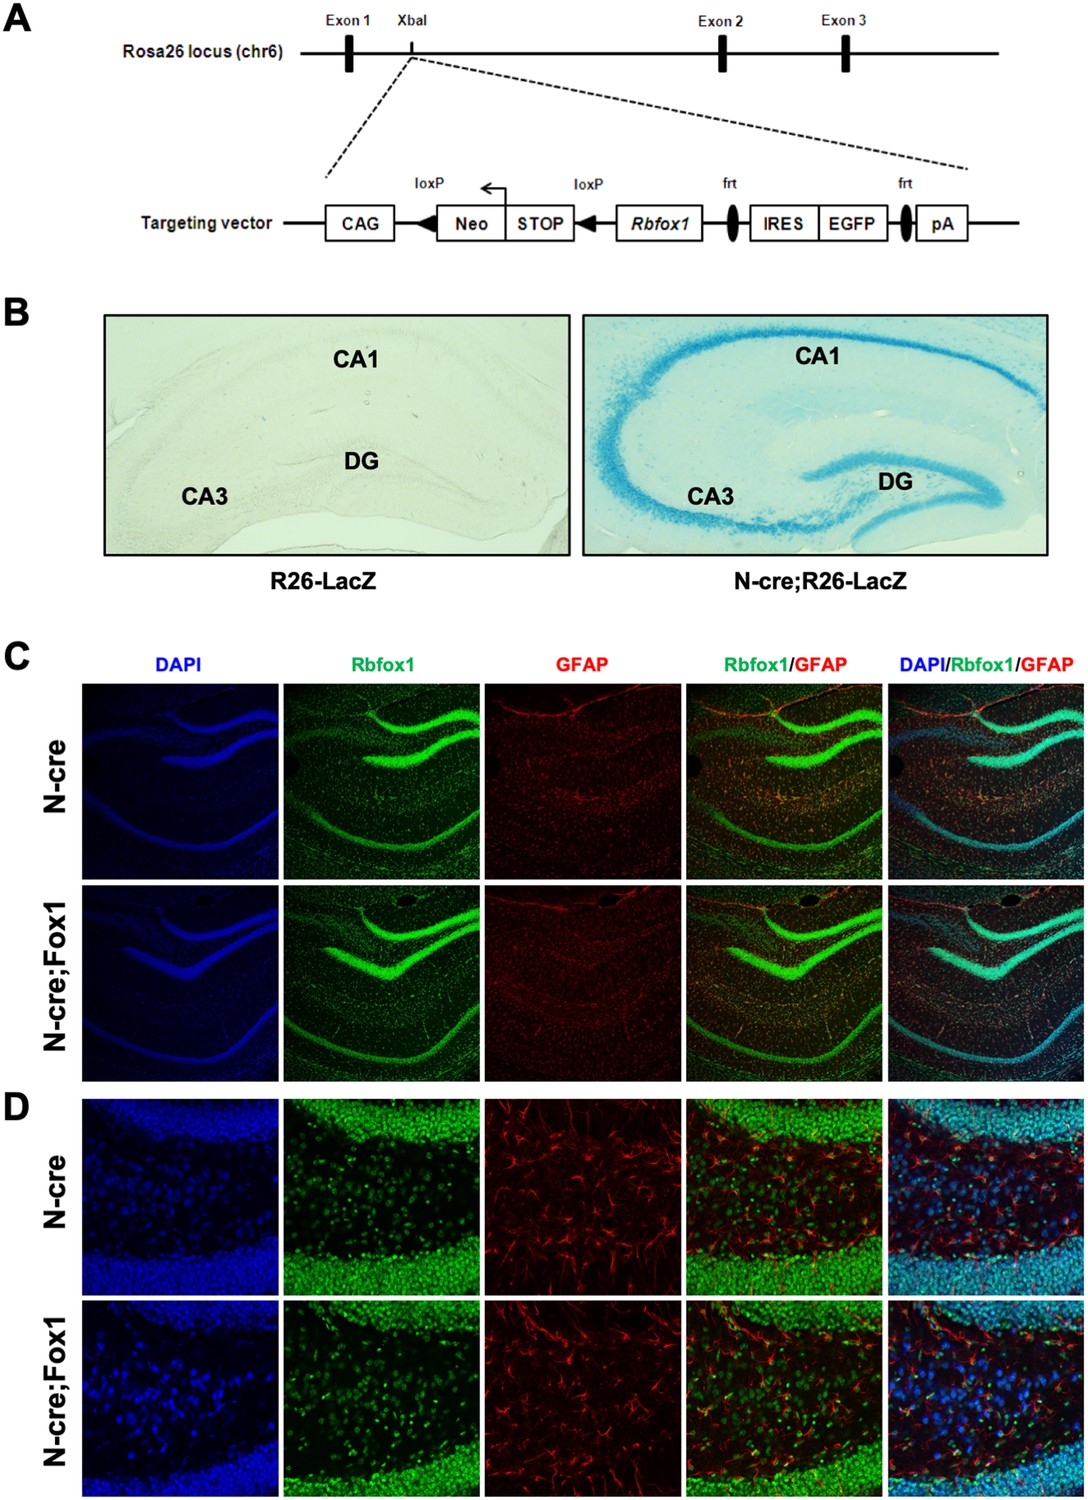
Generation and characterization of a mouse model with inducible Rbfox1 expression.
(A) Schematic representation of the targeting vector used to generate the Rbfox1 conditional transgenic mouse model. The Gt(ROSA)26Sor locus (Rosa26) was targeted using a vector including the Rbfox1 cDNA that can be activated by the CAG promoter after cre-mediated removal of the loxP-flanked STOP-cassette. (B) Cre expression under the nestin promoter is specific to neurons in the hippocampus. β-Gal staining of the hippocampal area of control (R26-LacZ) and Nes-Cre;R26-LacZ (N-cre;R26-LacZ) mice showing robust Nes-cre activity in the granule cells of dentate gyrus (DG) and CA1 and CA3 pyramidal neurons. (C) Rbfox1 expression induced by nestin-cre is restricted to the neuronal compartment of the hippocampus. Immunofluorescence staining of N-cre (Nes-Cre) and N-cre;Fox1 (Nes-Cre;R26-Rbfox1+/flox) hippocampi showing similar pattern of Rbfox1 expression. Staining for Rbfox1 (green staining) and glial fibrillary acidic protein (GFAP; red staining) also shows no difference between the control and the N-cre;Fox1 sections. DAPI staining was used for nuclei. (D) Higher magnification immunofluorescence staining of DG area from panels in (A).
Figure 1—figure supplement 3

Expression of the TrkC receptor isoforms and Rbfox2 is not affected by Rbfox1 upregulation.
(A) Western blot analysis of TrkC.FL, TrkC.T1 and Rbfox2 expression in the same hippocampal samples used in Figure 1E, including control Nes-Cre animals (Ctrl) and N-cre;Fox1 (Nes-Cre;R26-Rbfox1+/flox) animals. (B) Quantifications of the immunoblots bands as in (A); n = 6 ± SEM.
Figure 2
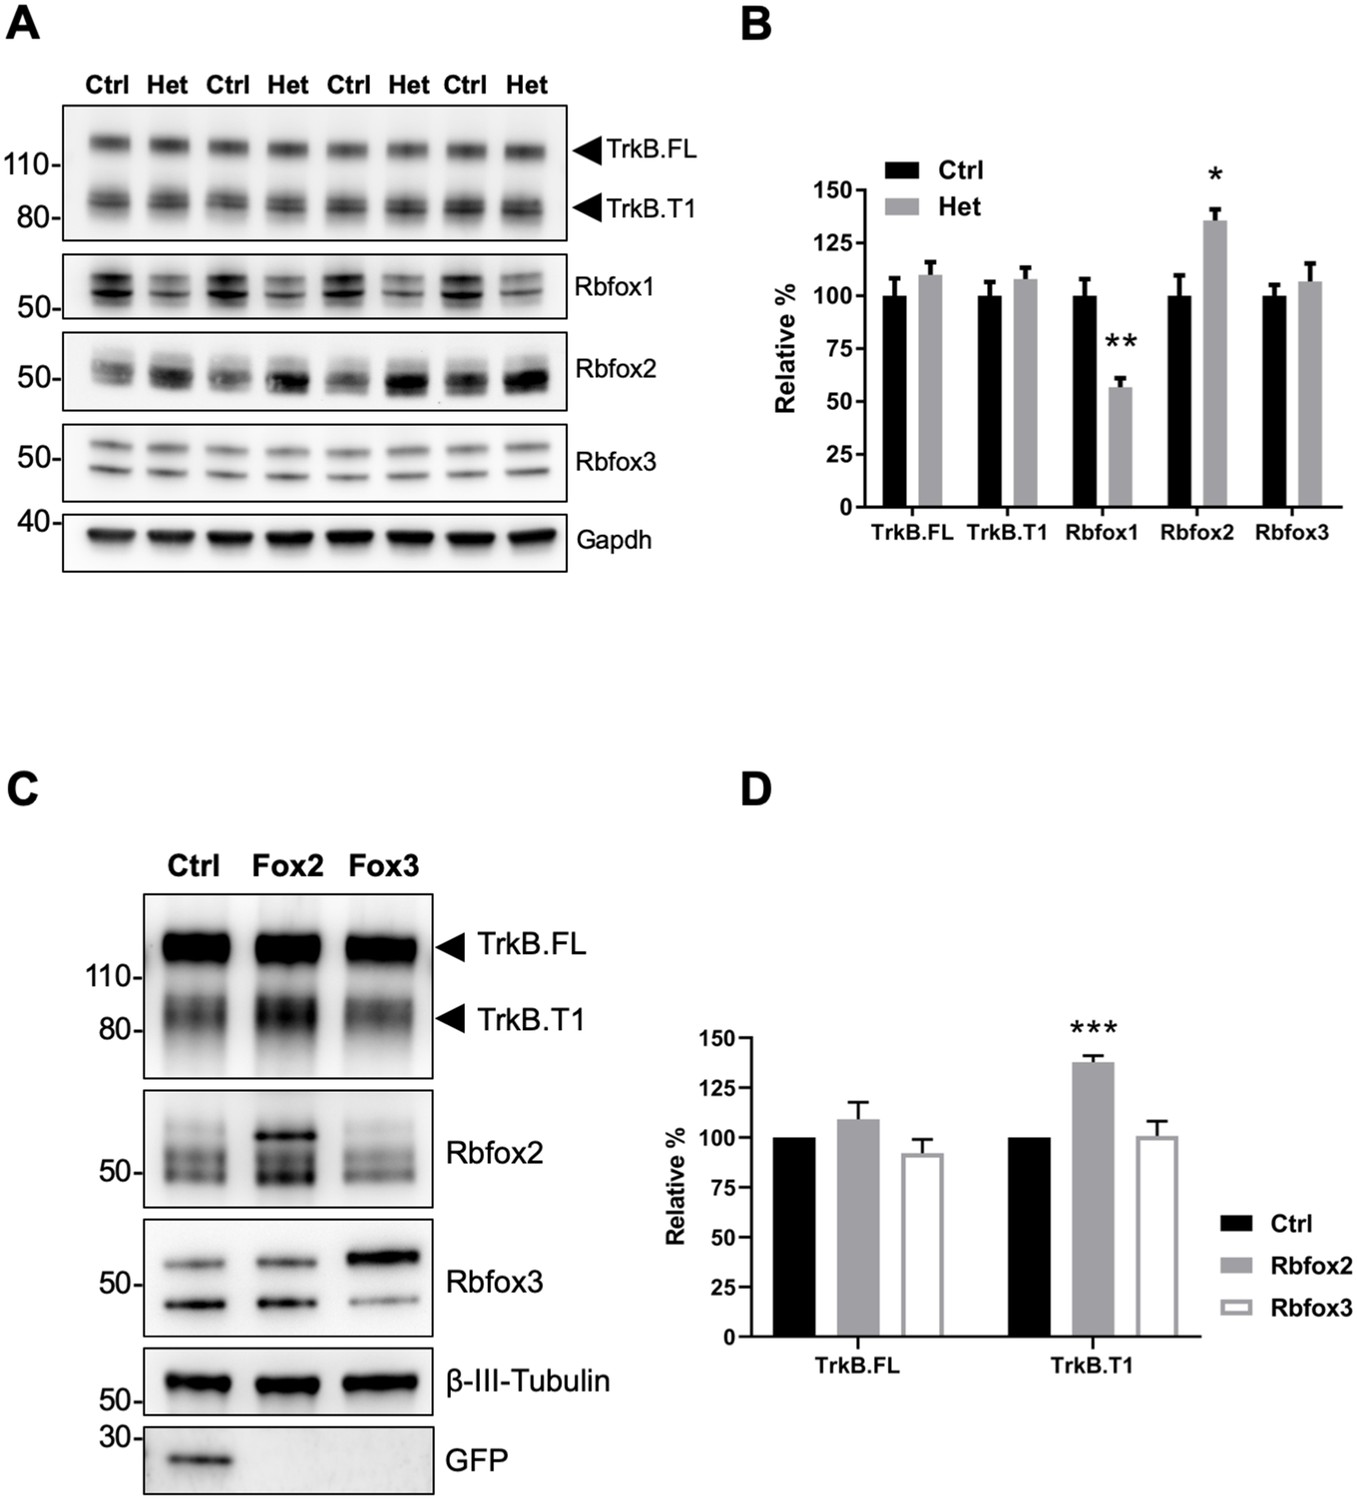
Rbfox2 compensates for Rbfox1 heterozygosity in vivo and its overexpression increases TrkB.
T1 receptor levels. (A) Western blot analysis of control (Ctrl) and Rbfox1+/- (Het) mouse hippocampus with antibodies against TrkB, Rbfox1, Rbfox2, Rbfox3 and Gapdh (used as loading control). (B) quantifications of immunoblots bands from (A) relative to Ctr (100%); n = 4 ± SEM; *p≤0.05; **p≤0.01 (Student’s t-test). (C) Overexpression of Rbfox2, but not Rbfox3 up-regulate TrkB.T1 expression in primary hippocampal neurons. Western blot analysis of wild-type mouse primary hippocampal neurons transfected with a lentiviral vector expressing eGFP as a control (Ctrl), Rbfox2 (Fox2) or Rbfox3 (Fox3). Neurons were transfected after 4 days in vitro and analyzed 72 hr after transfection by immunoblot with antibodies against TrkB extracellular domain to detect all TrkB isoforms, GFP, Rbfox2, Rbfox3 and β-III-Tubulin as loading control and neuronal marker. (D) Quantification of TrkB full-length (TrkB.FL) and TrkB.T1 protein from experiments as in (C); n = 3 ± SEM. *** = p ≤ 0.001 (Student’s t-test).
Figure 3 with 2 supplements

Rbfox1 upregulation increases mRNA stability of the TrkB.
T1-isoform and its RNA binding function is necessary to increase TrkB.T1 receptor levels. (A) Rbfox1 iCLIP analysis of mouse brain chromatin associated high molecular weight nuclear fraction (HMW) or soluble nuclear fraction (Soluble) (Damianov et al., 2016) showing association of Rbfox1 to TrkB transcripts in both HMW (vertical red bars) and soluble (vertical orange bars) nuclear fractions. Extracellular domain (ECD), specific TrkB.T1 region (T1) and tyrosine kinase domain (TK domain) are also indicated. (B) Schematic representation of the murine Ntrk2 gene. Exon lengths are indicated in base pairs (bp) while intron lengths are indicated as kilo-bases (kb). White and black stars indicate the start and stop codons respectively. (C) Agarose gels of RT-PCR amplification products from an RNA immunoprecipitation (RIP) analysis of wild type primary hippocampal neurons with an Rbfox1 antibody; input samples are from the PCR amplification of the RNA and antibody mixture before the immunoprecipition (IP) with mouse IgG or Rbfox1 antibodies. Indicated exonic (blue and green arrows) and intronic (red arrows) primers were used for the analysis. Note the presence of RT-PCR amplification bands following Rbfox1 IP for both TrkB.FL and TrkB.T1 and a proximal intronic region upstream of the specific TrkB.T1 exon, Camta1 (positive control; Gehman et al., 2011; Lee et al., 2016), but not Sirt1 (negative control). (D) Pulse-chase mRNA stability assay in primary hippocampal neurons derived from littermate control R26-Rbfox1+/flox (Ctrl) and Nes-Cre;R26-Rbfox1+/flox (N-cre;Fox1) embryos. Nascent RNA of primary neurons was labeled with 5-EU for 5 hr (pulsing) followed by QPCR analysis at 0 and 9 hr using c-DNA specific primers (purple arrows in schematic) for TrkB.FL and TrkB.T1. Values at 9 hr are expressed as percentage relative to 0 hr. n = 6 ± SEM; ns = p > 0.05; * = p ≤ 0.05 (Student’s t-test). (E); Rbfox1 RNA binding activity is required to promote TrkB.T1 up-regulation. Western blot analysis of wild-type mouse primary hippocampal neurons transfected with an adenovirus expressing WT Rbfox1 (Rbfox1) or an Rbfox1 with a mutation in the RNA binding domain (Rbfox1-F158A). Neurons were transfected after 4 days in vitro and analyzed 48 hr after transfection. (F) Quantification of TrkB.FL and TrkB.T1 protein from experiments as in E; n = 3 ± SEM. * = p ≤ 0.05, (Student’s t-test).
Figure 3—figure supplement 1
The TrkB.
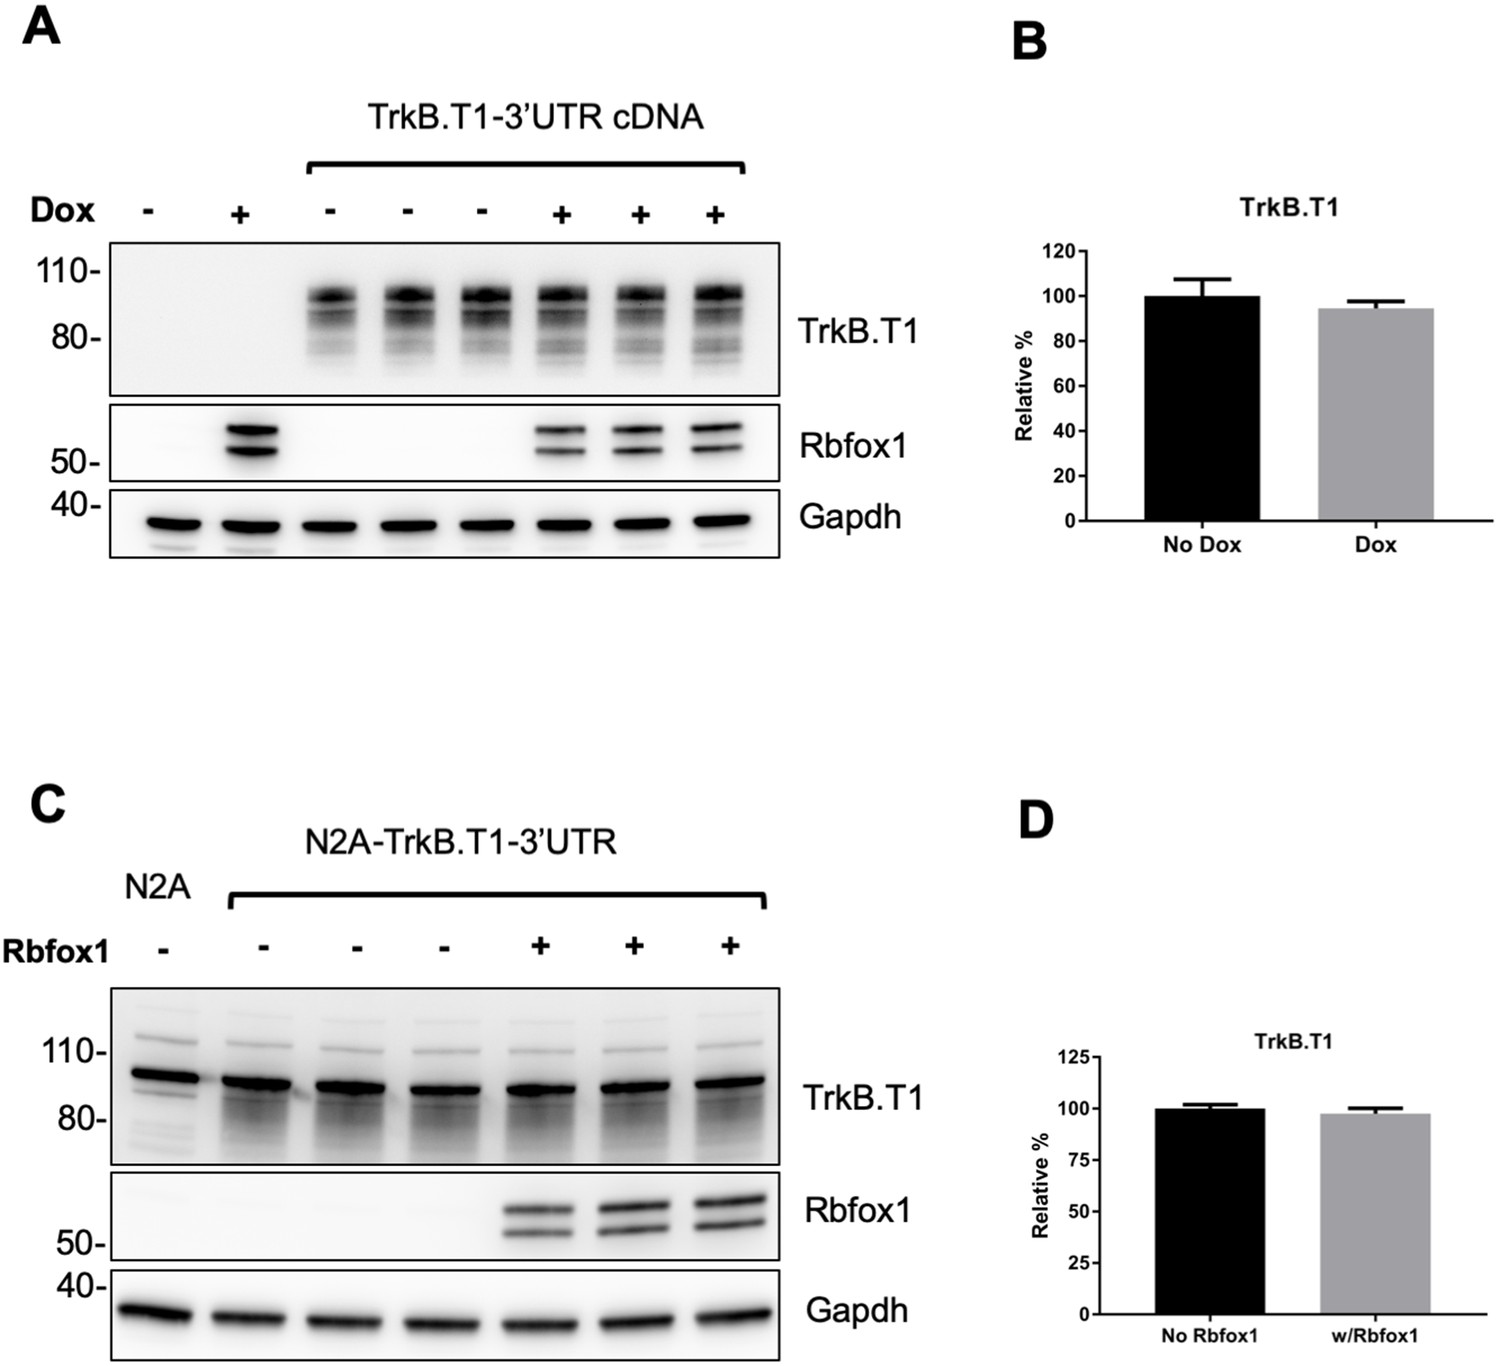
T1 3'UTR does not contribute to TrkB.T1 mRNA expression changes caused by Rbfox1 overexpression. (A) Western blot analysis of lysates from a Doxycycline (Dox) inducible HEK293-Rbfox1 cell line transfected with a TrkB.T1 cDNA containing the 3'UTR sequence. Rbfox1 expression was induced by 0.5 µg/ml Dox and samples were analyzed 48 hr after the transfection of the TrkB.T1-3'UTR cDNA. (B) Quantification of the TrkB.T1 specific bands from (A); n = 3 ± SEM. (C) Western blot analysis of lysates from the neuroblastoma cell line Neuro-2a (N2A) stably expressing TrkB.T1 with the 3’UTR sequence (N2A-TrkB.T1-3’UTR). Rbfox1 cDNA was transiently transfected into N2A-TrkB.T1-3’UTR cells and TrkB.T1 levels were analyzed 48 hr after the transfection and quantified in (D); n = 3 ± SEM.
Figure 3—figure supplement 2
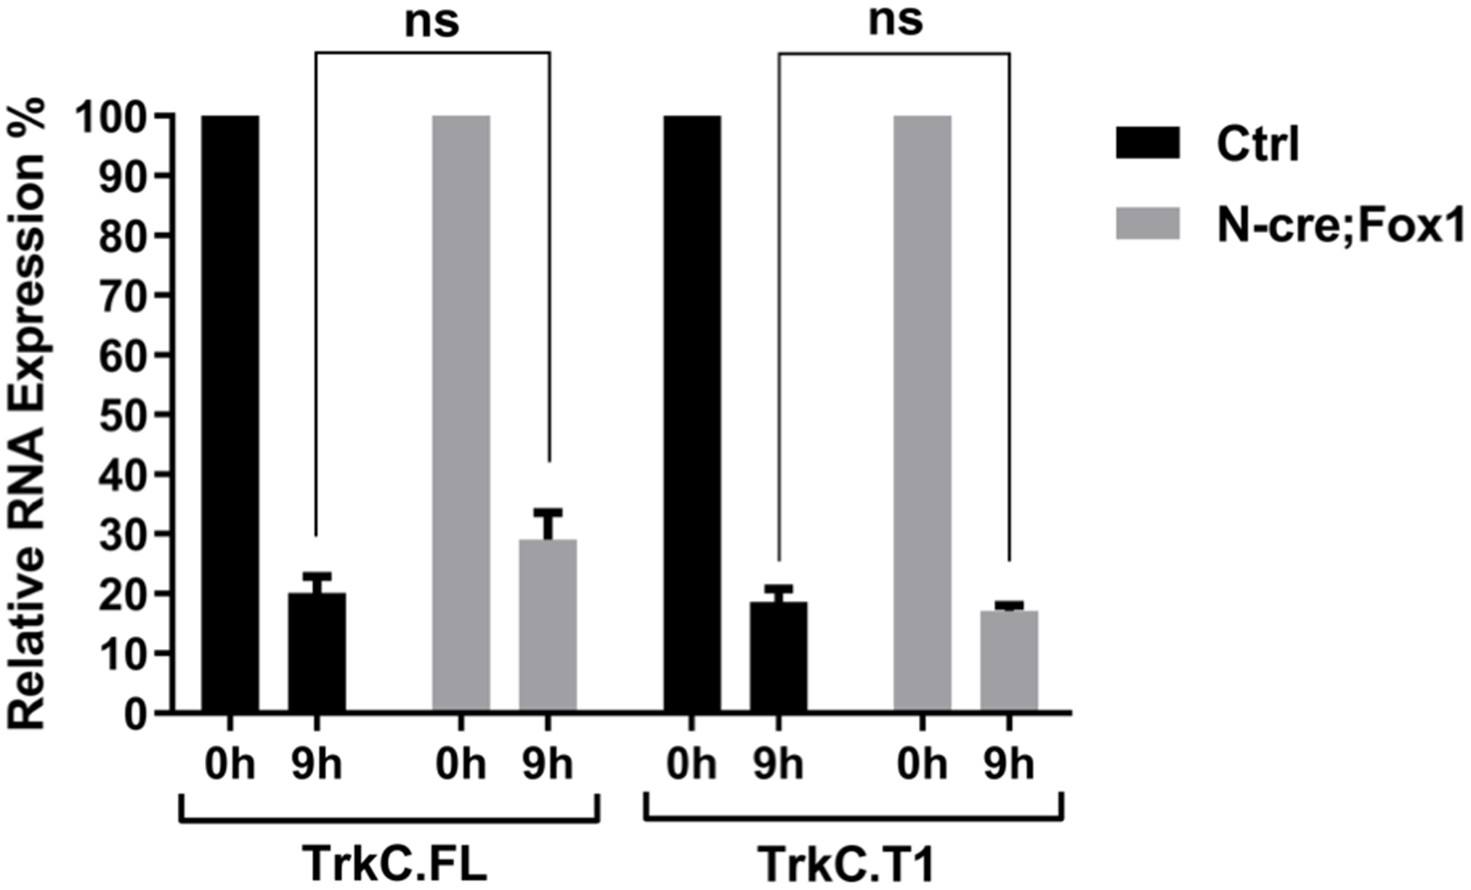
Rbfox1 upregulation does not change TrkC isoforms RNA stability.
Analysis of TrkC.FL and TrkC.T1 from the same pulse-chase mRNA samples shown in Figure 3D. QPCR analysis was performed using specific primers for TrkC.FL and TrkC.T1 mRNAs. Values at 9 hr are expressed as percentage relative to 0 hr. n = 6 ± SEM; ns = p > 0.05 (Student’s t-test).
Figure 4
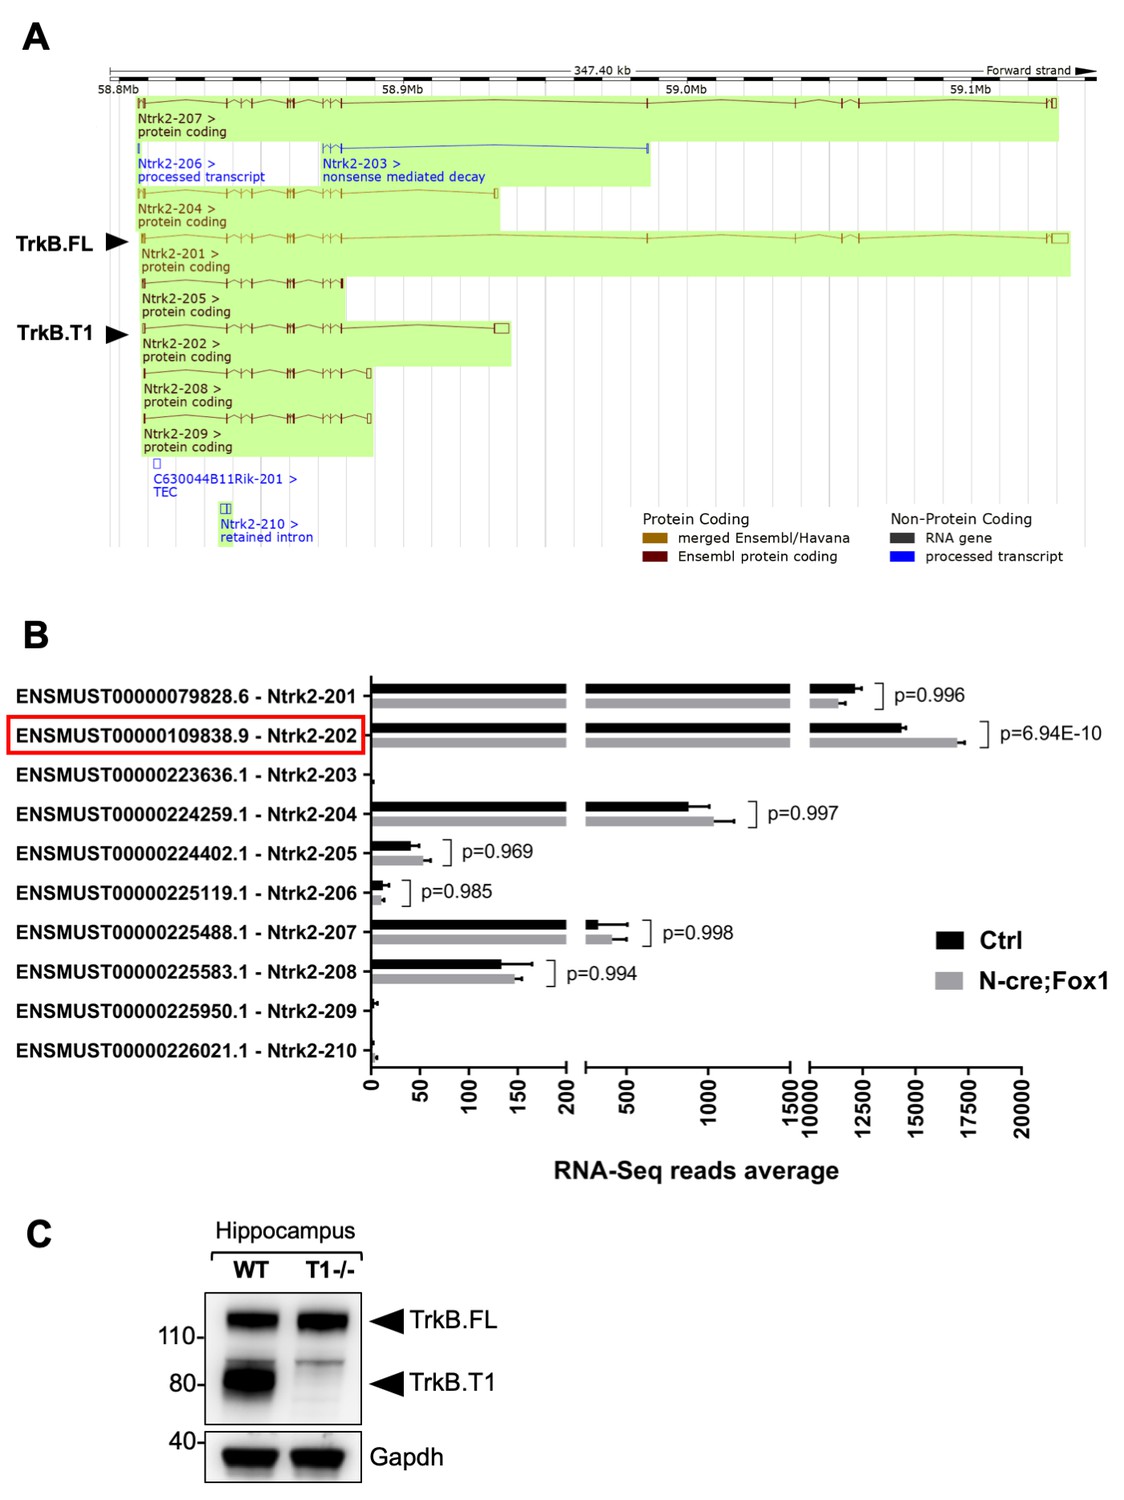
RNA-Seq deep coverage analysis of Ntrk2 (TrkB) transcripts shows specific increase of the TrkB.
T1 isoform levels in the hippocampus of Rbfox1 overexpressing animals. (A) Schematic representation of the murine Ntrk2 (TrkB) gene transcripts annotated from ENSEMBL (highlighted in green). In each transcript exons and introns are indicated with vertical and horizontal lines respectively. TrkB.FL (Ntrk2-201) and TrkB.T1 (Ntrk2-202) are indicated (Picture modified from Ensembl genome browser; ENSMUSG00000055254). (B) RNA-Seq specific analysis of the Ntrk2 transcripts in control (Ctrl; Nes-Cre) and N-cre;Fox1 hippocampus (Nes-Cre;R26-Rbfox1+/flox). Isoform IDs are indicated on the Y axis while the average of RNA-sequencing reads for every transcript is indicated on the X axis. TrkB.T1 (Ntrk2-202; red box) is the only TrkB isoform significantly modulated in the N-cre;Fox1 hippocampus. (C) Immunoblot analysis of wild type (WT) and TrkB.T1 knockout (T1-/-) hippocampus blotted with an antibody against the TrkB extracellular domain.
Figure 5 with 1 supplement
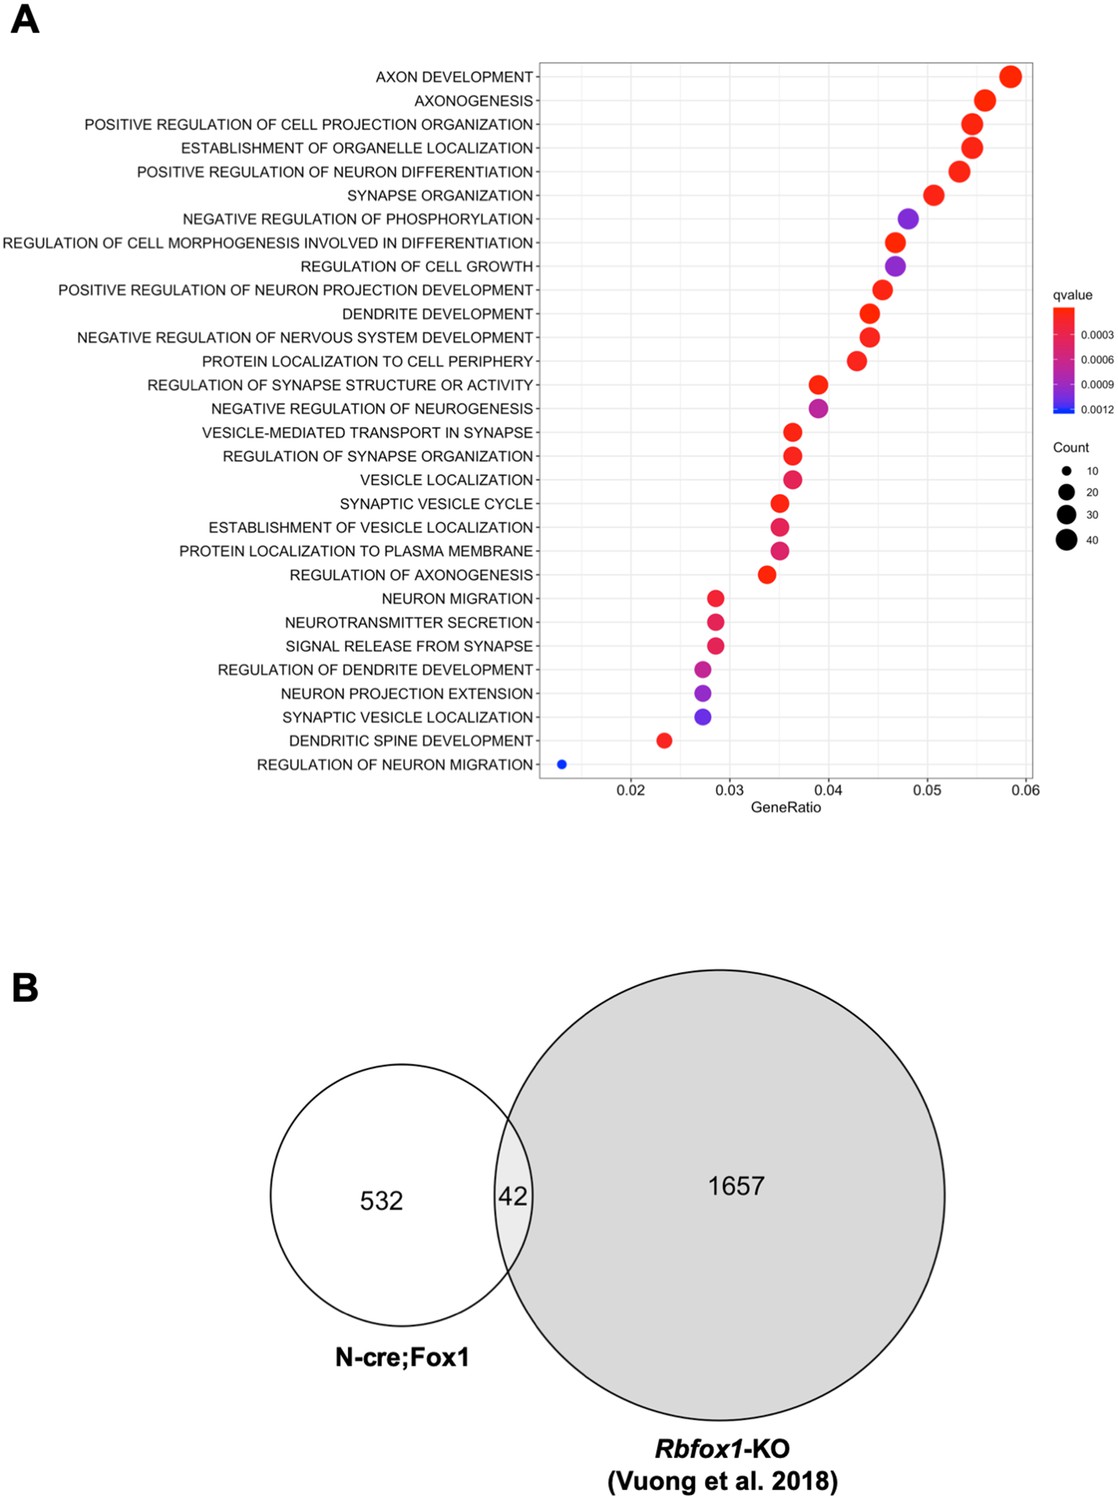
Upregulation or downregulation of Rbfox1 changes the expression of different gene-isoforms.
(A) Dot plot showing the top enriched biological process Gene Ontology (GO) terms. Note that significant over-represented GO terms (q-value <0.05) are neuronal related processes. GO terms are displayed on the left Y axis. (B) Venn diagram showing the number of overlapping gene-isoforms differentially expressed in N-cre;Fox1 and Rbfox1 knockout (Rbfox1-KO) hippocampus (Vuong et al., 2018).
Figure 5—figure supplement 1
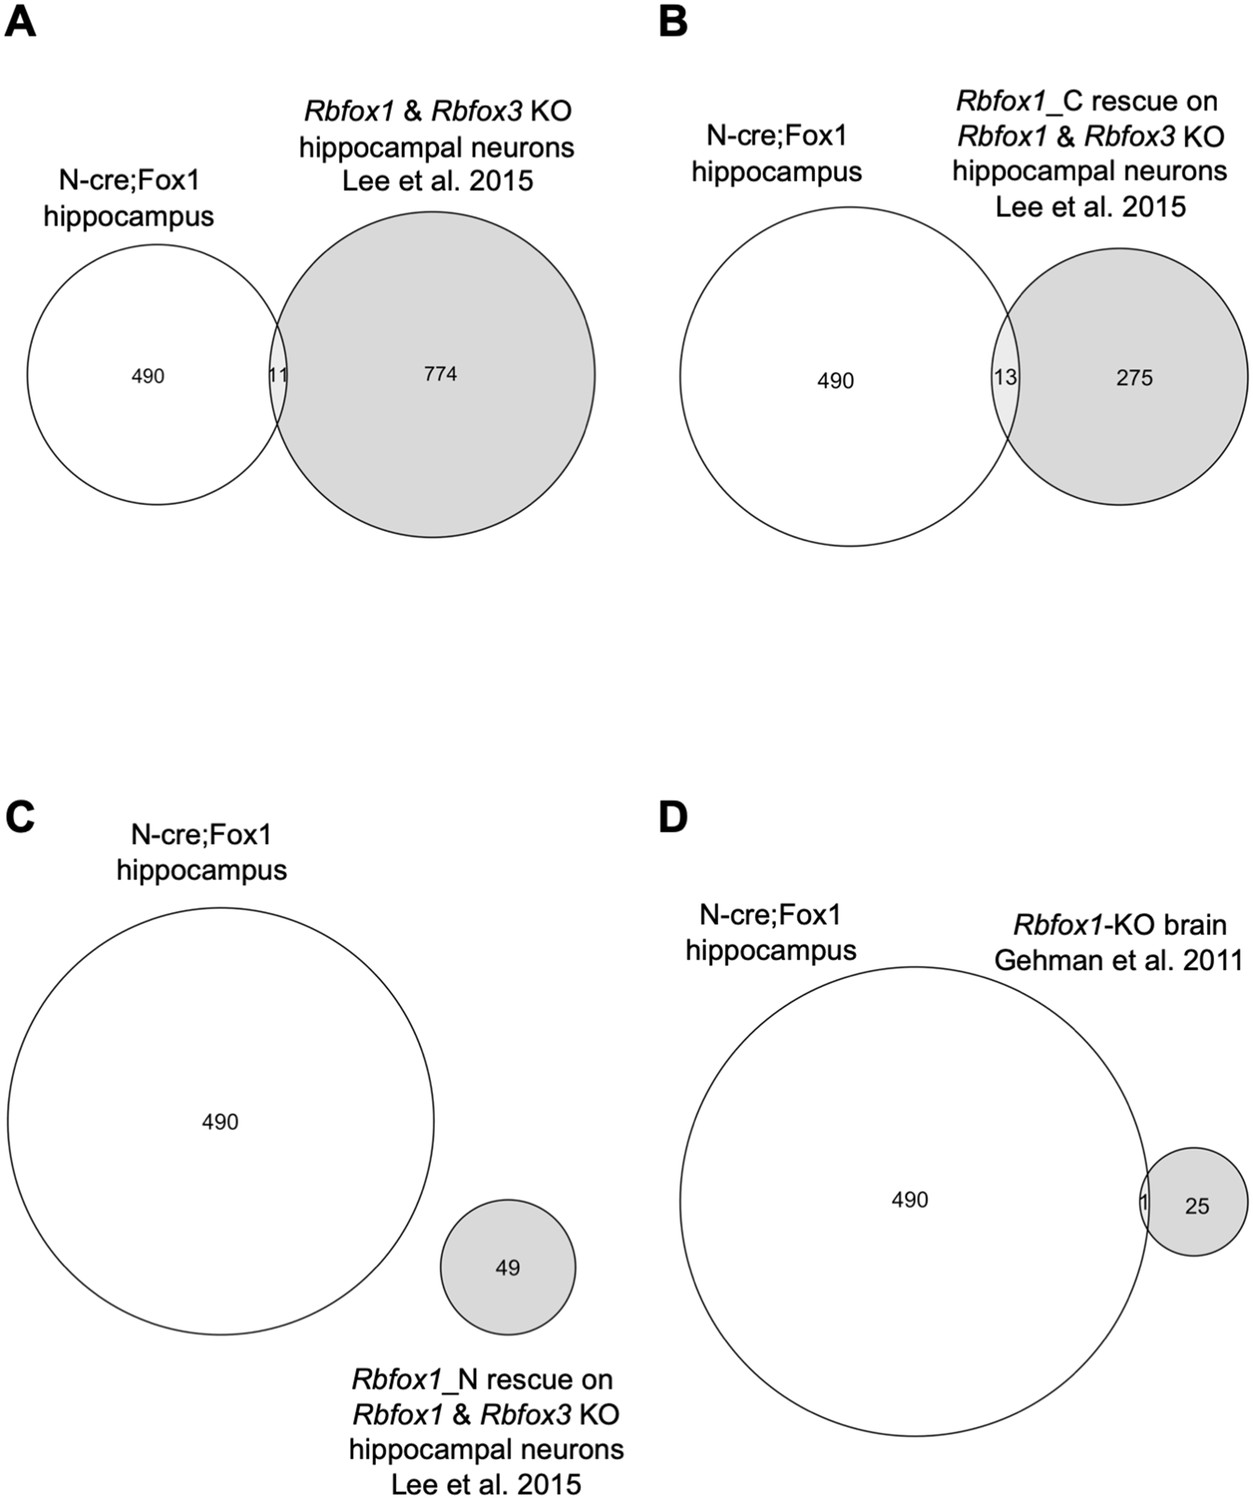
Genes modulated by Rbfox1 upregulation are largely un-affected by Rbfox1 knockout.
RNA-seq analysis comparing gene-isoforms modulated by hippocampal Rbfox1 upregulation (N-cre;Fox1) and hippocampal neuron Rbfox1 and Rbfox3 knockout (Lee et al., 2016), or whole brain Rbfox1-knockout (Gehman et al., 2011). Venn diagram showing the limited overlap of genes modulated in N-cre;Fox1 hippocampus relative to hippocampal neurons with Rbfox1 and Rbfox3 double knockout (A), nuclear Rbfox1 and Rbfox3 knockout (B) or cytoplasmic Rbfox1 and Rbfox3 knockout (C). Note that the specific knockout of the nuclear or cytoplasmic Rbfox1 isoforms in Lee et al. (2016) was achieved by rescuing the complete Rbfox1 KO with the cytoplasmic (Rbfox1_C) or nuclear isoform (Rbfox1_N) respectively. (D) Venn diagram showing the overlap of genes modulated in N-cre;Fox1 hippocampus and whole brain Rbfox1-KO.
Figure 6
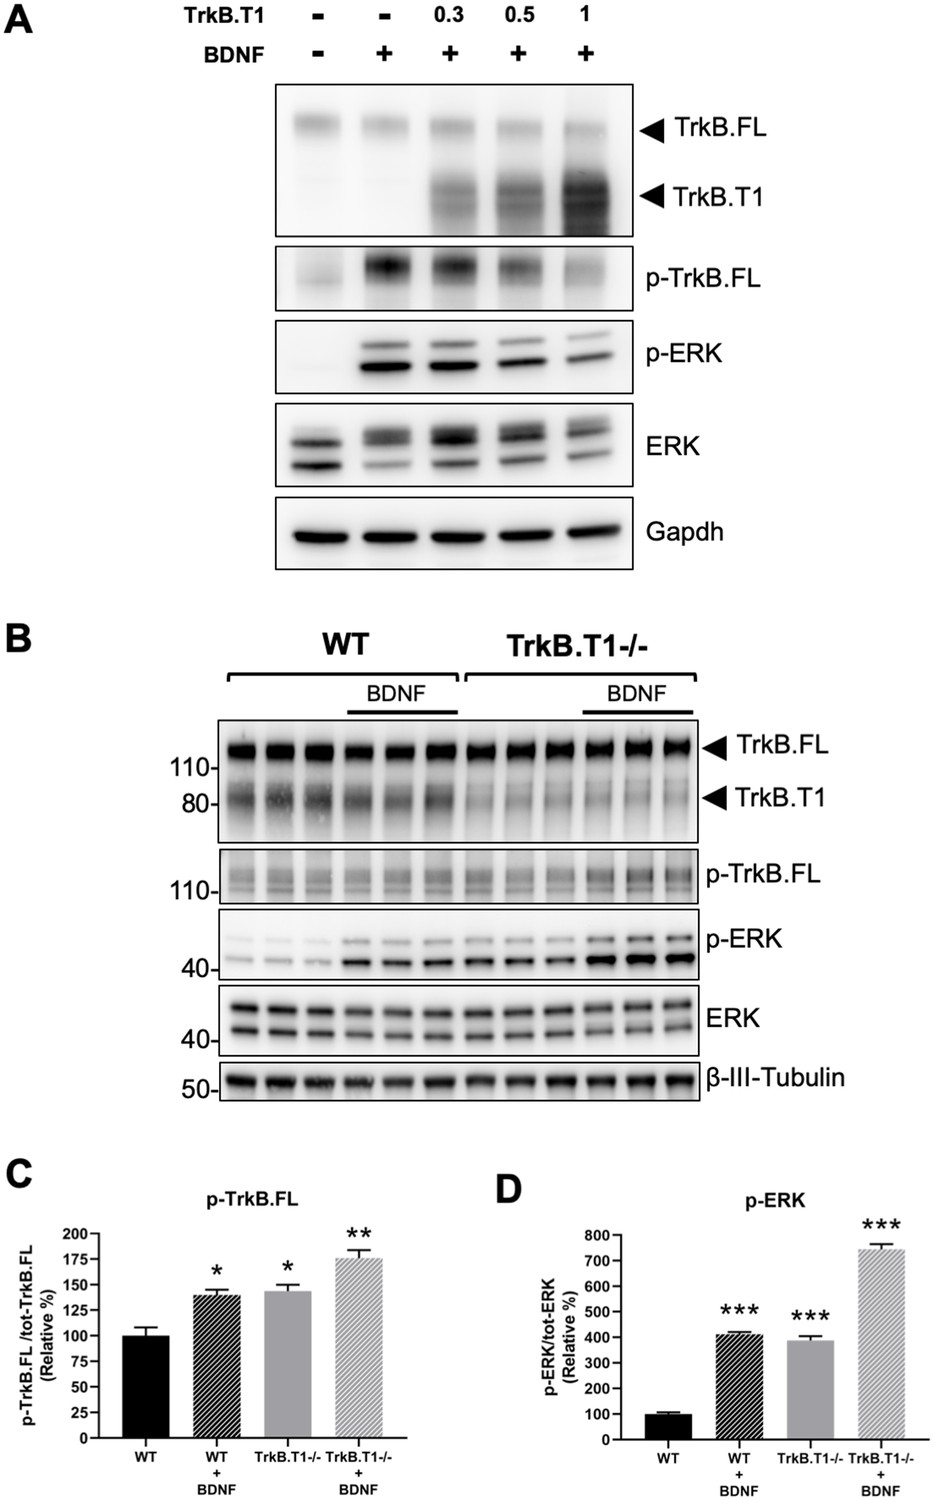
TrkB.T1 receptor expression regulates TrkB.FL signaling.
(A) TrkB activation by BDNF is decreased by increased levels of TrkB.T1. HEK293 cells stably expressing TrkB.FL were transfected with increasing amounts of a TrkB.T1 expressing plasmid (0.3 µg, 0.5 µg and 1 µg) before BDNF treatment (5 ng/ml for 5 min). Immunoblots were probed with antibodies against TrkB extracellular domain to detect both TrkB.FL and TrkB.T1, phospho-TrkB.FL at tyrosine 515 (p-TrkB.FL), phospho-ERK (p-ERK), ERK and Gapdh as controls. (B) TrkB.T1- /- neurons have increased BDNF signaling. Immunoblot analysis of E18.5 WT and TrkB.T1- /- primary hippocampal neurons cultured for 6 days in vitro before BDNF treatment (1 ng/ml for 5 min; black bar). Antibodies are as in (A) except for the β-III-tubulin antibody used as neuronal marker. (C, D) Immunoblot quantification analysis from (B) of p-TrkB.FL (C) and p-ERK (D) expressed respectively, as relative percentage of p-TrkB.FL over total TrkB.FL and phospho-ERK over total ERK. n = 3 ± SEM. * = p ≤ 0.05, ** = p ≤ 0.01, *** = p ≤ 0.001 (Student’s t-test).
Figure 7
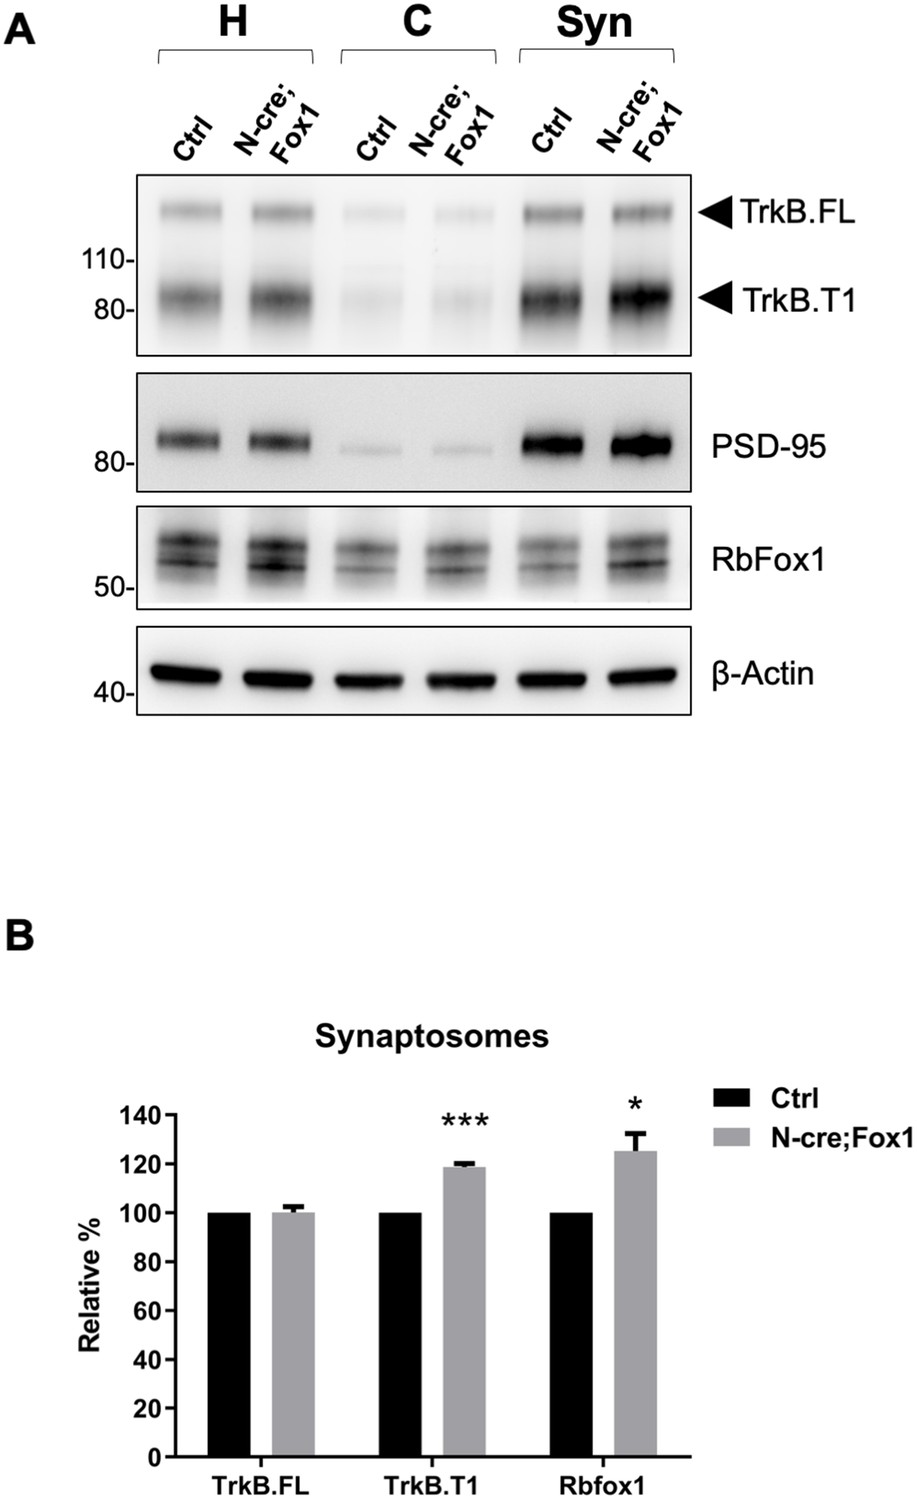
Upregulation of Rbfox1 leads to increased truncated TrkB.
T1 in synaptosomes. (A) Western blot analysis of TrkB isoform, PSD-95 and Rb-Fox1 expression in total homogenates (H), cytosolic (C) and synaptosome fraction (Syn) from hippocampus of control (Ctrl; Nes-Cre) and N-cre;Fox1 mouse brains. PSD-95 was used as control for enrichment of the synaptosomal fraction. (B) Immunoblot quantification of TrkB.FL, TrkB.T1 and Rbfox1 specific bands in the synaptosomal fraction as in (A); n = 3 ± SEM, *** = p ≤ 0.001, * = p ≤ 0.05 (Student’s t-test).
Figure 8 with 2 supplements
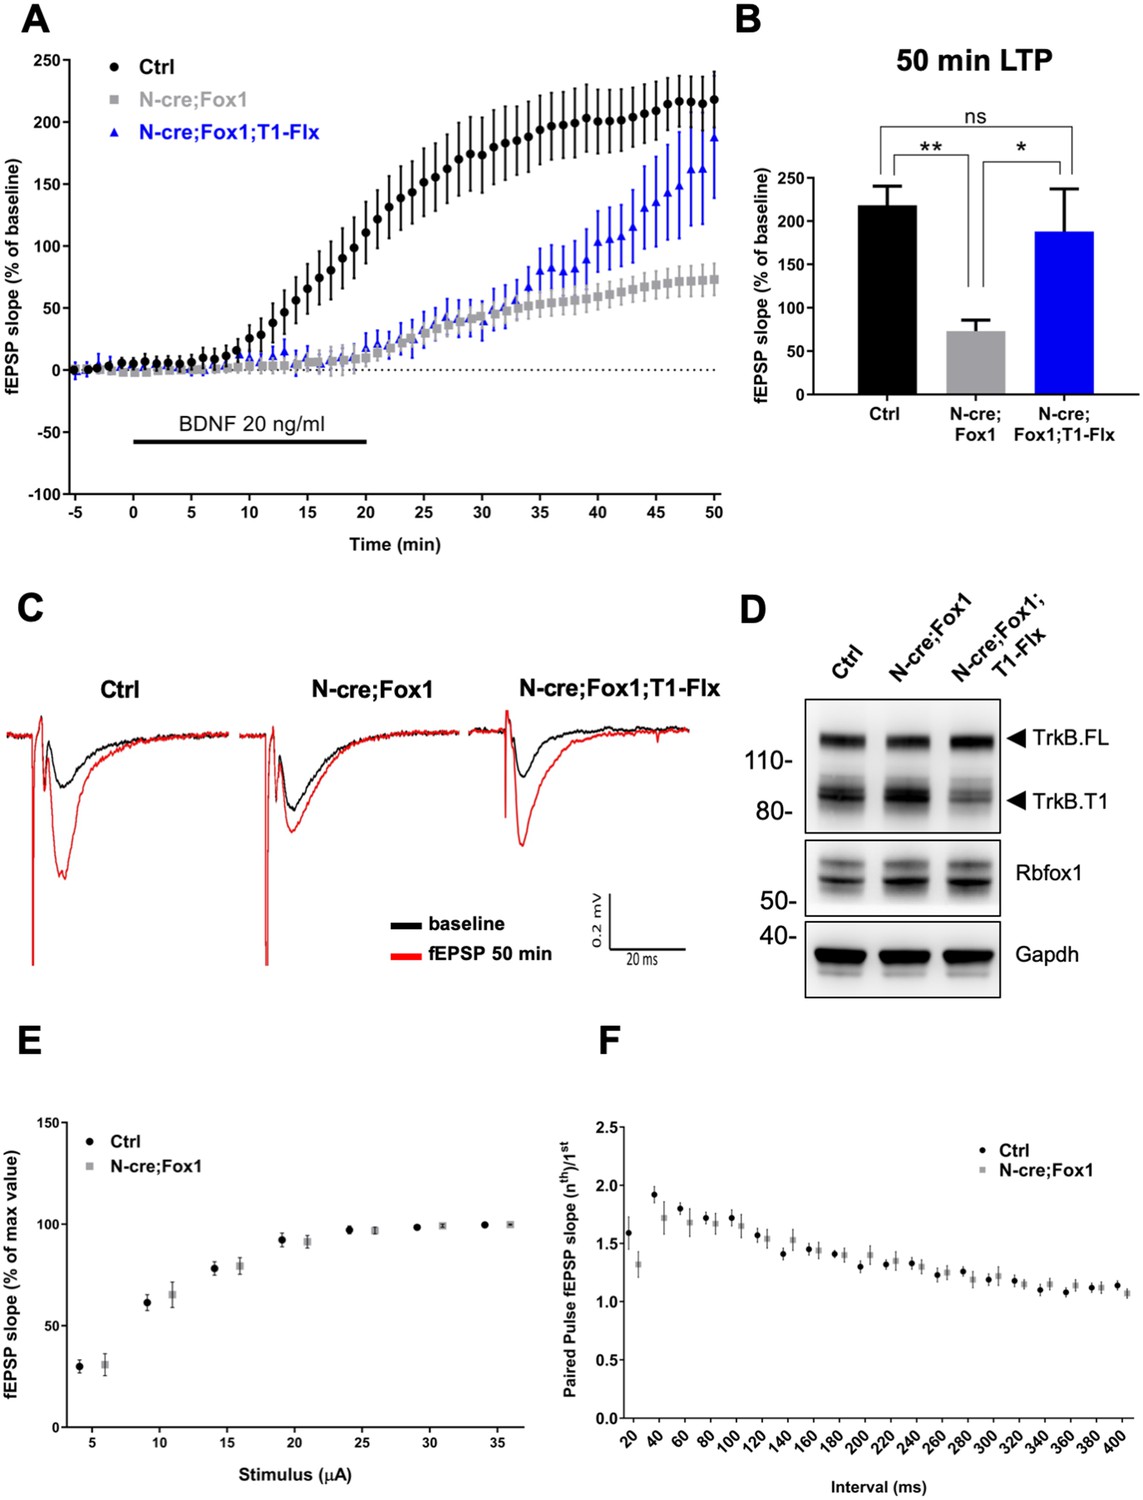
Rbfox1 overexpressing mice have impaired BDNF-induced LTP that is rescued by conditional removal of one TrkB.
T1 receptor allele. (A) Averaged time-course of the field excitatory postsynaptic potential (fEPSP) slope in hippocampal slices from control (Ctrl = Nes Cre, n = 10), N-cre;Fox1 (Nes-Cre;R26-Rbfox1+/flox, n = 10) and N-cre;Fox1;T1-Flx (Nes-Cre;R26-Rbfox1+/flox; TrkB.T1+/flox, n = 8) mice after extracellular application of BDNF (20 ng/ml). Values are expressed as fEPSP percentage of the baseline values (average of 5 min before BDNF application, mean ± SEM). BDNF application (20 min) is indicated by the black horizontal bar. (B) Histogram showing mean ± SEM of the fEPSP slope average at 50 min after BDNF infusion; ** = p ≤ 0.01; * = p ≤ 0.05; ns = p > 0.05 (One-way ANOVA followed by Tukey’s test). (C) Representative recording traces of slices before (baseline = black line) and 50 min after BDNF application (red line). (D) Western blot analysis of hippocampi from Ctrl, N-cre;Fox1 and N-cre;Fox1;T1-Flx mice probed with anti TrkB, Rbfox1 and Gapdh antibodies. (E) Input/Output relationship of Shaffer collateral projections on CA1 pyramidal neurons of Ctrl and N-cre;Fox1 hippocampal slices. Slope of fEPSP reported as percentage of the maximal recorded values plotted against the stimulation current. (F) Ratio between the second and first fEPSP evoked by the stimulation of Shaffer collateral and recorded in the CA1-radiatum at increasing time latency from 20 to 400 ms of Ctrl and N-cre;Fox1 hippocampal slices.
Figure 8—figure supplement 1
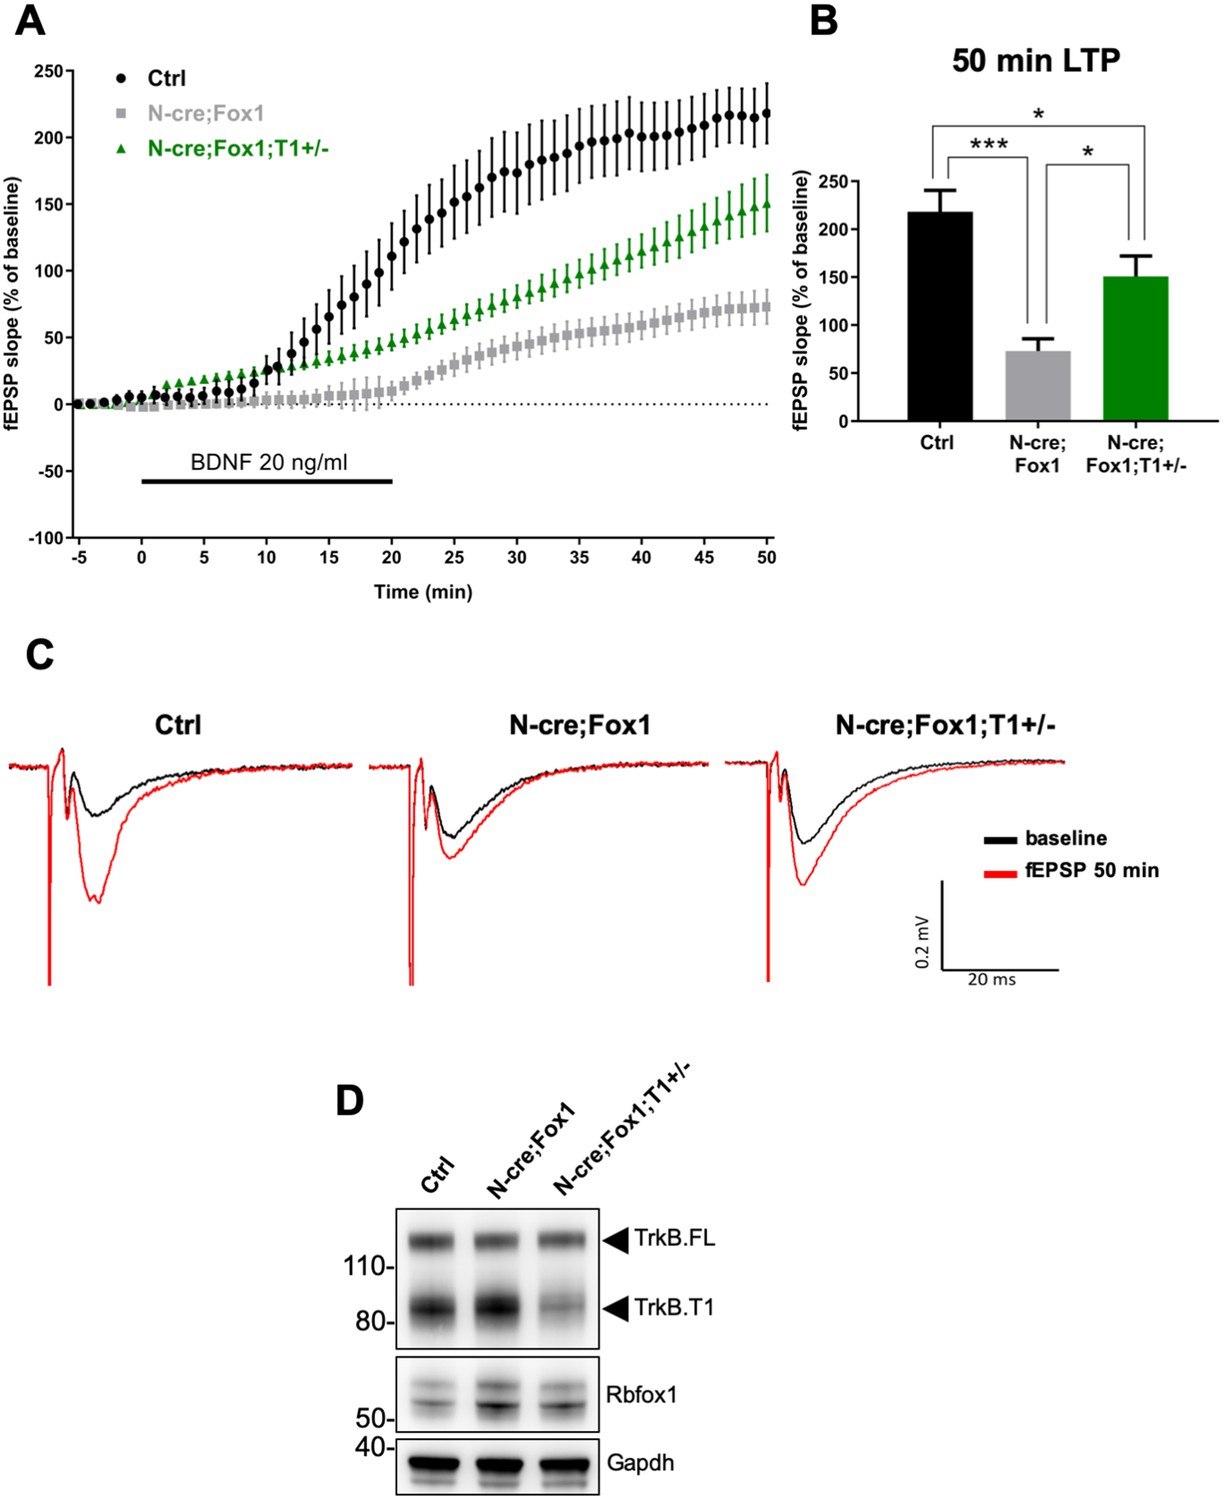
Rbfox1 overexpressing mice have impaired BDNF-induced LTP that is rescued by removal of one TrkB.
T1 receptor allele. (A) Averaged time-course of the field excitatory postsynaptic potential (fEPSP) slope in hippocampal slices from control (Ctrl = Nes Cre, n = 10), N-cre;Fox1(Nes-Cre;R26-Rbfox1+/flox; n = 10) and N-cre;Fox1;T1+/- (Nes-Cre;R26-Rbfox1+/flox;TrkB.T1+/-; n = 13) mice after extracellular application of BDNF (20 ng/ml). Values are expressed as fEPSP percentage of the baseline values (average of 5 min before BDNF application, mean ± SEM). BDNF application (20 min) is indicated by the black horizontal bar. (B) Histogram showing mean ± SEM of the fEPSP slope average at 50 min after BDNF infusion; *** = p ≤ 0.001; ** = p ≤ 0.01; * = p ≤ 0.05 (Student’s t-test). (C) Representative recording traces of slices before (baseline = black line) and 50 min after BDNF application (red line). (D) Western blot analysis of hippocampus expression of TrkB, Rbfox1 and Gapdh of animals analyzed in (A–C).
Figure 8—figure supplement 2

BDNF-induced LTP is not altered in TrkB.
T1 heterozygous animals. (A) Averaged time-course of changes in field excitatory postsynaptic potential (fEPSP) slope after extracellular application of BDNF (20 ng/ml) in mouse hippocampal slices from control (Ctrl; Nes-cre, n = 10) and TrkB.T1 heterozygous animals (T1+/-; n = 8). Values are expressed as fEPSP percentage of baseline values (average of 5 min before BDNF application, mean ± SEM). BDNF application (20 min) is indicated by the black horizontal bar. (B) Histogram showing the average mean ± SEM of the fEPSP slope at 50 min after BDNF infusion (n.s.: Student’s t-test). (C) Western blot analysis of hippocampal expression of TrkB, Rbfox1 and Gapdh of animals as in (A).
Tables
Key resources table
| Reagent type | Description | Reference | Identifiers | Additional information |
|---|---|---|---|---|
| Genetic reagent (M.musculus) | Rbfox1flox/flox | (Gehman et al., 2011) Jackson Laboratory | IMSR Cat# JAX:014089, RRID:IMSR_JAX:014089 | |
| Genetic reagent (M.musculus) | Nes-cre | Jackson Laboratory | IMSR Cat# JAX:003771, RRID:IMSR_JAX:003771 | |
| Genetic reagent (M.musculus) | Gt(ROSA)26Sor-LacZ | Jackson Laboratory | IMSR Cat# JAX:003309, RRID:IMSR_JAX:003309 | |
| Plasmid | CAG-STOP-eGFP-ROSA26TV | Addgene | RRID:Addgene_15912 | |
| Antibody | Anti-GFAP (rabbit polyclonal) | Agilent (Dako) | Agilent Cat# Z0334, RRID:AB_10013382 | IF (1:200) |
| Antibody | Anti-TrkB (rabbit polyclonal) | Millipore | Millipore Cat# 07–225, RRID:AB_310445 | WB (1:1000) |
| Antibody | Anti-TrkB (C13) (rabbit polyclonal) | Santa Cruz Biotechnology | Santa Cruz Biotechnology Cat# sc-119, RRID:AB_632559 | WB (1:500) |
| Antibody | Anti-TrkC (rabbit monoclonal) | Cell Signaling Technology | Cell Signaling Technology Cat# 3376, RRID:AB_2155283 | WB (1:1000) |
| Antibody | Anti-GAPDH (mouse monoclonal) | Millipore | Millipore Cat# MAB374, RRID:AB_2107445 | WB (1:2000) |
| Antibody | Anti-Cre (rabbit monoclonal) | Cell Signaling Technology | Cell Signaling Technology Cat# 15036, RRID:AB_2798694 | WB (1:1000) |
| Antibody | Anti-Rbfox1 (mouse monoclonal) | Millipore | Millipore Cat# MABE985, RRID:AB_2737389 | WB (1:1000); IF (1:200) |
| Antibody | Anti-Rbfox2 (rabbit polyclonal) | Bethyl Laboratories | Bethyl Cat# A300-864A, RRID:AB_609476 | WB (1:1000) |
| Antibody | Anti-Rbfox3 (mouse monoclonal) | Millipore | Millipore Cat# MAB377, RRID:AB_2298772 | WB (1:1000) |
| Antibody | Anti-Tra2b (rabbit polyclonal) | Bethyl Laboratories | Bethyl Cat# A305-011A, RRID:AB_2621205 | WB (1:1000) |
| Antibody | Anti-PSD95 (rabbit polyclonal) | Millipore | Millipore Cat# AB9708, RRID:AB_2092543 | WB (1:1000) |
| Antibody | Anti-phospho-TrkB (rabbit polyclonal) | Cell Signaling Technology | Cell Signaling Technology Cat# 9141, RRID:AB_2298805 | WB (1:1000) |
| Antibody | Anti-phospho-ERK (mouse monoclonal) | Cell Signaling Technology | Cell Signaling Technology Cat# 9106, RRID:AB_331768 | WB (1:1000) |
| Antibody | Anti-ERK (rabbit polyclonal) | Cell Signaling Technology | Cell Signaling Technology Cat# 9102, RRID:AB_330744 | WB (1:1000) |
| Antibody | Anti-β-Actin (mouse monoclonal) | Santa Cruz Biotechnology | Santa Cruz Biotechnology Cat# sc-47778 HRP, RRID:AB_2714189 | WB (1:3000) |
| Antibody | Anti-β-III-Tubulin (mouse monoclonal) | Covance | Covance Cat# MMS-435P, RRID:AB_2313773 | WB (1:1000) |
| Antibody | Donkey Anti-mouse Alexa Fluor 488 Conjugated | Thermo Fisher Scientific | Thermo Fisher Scientific Cat# A-21202, RRID:AB_141607 | IF (1:1000) |
| Antibody | Donkey Anti-rabbit Alexa Fluor 555 Conjugated | Thermo Fisher Scientific | Thermo Fisher Scientific Cat# A-31572, RRID:AB_162543 | IF (1:1000) |
Additional files
-
Supplementary file 1
List of gene-isoforms significantly changed by Rbfox1 up-regulation in the hippocampus (Excel file; N-cre-Fox1).
- https://doi.org/10.7554/eLife.49673.018
-
Supplementary file 2
List of significantly dysregulated gene-isoforms that are overlapping between Rbfox1 upregulation or knockout in the hippocampus (Excel tab: N-cre;Fox1 vs Rbfox1-KO) and complete list of gene-isoforms significantly changed by Rbfox1 knockdown in the hippocampus (Excel tab: Rbfox1-KO; Vuong et al., 2018).
- https://doi.org/10.7554/eLife.49673.019
-
Transparent reporting form
- https://doi.org/10.7554/eLife.49673.020
Download links
A two-part list of links to download the article, or parts of the article, in various formats.
Downloads (link to download the article as PDF)
Open citations (links to open the citations from this article in various online reference manager services)
Cite this article (links to download the citations from this article in formats compatible with various reference manager tools)
Rbfox1 up-regulation impairs BDNF-dependent hippocampal LTP by dysregulating TrkB isoform expression levels
eLife 8:e49673.
https://doi.org/10.7554/eLife.49673


