Mitochondria supply ATP to the ER through a mechanism antagonized by cytosolic Ca2+
- Degenerative Diseases Program, SBP Medical Discovery Institute, United States
- Gottfried Schatz Research Center, Medical University of Graz, Austria
- University of California, San Diego, United States
Figures
Figure 1 with 8 supplements

ER ATP homeostasis is maintained by oxidative phosphorylation.
(A) Confocal microscopy confirms ER localization of the ER ATP FRET reporter, ERAT in H9-D2 CHO cells. A representative confocal micrograph shows a high degree of co-localization of ERAT fluorescence in green with ER-Tracker Red, in red. (B) Increased F8 expression in H9-D2 CHO cells by SAHA treatment does not alter ERAT’s co-localization with ER-Tracker Red. (Scale bar: 10 µm) (C) A cartoon model depicting the ET ATP monitoring system. Importantly, the ER is an obligate ATP consumer as there is no known ATP regeneration system inside the ER lumen. ERAT reports steady state ATP levels inside the ER, which is a dynamic balance between ATP supply and ATP consumption. (D) 2-DG (20 mM) has no effect on cellular respiration. Oxygen consumption rates (OCR) in H9 CHO cells were measured by an XF-24 platform (Seahorse BioScience), using serial injections of the compounds: first PBS or 2-DG followed sequentially by 1 µM oligomycin (Oligo), 1 µM FCCP and 1 µM rotenone together with 10 µM antimycin A (Rot + AA). (E) The effect of OxPhos inhibitors (oligomycin, rotenone and FCCP at the indicated concentrations) on ER ATP was examined by flow cytometry at four time points as indicated. The same tubes of suspended H9 CHO cells were repeatedly sampled after OxPhos inhibition. Statistical significance values for curve comparisons by two-way ANOVA are labeled for individual inhibitors versus the ‘DMSO’ control group marked by an upper case ‘C’. (F) Administration of OxPhos inhibitors for 15 min, represented by oligomycin, rotenone and FCCP, rapidly reduces ER ATP in H9 CHO cells. DMSO was included as solvent control for comparison. Statistical significance values are labeled for individual comparisons. (G) Administration of IAA, a glycolysis inhibitor, increases ER ATP levels (detected by flow cytometry) in H9 CHO cells. Experiments were repeated four times, and a representative result is shown. Specifically, histograms of ER ATP levels for individual cells at two IAA concentrations (50 µM and 100 µM, treated for 2 hr) are shown with the y-axis representing normalized cell counts. More than ten thousand cells were sampled for every treatment condition, as indicated on the graph. (H) Glucose supplementation (5 mM) to DMEM medium with only OxPhos substrates (with 1 mM sodium pyruvate supplemented) does not affect ER ATP levels. H9 CHO cells stably transfected with the ERAT reporter were incubated in the serum-free modified DMEM medium, which contains substrates (i.e. pyruvate plus L-Ala-Gln) to support only OxPhos, for 1 hr at 37°C in a cell culture incubator, before flow analysis for ER ATP status. For the ‘1 µM Oligo’ group, oligomycin was added to cells for the last 20 min of incubation in glucose-free medium. Two-way ANOVA was applied for statistical analysis of geometric means of fluorescence intensity (gMFI), with significance levels expressed as: n.s: - not significant; * - p≤0.05; **- p≤0.01; ***- p<0.001; **** - p<0.0001. The same statistical analysis was applied in the following figures.
Figure 1—figure supplement 1
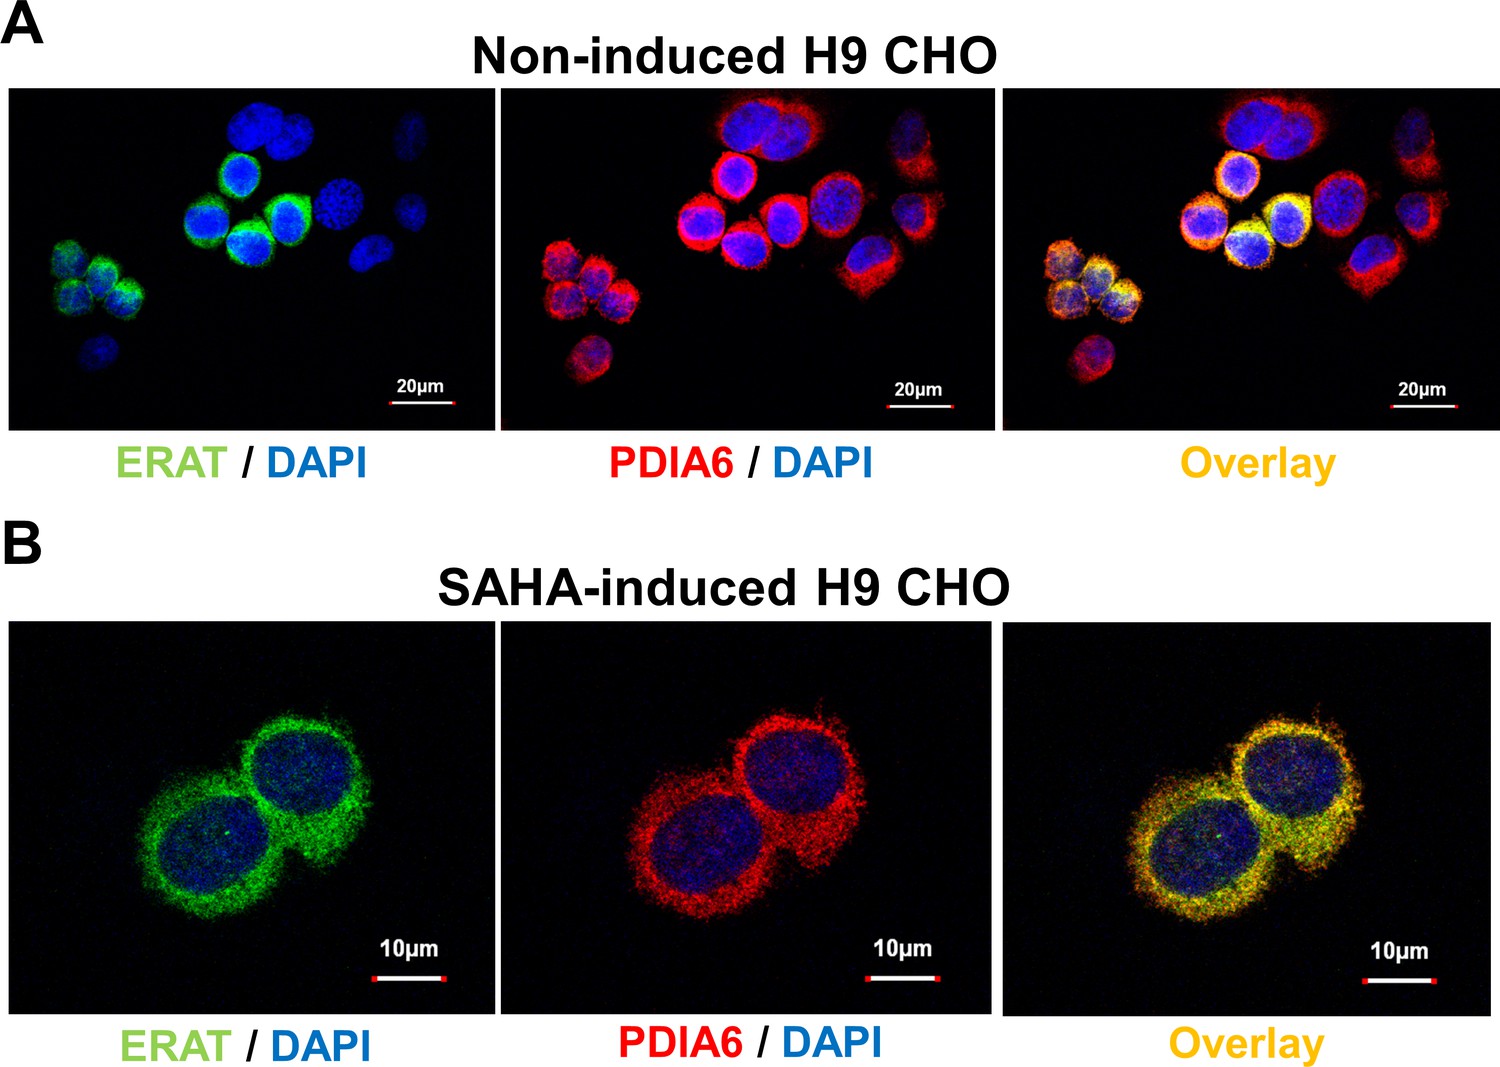
The ERAT probe is localized to the ER lumen.
(A) Confocal microscopy confirms ER localization of the ER ATP reporter, ERAT, in fixed H9 CHO cells. A representative confocal micrograph shows a high degree of co-localization of ERAT fluorescence in green with PDIA6 immunofluorescence in red. Nuclei were counter-stained with DAPI in blue. (Scale bar: 20 µm). (B) F8 expression upon SAHA treatment does not alter ERAT’s co-localization with PDIA6. (Scale bar: 10 µm).
Figure 1—figure supplement 2
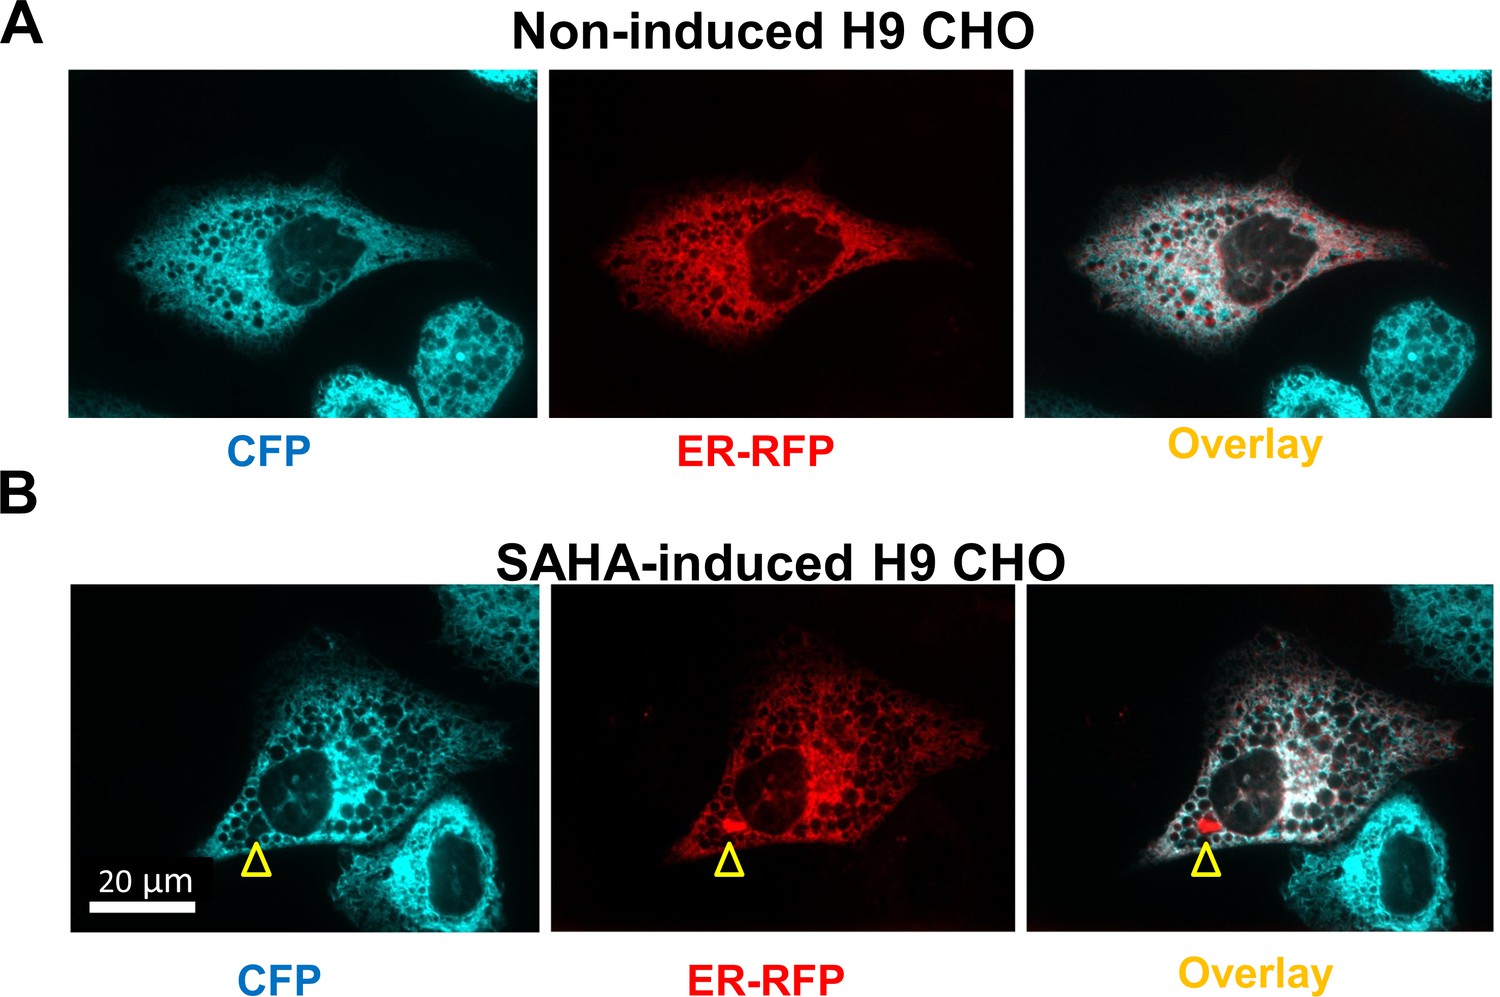
The ERAT probe is localized to the ER lumen.
(A) Confocal microscopy confirms ER localization of the ER ATP reporter, ERAT, in live H9-D2 CHO cells. A representative confocal micrograph shows a high degree of co-localization of ERAT fluorescence in green with ER-RFP maker fluorescence in red. In addition, there are ERAT-positive cells without ER-RFP expression. (B) F8 expression upon SAHA treatment does not alter ERAT’s co-localization with ER-RFP maker, in live H9-D2 CHO cells. Yellow arrowhead indicates a protein aggregate of RFP in cytosol. (Scale bar: 20 µm; the same scale bar is used for (A) and B panels).
Figure 1—figure supplement 3
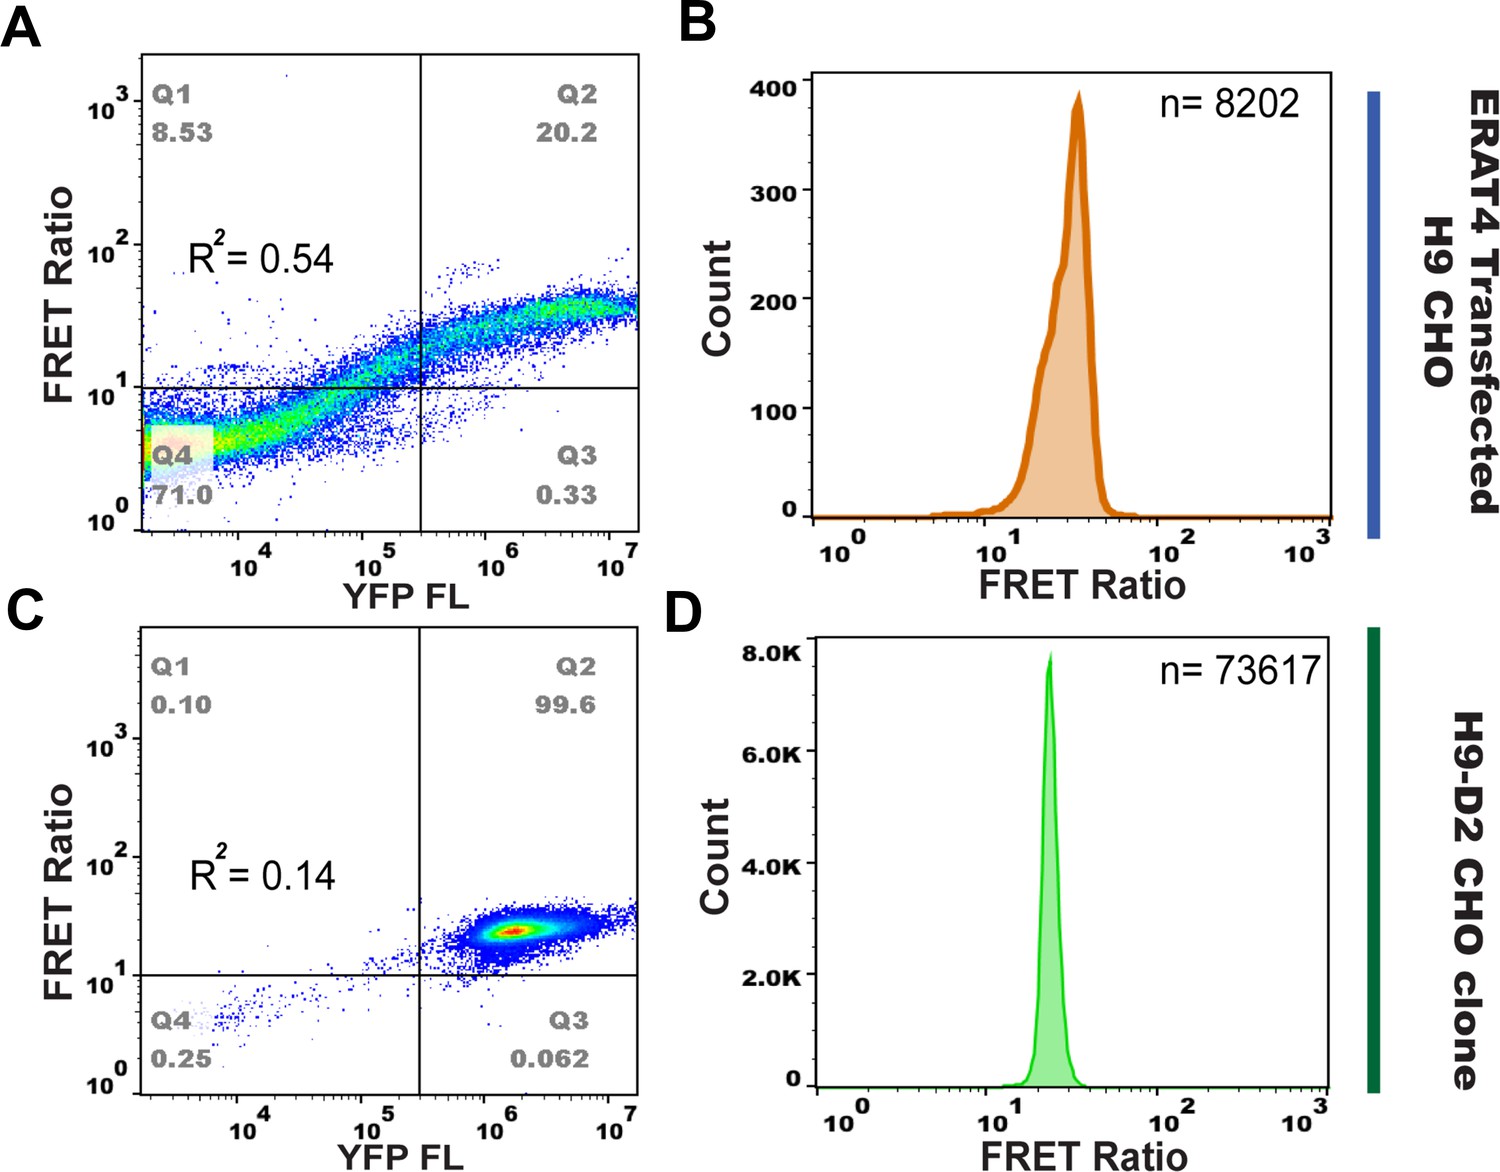
A single clone of H9-D2 cells was engineered to facilitate flow-cytometry based ER ATP analysis.
After ERAT4N7Q transfection and G418 selection, a single clone of H9 cells, H9-D2 cells, was further obtained to facilitate the flow-based FRET assay. H9-D2 cells have unanimous ERAT4N7Q expression with reduced R-square of FRET vs. YFP, in comparison to the unselected H9 cell population. The FRET ratio vs. YFP fluorescence plots were generated by FlowJO software for comparison purposes. (n = 41701 events for (A) and 74224 for (C), respectively). When reporter positive cells (defined as YFPhi population) were gated out for analysis, data normality for FRET ratio was improved for H9-D2 cells (n = 8202 events for (B) and 73617 for (D), respectively). The FRET ratio generated by H9-D2 cells allowed more accurate data analysis through ANOVA.
Figure 1—figure supplement 4
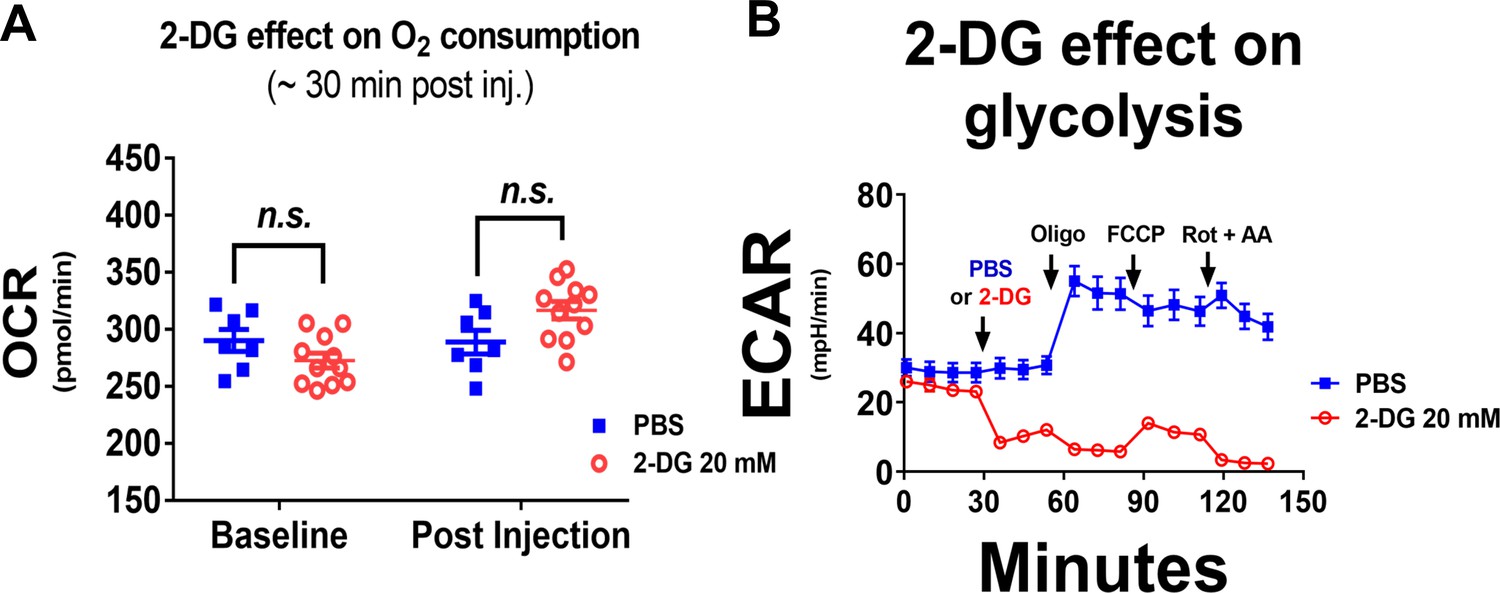
2-DG treatment does not reduce OxPhos of H9 CHO cells.
(A) 2-DG treatment for ~ 30 min (20 mM final concentration) has no effect on cellular oxygen usage. Oxygen consumption rates (OCR), in H9 CHO cells were measured by an XF-24 platform before serial injections of the OxPhos inhibitors (as shown in main Figure 1D). OCR values from individual wells for both groups are shown here as scattered plots with Mean ± SEM. The ‘n.s.’ note indicates no significance detected. (B) In the same metabolic flux experiment as shown in main Figures 1D and 2-DG treatment immediately attenuated extracellular acidification rate (ECAR, in milli pH per minute), a surrogate measure designed to reflect cellular glycolysis efficiency.
Figure 1—figure supplement 5
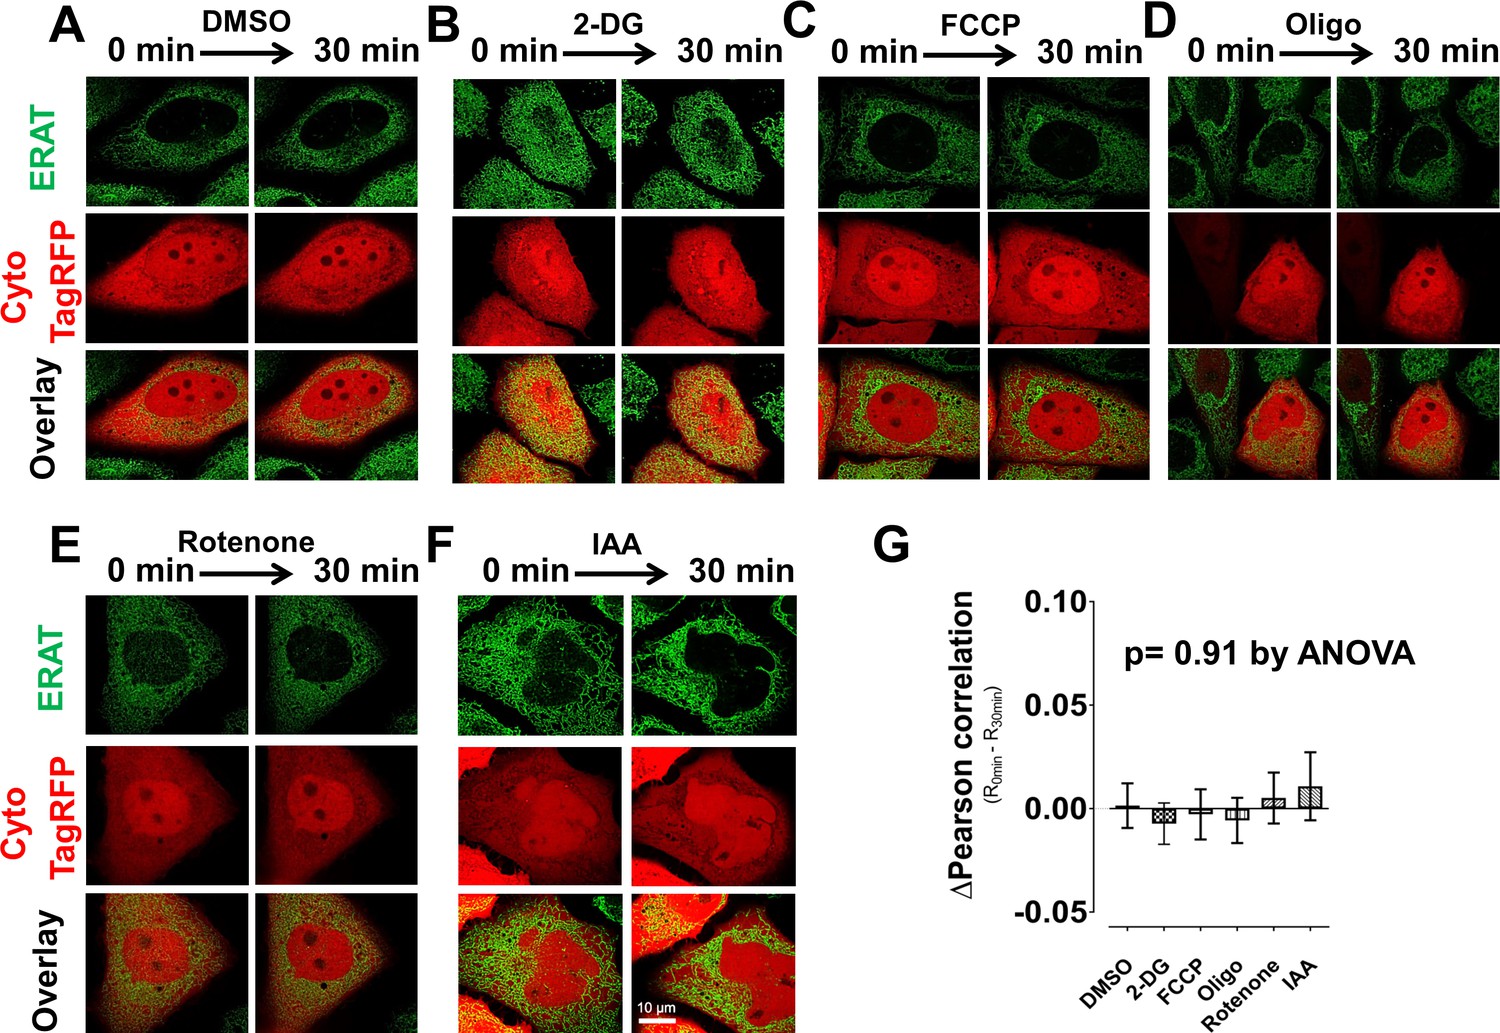
ER localization of ERAT probe is not affected by brief treatment with bio-energetic inhibitors.
Confocal microscopy confirms ER localization of the ERAT reporter in live H9-D2 CHO cells, both before and after treatment with bio-energetic inhibitors for 30 min. A representative confocal micrograph shows distinct compartmentation of ERAT fluorescence in green, in contrast to cytosol-targeted TagRFP fluorescence in red. Bio-energetic inhibitors used here are: (A). DMSO as vehicle control (0.01%, vol/vol); (B). 10 mM 2-DG; (C). 3 µM FCCP; (D). 3 µM oligomycin; (E). 5 µM rotenone; (F). 100 µM IAA. (G). Analysis of Pearson correlation coefficient shows no change in ERAT fluorescence pattern before and after inhibitor treatment.
Figure 1—figure supplement 6

The dynamic range of the ER ATP change was determined by flow cytometry.
In an effort to determine the dynamic range of the FRET ratio in response to ER ATP change, H9 CHO cells were first treated with DMSO (A). (1% by volume) or 2-DG (B). (20 mM) for 2 hr, before the cells were trypsinized and analyzed by flow cytometry. After two readings by flow (0 min and 7 min), half of the cells in suspension were further treated with 1 µM oligomycin, indicated by the ‘Oligo’ with arrowhead. The ‘Vehicle’ group received DMSO as a control. A raw value of ~ 21 was determined to be the lowest range after the ATP regeneration machinery was shut off.
Figure 1—figure supplement 7
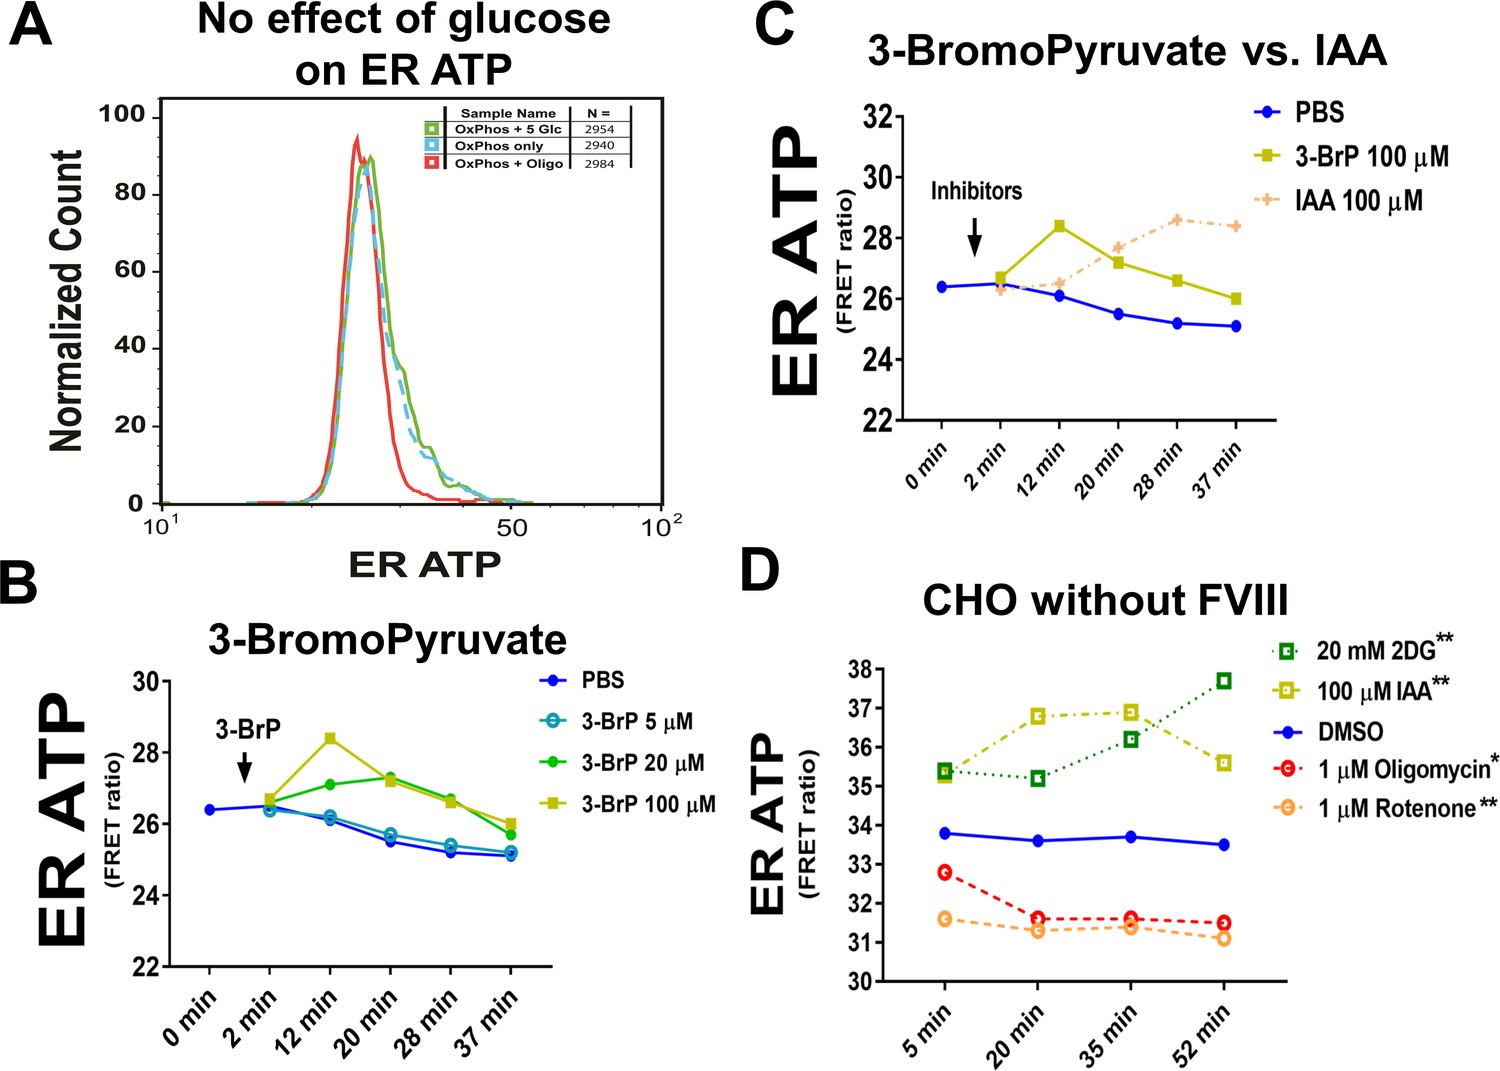
Glucose supplementation does not alter ER ATP levels and 3-Bromopyruvate increases ER ATP levels.
(A) Glucose supplementation (5 mM x 1 hr) in basal medium with only OxPhos substrates has no effect on ATP levels in the ER, while oligomycin reduces ER ATP. The glucose supplemented group is represented by a green solid line, and basal media group (DMEM medium with only OxPhos substrates, Seahorse BioSciences, Cat. # 100965 with 1 mM sodium pyruvate supplemented) is represented by a blue dotted line. The oligomycin treated group is shown by a red solid line. (B) 3-Bromopyruvate (BrP) was injected at the indicated concentrations and ER ATP levels were monitored in H9 CHO cells expressing the ERAT reporter. ER ATP levels increased briefly after BrP injection at 20 µM and 100 µM. (C) ER ATP levels in H9 CHO cells in response to IAA and BrP (both at end concentration of 100 µM) were compared in the same experiment. Both compounds increased ER ATP levels detected by the FRET-based ERAT reporter. (D) OxPhos inhibitors (oligomycin and rotenone) reduce ER ATP in DUK-CHO cells that do not express human F8. In contrast, glycolysis inhibitors, represented by 2-DG and IAA at the indicated concentrations, increase ER ATP levels. Statistical significance values are labeled in the legend for individual compounds, relative to the ‘DMSO’ group. Two-way ANOVA was applied for statistical analysis of geometric means of fluorescence intensity (gMFI), with significance levels expressed as: n.s: - not significant; * - p≤0.05; **- p≤0.01; ***- p<0.001; **** - p<0.0001.
Figure 1—figure supplement 8
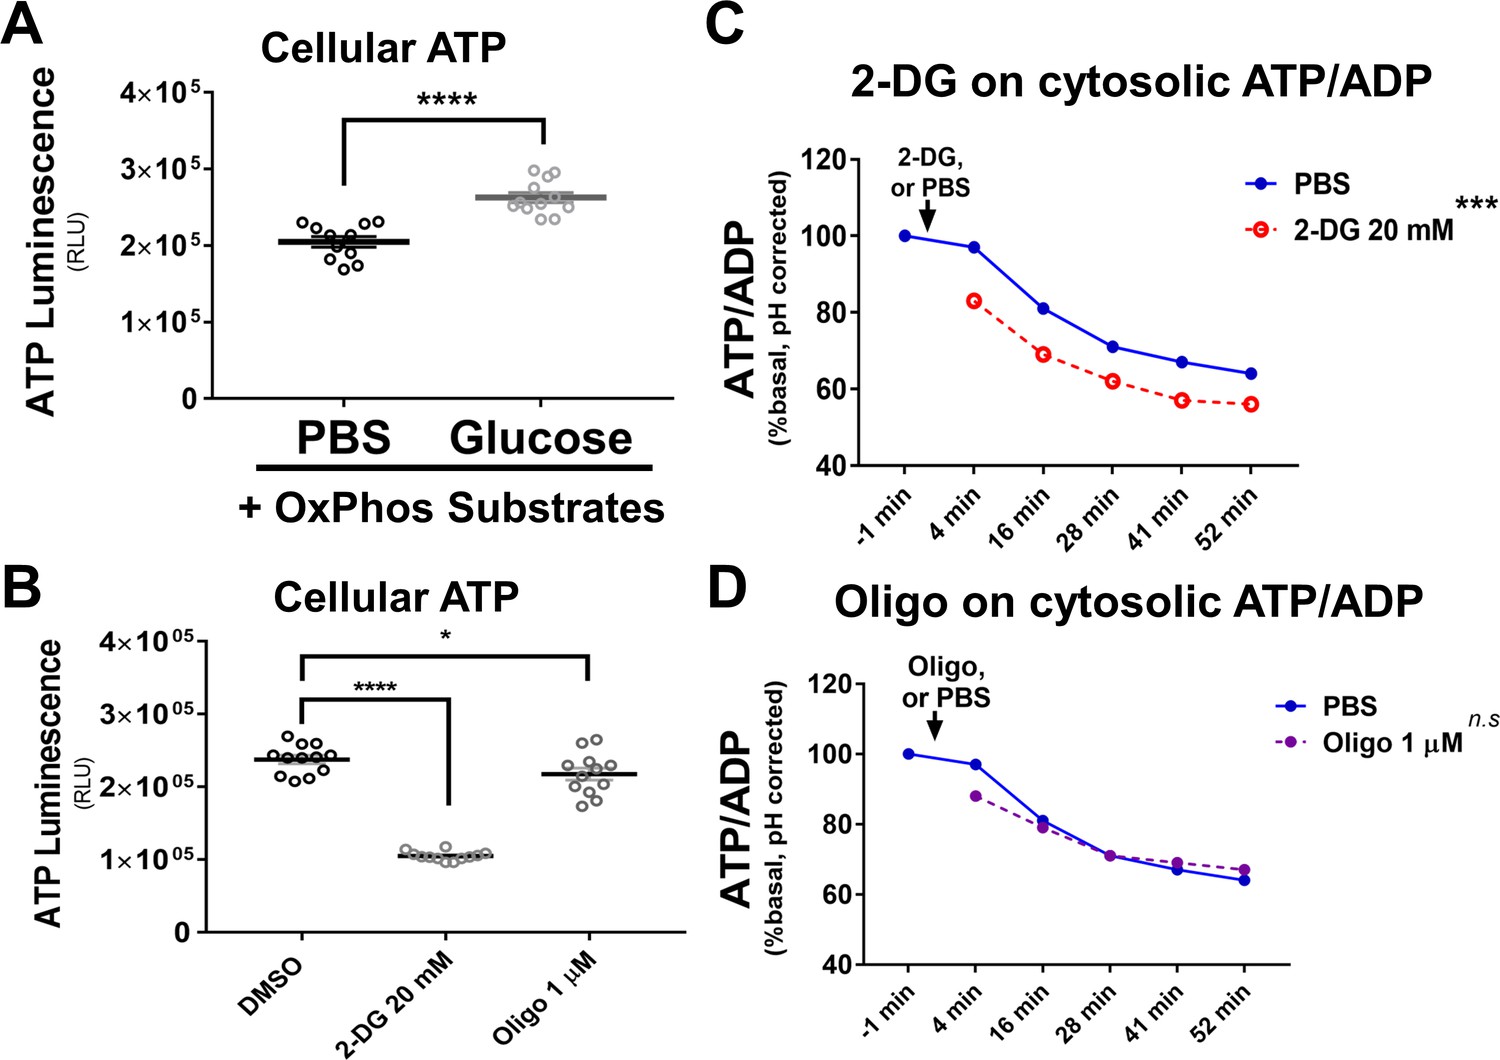
Glucose supplementation increases total cellular ATP while 2-DG decreases the cytosolic ATP-to-ADP ratio.
(A) Glucose supplementation (5 mM x1 hr) in basal medium with only OxPhos substrates increases the total cellular ATP content. Basal medium is DMEM medium with only OxPhos substrates (Seahorse BioSciences, Cat. # 100965 with 1 mM sodium pyruvate supplemented). (B) In complete H9 CHO medium (Alpha MEM, no FBS supplemented), 2-DG (20 mM) greatly reduces total ATP content in H9 cells, while oligomycin (1 µM) slightly reduces total ATP content. (C) 2-DG treatment reduces cytosolic the ATP-to-ADP ratio. 2-DG (20 mM) was injected at 0 min. The ATP/ADP ratios were significantly decreased in H9 CHO cells that received 2-DG. (D) Oligomycin treatment (1 µM) does not significantly alter the cytosolic ATP-to-ADP ratio. For panels A) and B), total cellular ATP contents were measured by ATPLite kit. For panels (C and D), cytosolic ATP/ADP ratios in H9 CHO cells were monitored by the PercevalHR probe through flow cytometry-based ratiometric analysis. The ratiometric PercevalHR parameter values were further corrected by the cpYFP ratiometric reading from cells treated simultaneously with the same toxins, in a separate set of H9 CHO cells, for pH correction.
Figure 2 with 2 supplements
A Ca2+ gradient across the ER membrane is required to maintain ER ATP homeostasis.
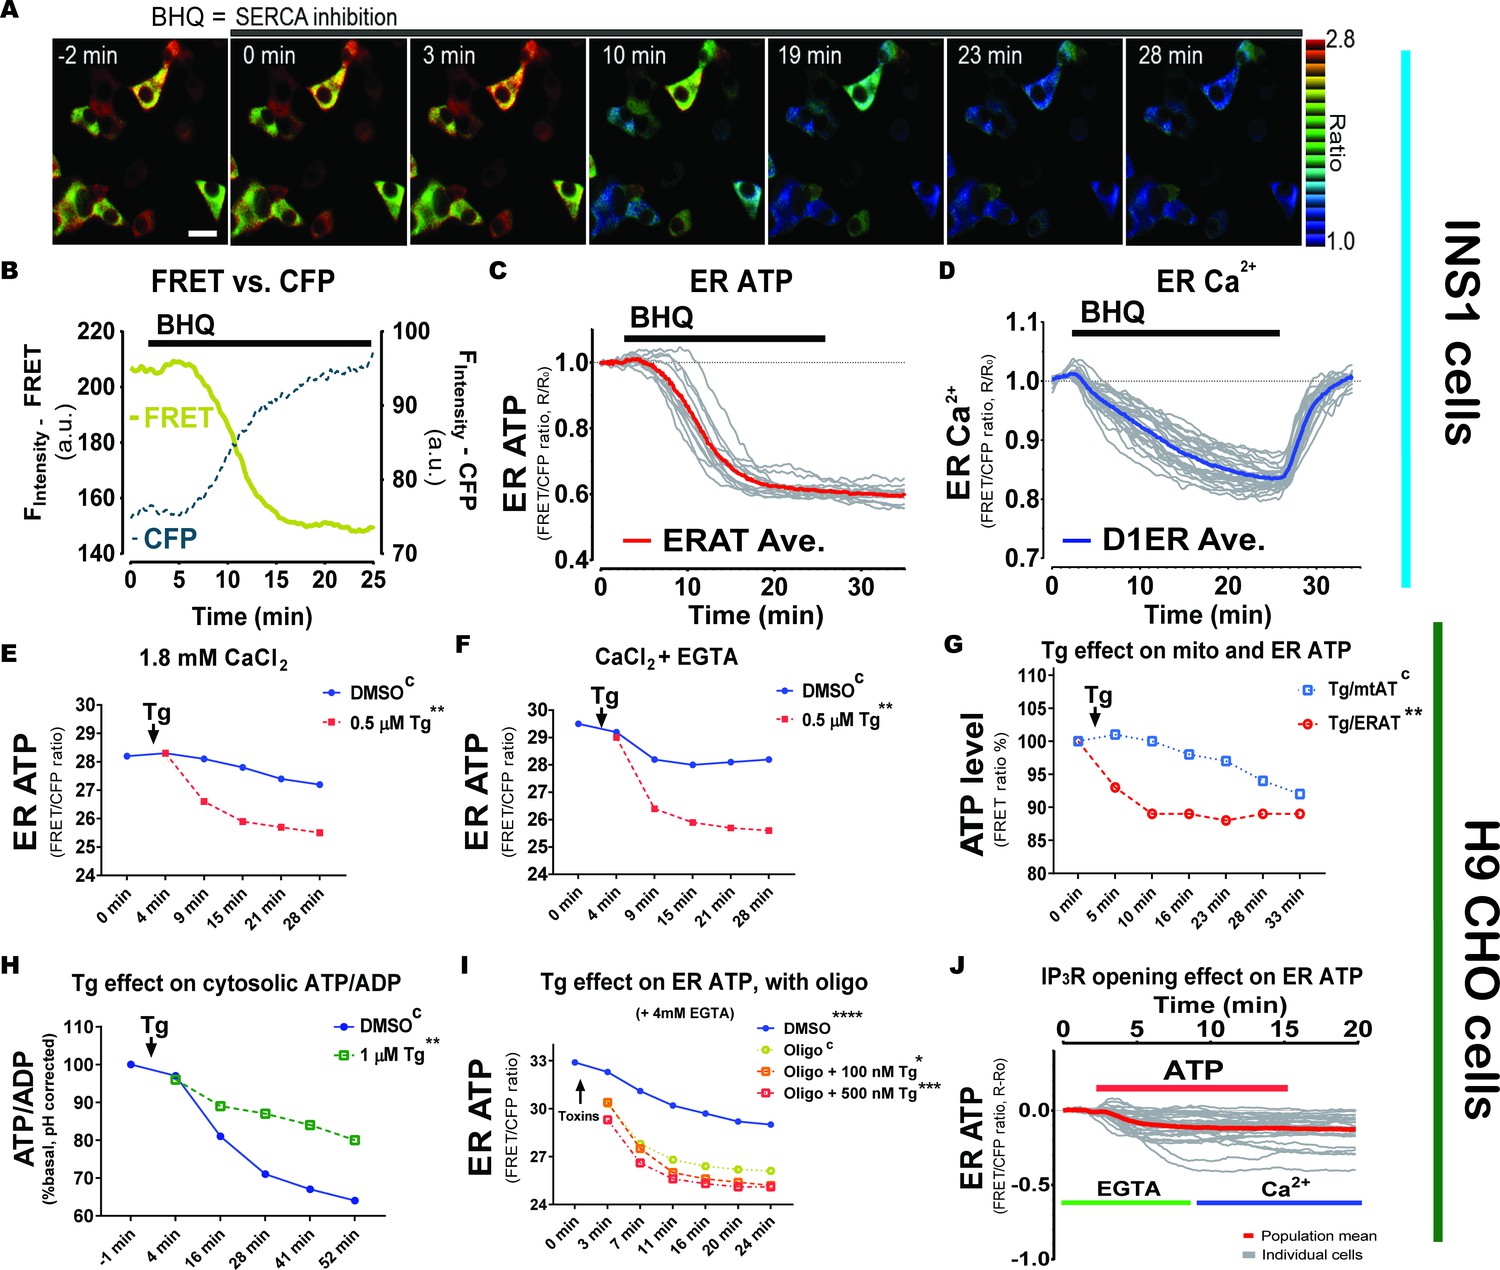
(A) SERCA inhibition reduces ER ATP levels in adherent INS1 cells. BHQ (15 µM) was added at 0 min as indicated. Scale bar represents 10 µm. (B) A representative trace of the FRET signal overlaid with the CFP fluorescence intensity is shown for illustration purposes in an adherent INS1 cell. (C) BHQ reduces ER ATP. Y-axis represents the ratio between FRET intensity versus CFP fluorescence intensity. The average ratio is shown in red bold solid line in the graph, with individual INS1 cells shown in gray (n = 13 cells from three experiments). (D) Quantification of the effect of BHQ on ER Ca2+ levels in individual INS1 cells. The average ratio from the Ca2+ reporter (D1ER) is shown by a red solid line, with individual cells shown in gray (n = 25 cells from three experiments). Notably, BHQ withdrawal at 25 min by perfusion causes Ca2+ refilling in the ER by SERCA re-activation. (E) Thapsigargin (Tg, 0.5 µM added at 0 min) reduces ER ATP significantly. Flow analysis was performed on H9 CHO cells containing the ERAT reporter and with 1.82 mM CaCl2 in the culture medium. Statistical significance is labeled in the figure compared to the ‘DMSO’ group as control, indicated with an upper case ‘C’. (F) In the same experiment as shown in panel (E), when extra-cellular Ca2+ in the medium was chelated by adding 4 mM EGTA, Tg shows the same effects as shown in panel (E) that is Tg decreases ER ATP significantly. (G) In response to Tg (0.25 µM final concentration, added at 0 min), the ER ATP concentration in H9 CHO decreases significantly faster than the decrease in mitochondrial ATP. ER ATP levels were measured by the ERAT probe and mitochondrial ATP was measured by the mtAT 1.03 probe. ATP levels in the two compartments were measured simultaneously in two sets of H9 CHO cells and shared the same readout as the FRET versus CFP ratio of the probes (F530/F445). The ATP levels measured by FRET ratios were further used to calculate the Tg-induced ATP decrease standardized to the respective DMSO-treated control groups, and ATP levels are expressed as percentage of the ‘DMSO’ group (% of DMSO). (H) Tg treatment (1 µM final concentration) increases the cytosolic ATP to ADP ratio in H9 CHO cells monitored by the PercevalHR reporter. Raw F488/F405 values from PercevalHR were corrected for the cytosolic cpYFP signal (F488/F405) in a different set of H9 CHO cells to compensate for the fluorescence change from pH change in the cytosol in response to Tg or DMSO. (I). In the presence of oligomycin, Tg-induced ER Ca2+ depletion decreases ER ATP more quickly compared to oligomycin (1 µM) alone, and the effect is dependent on the Tg concentration, that is 500 nM Tg induced a faster decrease than 100 nM Tg. (J) Addition of extracellular ATP (100 µM) decreases the ER ATP concentration in intact H9 CHO cells, in the presence (green line) or absence (blue line) of Ca2+ chelation by EGTA. In all panels, the ER ATP concentration was measured by the ERAT4 (N7Q) probe and the y-axis indicates the FRET ratio derived by dividing fluorescence intensity at 530 nm (F530) by that at 445 nm (F445), with a 405 nm laser excitation, that is FRET ratio = F530/F445. Statistical significance is shown for the indicated concentrations, compared to the control group indicated by the superscript "C".
Figure 2—figure supplement 1
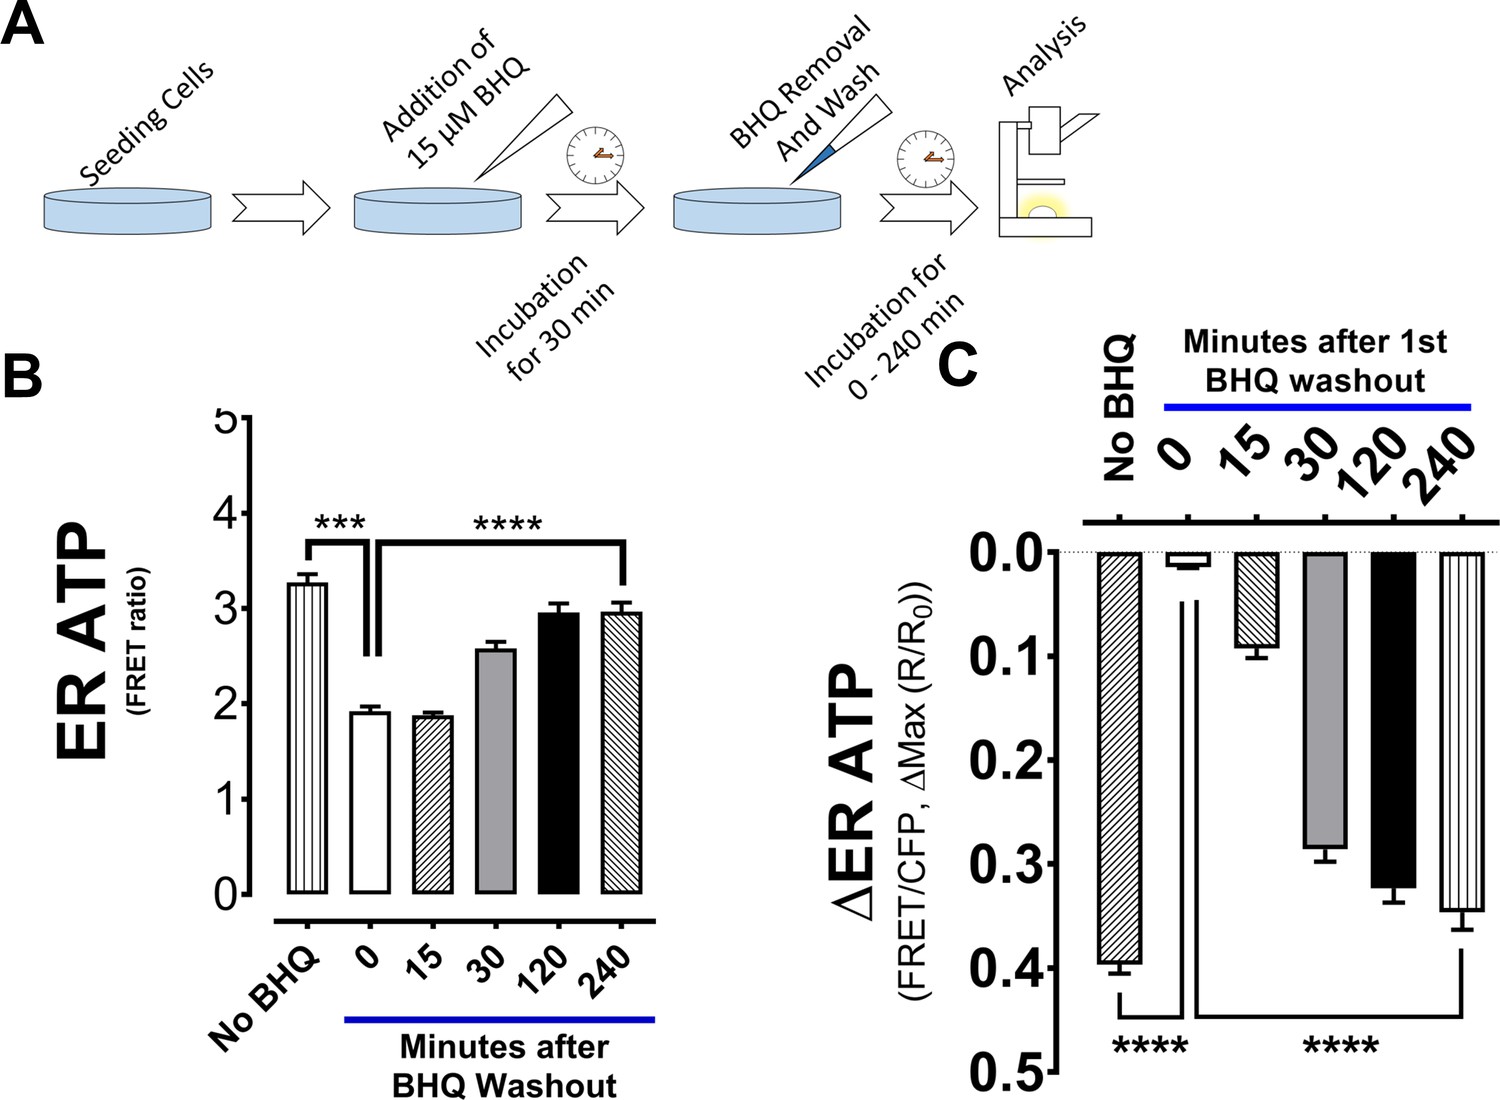
ER ATP levels in INS1 cells decrease after BHQ-mediated SERCA inhibition and recovery takes time.
(A) Experimental scheme is shown for panels B) and C). Briefly, INS-1 cells were first treated with 15 µM BHQ for 30 min to reduce ER ATP levels, and after BHQ removal, the cells were allowed to recover in medium for a period of time up to 4 hr and their ER ATP levels were measured by ERAT FRET ratio. (B) Basal ERAT FRET Ratio values of INS-1 cells, either untreated or at different periods of recovery time after BHQ-induced ER ATP depletion. There is notable ER ATP recovery in INS-1 cells starting at 30 min after BHQ removal. (C) Maximal decrease in ER ATP from basal FRET ratios is shown for INS-1 cells after a second stimulation with 15 µM BHQ. Note that the ER ATP levels were recorded from the same batch of INS-1 cells used in panel B, by the same color code.
Figure 2—figure supplement 2
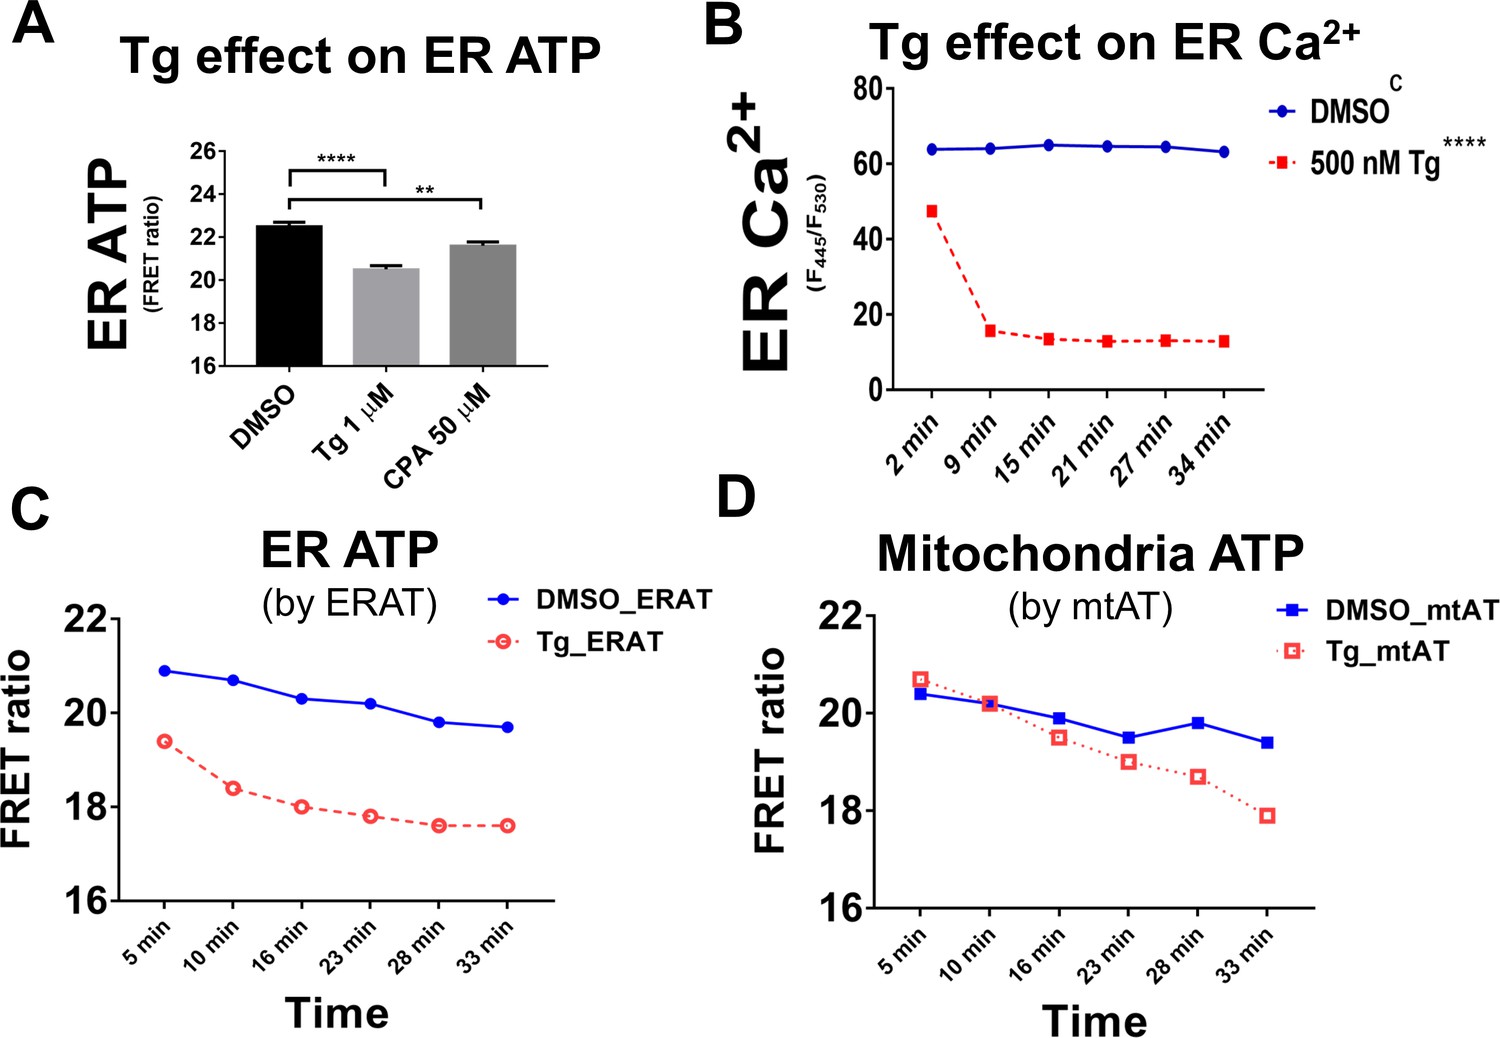
Tg and CPA decrease ER Ca2+ and ATP in H9 CHO cells due to SERCA inhibition.
(A) Treatment with cyclopiazonic acid (CPA, at 50 µM) or Tg (1 µM) for 18 min decreases ER ATP levels. ER ATP was estimated by flow cytometry using the ERAT reporter. (B) ER Ca2+ levels in H9 CHO cells were monitored by the GEM-CEPIA1er probe by flow cytometry-based ratiometric measurements. Tg (500 nM, injected at 0 min) depleted ER Ca2+within ~ 9 min after addition, a significant effect compared to DMSO-treated control cells. (C and D). Upon treatment with Tg (0.25 µM, added at 0 min), the ER ATP levels in H9 CHO cells decrease significantly faster (C) than the mitochondrial ATP (D). ER ATP levels were measured by the ERAT probe and mitochondrial ATP was measured by the mtAT 1.03 probe. ATP levels in the two compartments were measured in parallel in the two sets of H9 CHO cells using the same FRET versus CFP ratio (F530/F445). The ATP levels measured by FRET ratios were further used to calculate Tg-induced ATP decrease standardized to the respective DMSO-treated control cells, and ATP levels were expressed as percentage of the ‘DMSO’ group (% of DMSO as shown in main Figure 2G).
Figure 3 with 6 supplements
ATP transport from mitochondria to ER is inhibited by cytosolic Ca2+.
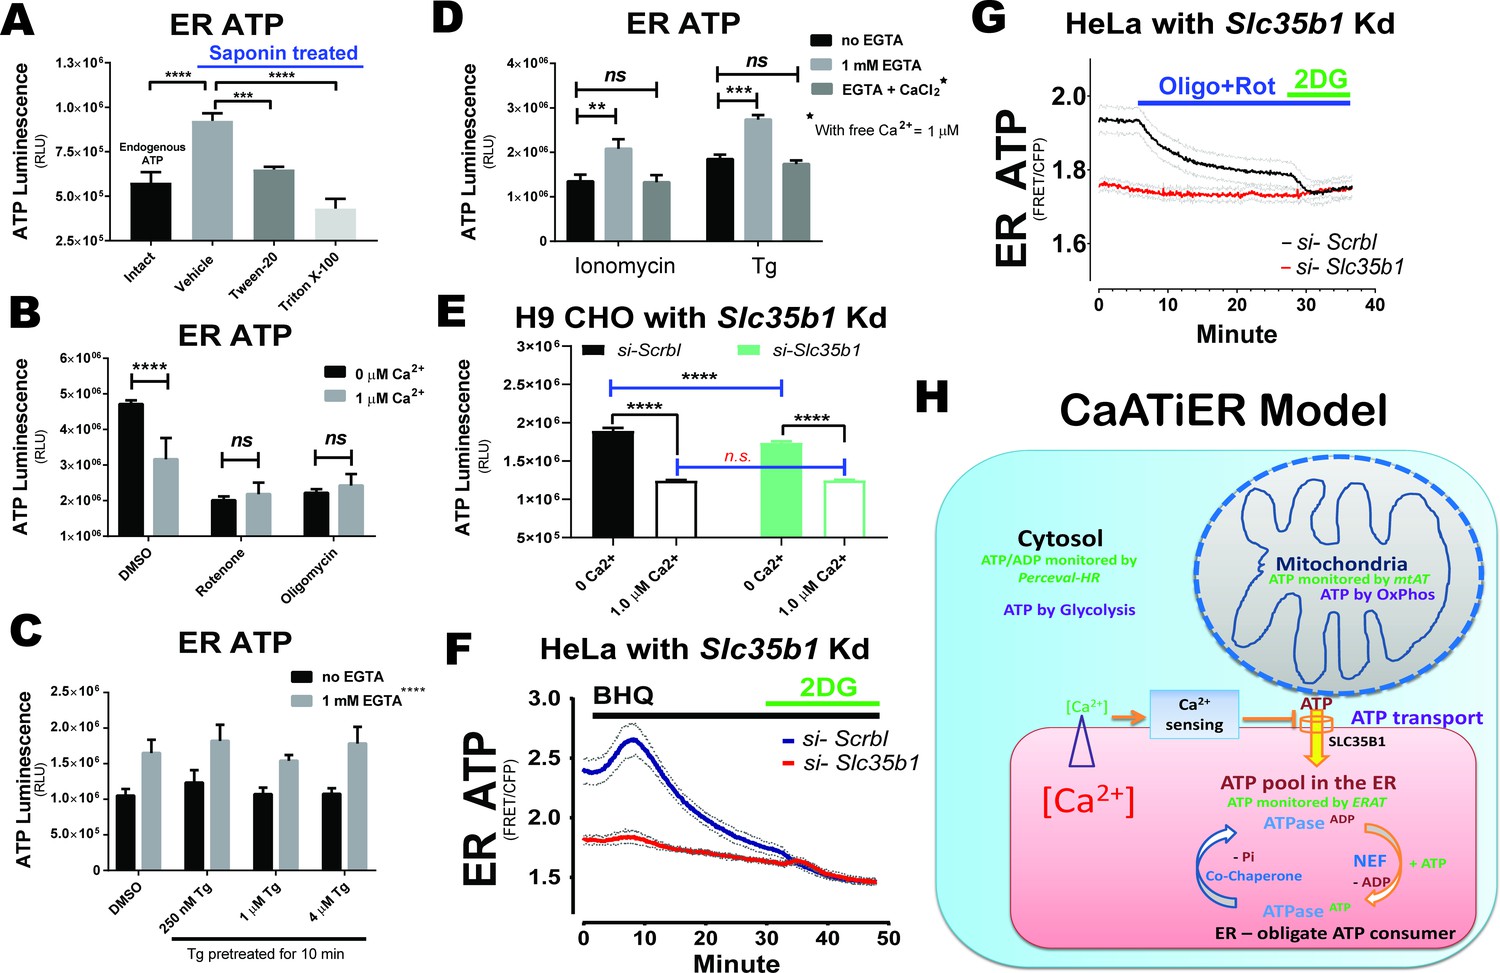
ATP stores in plasma membrane permeabilized H9 CHO cells were measured by a reporter-free method. H9 CHO cells were permeabilized with 75 µg/mL saponin in a bathing solution (referred to as ‘respiration solution’ hereafter). ATP production through OxPhos was supported by added pyruvate and malate (10 mM and 1 mM, respectively) as TCA substrates together with exogenous ADP (2 mM). The system was validated in two ways: First, the ATP store in the ER generated in permeabilized CHO cells was higher than that for the endogenous ATP pool detected in intact H9 CHOs (p<0.0001 between the ‘Intact’ and ‘Vehicle’ group). In addition, the ER ATP store was released within 5 min after treatment with Tween-20 (0.02% vol/vol, p=0.0007 compared to ‘Vehicle’ group) or Triton X-100 (0.02% vol/vol, p<0.0001), both after 25 min of respiration (A). Second, inhibition of OxPhos by oligomycin (1 µM) or rotenone (1 µM) reduces the ER ATP store to baseline levels. In addition, Ca2+ supplemented (in the form of CaCl2) at 1 µM final significantly reduced the ER ATP store (B). (C). SERCA ATPase activity is blocked by pre-incubating intact H9 CHO cells with increasing concentrations of Tg (250 nM, 1 µM, and 4 µM) for 10 min. Subsequently, cells were permeabilized as described above to test if Ca2+ depletion affects ER ATP generated through OxPhos in permeabilized CHO cells. EGTA supplemented at 1 mM significantly increased the ER ATP store (p<0.0001). No significant difference was observed for Tg pre-treated groups. (D). When ionomycin (10 µM) or Tg (1 µM) were added at the same time with PM permeabilization, EGTA significantly increased ER ATP while further Ca2+ add-back in the form of CaCl2 abolished the EGTA effect on increasing the ER ATP store. (E). The Ca2+ responsiveness of ER ATP levels was attenuated by siRNA-mediated Slc35b1 knock-down in H9 CHO cells. Using the semi-intact cell system, CHO cells with Slc35b1 knock-down by siRNA (24hrs post transfection) had significantly reduced ER ATP when no Ca2+ was present in the buffer (****: p<0.0001). With 1 µM Ca2+ in the buffer, ER ATP showed no difference between the control and the Slc35b1 knock-down group. (F). The Ca2+ responsiveness of ER ATP levels by SERCA inhibition was attenuated by siRNA-mediated Slc35b1 knock-down in HeLa cells. HeLa cells expressing the ERAT4 reporter were treated with siRNA against Slc35b1 for 48 hr before cell imaging, with si-Slc35b1/siRNA control = 9.5 ± 1.4% quantified by qRT-PCR (mean ± S.E.M., n = 3 samples/group). Basal ER ATP levels significantly decreased in the si-Slc35b1 group (p<0.001 by two-tailed t-test), compared to scrambled siRNA treated HeLa cells. Meanwhile the ER ATP decrease after BHQ addition was attenuated in the si-Slc35b1 group. Glucose (10 mM) replacement by 2-DG (10 mM) in the end ensured cellular ATP depletion as another control. No difference was found for the two groups after 2-DG addition. (G) The ER ATP decrease after OxPhos inhibition (by oligomycin and rotenone) was abrogated by siRNA-mediated Slc35b1 knock-down in HeLa cells. No difference was found for the two groups after 2-DG addition. For panels F and G, results are shown as traces representing mean ± S.E.M. (H) The cartoon depicts the CaATiER model showing mitochondrial ATP transport into the ER is antagonized by Ca2+ on the cytosolic side of the ER membrane.
Figure 3—figure supplement 1

Permeabilized H9 CHO cells produce ATP through OxPhos and ATP is detected in the respiration buffer.
(A) Ca2+ supplementation does not alter mitochondrial respiration of PM-permeabilized H9 CHO cells. Oxygen consumption rate (OCR in pMole/min) was measured using a Seahorse XF-24 platform. For the "Ca2+"group (n = 10 wells), wells received 1 µM Ca2+ in the form of CaCl2 injected after the fourth measurement, while the vehicle control group (n = 10 wells) received buffer alone. Subsequently, both groups received sequential injections of carboxyatractyloside (CAt,3 µM), FCCP (1 µM), and finally rotenone (1 µM) plus antimycin A (10 µM). Data are represented as Mean ± SEM. (B) Ca2+ supplementation does not alter mitochondrial respiration in PM-permeabilized H9 CHO cells. Data from panel (A) were used to calculate group averages after each inhibitor treatment, which are shown as bar graphs, with SEM represented by whiskers. Two-way ANOVA detected no effect of Ca2+ at 1 µM, with a p-value of 0.61. (C) Tg supplementation does not alter mitochondrial respiration of PM-permeabilized H9 CHO cells. Oxygen consumption rate (OCR in pMole/min) was measured on a Seahorse XF-24 platform. For the "Tg" group (n = 11 wells), wells received 250 nM Tg in the permeabilization buffer, while the ‘DMSO’ group (n = 10 wells) received same volume of DMSO as vehicle control. Both groups received 1 µM Ca2+ in the form of CaCl2 injected after the fifth measurement. Subsequently, both groups received sequential injections of carboxyatractyloside (CAt,3 µM), FCCP (1 µM), and finally rotenone (Rot), 1 µM) plus antimycin A (AA), 10 µM). Data are represented as Mean ± SEM. (D) Tg supplementation does not alter mitochondrial respiration in PM-permeabilized H9 CHO cells. Data from panel (C) were used to calculate group averages after each inhibitor treatment, which are shown as bar graphs, with SEM represented by whiskers. Two-way ANOVA detected no effect of Tg at 250 nM, with a p-value of 0.97. (E) ATP production was estimated by measuring ATP content in the respiration buffer (50 μL out of 100 μL total volume) under the indicated EGTA and Ca2+ concentrations, after 30 min of respiration in presence of 2 mM exogenous ADP at 37°C. Endogenous ATP in intact cells that were not permeabilized were included as an additional control for ATP level comparison. No significant difference was found between Ca2+ groups below ‘11100 nM Ca2+”. All groups received Tg treatment (250 nM) for 10 min before permeabilization. (F) Luminescence signals from the ATP standard curve is intended to provide an estimate of absolute amount of ATP contained in the respiration buffer.
Figure 3—figure supplement 2
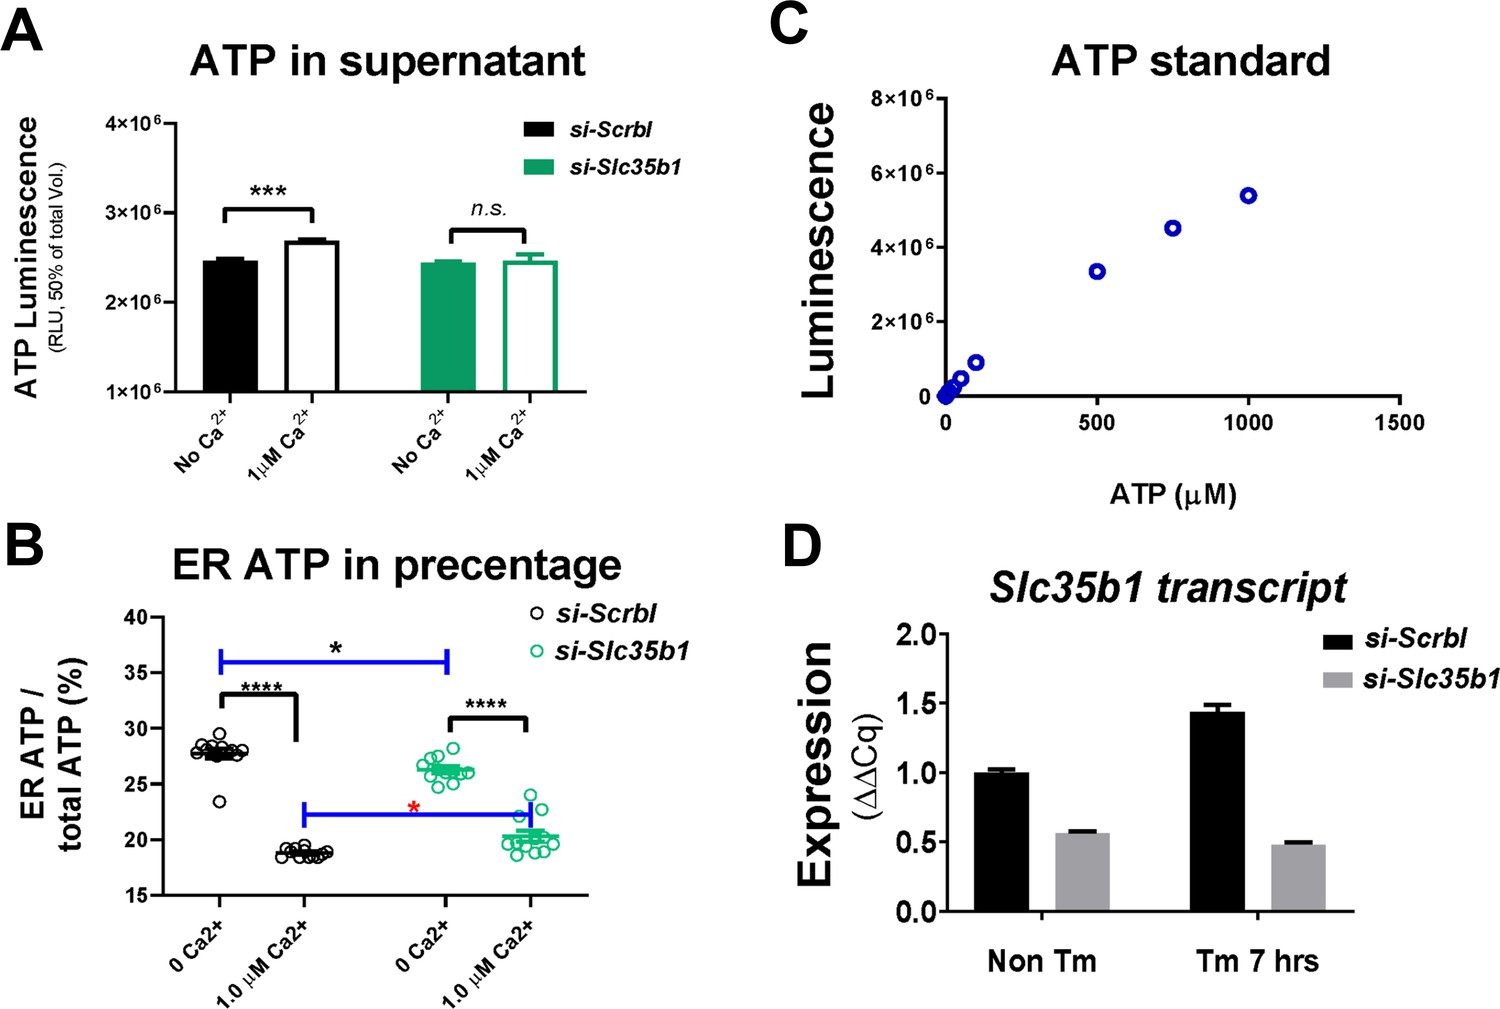
In complement to Figure 3E.
(A) ATP produced and partitioned to the supernatant was measured using ATPLite assay. For the scrambled siRNA control group, ATP content in the supernatant was significantly higher in the ‘1 µM Ca2+’ group compared to the ‘No Ca2+’ group. (B) The portion of ATP trapped in the ER was expressed as percentage of total ATP generated in the assay. Similar statistics were found for this comparison as in in Figure 3E. (C) Luminescence generated from a series of ATP standards was measured to provide a calibration curve. (D) For H9 CHO cells, si-Slc35b1 (SI01641544) achieved ~ 50% knock-down efficiency in cells without ER stress, and ~ 70% knock-down in cells treated with Tm for 7 hr.
Figure 3—figure supplement 3

Similar to the result in Figure 3F,.
(A) The Ca2+ responsiveness of ER ATP levels by SERCA inhibition was attenuated by siRNA-mediated Slc35b1 knock-down in INS1 cells. When the baseline and endpoint FRET ratios were quantified, statistics revealed that: (B) Baseline ATP levels were significantly different, with p<0.01. (C) Endpoint ATP levels were not different, with no significance. (D) The Ca2+ responsiveness of ER ATP levels by SERCA inhibition was attenuated by siRNA-mediated Slc35b1 knock-down in H9 CHO cells. When the baseline and endpoint FRET ratios were quantified, statistics revealed that: (B) Baseline ATP levels were significantly different, with p<0.01. (C) Endpoint ATP levels were not different with no significance.
Figure 3—figure supplement 4

Slc35b1 transcript was quantified by qRT-PCR, and the knock-down efficiency was > 90% in HeLa cells (A), and ~ 33% in INS1 cells (B).
https://doi.org/10.7554/eLife.49682.018
Figure 3—figure supplement 5
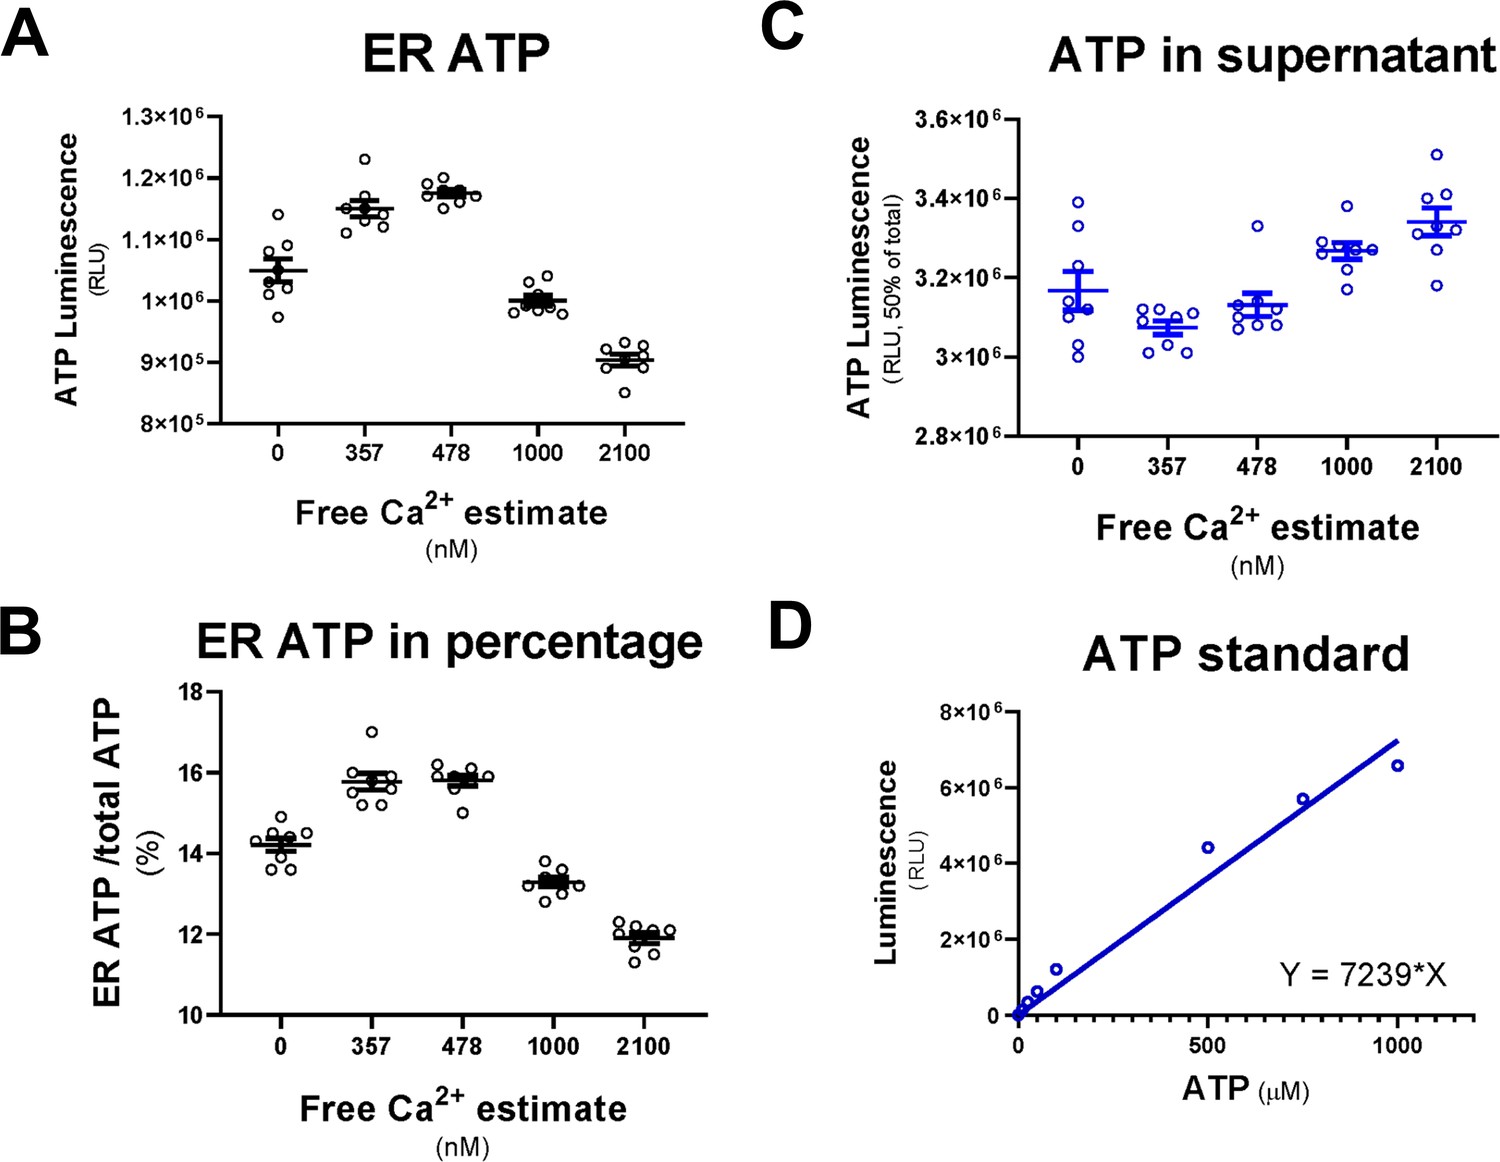
The CaATiER mechanism responds to cytosolic Ca2+ in a physiological range.
(A) ER ATP is reduced in response to cytosolic Ca2+ in the low µM range. (B) ER ATP levels were expressed as percentage of total ATP. (C) In contrast to ER ATP shown in (A), ATP contained in the supernatant showed changes opposite to ER ATP. (D) Luminescence generated from an ATP standard was measured to provide a calibration curve.
Figure 3—figure supplement 6
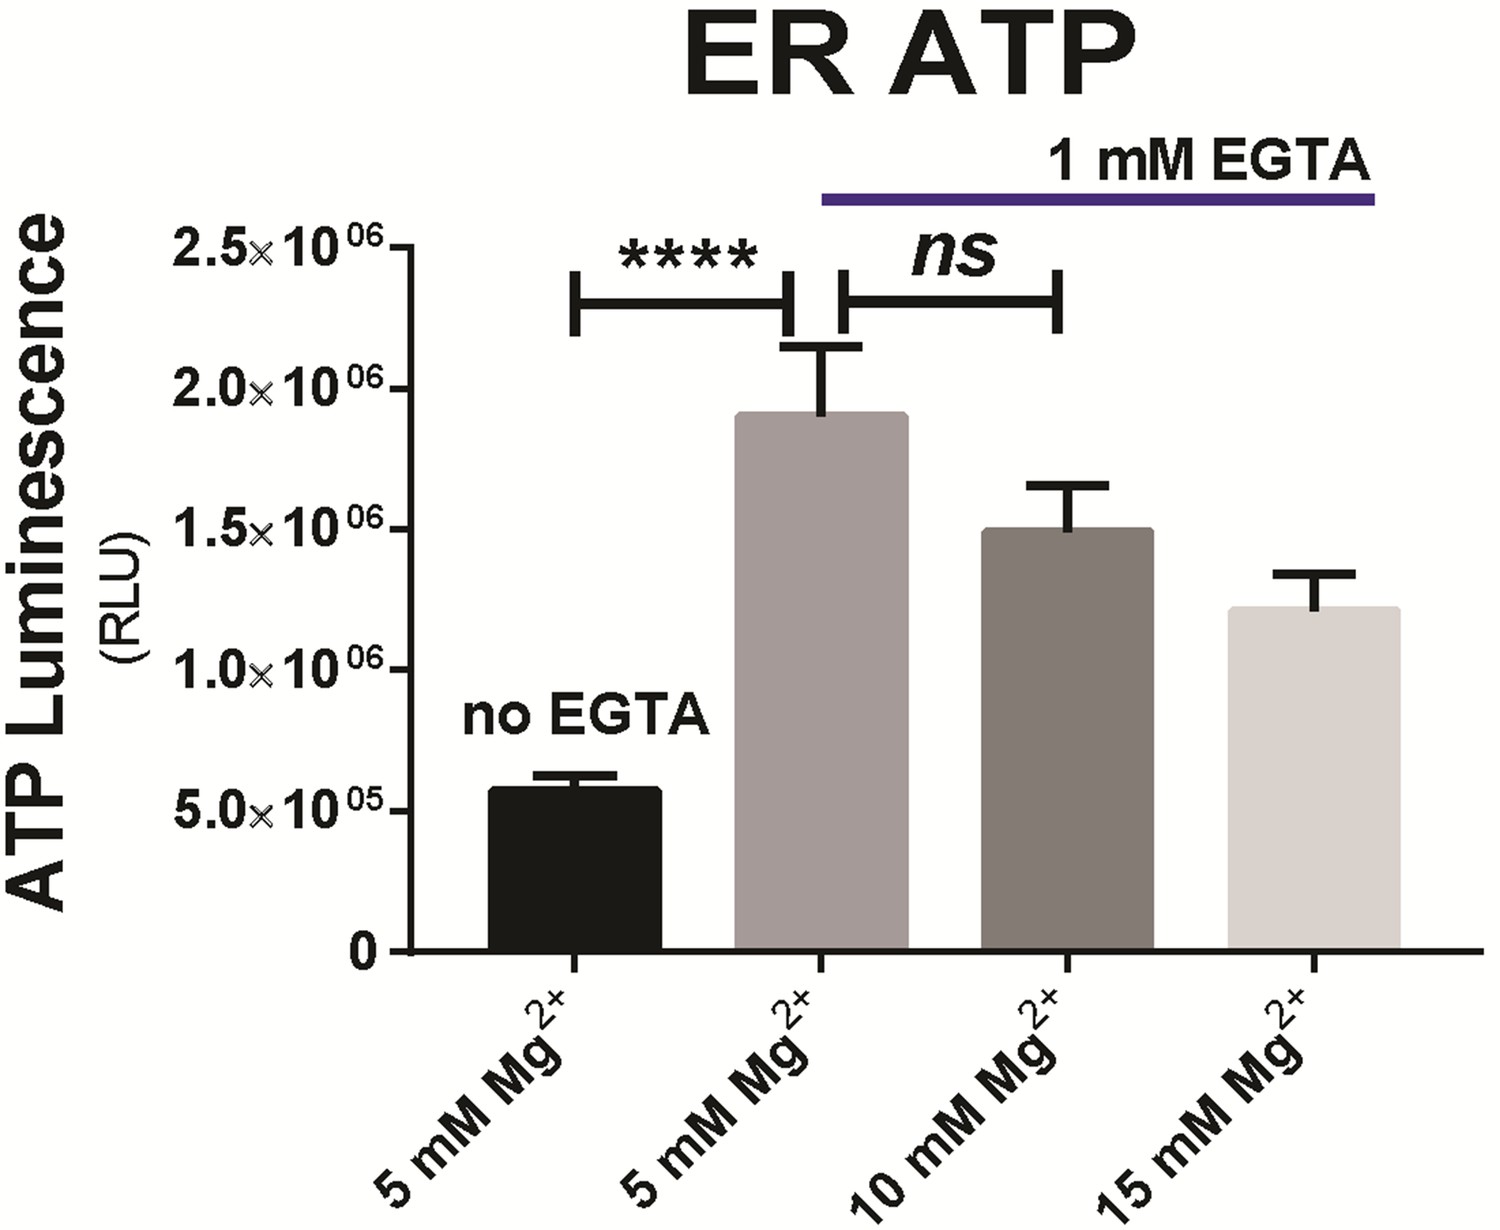
Since the respiration buffer contains 5 mM MgCl2 as a basal ingredient, an additional 5 to 10 mM MgCl2 was added to final concentrations of ‘10 mM’ and ‘15 mM’ as indicated, to test the Mg2+ effect on ER ATP.
The difference between ‘5 mM’ and ‘10 mM’ was not statistically significant (p=0.21), while EGTA supplemented at 1 mM had a significant effect (p<0.0001) compared to 5 mM Mg2+ with ‘no EGTA’.
Figure 4 with 2 supplements

Protein misfolding in the ER increases ER ATP dependence on OxPhos and increases ER to mitochondrial Ca2+ trafficking.
(A) When treated with HDAC inhibitors, such as SAHA or sodium butyrate (NaB), F8 transcription is induced in H9 CHO cells accompanied by UPR activation. SAHA was tested at increasing concentrations, at 50 nM, 200 nM, 1 µM, 5 µM and 20 µM, as indicated by pink arrow heads. NaB was used at 5 mM. ‘D’ indicates the same volume of DMSO as a vehicle control. The last two lanes received 10 µg/mL tunicamycin (Tm) as positive controls for ER stress. Treatment times are labeled on the top of the Western blot panels. (B). Representative histograms of mitochondrial Ca2+ influx, reported by the mtGEM-GECO1 Ca2+ probe, were overlaid for visual comparison. For the particular ‘Tg’ trace, H9 CHO cells were treated with 5 µM Tg for 30 min; and for the ‘APB+Tg’ trace, the same cells received 50 µM of APB before Tg stimulation. (C) While the mitochondrial Ca2+ concentrations show no difference at the basal level, Tg (5 µM)-triggered a higher mitochondrial Ca2+ spike in H9 cells with induced F8 expression (5 µM SAHA x 21 hr). An independent group of un-induced H9 CHO cells received ionomycin (10 µM) as a positive control. (D) Tg (5 µM)-triggered mitochondrial Ca2+ spikes in un-induced H9 and induced H9 cells for F8 expression are shown by bar graphs, with average signal strengths represented as percent of baseline (without Tg treatment) from four consecutive readings within 45 min. The Ca2+ signal from the mitochondrial matrix in ER stressed H9 cells (5 µM SAHA x 21 hr) was significantly increased compared to its vehicle-treated control group (‘SAHA’ versus ‘DMSO’, p<0.05), both of which were partially blocked by 40 µM APB. (E) Intracellular Ca2+ content was not significantly changed in H9 cells with F8 expression induced by SAHA, compared to control H9 cells as measured by the OCPC chromogenic method. (F) ER Ca2+ levels in H9 CHO cells were monitored by the GEM-CEPIA1er probe through flow cytometry-based ratiometric analysis. SAHA (5 µM for 18 hr) induces ER stress by increasing F8 expression in the ER, and Tm (100 ng/mL for 18 hr) induces ER stress by blocking N-linked glycosylation on proteins translocated into the ER. ER Ca2+ levels in H9 CHO cells remained unchanged compared to the DMSO-treated control cells. (G) In H9 CHO cells with induced F8 expression, the OCR was slightly increased but not significantly different, as measured by the Seahorse flux assay (n = 6 wells/group). (H). Blockade of ATP production through OxPhos by oligomycin depletes ATP more quickly in induced H9 cells compared to un-induced H9 CHO cells, when standardized to DMSO-treated cells. (I) and (J) Traces for ER ATP in individual H9 CHO cells are shown in response to oligomycin administration (10 µM, indicated by arrow heads). In panel (I), cells were treated 18 hr with DMSO, a vehicle control for SAHA; In panel (J), cells were treated 18 hr with 5 µM SAHA. (K) Similar to measurements made by flow-cytometry (panel H), oligomycin caused significantly greater maximal ER ATP reduction (*, p<0.05 by two-tailed Student’s t-test) in SAHA-induced H9 cells compared to ‘Vehicle’ treated H9 CHO cells.
Figure 4—figure supplement 1

While mitochondrial matrix ATP levels remain unchanged in ER stressed H9 cells, upon OxPhos inhibition the cytosolic ATP/ADP ratios decrease more quickly than unstressed H9 cells.
Mitochondrial ATP levels are not changed in un-induced H9 CHO cells (A) and SAHA-treated H9 cells to induce F8 expression (B). Cells were equally sensitive to 1 µM oligomycin. ATP levels were estimated by the mtAT1.03 mitochondrial localized ATP reporter, through flow cytometry-based ratiometric measurements. (C). Cytosolic ATP/ADP ratios were monitored by the PercevalHR probe upon OxPhos inhibition by oligomycin plus rotenone (Oligo and Rot, respectively). ER stress induced by Tm (100 ng/mL x 18 hr) was coupled with a faster decrease in the cytosolic ATP/ADP ratio upon OxPhos blockade. Cytosolic ATP/ADP ratio in ER stressed H9 CHO cells and their non-stressed counterparts is expressed as the percentage of that measured at 0 min time point for their respective groups. Round symbols represent cells that were not ER stressed, and square symbols represent ER stressed cells. Solid lines are cells treated with DMSO as vehicle control, while dotted lines are cells that received 1 µM oligomycin plus 2 µM rotenone. Dunnett’s multiple comparisons test was subsequently performed for comparison between vehicle-treated versus OxPhos blockers-treated groups. (D) Raw cytosolic ATP/ADP ratios from which the percentage values were derived in panel (C) is shown.
Figure 4—figure supplement 2

Glucose uptake in ER stressed H9 CHO cells was reduced compared to non-stressed H9 CHO cells.
The uptake of a fluorescent glucose analog, 2-NBDG, was quantified by flow-cytometry and compared between non-stressed versus ER stressed H9 CHO cells. (A) With overnight NaB incubation, ER stressed H9 CHO displayed reduced 2-NBDG uptake. (B) Similarly, with overnight SAHA incubation, ER stressed H9 CHO displayed reduced 2-NBDG uptake. In contrast, another F8-expressing CHO cell line without SAHA inducibility (10A1 cells) (Dorner et al., 1989) was not affected by SAHA incubation.
Author response image 1

Author response image 2

Left panel – Illustration of linkers used; Right panel – OCR results before and after linkers ligation by Rapa.
DT-8 = Double transfected clone 8, with both linkers present, experimental group. AR-6/-10* = AKAP1-mRFP, with only mito-linker present, clone-6/-10. *AR clones served as control clones.
Author response image 3
Tables
Key resources table
| Reagent type (species) or resource | Designation | Source or reference | Identifiers | Additional information |
|---|---|---|---|---|
| Cell line (Cricetulus griseus) | CHO DUK cell line | Dr. Lawrence Chasin at Columbia University, USA., Personal gift | N/A | Confirmed by karyotyping |
| Cell line (Cricetulus griseus) | CHO H9 cell line | Made in Kaufman Lab | N/A | Confirmed by karyotyping, further by F8 WB |
| Cell line (Rattus norvegicus) | INS1 cell line | Gift from Dr. Christopher B. Newgard, Duke University, USA | N/A | Confirmed by WB and electrophysiology |
| Cell line (Homo-sapiens) | HeLa S3 cell line | ATCC | # CCl-2.2 | Assurance by ATCC |
| Antibody | anti-F8, IgG1 (Mouse monoclonal) | Green Mountain Antibodies | GMA 012 | WB: 1:1000 |
| Antibody | anti-BiP, IgG (Rabbit monoclonal) | Cell Signaling Technology | CST 3177 | WB: 1:1000 |
| Antibody | anti-CHOP, IgG (Rabbit polyclonal) | Santa Cruz Biotechnology | SC 575 | WB: 1:1000 |
| Antibody | phospho-eIF2α (Ser51), IgG (Rabbit monoclonal) | Cell Signaling Technology | CST 3597S | WB: 1:1000 |
| Antibody | anti-phospho-p70S6K (Thr421/Ser424), IgG (Rabbit polyclonal) | Cell Signaling Technology | CST 9204 | WB: 1:1000 |
| Antibody | anti-VINCULIN, IgG1 (Mouse monoclonal) | Sigma | V9131 | WB: 1:1000 |
| Recombinant DNA reagent | mtAT 1.03, plasmid | Dr. Hiromi Imamura at Kyoto University, personal gift | N/A | ATP level |
| Recombinant DNA reagent | ERAT 4.01 N7Q, plasmid | NGFI, Austria | N/A | ATP level |
| Recombinant DNA reagent | pTagRFP-C, plasmid | Evrogen | #FP141 | Cytosolic location |
| Recombinant DNA reagent | GW1-Perceval HR, plasmid | Addgene | #49082 | ATP/ADP ratio |
| Recombinant DNA reagent | D1ER, plasmid | Dr. Demaurex at Universitè de Genève, Switzerland, personal gift | N/A | Ca2+ level |
| Recombinant DNA reagent | pCIS GEM-CEPIA1er, plasmid | Addgene | #58217 | Ca2+ level |
| Recombinant DNA reagent | CMV-mito-mtGEM-GECO1, plasmid | Addgene | #32461 | Ca2+ level |
| Recombinant DNA reagent | ER-RFP, plasmid | Addgene | #62236 | ER localization |
| Recombinant DNA reagent | cpYFP, plasmid | Dr. Yi Yang at East China University of Science and Technology, personal gift | N/A | pH level |
| Sequence-based reagent | Puromycin resistant gene, 5’ primer 5’-ACAAATGTGGTAAAATCGATAAGGATCCG-3’; | Integrated DNA Technologies | N/A | PCR primer |
| Sequence-based reagent | Puromycin resistant gene, 3’ primer 5’-GAGCTGACTGGGTTGAAGGCT-CTCAAGGGC-3’ | Integrated DNA Technologies | N/A | PCR primer |
| Sequence-based reagent | siRNA Slc35b1- 5’-GAG ACU ACC UCC ACA UCA A dTdT-3’ (targeting 3’-UTR of human gene) | Microsynth AG, Balgach, Switzerland | N/A | siRNA |
| Sequence-based reagent | siRNA scrambled- 5'-AGG UAG UGU AAU CGC CUU G dTdT-3' (control for humanSlc35b1 knockdown) | Microsynth AG, Balgach, Switzerland | N/A | siRNA |
| Sequence-based reagent | siRNA targeting mouse Slc35b1 sequence – 5’-CCACATGATGTTGAACATCAA-3’ | Qiagen | Mm_Ugalt2_1, SI01461523 | siRNA |
| Sequence-based reagent | siRNA targeting mouse Slc35b1 sequence – 5’- AAGAAGGTGGTTGGAATAGAA-3’ | Qiagen | Mm_Ugalt2_2, SI01461530 | siRNA |
| Sequence-based reagent | siRNA targeting mouse Slc35b1 sequence – 5’-TCGGTAAATCCTGCAAGCCAA-3’ | Qiagen | Mm_Ugalt2_4, SI01461544 | siRNA |
| Sequence-based reagent | siRNA scrambled – Sequence proprietary | Qiagen | Allstars Negative Control siRNA, Cat #1027280 | siRNA |
| Commercial assay or kit | TransFast Transfection Reagent | Promega Corporation, Madison, USA | # E2431 | |
| Commercial assay or kit | FuGENE 6 Transfection Reagent | Promega | # E2693 | |
| Commercial assay or kit | Calcium Assay Kit | Adipogen Corp. | # JAI-CCA-030 | |
| Commercial assay or kit | XF24 extracellular flux assay kit | Seahorse BioSciences | # 100850–001 | |
| Commercial assay or kit | Ingenio Electroporation solution | Mirus Bio LLC | # MIR 20114 | |
| Commercial assay or kit | ATPLite kit | Perkin Elmer | # 6016943 | |
| Commercial assay or kit | MycoAlert plus Mycoplasma Detection kit | Lonza | #LT07-703 | |
| Chemical compound, drug | 2-Deoxy-D-glucose | Chem-Impex Int’l, INC | # 21916 | |
| Chemical compound, drug | 2,5-Di-(t-butyl)−1,4-hydroquinone (BHQ) | SIGMA | # 112976–25G | |
| Chemical compound, drug | 2-NBDG | Cayman Chemical | # 11046 | |
| Chemical compound, drug | 3-Bromopyruvate | Aldrich Chemistry | # 16490–10G | |
| Chemical compound, drug | Cyclopiazonic acid | Alfa Aesar | # J61594 | |
| Chemical compound, drug | FCCP | SIGMA | # C2920-10MG | |
| Chemical compound, drug | Iodoacetamide | SIGMA | # I1149-5G | |
| Chemical compound, drug | Ionomycin | AdipoGen | # AG-CN2-0418 | |
| Chemical compound, drug | Oligomycin A | Alfa Aesar | # J60211 | |
| Chemical compound, drug | Rotenone | SIGMA | # R-8875–1G | |
| Chemical compound, drug | SAHA | Tocris | # 4652 | |
| Chemical compound, drug | Thapsigargin | SIGMA | # T9033-5MG | |
| Chemical compound, drug | Tunicamycin | Santa Cruz Biotechnology | # sc-3506 | |
| Software, algorithm | GraphPad Prism 7 | GraphPad Software | Version: 7 | |
| Software, algorithm | FlowJo 10 | FlowJo LLC | Version: 10.2 | |
| Software, algorithm | Adobe Illustrator | Adobe | Version: CS 5.1 |
Additional files
-
Source data 1
Data sets for main figures.
- https://doi.org/10.7554/eLife.49682.024
-
Supplementary file 1
Summary table of reporters used in CHO cells and their intended specificity.
- https://doi.org/10.7554/eLife.49682.025
-
Supplementary file 2
Free Ca2+ concentration estimates for CaCl2 containing respiration buffers.
- https://doi.org/10.7554/eLife.49682.026
-
Transparent reporting form
- https://doi.org/10.7554/eLife.49682.027
Download links
A two-part list of links to download the article, or parts of the article, in various formats.
Downloads (link to download the article as PDF)
Open citations (links to open the citations from this article in various online reference manager services)
Cite this article (links to download the citations from this article in formats compatible with various reference manager tools)
Mitochondria supply ATP to the ER through a mechanism antagonized by cytosolic Ca2+
eLife 8:e49682.
https://doi.org/10.7554/eLife.49682


