A unicellular relative of animals generates a layer of polarized cells by actomyosin-dependent cellularization
- Institut de Biologia Evolutiva (CSIC-Universitat Pompeu Fabra), Spain
- Liverpool School of Tropical Medicine, United Kingdom
- University of Oslo, Norway
- National Institute of Genetics, Japan
- Prefectural University of Hiroshima, Japan
- Universitat de Barcelona, Spain
- ICREA, Spain
Figures
Figure 1 with 1 supplement
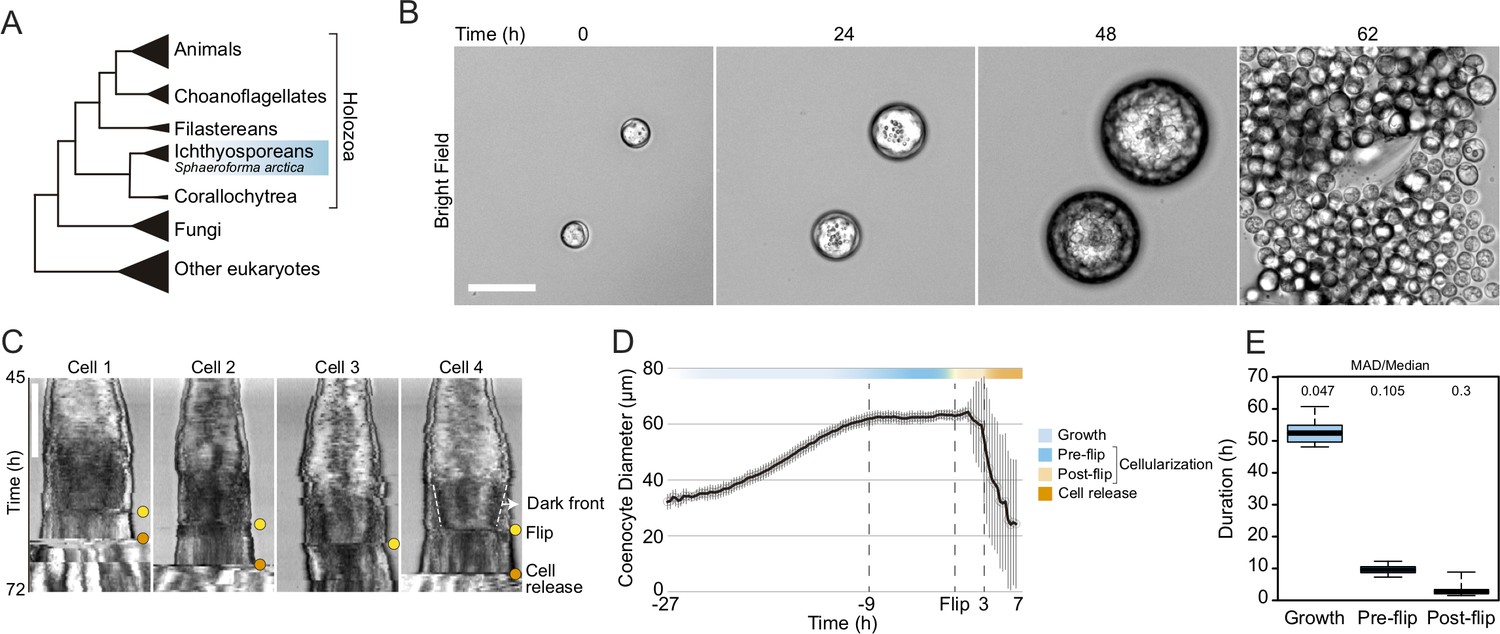
Cellularization dynamics in Sphaeroforma arctica.
(A) Phylogenetic position of the ichthyosporean Sphaeroforma arctica in the tree of life. (B) Time-lapse images of the life-cycle of S. arctica show cell-size increase prior to cellularization and release of new-born cells. Associated with Video 2. Bar, 50 µm. (C) Kymographs of 4 distinct cells undergoing cellularization with the time of flip (yellow) and cell release (orange) indicated for each. An example of the advancing dark front is shown for cell 4. Bar, 50 µm. (D) Mean cell diameter over time of 65 cell traces aligned to Flip reveals distinct cell stages: Growth, Pre and post-flip and cell release. (E) Duration of growth, cellularization and post-flip represented as box-plots (N°cells > 100). MAD (Median absolute deviation) over median is used as a measure of variability.
Figure 1—figure supplement 1
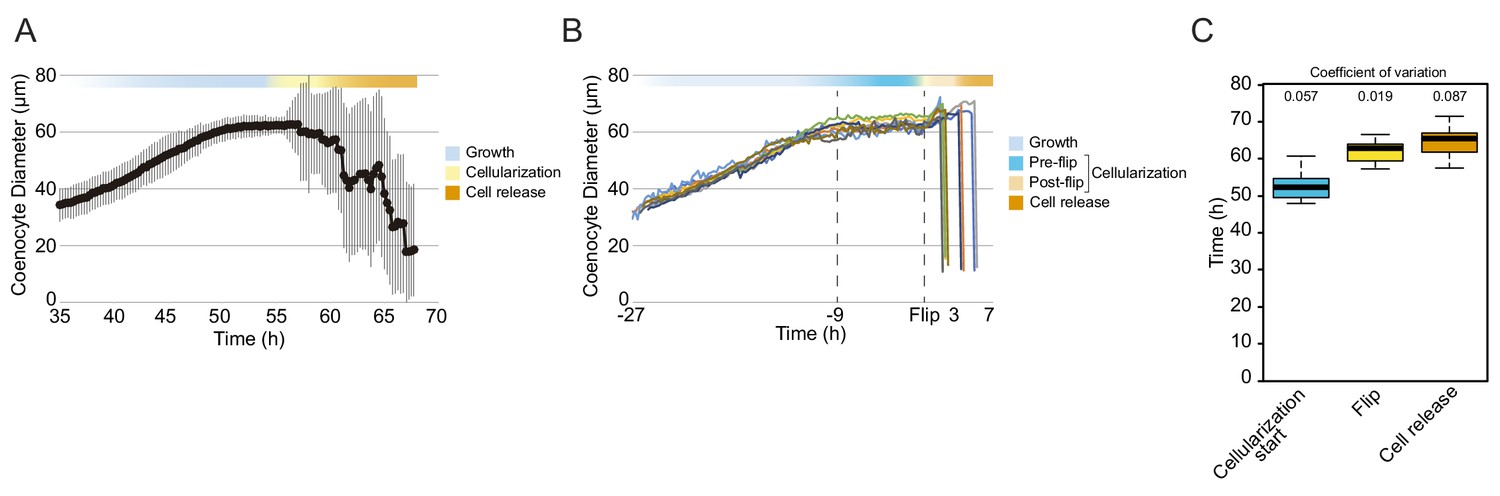
Cellularization dynamics in Sphaeroforma arctica.
(A) Cell diameter over time of 65 single cell traces aligned to time. Variability increases from 54 hr onwards due to asynchronous release of newborn cells. (B) Cell diameter over time of 8 single cell traces aligned to Flip. (C) The average time at which cells start cellularization, undergo flip or release new-born cells in a bulk culture. (N°cells = 100).
Figure 2 with 1 supplement
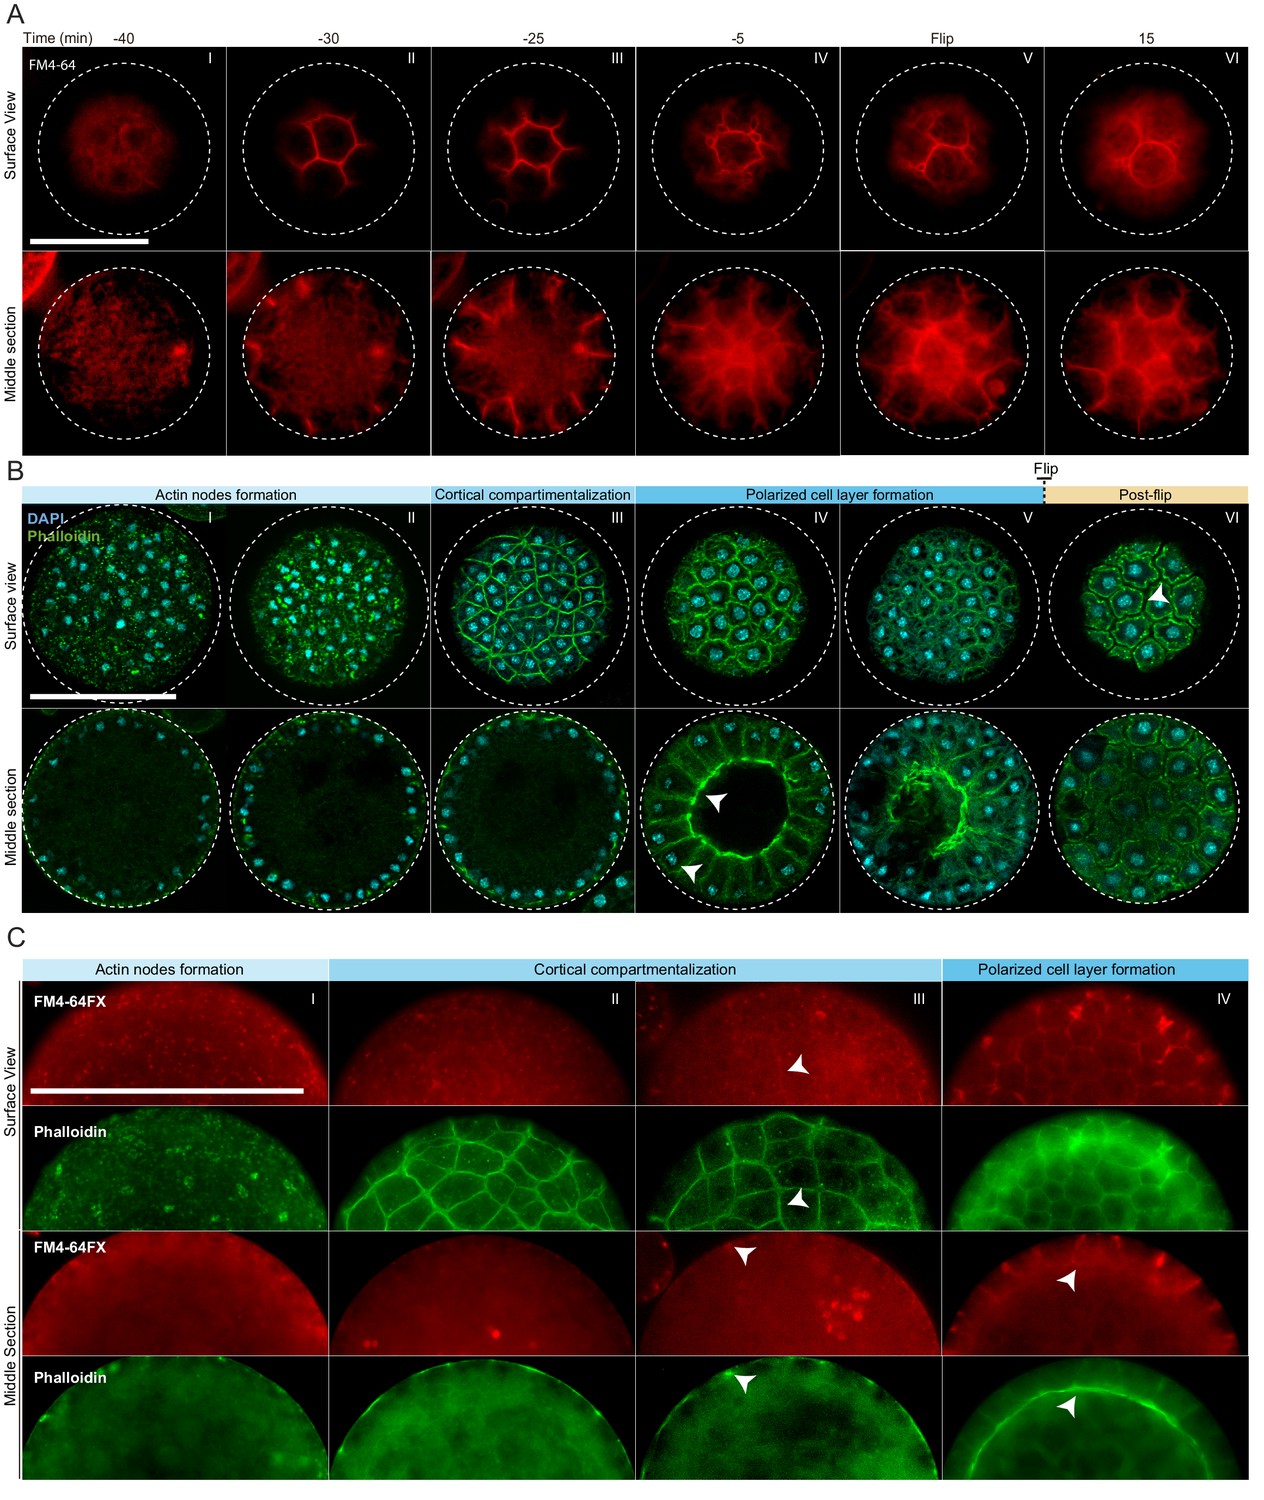
Actin cytoskeleton and plasma membrane dynamics during cellularization of S. arctica.
(A) Dynamics of plasma membrane invaginations during cellularization. Live-cells, pre-grown for 58 hr, were stained with FM4-64 (10 µM) and imaged using epifluorescent microscopy with a 5 min interval. Bar, 50 µm. (B) Spatio-temporal organization of the actin cytoskeleton, nuclei and cells during cellularization. Synchronized cells of S. arctica, pre-grown for 48 hr, were fixed every hour for 14 hr and stained with phalloidin and DAPI to reveal cytoskeletal dynamics during cellularization. All cells were imaged using confocal microscopy. In panel IV, arrows indicate higher actin signal intensity on the internal side and that nuclei are localized close to the cortex indicating that the layer of cells is polarized. Bar, 50 µm. (C) Actin network is established prior to plasma membrane invaginations. Synchronized cells of S. arctica, pre-grown for 54 hr, were fixed every 2 hr for 10 hr and stained with both the membrane dye FM4-64FX and phalloidin. Arrows show sites of colocalization between both markers at the onset of plasma membrane invaginations. Bar, 50 µm.
Figure 2—figure supplement 1
Actin cytoskeleton, plasma membrane and cell-wall dynamics during cellularization of S. arctica.
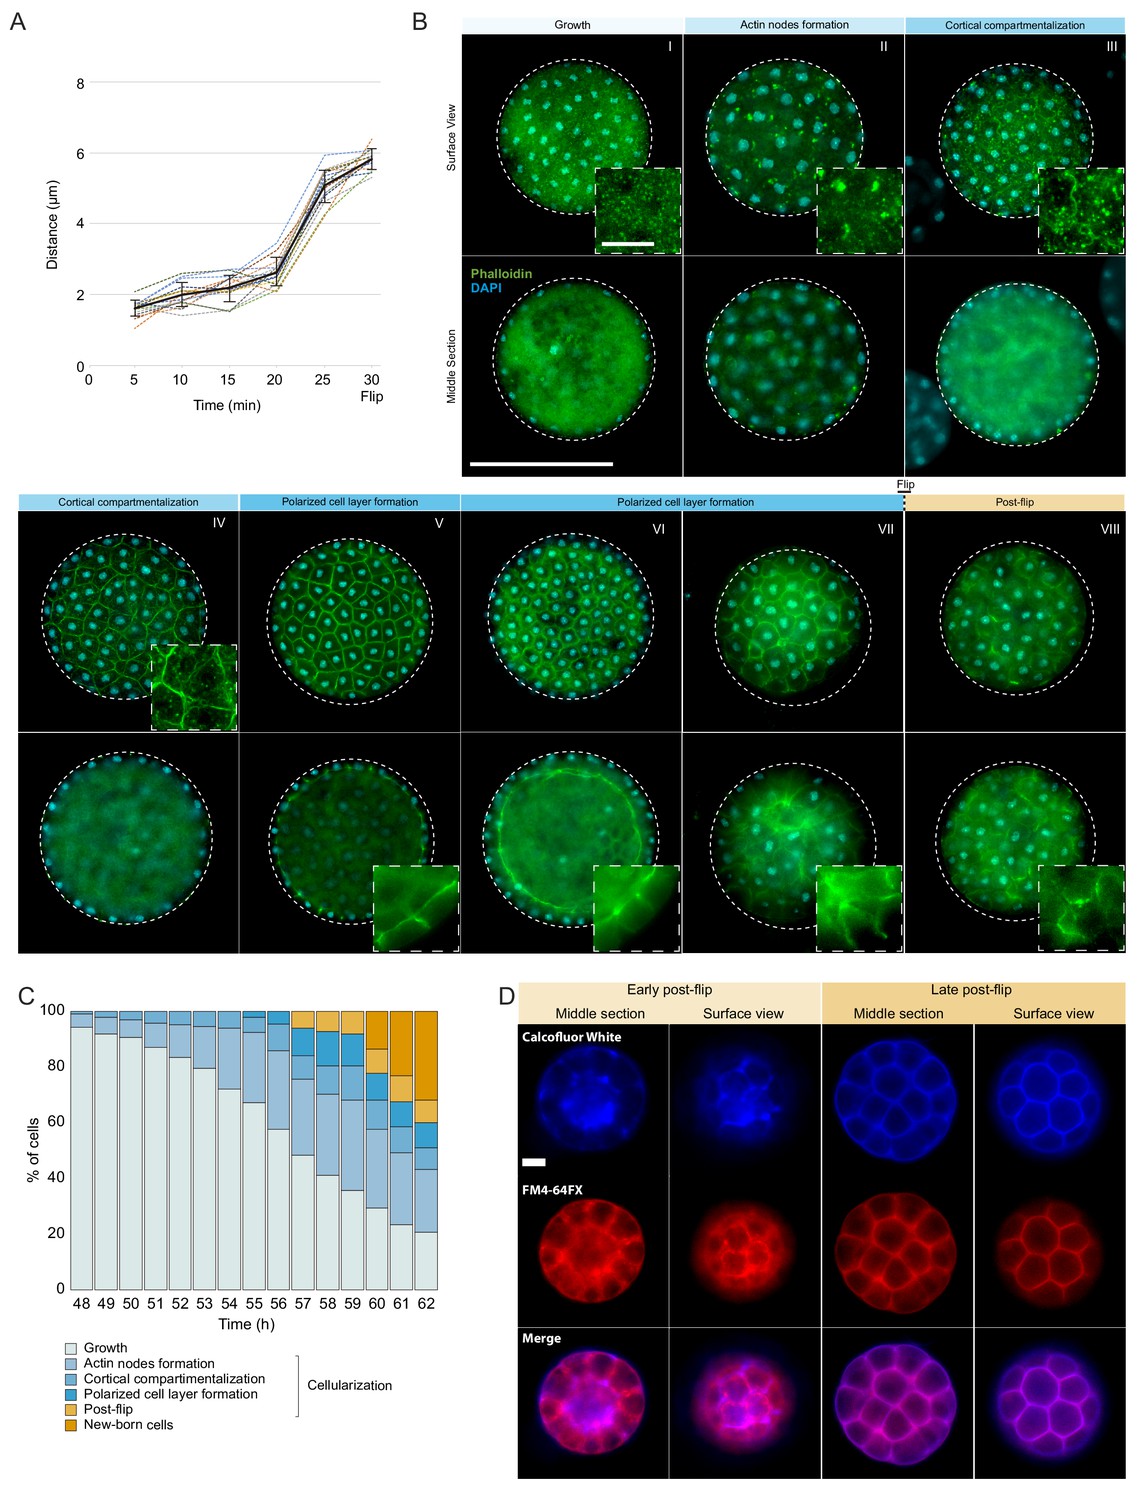
(A) Rate of membrane invagination during cellularization reveal the presence of an early slow phase followed by a fast one. Measurements were obtained from 15 FM4-64 stained independent coenocytes. For the measurements of each cell, a mean was obtained from three single invaginations. Traces from single cells are represented in dashed lines whereas the mean of all 15 cells is shown in black with its corresponding standard deviation. (B) Epifluorescence microscopy images of the cellularization process using phalloidin and DAPI. Arrows show the different actin structures during the different stages of cellularization. Bars, 50 µm for whole image and 10 µm for the zoom. (C) fraction of cells exhibiting different actin and cellular structures throughout cellularization. The temporal order of actin structures show that the stages occur sequentially. (N°cells = 300). (D) Cell wall formation is observed only post-flip. Cells were fixed and co-stained with the membrane dye FM4-64FX and the cell-wall dye calcofluor white and imaged using an epifluorescence microscope. Bar, 10 µm.
Figure 3 with 1 supplement
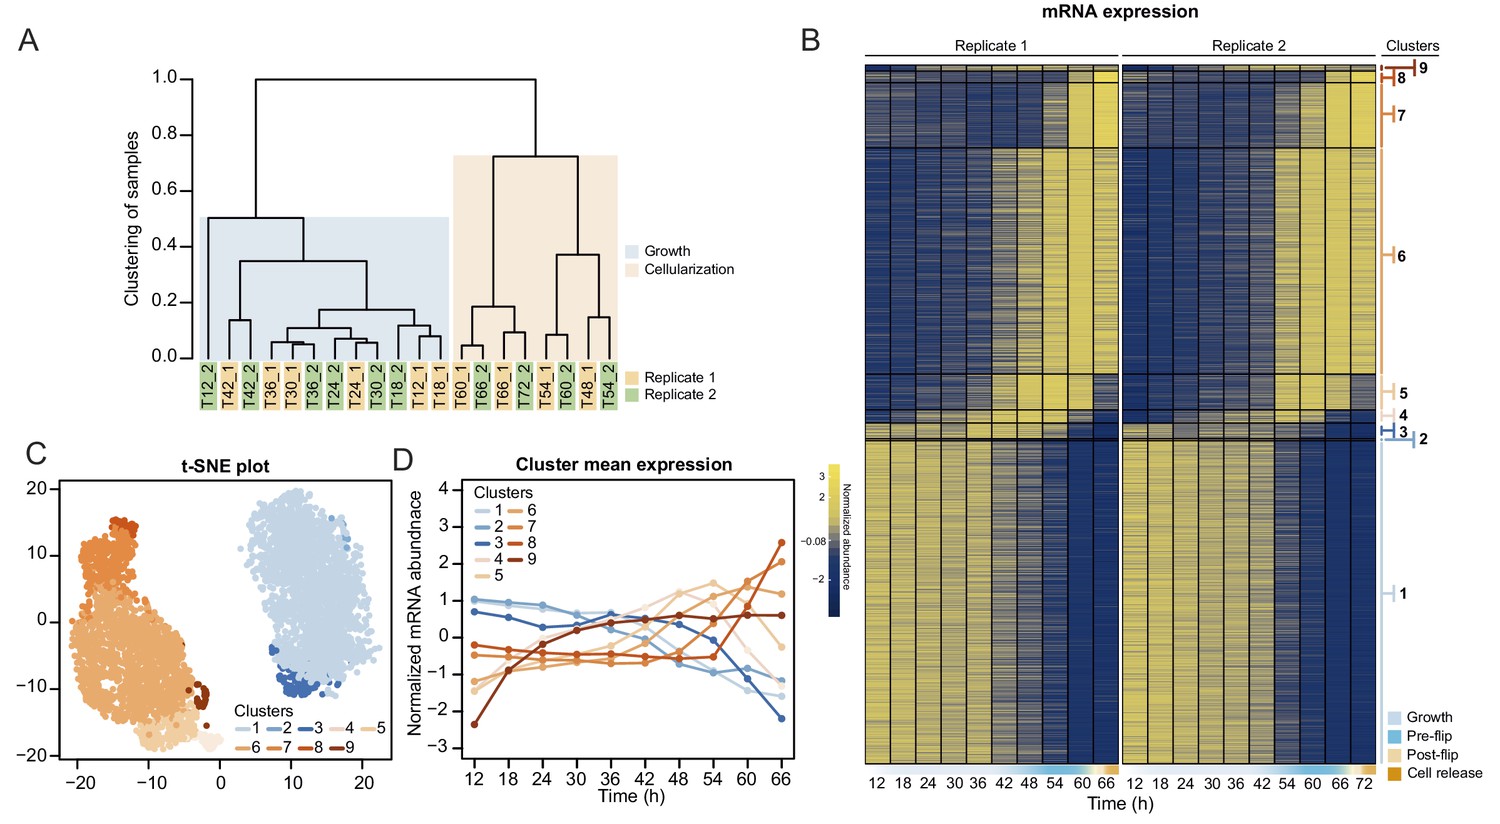
Transcriptional dynamics across the S. arctica life cycle.
(A) Hierarchical clustering of time point samples by Euclidian distance of spearman correlation coefficient. The sample T48_2 is missing due to technical reason. (B) A heatmap of 4441 coding genes that were clustered into nine clusters. (C) A t-SNE plot of clustered genes. (D) Mean expression profile of each gene expression cluster.
-
Figure 3—source data 1
Metrics of the Sphaeroforma arctica genome assemblies.
- https://cdn.elifesciences.org/articles/49801/elife-49801-fig3-data1-v4.pdf
-
Figure 3—source data 2
Transcript abundance (in tpm) of all the S. arctica transcripts.
- https://cdn.elifesciences.org/articles/49801/elife-49801-fig3-data2-v4.txt
-
Figure 3—source data 3
Normalized transcript abundance of the expressed S. arctica transcripts (mean tpm > 0.5).
- https://cdn.elifesciences.org/articles/49801/elife-49801-fig3-data3-v4.txt
-
Figure 3—source data 4
Table of transcripts per cluster membership.
- https://cdn.elifesciences.org/articles/49801/elife-49801-fig3-data4-v4.txt
Figure 3—figure supplement 1
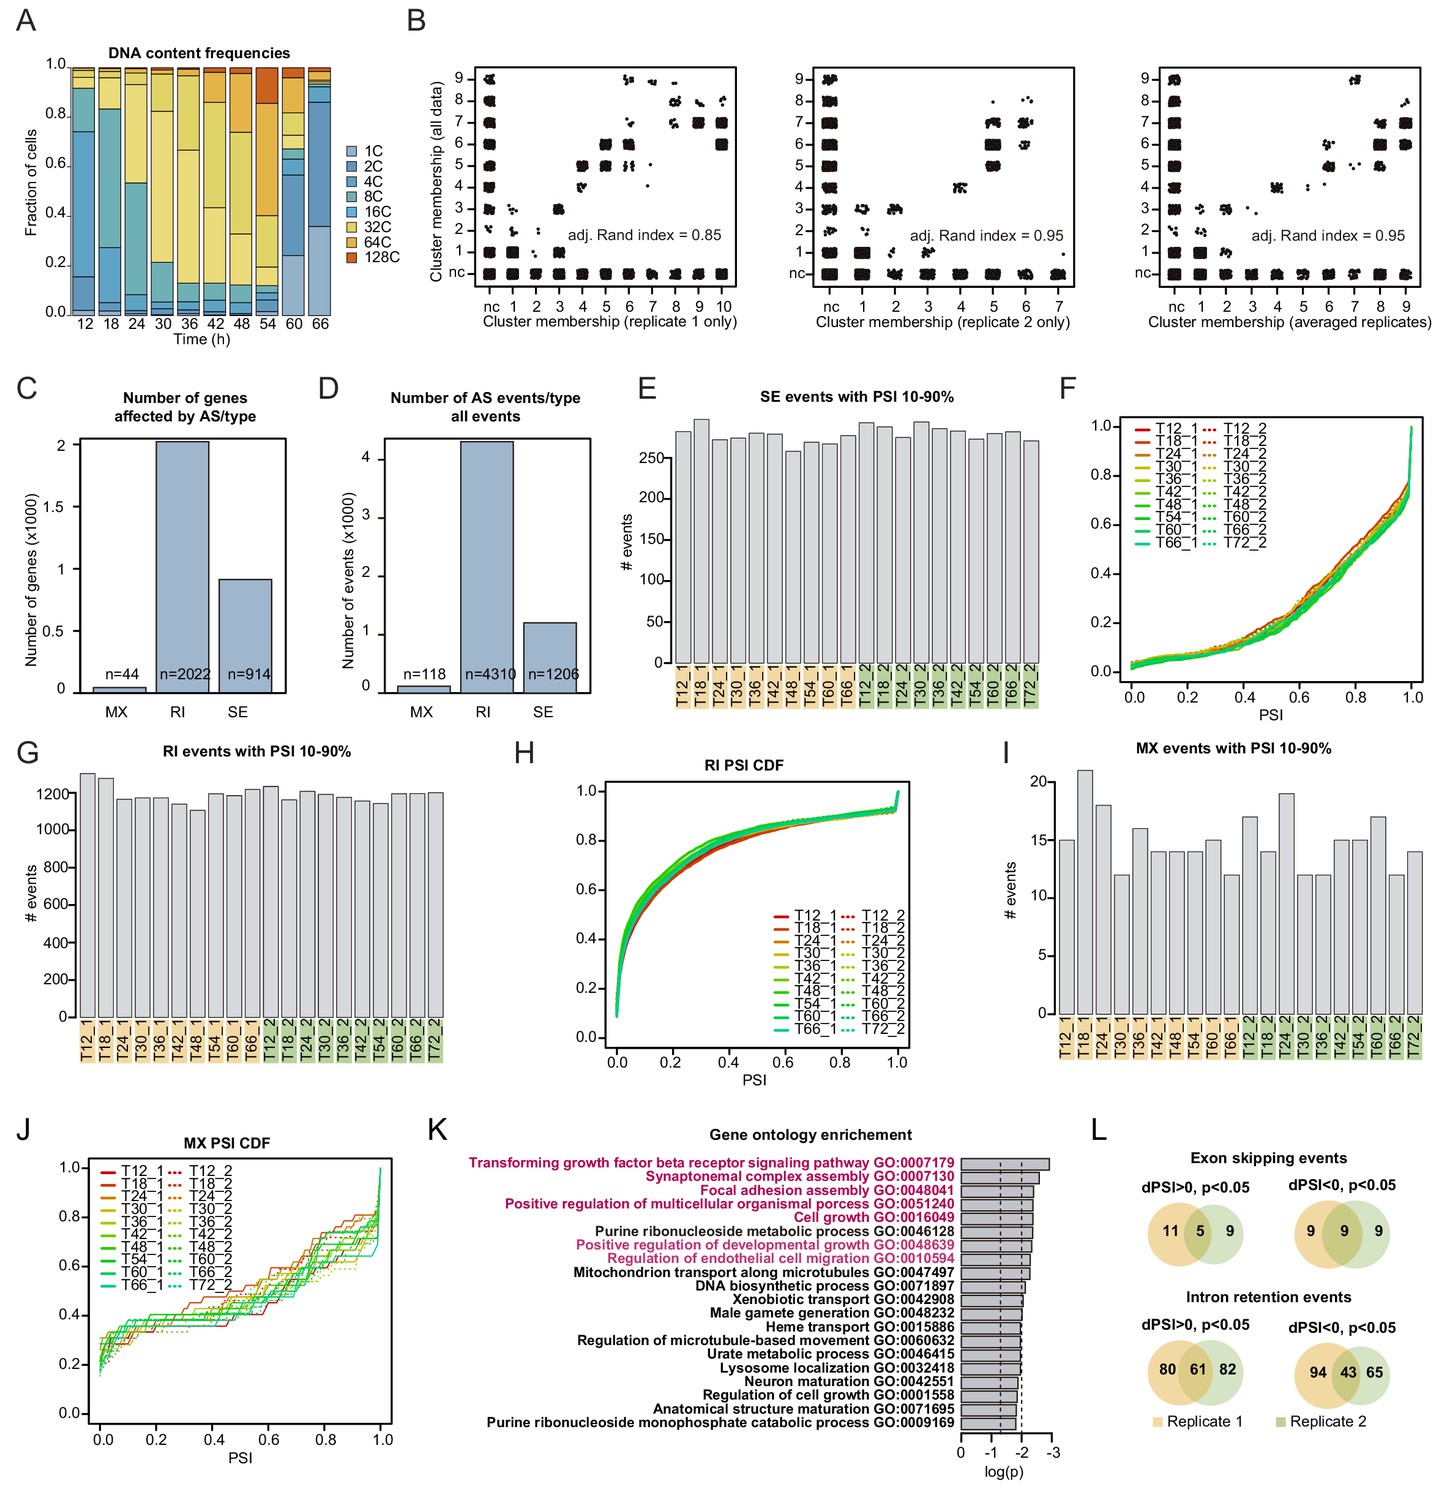
Nuclear content distribution, clustering and alternative splicing analysis.
(A) Distributions of nuclear content of S. arctica cells across the life cycle in the samples used for transcriptional profiling of a representative replicate, measured by flow cytometry. (B) Cluster membership comparison of transcripts clustering with the entire dataset with samples from either replicate only or averaged abundances of both replicates. The figures and calculated adjusted Rand index demonstrate that cluster memberships are robust. nc - not clustered (genes were not included in either gene expression cluster). (C) number of genes affected by the three types of alternative splicing. MX - mutually exclusive exons; RI - intron retention; SE - exon skipping. (D) number of alternative splicing events. Labels same as in (C). (E–J) Dynamics of alternative splicing across the S. arctica life cycle. Number of events per sample and cumulative distribution function (CDF) for exon skipping (SE), intron retention (RI) and mutually exclusive exons (MX). (K) Gene ontology enrichment of genes affected by alternative splicing, calculated by elim method using Bonferroni correction. (L) Venn diagram of alternative splicing events that differ significantly between the growth and cellularization stage. dPSI - differential percentage spliced-in.
Figure 4 with 2 supplements
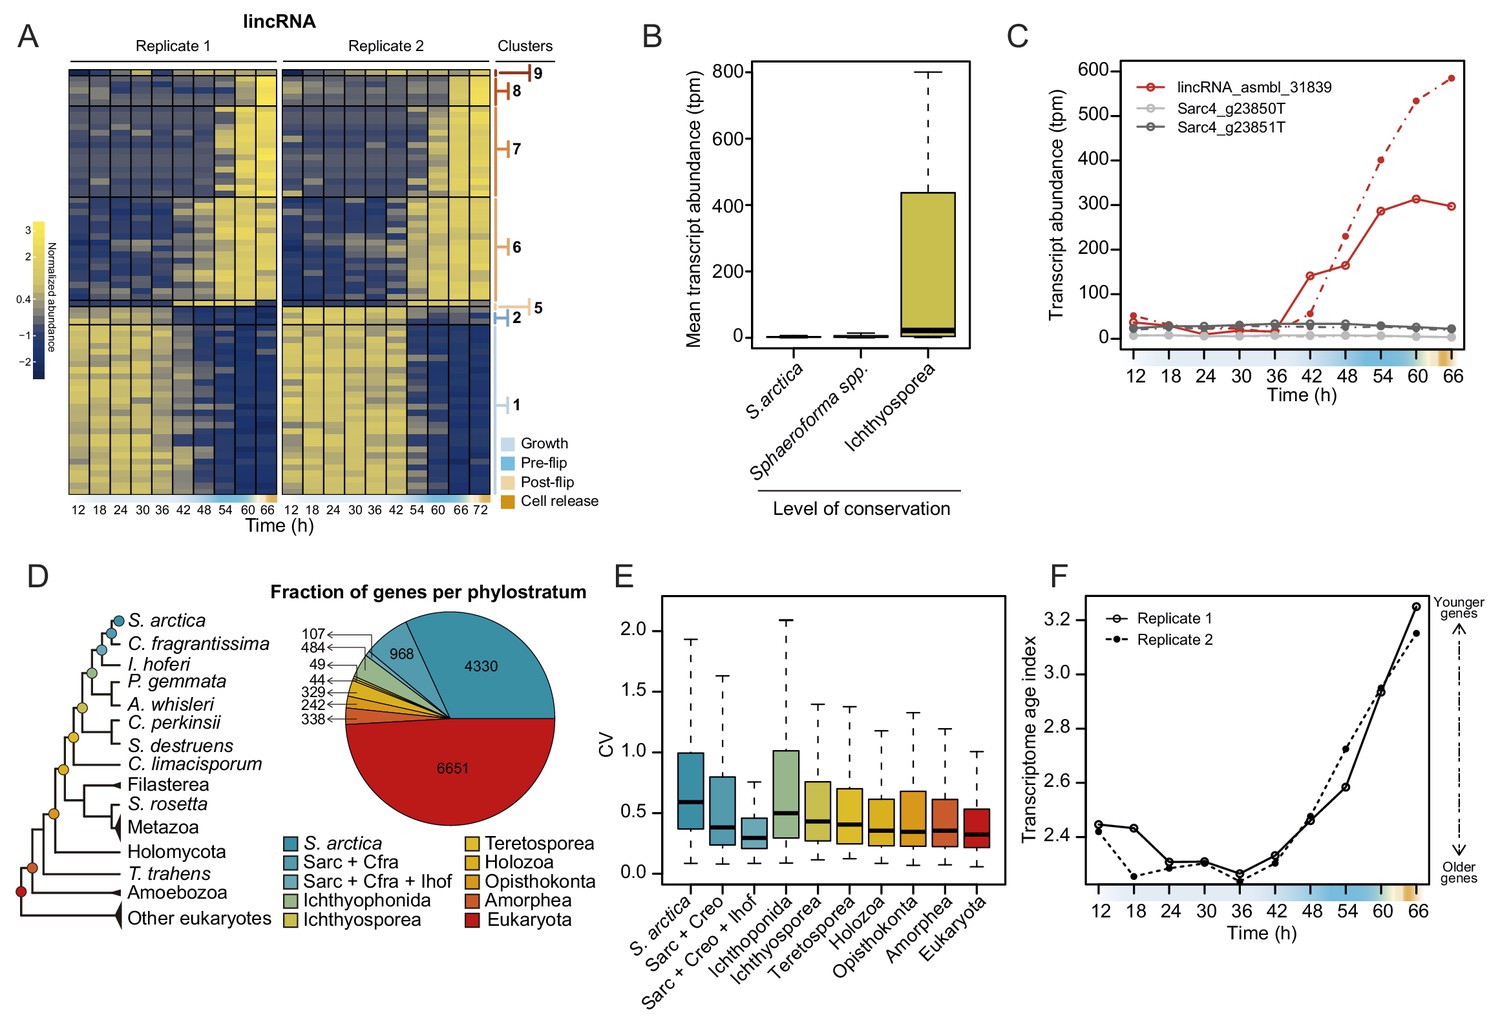
Dynamics of lincRNAs, alternative splicing, and gene phylostrata.
(A) A heatmap of 70 long intergenic non-coding RNAs (lincRNAs) that co-cluster with coding genes. (B) mean expression level of the lincRNAs, binned by degree of conservation. (C) Expression of the conserved lincRNA, lincRNA: asmbl_31839 and the two coding genes located immediately upstream and downstream of it. (D) A phylogenetic tree indicating the 10 defined phylostrata, and a pie chart of fractions of all expressed genes per phylostratum. (E) Coefficient of variance of gene expression across the S. arctica life cycle, binned by phylostratum. (F) Transcriptome age index (TAI) of gene expression for the S. arctica life cycle. Higher TAI represents a younger transcriptome.
-
Figure 4—source data 1
Table of Blast e-values of orthologs of S. arctica lincRNAs in other ichthyosporean species.
- https://cdn.elifesciences.org/articles/49801/elife-49801-fig4-data1-v4.txt
-
Figure 4—source data 2
List of transcriptomes used for lincRNA conservation analysis.
- https://cdn.elifesciences.org/articles/49801/elife-49801-fig4-data2-v4.pdf
-
Figure 4—source data 3
Table of gene orthogroups.
- https://cdn.elifesciences.org/articles/49801/elife-49801-fig4-data3-v4.csv
-
Figure 4—source data 4
List of transcriptomes used for generation of orthogroups and phylostratigraphy analysis.
- https://cdn.elifesciences.org/articles/49801/elife-49801-fig4-data4-v4.pdf
-
Figure 4—source data 5
Table of S. arctica transcripts per gene stratum and orthogroup membership.
Gene ages range from 1 (S. arctica-specific) to 10 (pan-eukaryotic). Only transcripts that were classified in an orthogroup are listed; the remainder of the transcripts were S. arctica-specific.
- https://cdn.elifesciences.org/articles/49801/elife-49801-fig4-data5-v4.csv
Figure 4—figure supplement 1
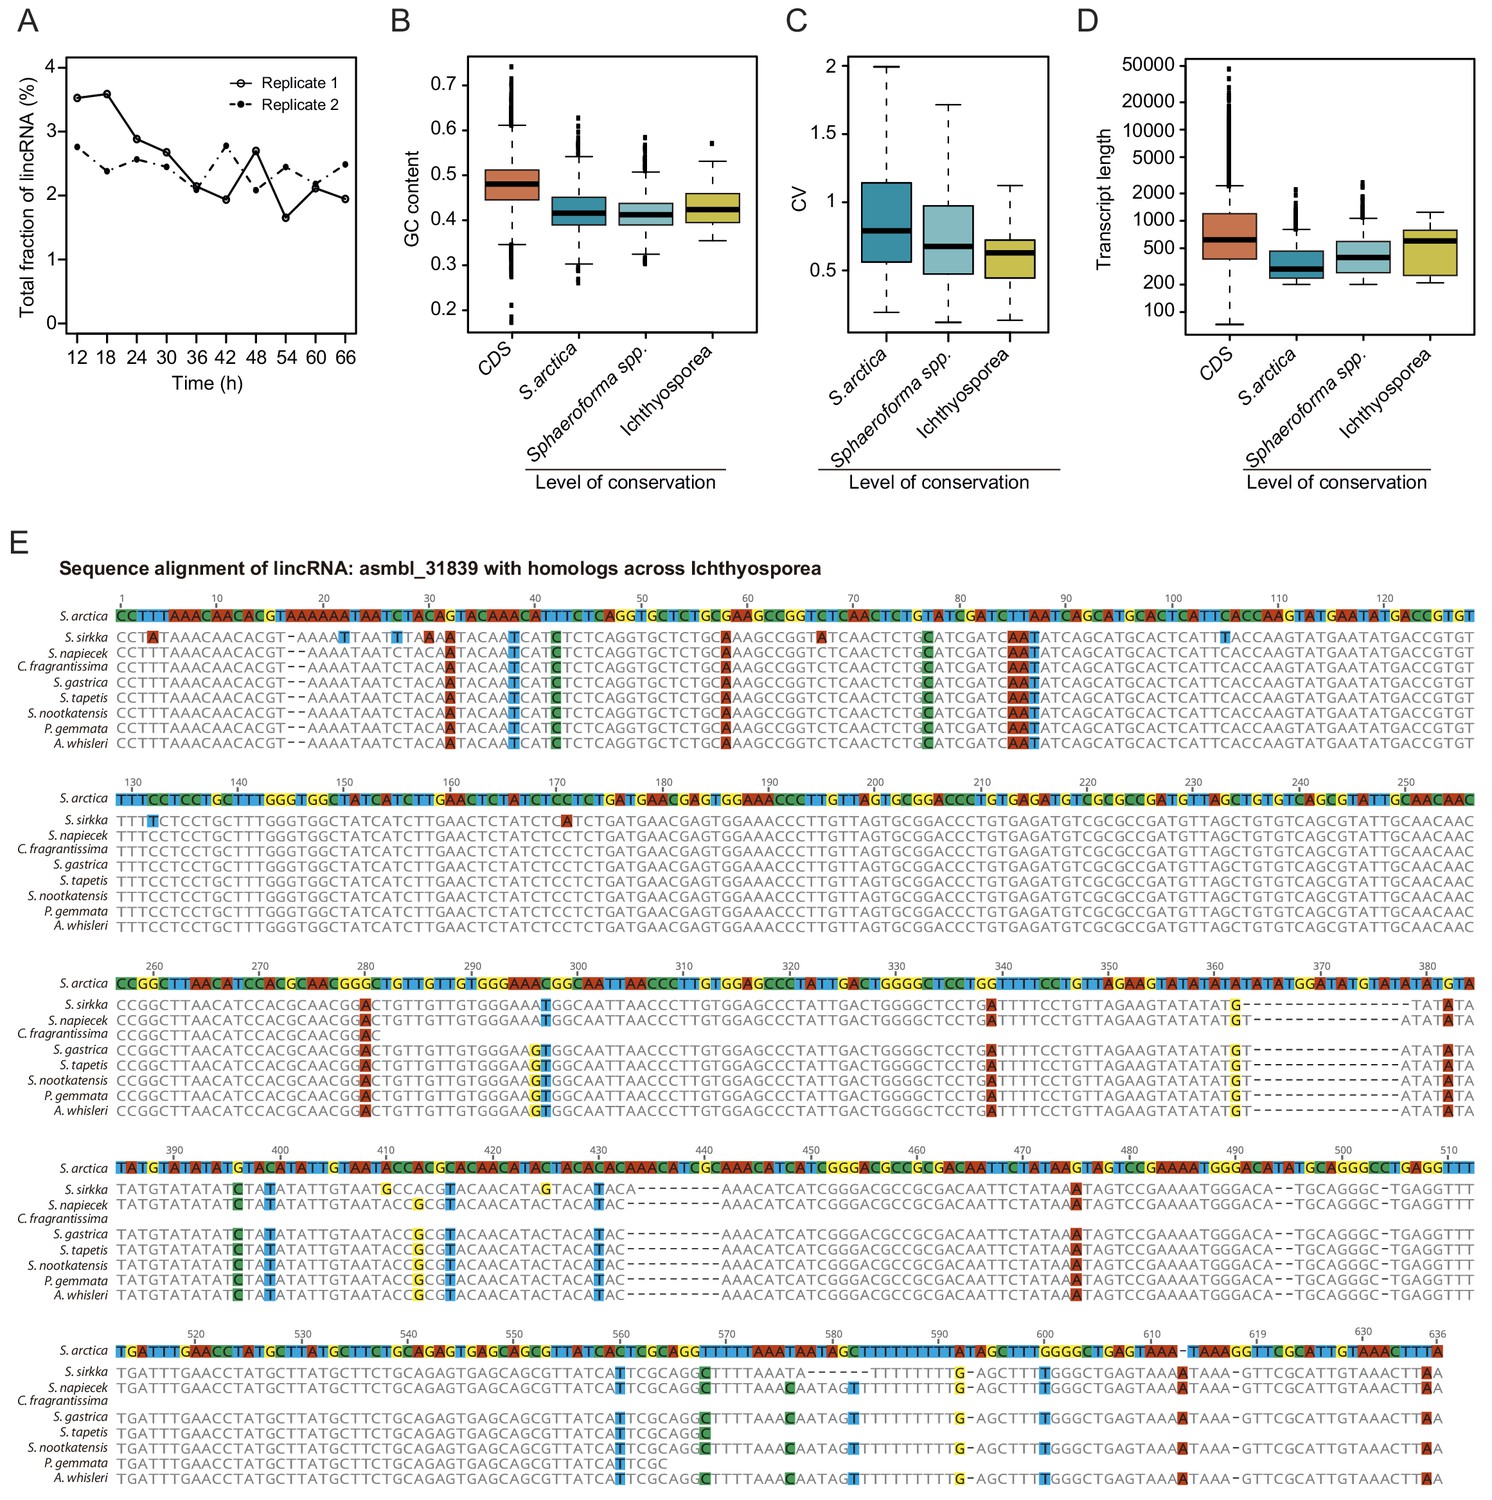
Long intergenic non-coding RNA (lincRNAs) conservation.
(A) Fraction of total abundance of long intergenic non-coding RNA transcripts (lincRNAs) among all transcripts. (B) Comparison of GC content of lincRNAs binned by degree of conservation with coding genes (CDS). (C) Coefficient of variation of expression across the S. arctica life cycle of lincRNAs binned by degree of conservation. (D) Transcript length of lincRNAs binned by degree of conservation and coding genes. (E) Sequence alignment of lincRNA: asmbl_31839 with homologs across ichthyosporea.
Figure 4—figure supplement 2
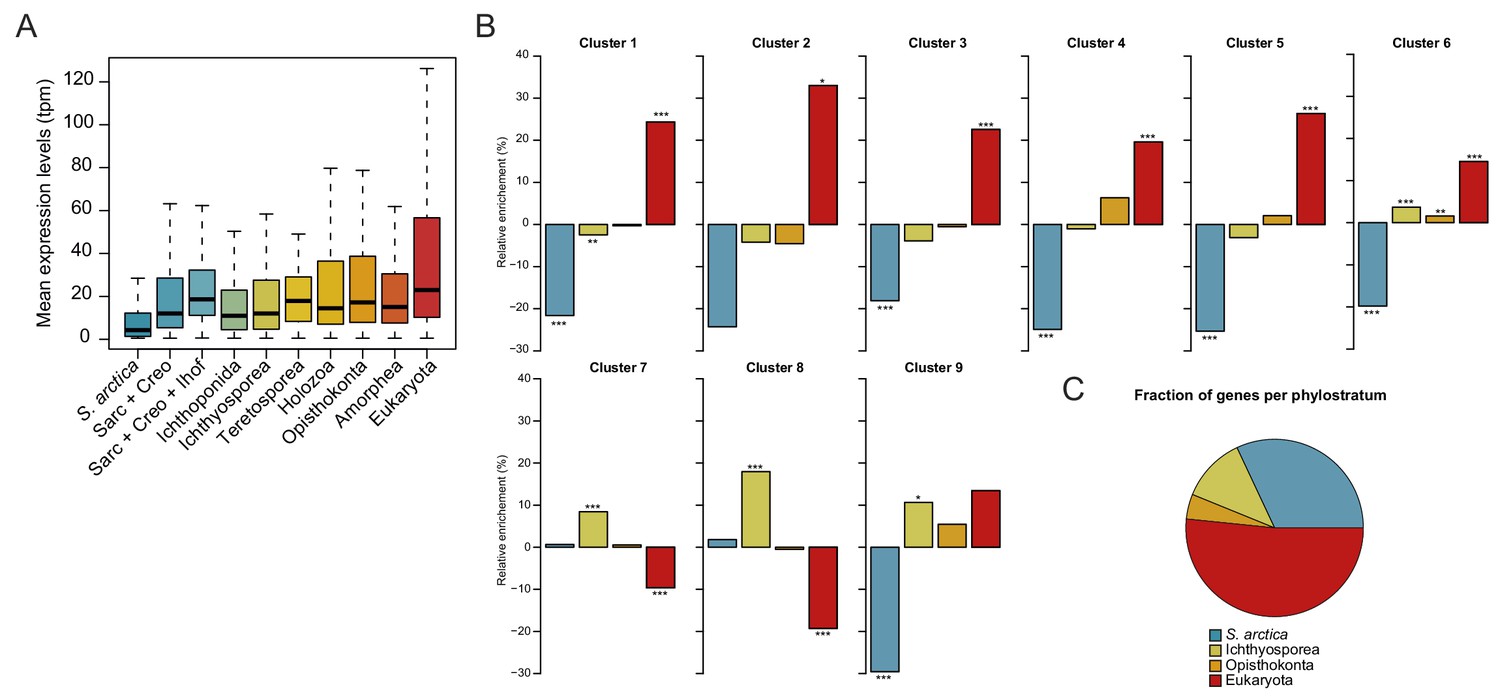
Gene expression by phylostrata analysis.
(A) Mean gene expression across the S. arctica life cycle, binned by phylostratum. (B) Relative enrichment of gene phylostrata in within gene expression clusters. Original 10 phylostrata were collapsed into 4. (* - p<0.05, ** - p<0.01, *** - p<0.001, Fisher exact test). (C) Fraction of genes per phylostratum used in (B).
Figure 5 with 1 supplement
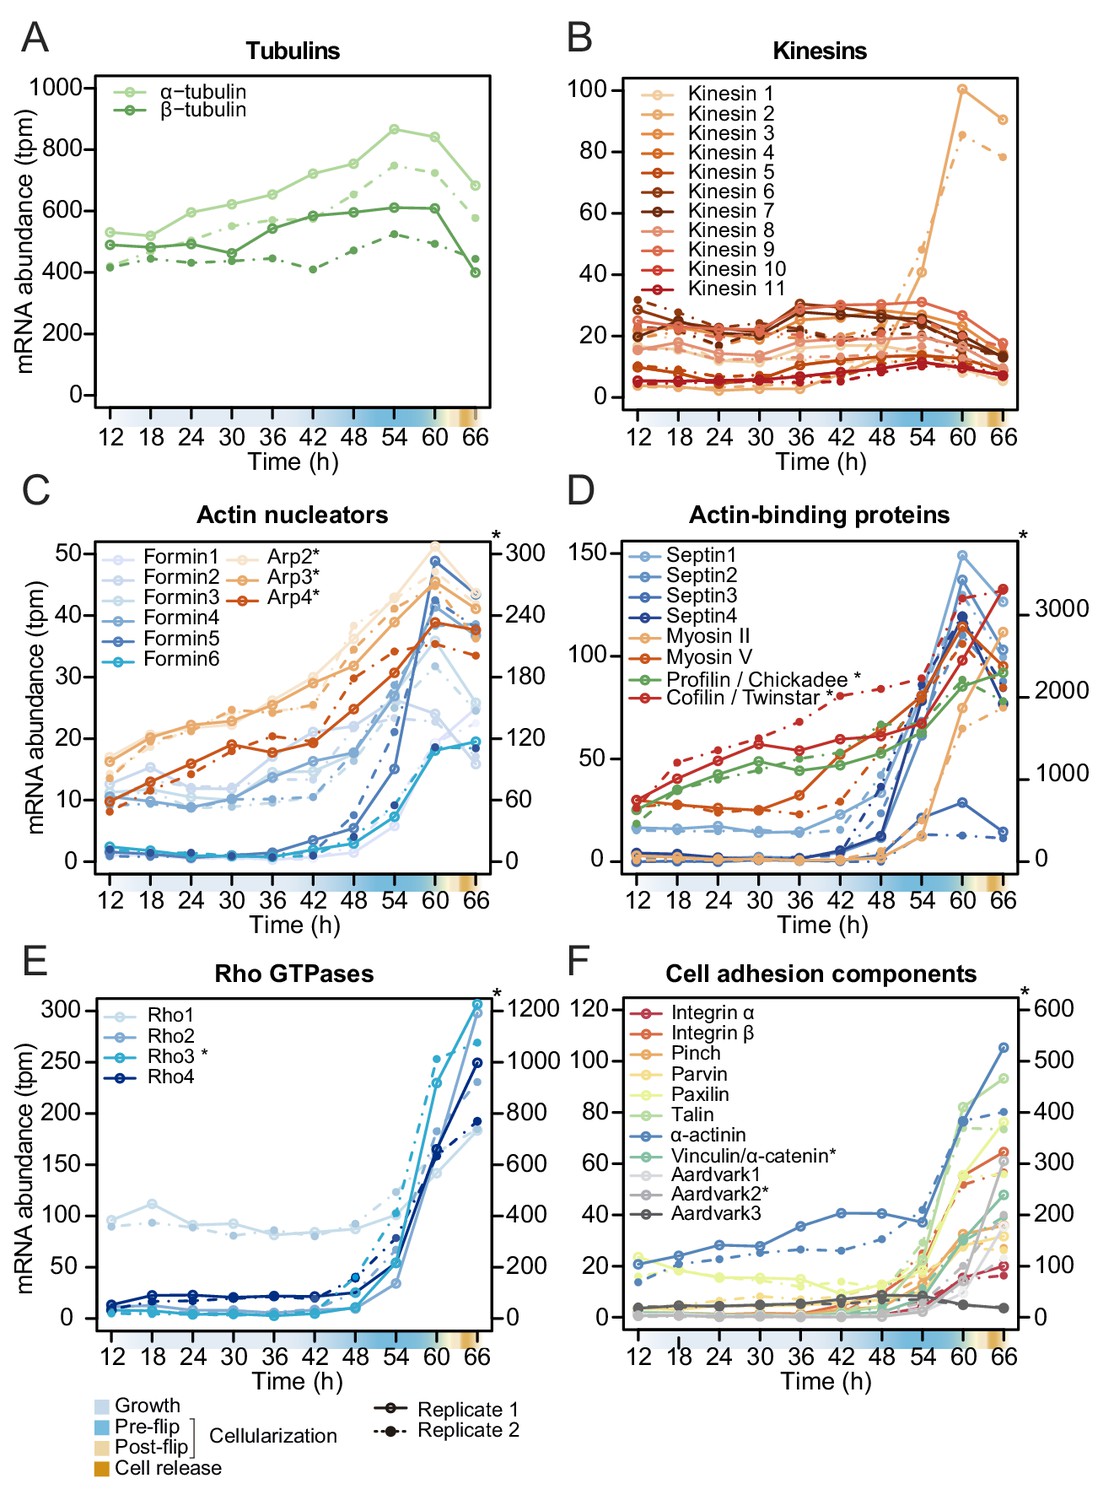
Temporal transcript abundance of cytoskeletal, cell polarity and cell adhesion genes.
(A–F) Gene expression of indicated genes across the S. arctica life cycle.
-
Figure 5—source data 1
Gene ontology (GO) enrichment analysis of gene expression clusters.
- https://cdn.elifesciences.org/articles/49801/elife-49801-fig5-data1-v4.pdf
-
Figure 5—source data 2
A table of reference gene names plotted in Figure 5.
- https://cdn.elifesciences.org/articles/49801/elife-49801-fig5-data2-v4.pdf
Figure 5—figure supplement 1
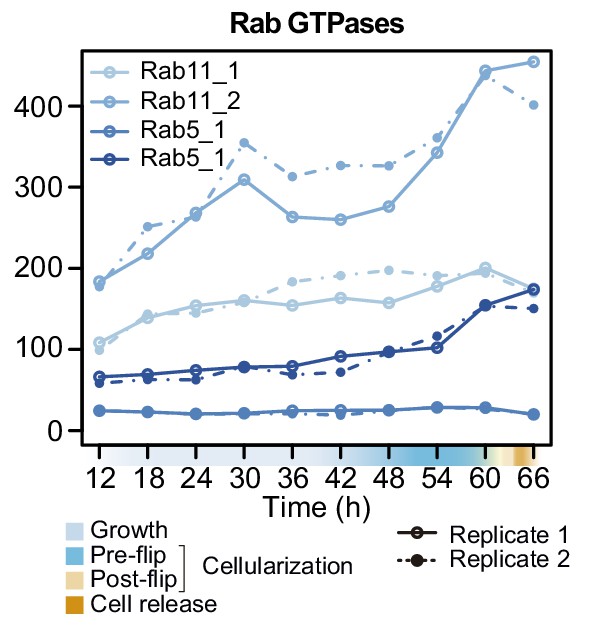
Gene expression of Rab5 and Rab8 homologs across the S. arctica life cycle.
Figure 6 with 1 supplement
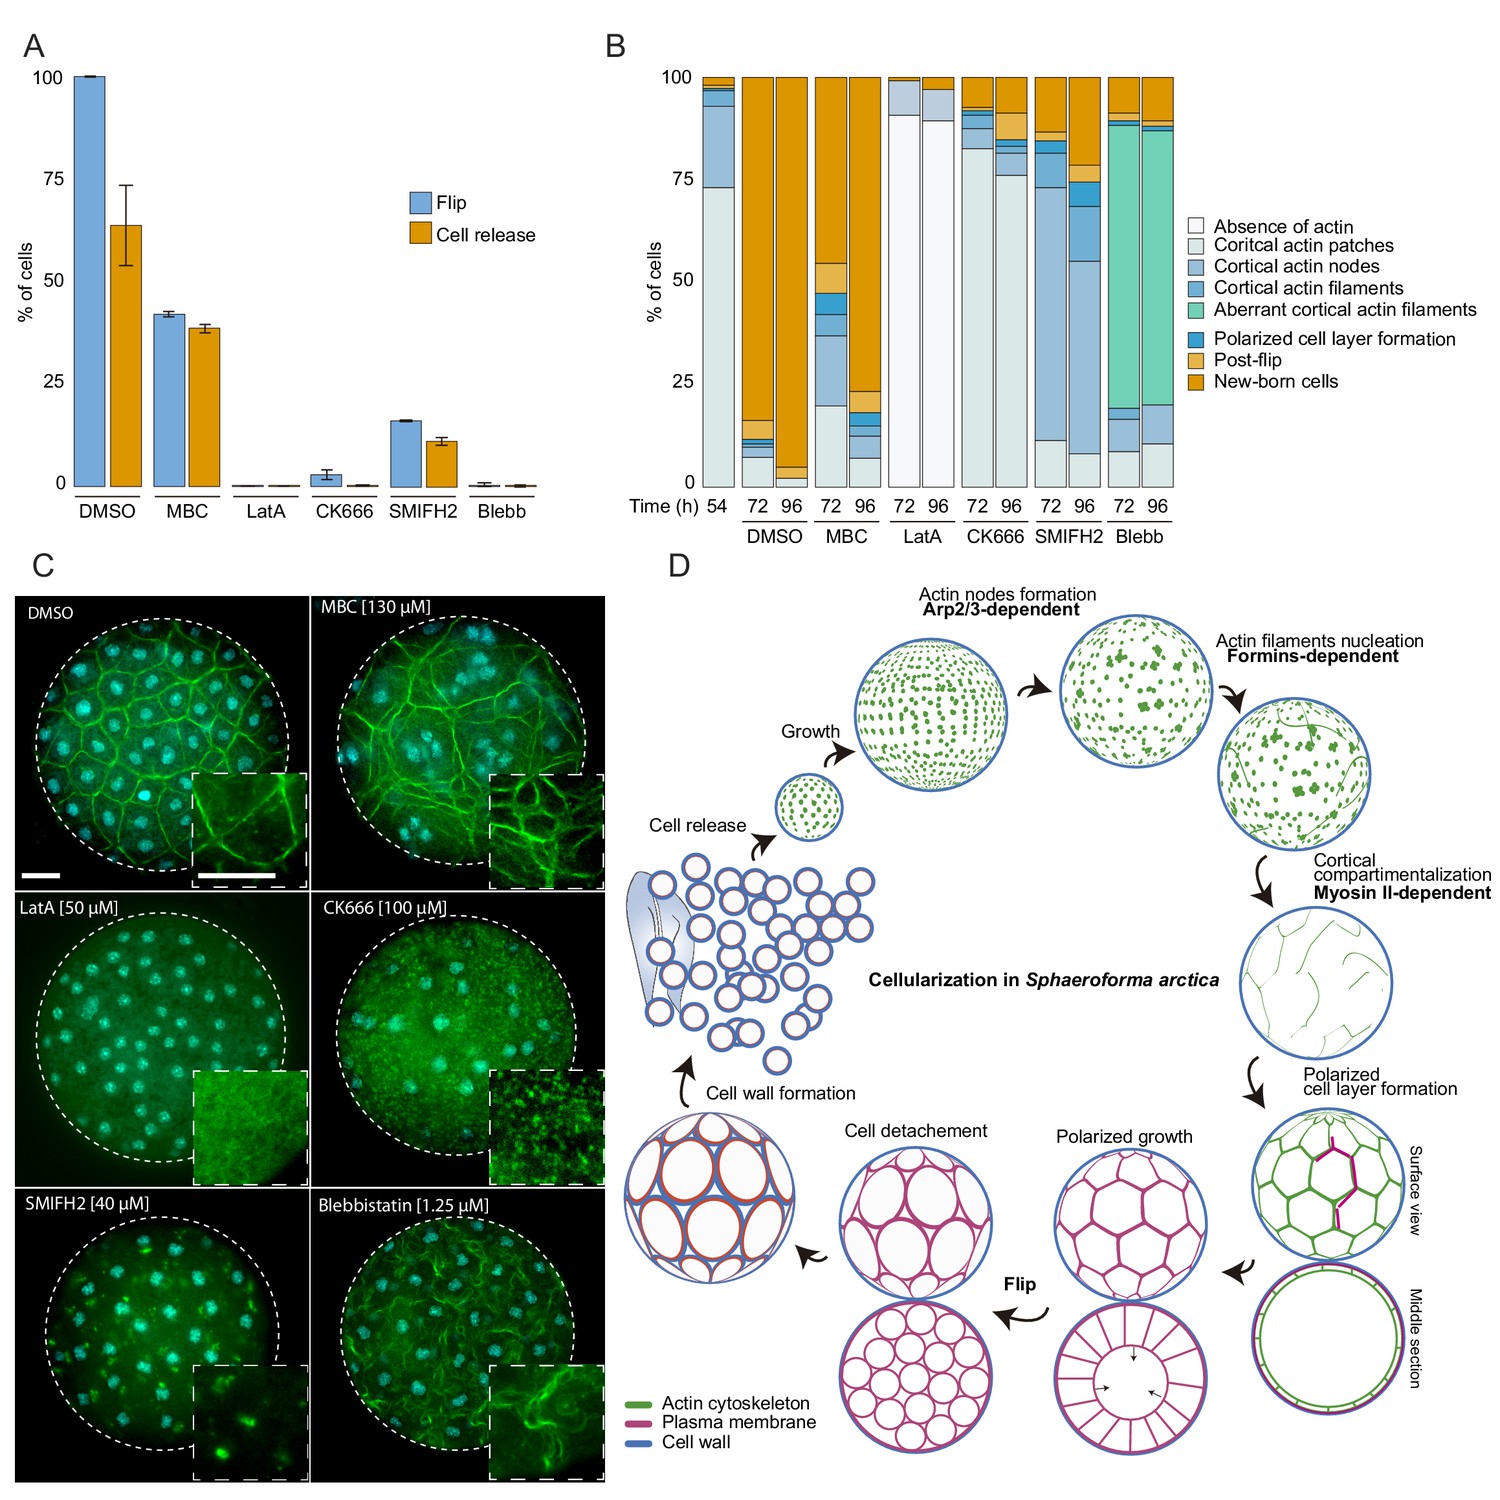
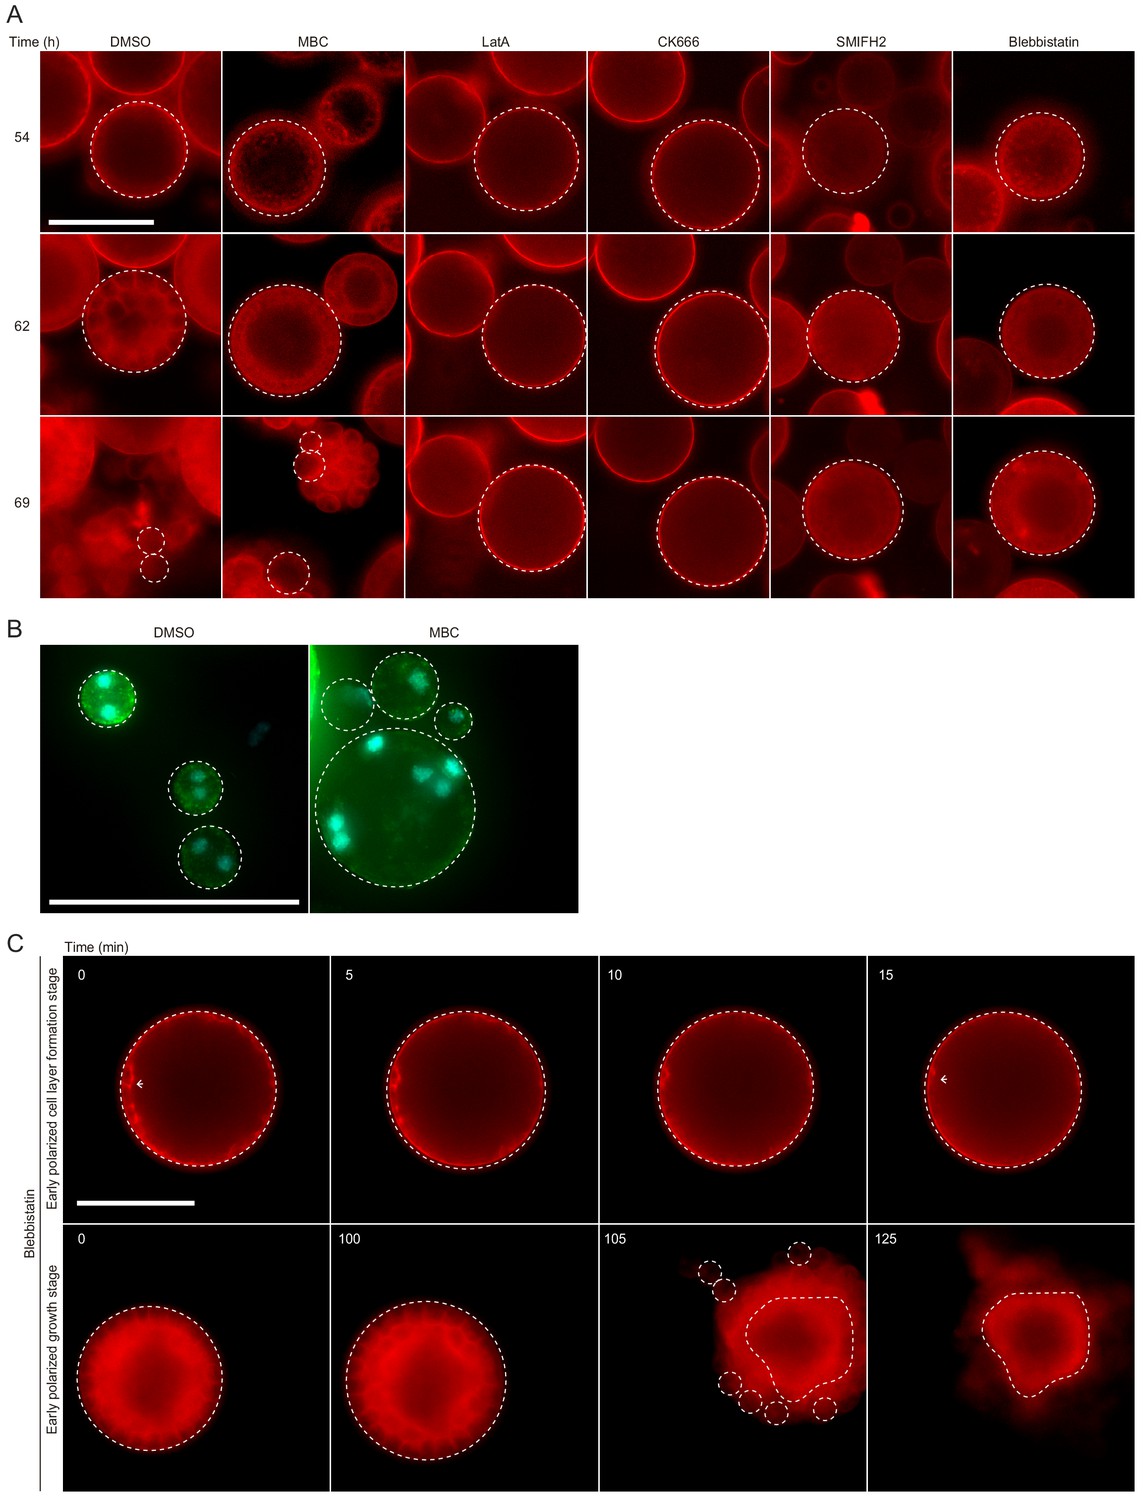
The actomyosin network organization is crucial for cellularization of S. arctica.
(A) Depolymerization of microtubules and actin, as well as inhibition of Arp2/3, formins and myosin II affect ‘flip’ and release of newborn cells. Synchronized cells of S. arctica, pre-grown for 54 hr, were imaged for 24 hr in presence of multiple pharmacological inhibitors (DMSO as a control, MBC, Latrunculin A, CK666, SMIFH2, Blebbistatin). Cells undergoing flip and cell release throughout the duration of the experiment were measured (N > 400 cells, Error bars are standard deviation from three independent experiments). (B) Temporal functions of the Arp2/3 complex, formins and myosin II in distinct stages of cellularization. Synchronized cells of S. arctica, pre-grown for 54 hr were subject to multiple pharmacological inhibitors treatments (DMSO as a control, MBC, Latrunculin A, CK666, SMIFH2, Blebbistatin) and fixed and stained with phalloidin and DAPI after 24 hr and 48 hr of treatments. Phalloidin staining allows us to measure the fraction of cells exhibiting different actin and cellular structures throughout cellularization. (C) The different actin structures observed when cells are treated with multiple pharmacological inhibitors treatments (DMSO as a control, MBC, Latrunculin A, CK666, SMIFH2, Blebbistatin). Bar, 10 µm. (D) A model representing the actin cytoskeleton, plasma membrane and cell wall at different stages of the cellularization process in S. arctica, indicating sequential steps of actin remodeling mediated by Arp2/3, formins and Myosin II.
Figure 6—figure supplement 1
Inhibition of the actin cytoskeleton blocks plasma membrane invaginations.
(A) Depolymerization of microtubules and actin, as well as inhibition of Arp2/3, formins and myosin II affect plasma membrane invaginations. Synchronized cells of S. arctica, pre-grown for 54 hr, were imaged for 24 hr in presence of multiple pharmacological inhibitors (DMSO as a control, MBC, Latrunculin A, CK666, SMIFH2, Blebbistatin). Note the different delay in cell release and the cell size variability of new born cells after treatment with MBC. Bar, 50 µm. (B) Depolymerization of microtubules generates new-born cells with uneven size and number of nuclei. Synchronized cells of S. arctica, pre-grown for 54 hr, were imaged after 24 hr in presence MBC or DMSO. Note the different sizes and uneven number of nuclei of MBC-treated new born cells. (C) Myosin II inhibition using blebbistatin affected plasma membrane invaginations and polarized growth. Synchronized cells of S. arctica, pre-grown for 62 hr, were live-imaged in presence of Blebbistatin and FM4-64. Note that plasma membrane invaginations retract in coenocytes treated with blebbistatin at the beginning of the polarized cell layer formation stage. Similarly, polarized growth does not carry on in coenocytes treated with blebbistatin at the onset of polarized growth stage, however we observe that cell release is maintained. Note that a central big cell is released along several small cells due to incomplete polarized growth and absence of ‘flip’. Bar, 50 µm.
Videos
Video 1
Time lapse of synchronized cells of S. arctica obtained with epifluorescent microscopy.
Time interval between frames is 20 min. The movie is played at 7fps. Four distinct cells can be seen undergoing a full life-cycle with the release of new born cells. Bar, 50 µm.
Video 2
Time lapse of synchronized cells of S. arctica obtained with epifluorescent microscopy.
Time interval between frames is 15 min. The movie is played at 7fps. Three cells can be seen undergoing flip prior to cell release whereas one cell undergo ‘flip’ without cell release during the course of the experiment. The exact timing of cell release is pointed out for each cell. Bar, 50 µm.
Video 3
Time lapse of synchronized cells of S. arctica stained with the plasma membrane dye FM4-64 and obtained with epifluorescent microscopy.
Time interval between frames is 5 min. The movie is played at 7fps. Plasma membrane invaginations can be seen occurring from the outside inwards for approximately 40 min prior to flip. Bar, 50 µm.
Video 4
Time lapse of plasma membrane dynamics during cellularization of S. arctica.
Video 5
Z-projection of the spatial organization of the polarized layer of cells during cellularization of S. arctica obtained with confocal microscopy.
The cell is stained with phalloidin and DAPI. The movie is played at 7fps. A polarized layer of cells can be seen. Bar, 10 µm.
Video 6
Time lapse of synchronized cells of S. arctica, pre-grown for 54 hr and treated with different pharmacological inhibitors.
Time interval between frames is 30 min. The movie is played at 7fps. Cellularization is affected when cells are treated with LatA, CK666, SMIFH2 and Blebbistatin. Bar, 10 µm.
Video 7
Time lapse of synchronized cells of S. arctica, pre-grown for 54 hr, stained with the plasma membrane dye FM4-64 and treated with different pharmacological inhibitors.
Time interval is 10 min. The movie is played at 7fps. Plasma membrane invaginations is prevented when cells are treated with LatA, CK666, SMIFH2 and Blebbistatin. Bar, 10 µm.
Video 8
Time lapse of synchronized cells of S. arctica, pre-grown for 62 hr, stained with the plasma membrane dye FM4-64 and treated with blebbistatin.
Time interval is 5 min. The movie is played at 7fps. Plasma membrane invaginations and polarized growth are affectd when cells are treated with Blebbistatin. Bar, 10 µm.
Tables
Key resources table
| Reagent type (species) or resource | Designation | Source or reference | Identifiers | Additional information |
|---|---|---|---|---|
| Commercial assay or kit | miRNeasy Mini Kit | QIAGEN | Cat. #: 217004 | |
| Commercial assay or kit | RNeasy Mini Kit | QIAGEN | Cat. #: 74104 | |
| Commercial assay or kit | QIAamp DNA Blood Midi Kit | QIAGEN | Cat. #: 51183 | |
| Chemical compound, drug | FM4-64 | Invitrogen | Cat. #: T3166 | |
| Chemical compound, drug | FM4-64FX | Invitrogen | Cat. #: F34653 | |
| Chemical compound, drug | Latrunculin A | Sigma-Aldrich | Cat. #: L5163 | |
| Chemical compound, drug | CK666 | Sigma-Aldrich | Cat. #: SML0006 | |
| Chemical compound, drug | SMIFH2 | Sigma-Aldrich | Cat. #: S4826 | |
| Chemical compound, drug | Blebbistatin | Sigma-Aldrich | Cat. #: B0560 | |
| Chemical compound, drug | Carbendazim (MBC) | Sigma-Aldrich | Cat. #: 378674 | |
| Software | ImageJ (http://imagej.nih.gov/ij/) | PMID: 29187165 | ||
| Software | FALCON_unzip assembler | v0.4.0 | ||
| Software, algorithm | SMRT analysis | v2.3.0 | ||
| Software, algorithm | BWA mem | v0.7.12 | ||
| Software, algorithm | Pilon | PMID: 25409509 | v1.22 | |
| Software, algorithm | BRAKER2 (https://github.com/Gaius-Augustus/BRAKER) | PMID: 26559507 | ||
| Software, algorithm | STAR 2.7 | PMID: 23104886 | ||
| Software, algorithm | Augustus 3.2.2 | PMID: 21216780 | ||
| Software, algorithm | Genemark v4.21 | PMID: 16314312 | ||
| Software, algorithm | Trimgalorehttps://github.com/FelixKrueger/TrimGalore | v0.4.5 | ||
| Software, algorithm | Trimmomatic | PMID: 24695404 | v0.35 | |
| Software, algorithm | Trinity | PMID: 21572440 | v2.5.1 | |
| Software, algorithm | Hisat2 | PMID: 25751142 | v2.1.0 | |
| Software, algorithm | PASA pipeline | PMID: 14500829 | v2.3.1 | |
| Software, algorithm | Kallisto software | PMID: 27043002 | ||
| Software, algorithm | Clust software | PMID: 30359297 | ||
| Software, algorithm | eggNOG mapper | PMID: 28460117 | ||
| Software, algorithm | Spades | PMID: 24093227 | v3.10.0 | |
| Software, algorithm | Count software | PMID: 20551134 |
Additional files
Download links
A two-part list of links to download the article, or parts of the article, in various formats.
Downloads (link to download the article as PDF)
Open citations (links to open the citations from this article in various online reference manager services)
Cite this article (links to download the citations from this article in formats compatible with various reference manager tools)
A unicellular relative of animals generates a layer of polarized cells by actomyosin-dependent cellularization
eLife 8:e49801.
https://doi.org/10.7554/eLife.49801


